investment performance, importance of cash levels, and
TRANSCRIPT
Investment Performance, Importance of Cash Levels, and
Descriptive Company Statistics for U.S. Buybacks
Alfred Kerstis1
921013-1836
Abstract
An investment strategy based on buying U.S. stocks announcing share repurchase pro-
grammes over the period 1999 to 2014 suggest a minor long-run positive drift, with differing
significance levels dependent on the test model. In descriptive terms, buyback activity is
pro-cyclical and buyback companies are overrepresented among large-cap stocks that are
less CapEx intensive and hold higher levels of cash on their announcement date. In contrast
to the notion that insiders buy back stock based on market undervaluation, I contend the
majority of buybacks are a flexible and innocuous means of deploying excess cash. Although
buybacks can be interpreted as conservative, they express insider confidence in share prices
and outlook on cash flows. However, I advise the investor to avoid exceptionally cash-rich
stocks. These firms are more likely to choose buybacks simply to act on a build-up in cash,
a rather mundane capital allocation decision considering its alternative use.
Programme: Graduate School - Master of Science in Finance
Supervisor: Conny Overland
Keywords: Buybacks, buy-and-hold returns, excess cash
2018–05–24
Acknowledgements: I would like to thank my supervisor Conny Overland for his time and com-
mitment during the spring semester. Most helpful was the professor 's ability to take a different point
of view and challenge my reasoning. I would also like to thank my classmates for their motivational
presence in the finance lab. Spirit cannot be understated during the countless hours locked inside
a windowless room. Finally, I would like to thank my family for their loving support and guidance
during my many years as a student.
1Contact info: [email protected], +46 76 8093232

CONTENTS CONTENTS
Contents
1 Introduction 3
1.1 Dividends versus buybacks . . . . . . . . . . . . . . . . . . . . . . . . . . . . 3
2 Theory 5
2.1 Traits of undervaluation . . . . . . . . . . . . . . . . . . . . . . . . . . . . . 7
3 Literature Review 8
3.1 The undervaluation hypothesis . . . . . . . . . . . . . . . . . . . . . . . . . 8
3.2 Alternative studies . . . . . . . . . . . . . . . . . . . . . . . . . . . . . . . . 9
4 Data & Methodology 10
4.1 Data . . . . . . . . . . . . . . . . . . . . . . . . . . . . . . . . . . . . . . . . 10
4.1.1 Sources . . . . . . . . . . . . . . . . . . . . . . . . . . . . . . . . . . 11
4.1.2 Issues . . . . . . . . . . . . . . . . . . . . . . . . . . . . . . . . . . . 11
4.2 Method . . . . . . . . . . . . . . . . . . . . . . . . . . . . . . . . . . . . . . 11
4.2.1 Method for individual securities . . . . . . . . . . . . . . . . . . . . . 13
4.2.2 Additional parameters . . . . . . . . . . . . . . . . . . . . . . . . . . 13
5 Results 14
5.1 Investment performance . . . . . . . . . . . . . . . . . . . . . . . . . . . . . 14
5.2 Descriptive analysis . . . . . . . . . . . . . . . . . . . . . . . . . . . . . . . 15
5.3 Significance testing . . . . . . . . . . . . . . . . . . . . . . . . . . . . . . . . 19
5.3.1 Bootstrap approach . . . . . . . . . . . . . . . . . . . . . . . . . . . 21
5.3.2 Fama and French three-factor model . . . . . . . . . . . . . . . . . . 23
5.4 Potential criticism . . . . . . . . . . . . . . . . . . . . . . . . . . . . . . . . 24
6 Conclusions 25
A Supporting tables 28
1

LIST OF FIGURES LIST OF TABLES
List of Figures
1 S&P 500 Non-financial firms % of cash flows from operations (median firm
for item and year) . . . . . . . . . . . . . . . . . . . . . . . . . . . . . . . . 4
2 Share-repurchase announcements vs. the S&P 500 . . . . . . . . . . . . . . 5
3 Abnormal changes in cash among buyback firms . . . . . . . . . . . . . . . 17
4 Development of CapEx as % of sales, period Dec 1996-Dec 2017 Buyback
firms tend to draw down on CapEx after a repurchase announcement . . . . 19
5 Bootstrap distribution: 500 pseudo-portfolios Compounded three-year abnor-
mal returns, all announcements . . . . . . . . . . . . . . . . . . . . . . . . . 22
List of Tables
1 Distribution of repurchase announcements by Size and P/B quantiles . . . . 16
2 Distribution of announcements - combining Size and P/B quantiles The first
& second integer represents size & P/B, respectively (1=small/low, 5=high/large) 16
3 Linear regressions for share repurchase announcements 3-year compounded
abnormal returns . . . . . . . . . . . . . . . . . . . . . . . . . . . . . . . . . 20
4 Descriptive statistics for bootstrap methods, all announcements . . . . . . . 22
5 Regression results from adjusted Fama-French three-factor model Monthly
returns January 2000 - December 2015 . . . . . . . . . . . . . . . . . . . . . 24
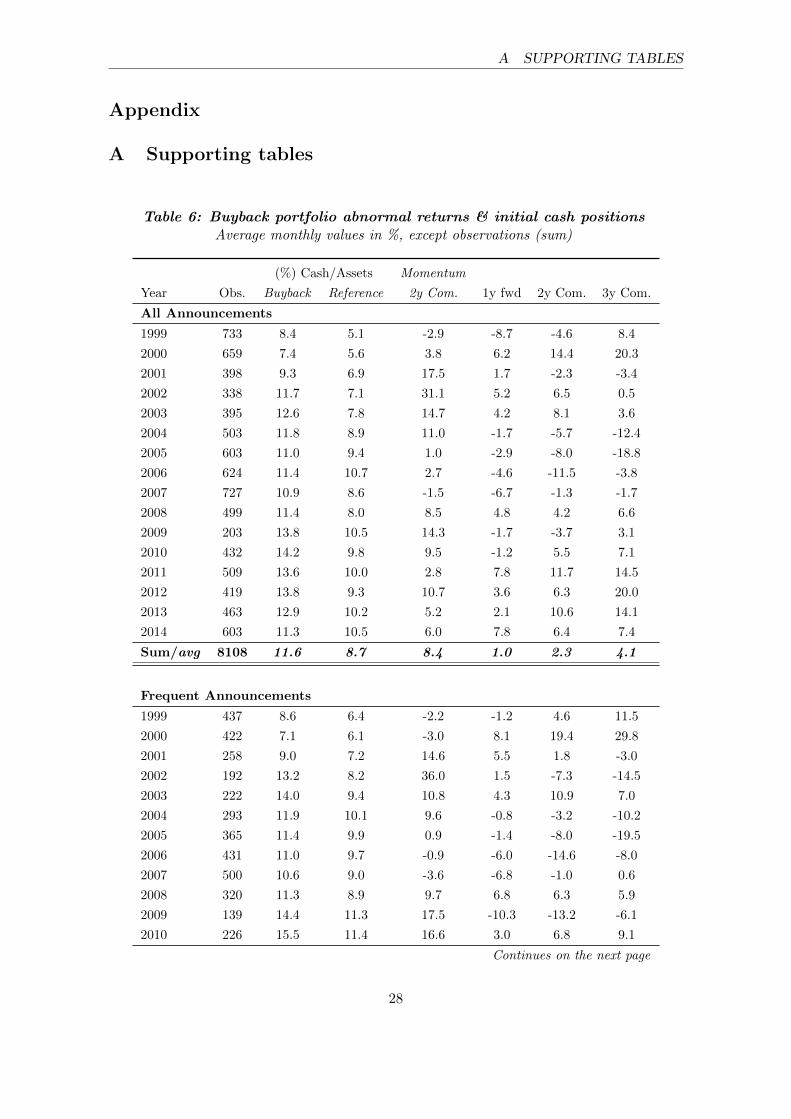
6 Buyback portfolio abnormal returns & initial cash positions Average monthly
values in %, except observations (sum) . . . . . . . . . . . . . . . . . . . . . 28
2
1 INTRODUCTION
1 Introduction
Open-market share repurchase programmes, or “buybacks” in laymen terms (will be used
interchangeably throughout the thesis), refer to publicly listed companies buying back their
own common stock at the current market price. In the United States (U.S.), buybacks are
common practice today but they were rather uncommon before the 1980s. As they grew
in popularity the academic world started to study them and found a positive abnormal
price drift following repurchase announcements for several years, a clear contradiction to
the efficient market hypothesis (EMH). The most cited articles attribute the price drift to
insiders' ability to correctly identify their stock as undervalued. As an investor, I often
come across companies buying back stock but I never consider undervaluation to be the
motive of management. The earlier and heavily cited articles are becoming outdated as
their security sample are from the 80s and early 90s. In this paper I study U.S. repurchase
announcements in the 21st century to see if the price drift is still present. I hypothesize
that the drift is no longer significant because buybacks have become considerably more
common and they are motivated by other reasons, effectively dwarfing firms motivated by
undervaluation. In theory the market should have corrected the inefficiencies laid out by
the academic community.
I also examine additional company characteristics and economic conditions that help to
explain abnormal returns and motivation for buying back stock. For example, I hypothesize
that a build-up in cash is a motive for buybacks. On the basis of my findings, investors can
better assess a share repurchase announcement made by a specific company in contrasting
economic conditions.
1.1 Dividends versus buybacks
For portfolio managers and private investors common stocks continue to be a main in-
gredient and cornerstone to an investment portfolio. There exist an abundant number of
stock-picking strategies, and one that continues to have a substantial following is screening
for stocks with consistent and growing dividends. Investors may favor such a feature since
dividends contribute as a source of income and they signal company stability. Cash divi-
dends are typically a fixed percentage of a company's earnings distributed to shareholders
at predetermined dates set by the company's board of directors.
Buybacks are a second method of disbursing cash and simultaneously rewarding de-
voted shareholders. Buybacks grew exponentially after an SEC rule-change2 in 1982 that
simplified and encouraged open-market share repurchase programmes. In comparison to
2SEC Rule 10b-18 protects share repurchase programmes from the anti-manipulative provisions of theSecurities and Exchange Act of 1934, Grullon & Michaely (2002). Buybacks would likely have become evenmore popular had not the U.S. government increased the capital gains tax rate in 1986 to partially eliminatethe discrepancy between capital gains taxes and dividend income taxes.
3
1.1 Dividends versus buybacks 1 INTRODUCTION
dividends, buybacks are more flexible and come with little punitive costs should they be
discontinued. This stands in stark contrast to dividend-cuts that are known to be a big red
flag in the investment community. In addition, buybacks may be preferred to the investor
since capital gains taxes can always be deferred by not selling any shares, whereas dividends
are taxed upon receipt. And by not selling any shares, the investor owns a larger share of
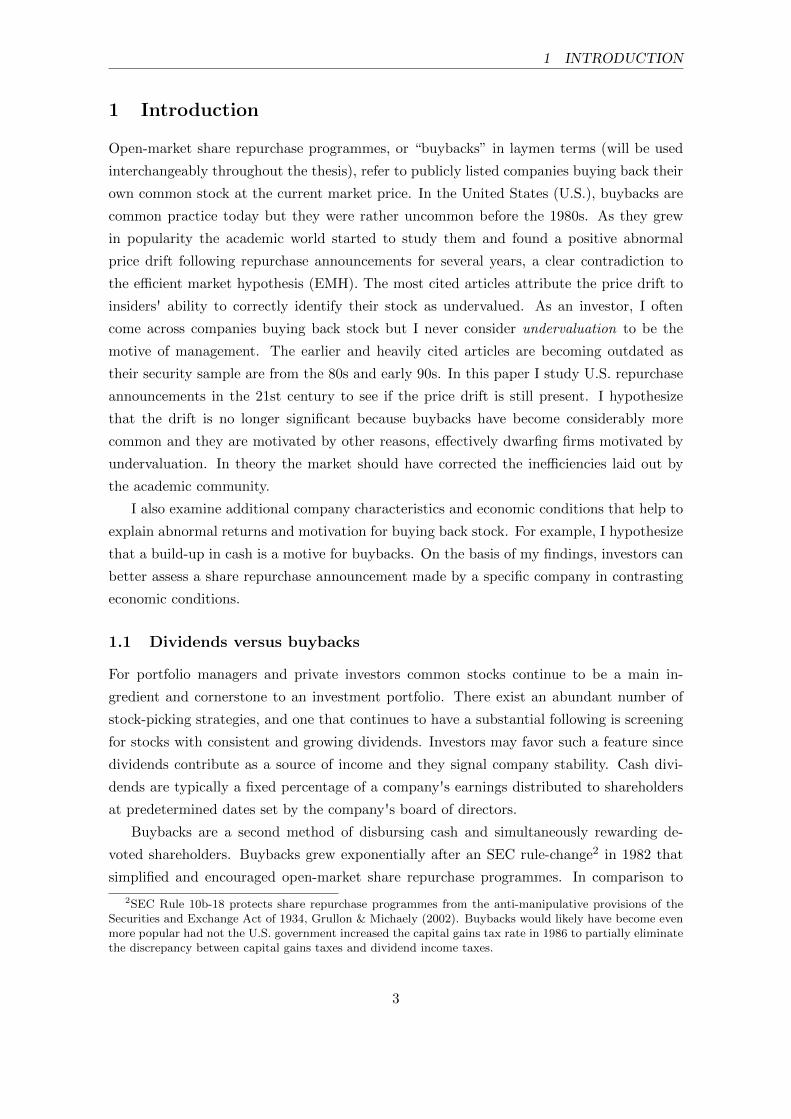
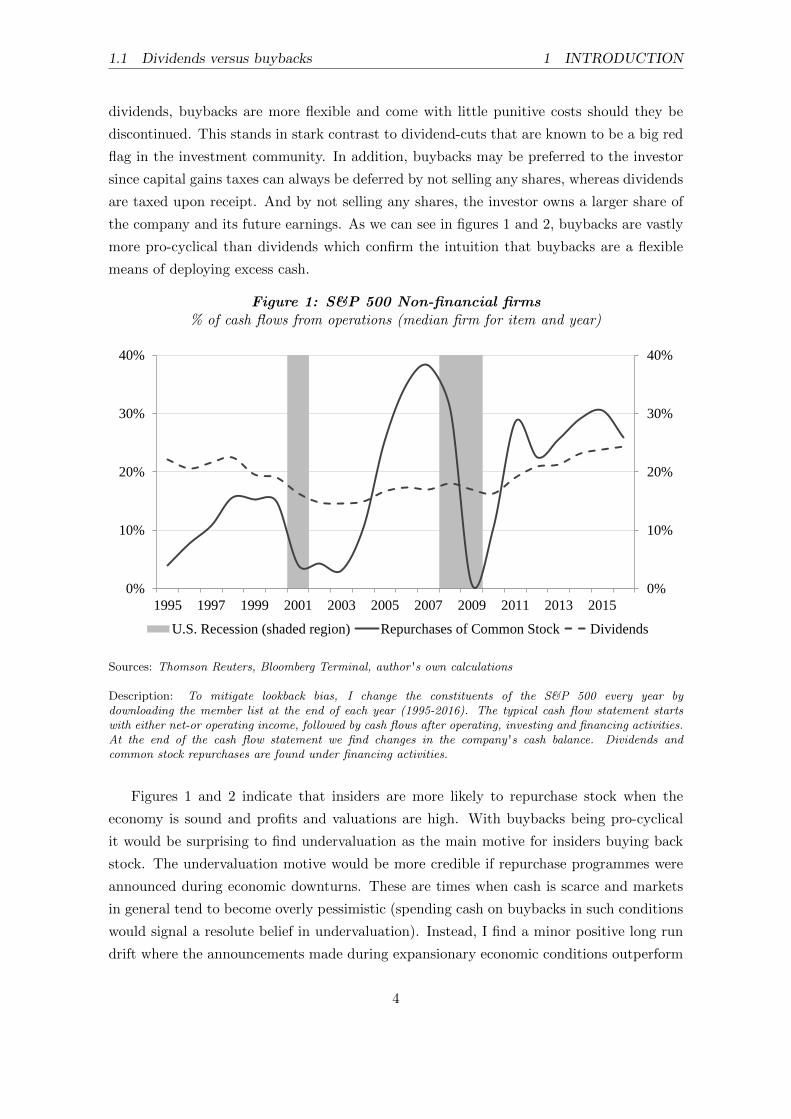
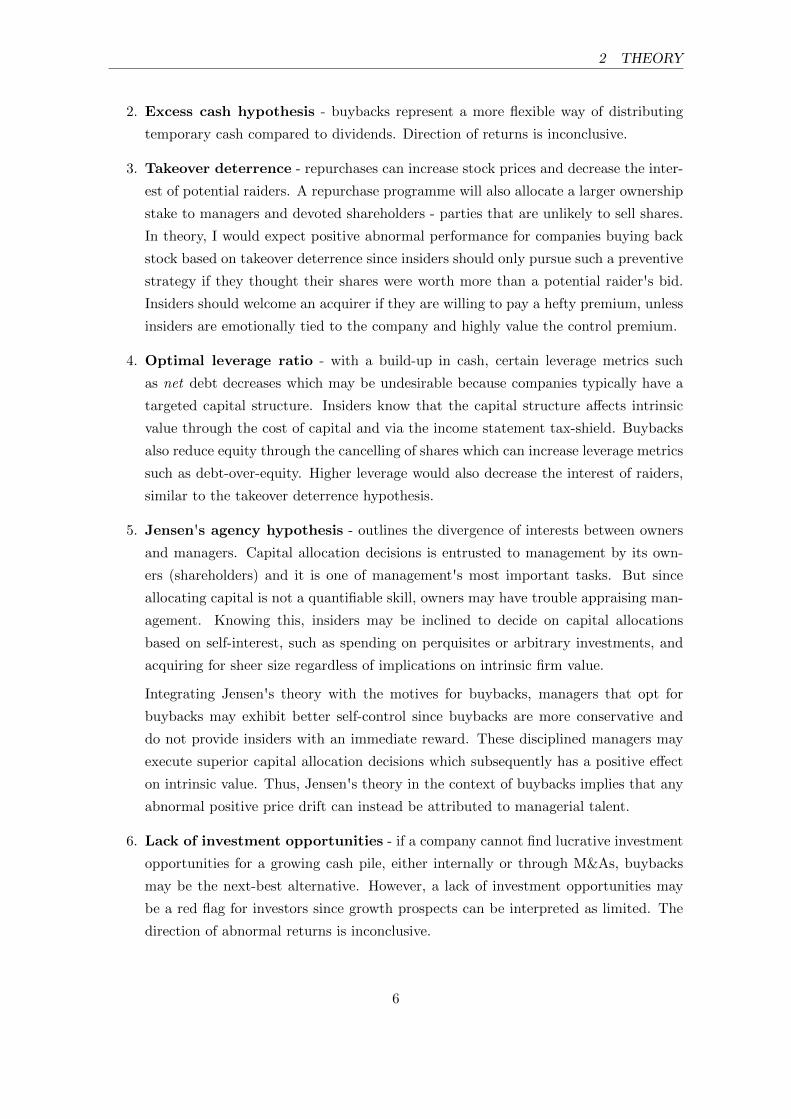
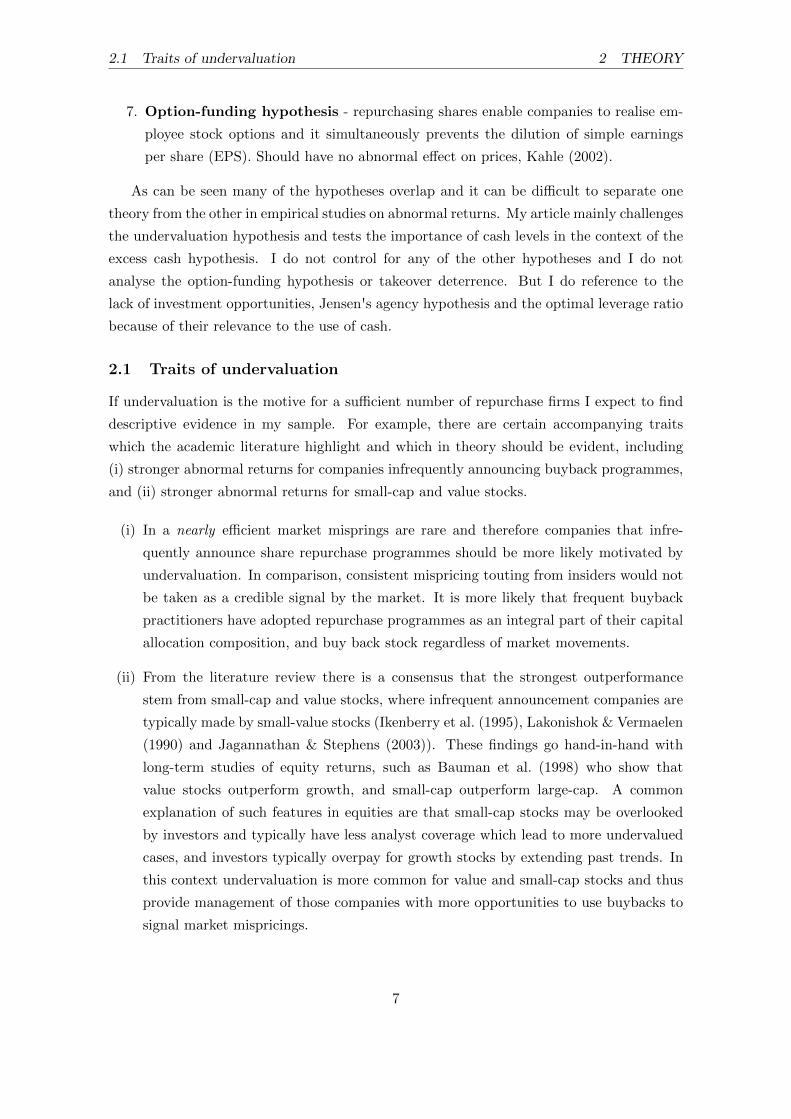
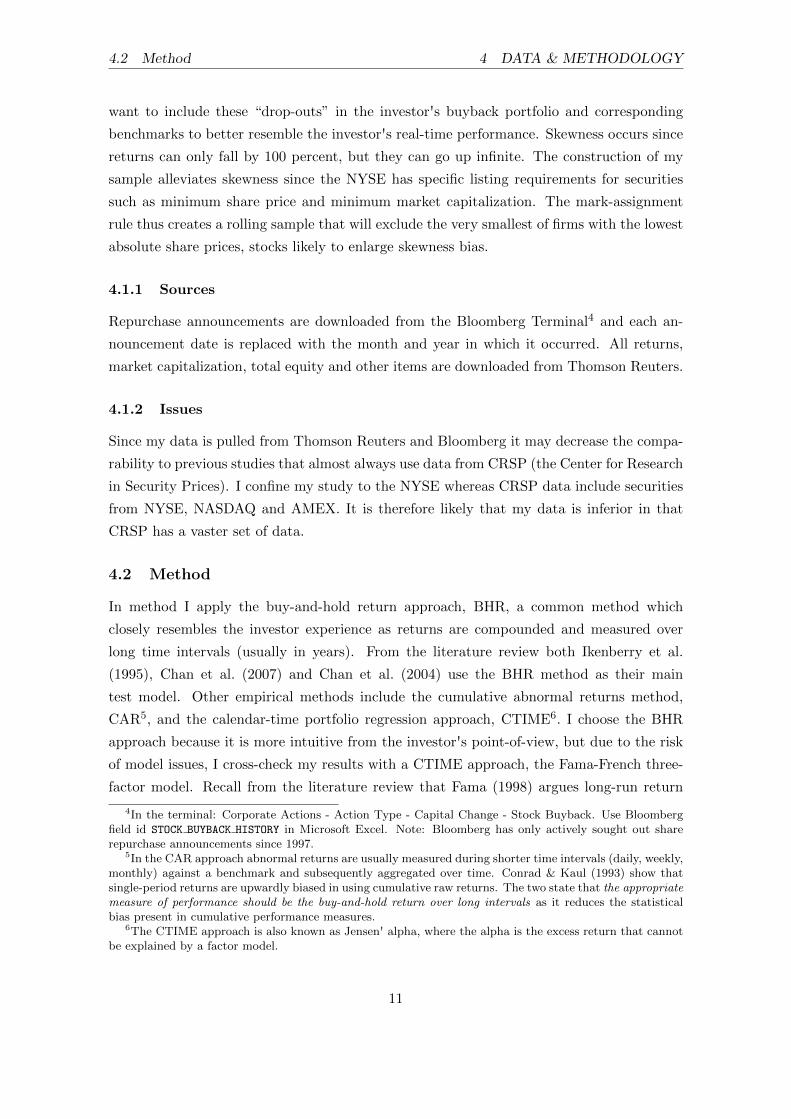
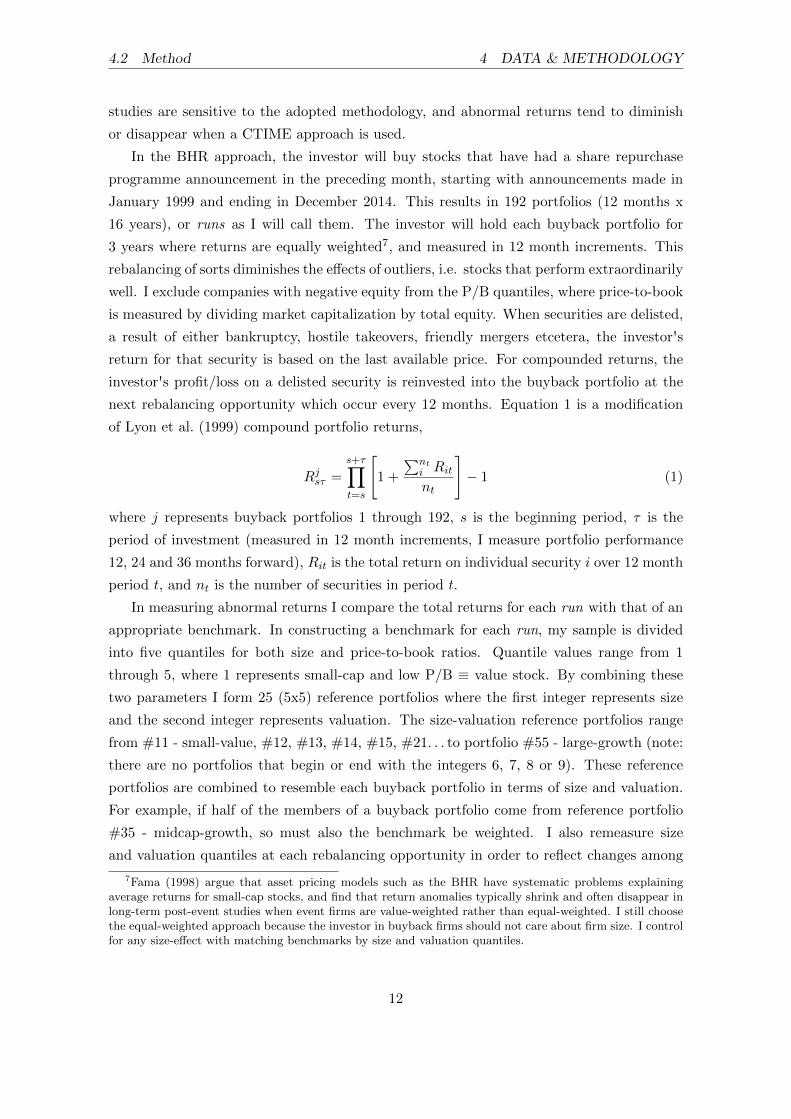
the company and its future earnings. As we can see in figures 1 and 2, buybacks are vastly
more pro-cyclical than dividends which confirm the intuition that buybacks are a flexible
means of deploying excess cash.
Figure 1: S&P 500 Non-financial firms% of cash flows from operations (median firm for item and year)
0%
10%
20%
30%
40%
0%
10%
20%
30%
40%
1995 1997 1999 2001 2003 2005 2007 2009 2011 2013 2015
U.S. Recession (shaded region) Repurchases of Common Stock Dividends
Sources: Thomson Reuters, Bloomberg Terminal, author 's own calculations
Description: To mitigate lookback bias, I change the constituents of the S&P 500 every year bydownloading the member list at the end of each year (1995-2016). The typical cash flow statement startswith either net-or operating income, followed by cash flows after operating, investing and financing activities.At the end of the cash flow statement we find changes in the company's cash balance. Dividends andcommon stock repurchases are found under financing activities.
Figures 1 and 2 indicate that insiders are more likely to repurchase stock when the
economy is sound and profits and valuations are high. With buybacks being pro-cyclical
it would be surprising to find undervaluation as the main motive for insiders buying back
stock. The undervaluation motive would be more credible if repurchase programmes were
announced during economic downturns. These are times when cash is scarce and markets
in general tend to become overly pessimistic (spending cash on buybacks in such conditions
would signal a resolute belief in undervaluation). Instead, I find a minor positive long run
drift where the announcements made during expansionary economic conditions outperform
4
2 THEORY
those made during recessions3.
In support of practical reasons for buying back stock, I find that buyback companies
experience a build-up in cash and tend to hold higher levels of cash at their announcement
date compared to peers. But in support of the undervaluation hypothesis, cash-poor com-
panies outperform cash-rich companies, a likely consequence of cash-poor companies being
more confident in their share price and general business outlook. It may simultaneously be
that the very “richest” of firms inadvertently indicate a lack of investment opportunities
pursuing buybacks.
Figure 2: Share-repurchase announcements vs. the S&P 500
400
800
1 200
1 600
2 000
2 400
100
300
500
700
900
1 100
S&
P 5
00
Ind
ex
# o
f an
no
un
cem
ents
U.S. Recession (shaded region)
All Buyback Announcements Captured by Bloomberg, rolling 12m (lhs)
S&P 500 Index (rhs)
Sources: Bloomberg Terminal, author 's own calculationsDescritption: The number of announcements are collected from the NYSE security sample pulled at thebeginning of every year between 1999 and 2014 (see section 4.1).
2 Theory
Below I summarize the different theories and hypotheses drawn from the literature review
related to open-market share repurchase programmes. The first four items are credited to
Chun et al. (2010):
1. Undervaluation hypothesis - companies repurchase shares to signal private infor-
mation that the shares are undervalued. As earlier articles have found, abnormal
returns are expected to be positive.
3As indicate by The National Bureau of Economic Research (NBER).
5
2 THEORY
2. Excess cash hypothesis - buybacks represent a more flexible way of distributing
temporary cash compared to dividends. Direction of returns is inconclusive.
3. Takeover deterrence - repurchases can increase stock prices and decrease the inter-
est of potential raiders. A repurchase programme will also allocate a larger ownership
stake to managers and devoted shareholders - parties that are unlikely to sell shares.
In theory, I would expect positive abnormal performance for companies buying back
stock based on takeover deterrence since insiders should only pursue such a preventive
strategy if they thought their shares were worth more than a potential raider's bid.
Insiders should welcome an acquirer if they are willing to pay a hefty premium, unless
insiders are emotionally tied to the company and highly value the control premium.
4. Optimal leverage ratio - with a build-up in cash, certain leverage metrics such
as net debt decreases which may be undesirable because companies typically have a
targeted capital structure. Insiders know that the capital structure affects intrinsic
value through the cost of capital and via the income statement tax-shield. Buybacks
also reduce equity through the cancelling of shares which can increase leverage metrics
such as debt-over-equity. Higher leverage would also decrease the interest of raiders,
similar to the takeover deterrence hypothesis.
5. Jensen's agency hypothesis - outlines the divergence of interests between owners
and managers. Capital allocation decisions is entrusted to management by its own-
ers (shareholders) and it is one of management's most important tasks. But since
allocating capital is not a quantifiable skill, owners may have trouble appraising man-
agement. Knowing this, insiders may be inclined to decide on capital allocations
based on self-interest, such as spending on perquisites or arbitrary investments, and
acquiring for sheer size regardless of implications on intrinsic firm value.
Integrating Jensen's theory with the motives for buybacks, managers that opt for
buybacks may exhibit better self-control since buybacks are more conservative and
do not provide insiders with an immediate reward. These disciplined managers may
execute superior capital allocation decisions which subsequently has a positive effect
on intrinsic value. Thus, Jensen's theory in the context of buybacks implies that any
abnormal positive price drift can instead be attributed to managerial talent.
6. Lack of investment opportunities - if a company cannot find lucrative investment
opportunities for a growing cash pile, either internally or through M&As, buybacks
may be the next-best alternative. However, a lack of investment opportunities may
be a red flag for investors since growth prospects can be interpreted as limited. The
direction of abnormal returns is inconclusive.
6
2.1 Traits of undervaluation 2 THEORY
7. Option-funding hypothesis - repurchasing shares enable companies to realise em-
ployee stock options and it simultaneously prevents the dilution of simple earnings
per share (EPS). Should have no abnormal effect on prices, Kahle (2002).
As can be seen many of the hypotheses overlap and it can be difficult to separate one
theory from the other in empirical studies on abnormal returns. My article mainly challenges
the undervaluation hypothesis and tests the importance of cash levels in the context of the
excess cash hypothesis. I do not control for any of the other hypotheses and I do not
analyse the option-funding hypothesis or takeover deterrence. But I do reference to the
lack of investment opportunities, Jensen's agency hypothesis and the optimal leverage ratio
because of their relevance to the use of cash.
2.1 Traits of undervaluation
If undervaluation is the motive for a sufficient number of repurchase firms I expect to find
descriptive evidence in my sample. For example, there are certain accompanying traits
which the academic literature highlight and which in theory should be evident, including
(i) stronger abnormal returns for companies infrequently announcing buyback programmes,
and (ii) stronger abnormal returns for small-cap and value stocks.
(i) In a nearly efficient market misprings are rare and therefore companies that infre-
quently announce share repurchase programmes should be more likely motivated by
undervaluation. In comparison, consistent mispricing touting from insiders would not
be taken as a credible signal by the market. It is more likely that frequent buyback
practitioners have adopted repurchase programmes as an integral part of their capital
allocation composition, and buy back stock regardless of market movements.
(ii) From the literature review there is a consensus that the strongest outperformance
stem from small-cap and value stocks, where infrequent announcement companies are
typically made by small-value stocks (Ikenberry et al. (1995), Lakonishok & Vermaelen
(1990) and Jagannathan & Stephens (2003)). These findings go hand-in-hand with
long-term studies of equity returns, such as Bauman et al. (1998) who show that
value stocks outperform growth, and small-cap outperform large-cap. A common
explanation of such features in equities are that small-cap stocks may be overlooked
by investors and typically have less analyst coverage which lead to more undervalued
cases, and investors typically overpay for growth stocks by extending past trends. In
this context undervaluation is more common for value and small-cap stocks and thus
provide management of those companies with more opportunities to use buybacks to
signal market mispricings.
7
3 LITERATURE REVIEW
3 Literature Review
3.1 The undervaluation hypothesis
Among the most cited and earliest studies of market signalling via buybacks comes from
Vermaelen (1981). Vermaelen (1981) finds that repurchase announcements are followed by
permanent increases in stock prices and he attributes his findings to the signalling hypoth-
esis, also known as the undervaluation hypothesis. Following Vermaelen (1981), there are
both numerous studies that support the undervaluation hypothesis, but also those that ei-
ther object to the methodology or find other motives for buying back stock. Unless specified,
all articles below analyse the U.S. market.
Comment & Jarrell (1991) find support of the undervaluation hypothesis during the an-
nouncement period in its study of open-market share repurchase programmes between 1985
and 1988. They find the strongest effect for larger programmes (as percent of outstanding
shares), where a larger commitment of capital signals higher conviction from insiders. Per-
haps the most persuasive study comes from Ikenberry et al. (1995) who study repurchase
programmes during the period 1980-1990. They find an average abnormal four-year buy-
and-hold return of 12.1% with the majority of the outperformance captured among value
stocks, defined as those with low price-to-book ratios. In explaining the long-run price
drift, Ikenberry et al. (1995) suggest that the market must underreact to a significant por-
tion of repurchase announcements. Their findings hence violate EMH theory (EMH theory
requires any mispricing to immediately be adjusted for at the time of the market signal, i.e.
repurchase announcement).
Chan et al. (2004) extend the same sample as Ikenberry et al. (1995) and they also
find that the market reacts more favorably to repurchase announcements by value stocks.
In addition, Chan et al. (2004) find stronger results for firms that commit to their repur-
chase programmes and actually buy back shares. Keep in mind that a simple repurchase
announcement does not obligate the company to go through with any repurchasing activ-
ity. However, there are strong incentives for insiders to go through with the repurchase
programme because it is valuable for them to appear credible to stakeholders. Lastly, Chan
et al. (2004) find a stronger reaction for firms with lower preannouncement returns. This can
be put in connection with De Bondt & Thaler (1989) who find evidence of mean-reversion
in equity returns, and Thorndike (2012) in his book The Outsiders, where a collection of
unconventional CEOs use buybacks at times when the market is generally depressed or
negligent to their stock. In line with De Bondt & Thaler (1989), if prices mean-revert after
having been irrationally depressed or exuberant, it provides insiders with an opportunity
and motive to buy back stock based on undervaluation.
Further support of the undervaluation hypothesis comes from Dittmar (2000) who con-
tends that undervaluation is the most consistent motive for share repurchases, but it is not
8
3.2 Alternative studies 3 LITERATURE REVIEW
the only motive (Period 1977-1996). Yook (2010) examine 9,551 repurchase programmes
between 1994 and 2007 for firms listed on the major U.S. exchanges. Yook (2010) distin-
guish between firms that actually repurchase shares, similar to Ikenberry et al. (1995), but
also between seasoned repurchase firms that frequently buy back stock, and those that in-
frequently announce repurchase programmes. In support of the undervaluation hypothesis,
Yook (2010) finds strong evidence of long-term abnormal returns for infrequent announcers
that actually buy back shares, similar to Chan et al. (2004). Jagannathan & Stephens
(2003) also find that infrequent repurchases receive a much stronger positive reaction.
And lastly, Yook (2010) use a calendar portfolio regression method whereas the earlier
articles use either the buy-and-hold return approach (BHR) or cumulative abnormal return
approach (CAR). The undervaluation hypothesis therefore gain additional support since
Fama (1998) argues that by implementing a calendar approach, as Yook does, abnormal
returns should diminish from the previous BHR/CAR studies.
3.2 Alternative studies
With the emergence of articles in favor of the undervaluation hypothesis there naturally
arose opponents. Kahle (2002) indicates that the market is efficient in that there is no
abnormal performance for firms buying back stock to fund employee stock options. Kahle
(2002) goes on to explain that the innovation in compensation policy led to the growing use
of employee stock options during the 1990s, which partially can explain the rise in buyback
activity during the same time period. Putting this into numbers, in a survey of 2000 U.S.
companies, Sanford C. Bernstein & Company found the value of stock options grew from
8.9 billion to 45.6 billion dollars between 1992 and 1997, Strege (1999). Similarly, Grullon
& Michaely (2002) find that expenditures on share repurchase programs, relative to total
earnings, increased from 4.8% to 50.1% between 1980 and 1998. Grullon & Michaely (2002)
attribute the rise in buybacks to relaxed regulation, notably SEC Rule 10b-18. The findings
by Kahle (2002), Grullon & Michaely (2002), along with Dittmar (2000) and Brav et al.
(2005), support the option-funding hypothesis in that firms repurchase shares to avoid the
dilution of incumbent shareholders and of basic EPS (see next paragraph).
Bonaime & Ryngaert (2013) draw inspiration from Kahle (2002) in regards to employee
stock options and challenge the undervaluation hypothesis with their findings that share
repurchases are most frequently observed conditional on insiders being net sellers. If stock
prices truly are undervalued there is no compelling reason for insiders to simultaneously be
selling their privately-held shares. Bonaime & Ryngaert (2013) argue share repurchases are
undertaken to support prices in the short-run which allow insiders to sell at favorable prices.
During the share repurchase programme, they also find higher levels of options exercised
by insiders. Similarly, Chan et al. (2010) tries to single out such “suspect firms” as those
who authorize share repurchases in an attempt to convey a false signal to the market. This
9

4 DATA & METHODOLOGY
tactic may be implemented by managers that are seemingly under pressure to boost stock
prices. They also find their “suspect” managers to have higher exposure to stock options.
All in all, Bonaime & Ryngaert (2013) show that investment strategies based on share
repurchase activity are only successful when insiders are net buyers - a testament of insider
commitment.
On the topic of dividends versus buybacks, Dittmar (2000) argues buybacks are not
a replacement for dividends since repurchasing firms do not pay lower dividends. Brav
et al. (2005) explain how the flexibility of buybacks allow managers to alter its payouts to
shareholders in response to available investment opportunities and how buybacks can be
used to time the equity market and directly increase earnings per share. In fact, Brav et al.
(2005) find that CFOs are very conscious of how share repurchases affect EPS. This is rather
surprising since EPS is an arbitrary ratio in the context of firm value. But changes in EPS
directly affect price-earnings (P/E) ratios (buying back stock will increase EPS and lower
the P/E-ratio). P/E-ratios are widely observed by the market and investors may screen
for lower P/E-ratios in relative investment bets. The CFO knows this and expects a lower
P/E-ratio to entice investors and support share prices.
Lam et al. (2013) analyse the general relationship of cash and equity returns and com-
ment on the opposing conclusions presented by earlier studies. A few papers argue that
riskier firms hold more cash and therefore investors will expect higher returns. Other papers
argue that higher liquidity lowers risk and expected returns. In their own paper, Lam et al.
(2013) find a positive relationship between cash holdings and returns. They identify higher
cash holdings as a proxy for macroeconomic risk and argue that higher liquidity is deliberate
and necessary for these firms since they face higher default risks. On a different note, Lam
et al. suggest that firms with an abundance of cash might subsequently increase dividends.
Such an action will send share prices higher, assuming the market was not expecting an
increase.
4 Data & Methodology
4.1 Data
My sample consists of 3068 common stocks that collectively are pulled at the beginning of
each year from the New York Stock Exchange (NYSE) between 1999 and 2014 (duplicates
are removed). For each year, the investor's security universe is limited to securities available
on the NYSE at the beginning of said year and I will refer to this restriction as the mark -
assignment rule. The mark-assignment rule helps mitigate survivorship bias and skewness
bias, both common irritants in long-run studies, Lyon et al. (1999). Survivorship bias is
evident in indices, such as the S&P 500 Index, where the smallest companies are replaced
as they cannot keep up with the general growth of the market. At any point in time I
10
4.2 Method 4 DATA & METHODOLOGY
want to include these “drop-outs” in the investor's buyback portfolio and corresponding
benchmarks to better resemble the investor's real-time performance. Skewness occurs since
returns can only fall by 100 percent, but they can go up infinite. The construction of my
sample alleviates skewness since the NYSE has specific listing requirements for securities
such as minimum share price and minimum market capitalization. The mark-assignment
rule thus creates a rolling sample that will exclude the very smallest of firms with the lowest
absolute share prices, stocks likely to enlarge skewness bias.
4.1.1 Sources
Repurchase announcements are downloaded from the Bloomberg Terminal4 and each an-
nouncement date is replaced with the month and year in which it occurred. All returns,
market capitalization, total equity and other items are downloaded from Thomson Reuters.
4.1.2 Issues
Since my data is pulled from Thomson Reuters and Bloomberg it may decrease the compa-
rability to previous studies that almost always use data from CRSP (the Center for Research
in Security Prices). I confine my study to the NYSE whereas CRSP data include securities
from NYSE, NASDAQ and AMEX. It is therefore likely that my data is inferior in that
CRSP has a vaster set of data.
4.2 Method
In method I apply the buy-and-hold return approach, BHR, a common method which
closely resembles the investor experience as returns are compounded and measured over
long time intervals (usually in years). From the literature review both Ikenberry et al.
(1995), Chan et al. (2007) and Chan et al. (2004) use the BHR method as their main
test model. Other empirical methods include the cumulative abnormal returns method,
CAR5, and the calendar-time portfolio regression approach, CTIME6. I choose the BHR
approach because it is more intuitive from the investor's point-of-view, but due to the risk
of model issues, I cross-check my results with a CTIME approach, the Fama-French three-
factor model. Recall from the literature review that Fama (1998) argues long-run return
4In the terminal: Corporate Actions - Action Type - Capital Change - Stock Buyback. Use Bloombergfield id STOCK BUYBACK HISTORY in Microsoft Excel. Note: Bloomberg has only actively sought out sharerepurchase announcements since 1997.
5In the CAR approach abnormal returns are usually measured during shorter time intervals (daily, weekly,monthly) against a benchmark and subsequently aggregated over time. Conrad & Kaul (1993) show thatsingle-period returns are upwardly biased in using cumulative raw returns. The two state that the appropriatemeasure of performance should be the buy-and-hold return over long intervals as it reduces the statisticalbias present in cumulative performance measures.
6The CTIME approach is also known as Jensen' alpha, where the alpha is the excess return that cannotbe explained by a factor model.
11
4.2 Method 4 DATA & METHODOLOGY
studies are sensitive to the adopted methodology, and abnormal returns tend to diminish
or disappear when a CTIME approach is used.
In the BHR approach, the investor will buy stocks that have had a share repurchase
programme announcement in the preceding month, starting with announcements made in
January 1999 and ending in December 2014. This results in 192 portfolios (12 months x
16 years), or runs as I will call them. The investor will hold each buyback portfolio for
3 years where returns are equally weighted7, and measured in 12 month increments. This
rebalancing of sorts diminishes the effects of outliers, i.e. stocks that perform extraordinarily
well. I exclude companies with negative equity from the P/B quantiles, where price-to-book
is measured by dividing market capitalization by total equity. When securities are delisted,
a result of either bankruptcy, hostile takeovers, friendly mergers etcetera, the investor's
return for that security is based on the last available price. For compounded returns, the
investor's profit/loss on a delisted security is reinvested into the buyback portfolio at the
next rebalancing opportunity which occur every 12 months. Equation 1 is a modification
of Lyon et al. (1999) compound portfolio returns,
Rjsτ =s+τ∏t=s
[1 +
∑nti Ritnt
]− 1 (1)
where j represents buyback portfolios 1 through 192, s is the beginning period, τ is the
period of investment (measured in 12 month increments, I measure portfolio performance
12, 24 and 36 months forward), Rit is the total return on individual security i over 12 month
period t, and nt is the number of securities in period t.
In measuring abnormal returns I compare the total returns for each run with that of an
appropriate benchmark. In constructing a benchmark for each run, my sample is divided
into five quantiles for both size and price-to-book ratios. Quantile values range from 1
through 5, where 1 represents small-cap and low P/B ≡ value stock. By combining these
two parameters I form 25 (5x5) reference portfolios where the first integer represents size
and the second integer represents valuation. The size-valuation reference portfolios range
from #11 - small-value, #12, #13, #14, #15, #21. . . to portfolio #55 - large-growth (note:
there are no portfolios that begin or end with the integers 6, 7, 8 or 9). These reference
portfolios are combined to resemble each buyback portfolio in terms of size and valuation.
For example, if half of the members of a buyback portfolio come from reference portfolio
#35 - midcap-growth, so must also the benchmark be weighted. I also remeasure size
and valuation quantiles at each rebalancing opportunity in order to reflect changes among
7Fama (1998) argue that asset pricing models such as the BHR have systematic problems explainingaverage returns for small-cap stocks, and find that return anomalies typically shrink and often disappear inlong-term post-event studies when event firms are value-weighted rather than equal-weighted. I still choosethe equal-weighted approach because the investor in buyback firms should not care about firm size. I controlfor any size-effect with matching benchmarks by size and valuation quantiles.
12
4.2 Method 4 DATA & METHODOLOGY
the members of the buyback portfolio. This will enhance the comparability between each
buyback portfolio and corresponding benchmark over time. Abnormal returns are then
calculated as follows:
ARjτ = Rjτ − E(Rjτ ) (2)
where ARjτ is the τ period buy-and-hold abnormal return for buyback portfolio j, Rjτ is the
τ period buy-and-hold return for buyback portfolio j, and E(Rjτ ) is the τ period expected
return. Expected returns represent the equivalent mixture of reference portfolios that form
each benchmark.
The reference portfolios do not include any company that has had a share repurchase an-
nouncement in the last 24 months, or will have in the next 12 months. These exclusions are
done to keep observations independent between groups. If there truly is an announcement
effect and an underlying price drift after a repurchase announcement, excluding surround-
ing repurchasing firms from the benchmarks should enhance the difference in returns. The
specified exclusion range is chosen since I would expect companies with an announcement
24 months ago to carry on a positive price drift, and the cap 12 months forward is chosen
since those firms are likely to have an announcement effect and a price drift up until the next
return measurement. However, the results are negligible in running the same data without
the independent groups criteria. This is the result of a large enough sample where excluding
a small number of securities does not dramatically change equally-weighted returns.
In measuring preceding returns, or momentum, I only exclude the selected repurchase
firms for each run from the benchmarks. Momentum is treated differently since the buyback
firms have not yet announced a repurchase programme, and should then be compared to
the entire sample.
4.2.1 Method for individual securities
In order to study specific company characteristics among buyback firms I analyse my sample
on an individual level as well. In measuring momentum, each security is compared to its
size-valuation reference portfolio 24 months before its announcement, and in measuring
forward returns, size and valuation quantiles are measured at the time of the announcement.
Similar to portfolio measurements, I implement the mark-assignment rule and exclusion of
surrounding repurchase announcements (24 months lagging, 12 month forward).
4.2.2 Additional parameters
Beyond the characteristics size and valuation, I analyse the significance of cash holdings
and capital expenditure (“CapEx”) intensity at the time of each announcement, and also
the development of these parameters surrounding each announcement. I choose to examine
13
5 RESULTS
CapEx because it is another major cash flow item that is strategically decided upon, similar
to buybacks.
5 Results
5.1 Investment performance
I find on average a 1.0%, 2.3% and 4.1% abnormal positive return drift for a one-, two-
and three-year buy-and-hold investment strategy, respectively, buying all firms with a re-
purchase announcement within a given month between 1999 and 2014. These returns do
not incorporate any announcement effect which Comment & Jarrell (1991) and Ikenberry
et al. (1995) find to be approximately 2% and 3.5%, respectively. The results of the BHR
model are significant in a bootstrap approach but the significance diminish using a CTIME
model (although results are similar). In regards to my initial hypothesis of no long-run
positive price drift, I appear to be in a twilight zone as my two test models yield different
significance levels. This prevents me from either confirming or rejecting my hypothesis with
absolute certainty. However, if transaction costs were included, I expect the positive drift
to diminish further and I expect no abnormal returns from an investment strategy buying
securities based on repurchase announcements.
From 1999 through 2014 there are times where the investment strategy would work sig-
nificantly better or worse, from an average low -18.8% three-year buy-and-hold investment
horizon in year 2005, to a high of 20.3% in year 2000. The periodicity is however not ran-
dom and the investor should pay attention to market conditions as I find an odd difference
for repurchase announcements made in economic expansionary8 periods (above average real
GDP growth) and contractions9. Three-year abnormal returns are significantly positive
buying stocks in expansionary periods, but insignificant and negative during recessionary
periods, a finding that contradicts evidence that managers posses “timing” abilities.
I would expect the most skilled managers to be among those that announce repurchase
programmes during depressed equity markets. As Thorndike (2012) illustrates in his book
where his unconventional CEOs use buybacks at times when equities are under pressure
or their stock is out of favor. These few contrarian managers appear capable of correctly
valuing their business and can effectively “time” the market. But these managers are rare,
and the discrepancy in returns from my study between expansionary and recessionary peri-
ods, in conjunction with figures 1 and 2, where we see the majority of companies pursuing
buybacks in buoyant economic conditions, all suggest that insiders are no better at valuing
their business than market participants.
8Above GDP Trend are months where real GDP growth is above the quarterly average between 1990 and2014 - a period of consistently low interest rates, and ends with my study period.
9As indicated by the NBER, recession dates start at the peak of a business cycle and ends at the trough.
14

5.2 Descriptive analysis 5 RESULTS
Instead, it may even suggest that some insiders underestimate their exposure to eco-
nomic downturns and completely mistime the market in their use of buybacks. From one
perspective, buybacks could be interpreted as an optimistic liquidity signal, as the company
displays confidence in spending cash. But the disbursing of cash also increases leverage
through higher net debt ratios which can trigger downgrades in credit ratings and lead to
stricter lending terms. Such a turnaround is quite damaging on share prices, especially dur-
ing a downturn in the economy. Buybacks in recessions may also be a waste of cash since
M&A bargains and other lucrative investment opportunities present themselves through
forced fire-sales (happens when a seller of assets has limited time in finding a buyer and
must settle for a discount).
5.2 Descriptive analysis
Inconsistent with previous literature and theory, I do not find the “outperformance” to be
attributed to small-cap or value stocks. Also drawn from the theory section, it is not evi-
dent from my sample that firms that infrequently announce repurchase programmes exhibit
stronger returns, even though articles by Yook (2010) and Jagannathan & Stephens (2003)
proclaim infrequent announcers are more likely motivated by undervaluation. In contrast,
I find that occasional announcements (defined as those without a previous announcement
lagging 48 months) have a negative 1.9% abnormal return for the three-year buy-and-hold
investment strategy, whereas frequent10 announcers portray positive returns (both insignif-
icant). Likewise, the occasional small-value stocks exhibit negative abnormal returns, on
average, while frequent large-growth stocks exhibit positive abnormal returns (stocks with
the complete opposite characteristics). Empirically, it may be that frequent announcers
return resilient cash flows which enable them to continuously buy back stock. The market
may not fully appreciate the recurrence of buybacks, and share prices would then exhibit a
positive long-run drift.
The only finding that can support the notion that infrequent announcers are more
likely to repurchase based on undervaluation can be found in tables 1 and 2 which show
that genuine (defined as announcements without a previous repurchase announcement in
the last 24 months) and occasional announcements much more resemble the entire NYSE
sample, in contrast to frequent announcers that are overrepresented in large-cap and growth
stocks, and underrepresented in small-cap and value stocks. As frequent announcers diverge
quite strongly from the distribution of the NYSE sample, it suggest that certain company
characteristics found among frequent announcers increase their propensity to buy back
stock. In contrast, infrequent announcement firms have a more neutral distribution by
size and valuation which eliminates certain company characteristics from consideration and
10Frequent announcements are the byproduct of removing genuine announcements from all announcements.Genuine announcements do not have a previous repurchase announcement in the last 24 months.
15

5.2 Descriptive analysis 5 RESULTS
suggest there are other motives for these firms buying back stock, such as undervaluation.
Table 1: Distribution of repurchase announcements by Size and P/B quantiles
All Frequent Genuine OccasionalAnnouncements Announcements Announcements Announcements
SizeSmall (1) 735 12% 279 9% 351 15% 129 14%
(2) 948 15% 401 13% 416 18% 184 21%
(3) 1181 19% 563 19% 470 20% 175 20%
(4) 1564 25% 749 25% 539 23% 201 22%
Large (5) 1943 30% 1049 34% 573 24% 205 23%
P/BValue (1) 1054 17% 339 11% 435 20% 175 20%
(2) 1099 18% 440 14% 444 20% 184 21%
(3) 1177 19% 553 18% 441 20% 176 20%
(4) 1434 23% 773 25% 467 21% 202 23%
Growth (5) 1453 23% 936 31% 418 19% 157 18%
Sources: Thomson Reuters, author 's own calculationsDescription: The quantiles for market cap (size) and price-to-book (valuation) are assigned by dividing thesample into percentiles at the 20th, 40th, 60th, and 80th level. Percentiles for the sample are calculatedmonthly and the sample is limited to the mark-assignment rule.
Table 2: Distribution of announcements - combining Size and P/B quantilesThe first & second integer represents size & P/B, respectively (1=small/low, 5=high/large)
Size-Valuation Entire NYSE All Frequent Genuine OccasionalCombination Sample Announce. Announce. Announce. Announce.
Small-Value (11) 10% 6% 4% 8% 7%(12) 5% 3% 2% 4% 5%(13) 3% 2% 1% 2% 2%(14) 2% 1% 1% 1% 1%
Small-Growth (15) 1% 0% 1% 0% 0%
Large-Value (51) 2% 2% 2% 2% 2%(52) 3% 4% 3% 4% 3%(53) 4% 5% 4% 4% 3%(54) 5% 8% 10% 7% 7%
Large-Growth (55) 7% 11% 15% 8% 8%
Sources: Thomson Reuters, author 's own calculations
The excess cash hypothesis state that buybacks represent a more flexible way of dis-
tributing temporary cash compared to dividends. The following discussion will look at cash
as percent of assets surrounding repurchase announcements, and contest the undervaluation
hypothesis with the excess cash hypothesis.
At the time of share repurchase announcements, buyback firms tend to hold higher
levels of cash as percent of assets compared to comparable firms. For the entire NYSE
16

5.2 Descriptive analysis 5 RESULTS
sample (buyback and non-buyback firms), growth stocks and small-cap stocks tend to be
more cash-rich. We also know that buyback firms are overrepresented among growth stocks,
from table 1, which suggest that either cash-rich companies or growth stocks are more likely
to pursue buybacks. I contend the former is the more causal relationship. Companies do
not like hoarding cash and will want to disburse of its excess cash for productive use, deter
raiders from hostile takeovers, and/or relever the company in order to regain its targeted
capital structure, among others. If investment opportunities are scarce, a build-up in cash
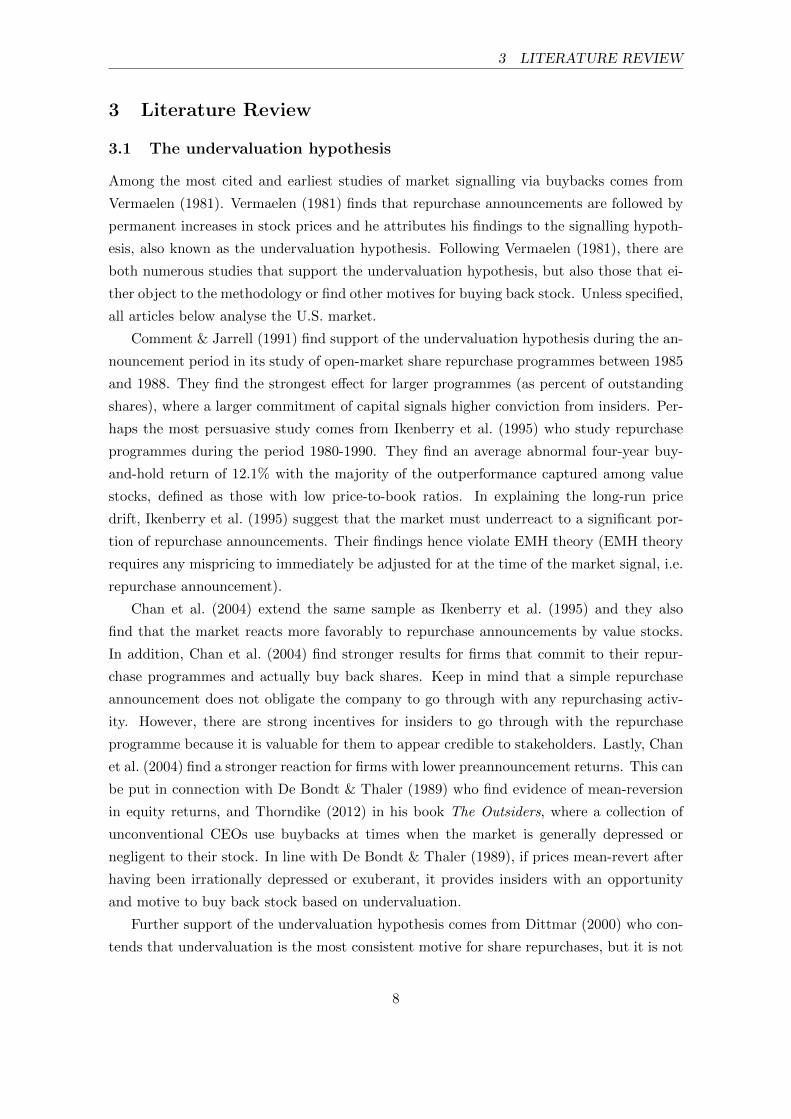
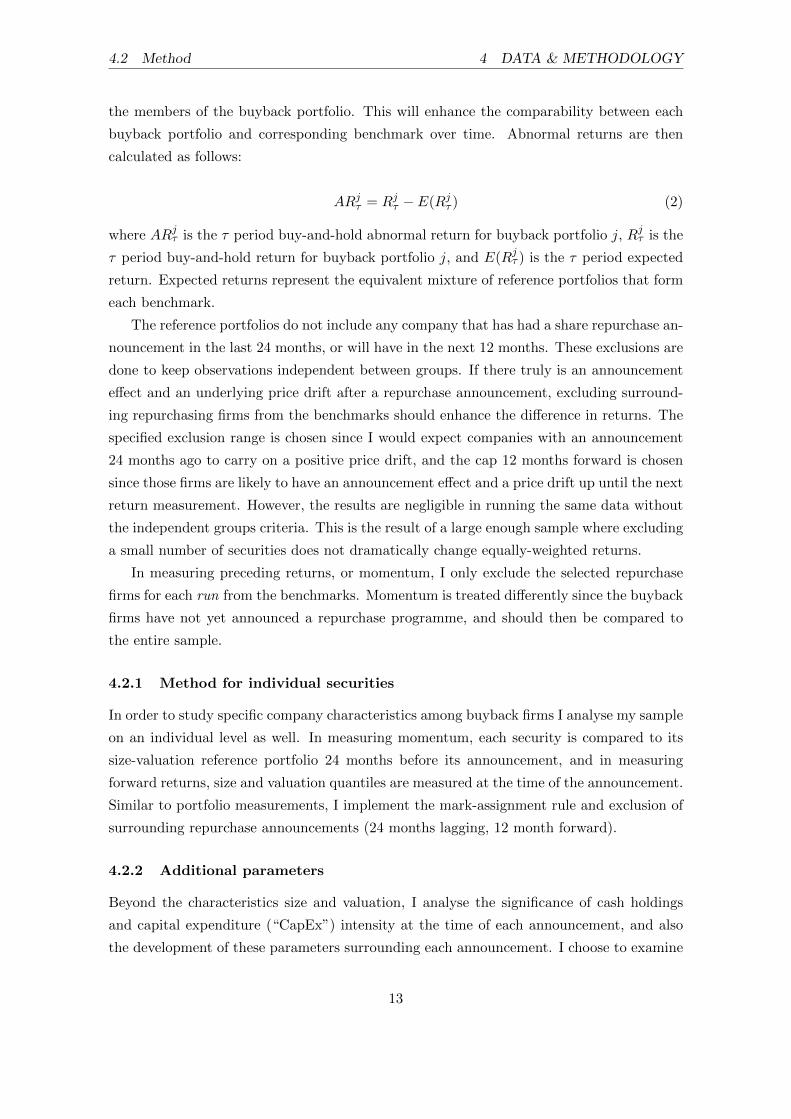
will nudge insiders toward buybacks. We can see in figure 3 that buyback firms experience
a build-up in cash (momentum and cash build-up is correlated which reflects a prosperous
business, i.e. there is a more pronounced build-up in cash among firms with strong price
performance preceding an announcement). Subsequently, repurchase firms spend a portion
of their cash on buybacks, forcing cash as percent of assets to revert back to normal.
Figure 3: Abnormal changes in cash among buyback firms
-0.20%
-0.10%
0.00%
0.10%
0.20%
0.30%
0.40%
0.50%
0.60%
-24m -12m Announcement
Date
+12m +24m
Ch
ang
e in
Cas
h a
s %
of
asse
ts
Timeline: m = Months
Sources: Thomson Reuters, author 's own calculationsDescription: I measure average cash as percent of total assets for all announcement firms within eachmonth. For each monthly selection of securities, I measure the average cash as percent of assets twelvemonths and twenty-four months before and after the announcement month. The changes between periods(done for the entire study period 1999-2014) is corrected for any underlying changes in my sample ofnon-repurchase firms. This correction is necessary since average cash as percent of assets for the NYSEsample steadily increases over time and is pro-cyclical. Firms are limited to the mark-assignment rule asbefore.
However, small-cap stocks are underrepresented in the buyback sample, even though
smaller firms tend to hold higher levels of cash (the differences in cash holdings by market
cap is less evident compared to difference in cash holdings by P/B-ratios). This stands in
contrast to the earlier argument that cash-richness is a motive for pursuing buybacks. To
17
5.2 Descriptive analysis 5 RESULTS
counter, I argue that small-cap stocks can more easily grow by reinvesting cash, whereas
“mature” large-cap stocks require vaster and more complex projects to make a noticeable
impact on their business. Therefore when large-cap stocks experience a build-up in cash,
their investment options may be less impactful and buybacks would present a more flexible
means of cash disbursement.
The descriptive analysis favors the excess cash hypothesis but it does not explain the
underperformance of cash-rich firms (the coefficient for cash is significantly negative for
abnormal returns, table 3). From the literature review, Lam et al. (2013) attribute higher
cash holdings as a proxy for macroeconomic risks and investors should then expect higher
returns. This proxy of sorts cannot be true for repurchasing firms because they choose to
disburse of their excess cash, something an inherently risky firm would not consider doing.
Instead, and in line with the undervaluation hypothesis, the negative relationship suggest
cash-poor firms are more likely motivated by undervaluation, and are more confident in
future cash flow generation. Another explanation could be that shareholders of cash-rich
firms are disappointed with management's decision to pursue buybacks. Shareholders may
interpret buybacks as a dull corporate action in contrast to reinvestment in the business or
synergistic M&A.
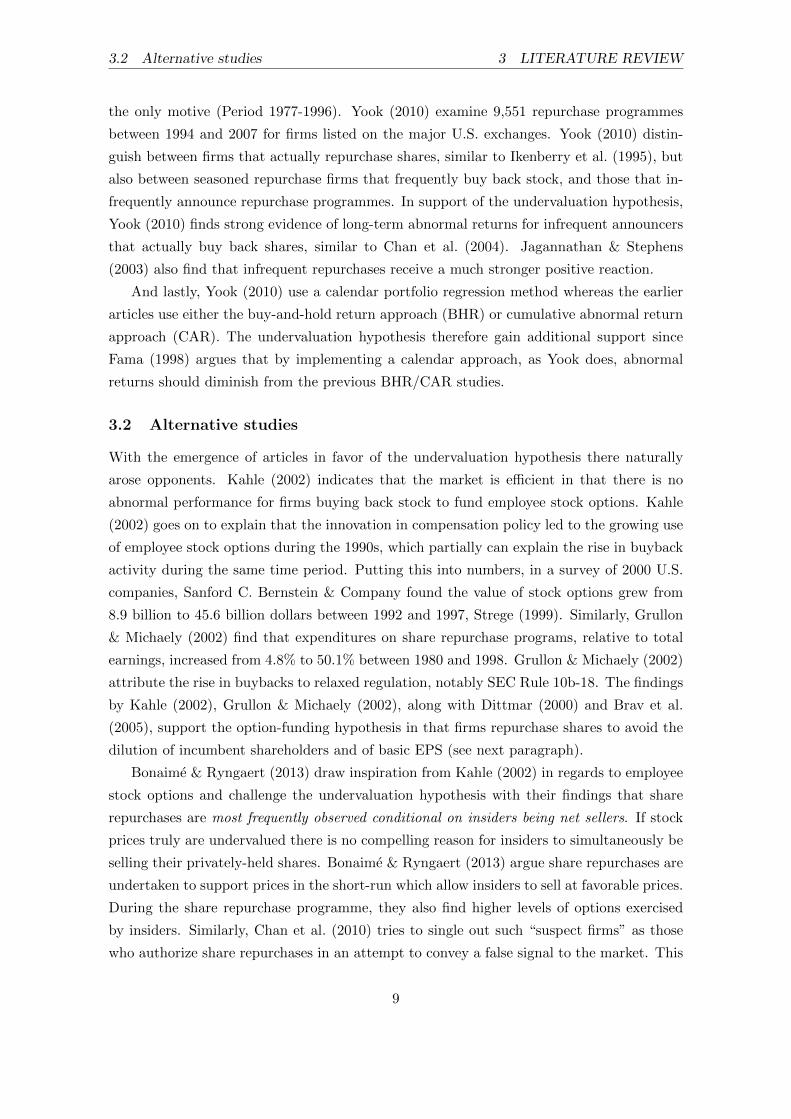
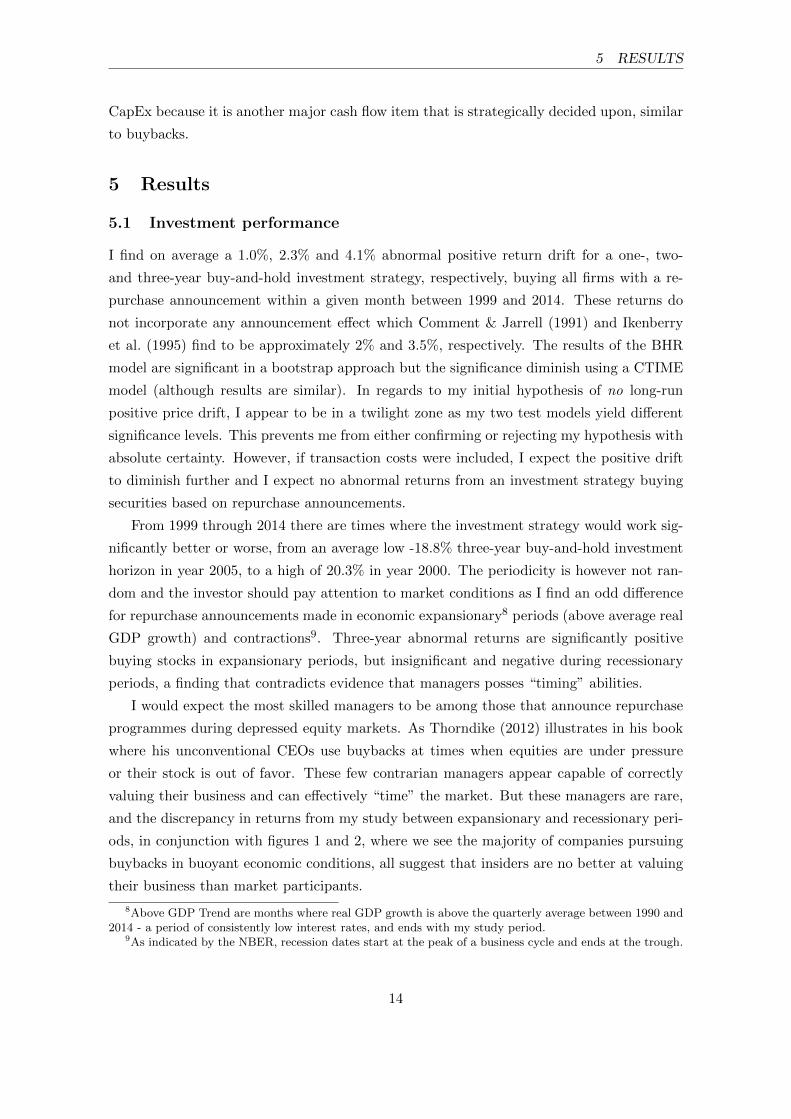
Buyback firms are consistently less CapEx intensive compared to peers which may be one
of the reasons they are more cash-rich and can divert more funds towards buybacks. I find
that CapEx intensive buyback firms significantly underperform (the coefficient for CapEx
is significantly negative for abnormal returns, table 3) and I also find a more prevalent de-
cline in CapEx intensity after a repurchase announcement, compared to the mean-reverting
tendency for all companies (see figure 4). This suggest CapEx and buybacks are partial sub-
stitutes to one another. I provide two hypothetical explanations to this occurrence: either
insiders misjudge their cash flow capacity and are forced to cut down on CapEx (in part
the consequence of having spent cash on buybacks), or current period CapEx is temporary.
Those forced to cut down on CapEx indicate a distressed company and will likely have had
poor share price performance.
18

5.3 Significance testing 5 RESULTS
Figure 4: Development of CapEx as % of sales, period Dec 1996-Dec 2017Buyback firms tend to draw down on CapEx after a repurchase announcement
Interval 30-40%
Interval 20-30%
10%
15%
20%
25%
30%
35%
40%
45%
50%
NYSE Sample All Repurchase Announcements
Initial CapEx as % of Sales, interval 40-50%
Sources: Thomson Reuters, author 's own calculationsDescription: The average CapEx as percent of sales is measured for the entire NYSE sample and allbuyback firms in intervals between 20-30%, 30-40% and 40-50%. I measure the development over 48months, with monthly starting periods from December 1996 to December 2013. Figure 4 shows the medianof the observations. For the entire sample, there is a mean-reverting tendency as firms draw down onCapEx as they exit a period of growth or return to a more sustainable investment rate. As figure 4 shows,buyback firms mean-revert stronger.
5.3 Significance testing
The performance of buyback portfolios does not tell much as to which companies pursuing
buybacks perform better or worse. In order to find the performers and laggards, I need
to test the significance of my chosen parameters on the individual security level. I run
linear regressions on the individual security level and measure abnormal returns (the de-
pendent variable) on the explanatory variables Size and P/B quantiles, cash as percent
of total assets (“Cash”) in percentiles, CapEx as percent of sales (“CapEx”) and two-year
compounded abnormal returns preceding the announcement (“Momentum”). Table 3 shows
the three-year compound abnormal returns for the different assortments of share repurchase
announcements.
19

5.3 Significance testing 5 RESULTS
Table 3: Linear regressions for share repurchase announcements3-year compounded abnormal returns
Coefficients
Security Sample Constant Size P/B Cash CapEx Momentum
All Announcements 8.9 -0.0 0.2 -10.0* -30.1* 0.0*(0.070) (0.971) (0.830) (0.013) (0.046) (0.018)
Frequent Announcements 6.5 0.4 -0.2 -5.6 -26.2 0.0(0.265) (0.772) (0.838) (0.264) (0.253) (0.184)
Genuine Announcements 13.8 -0.8 0.7 -17.3* -39.1 0.1*(0.102) (0.629) (0.689) (0.010) (0.051) (0.032)
Occasional Announcements -3.4 -0.2 2.5 -9.3 -35.5 0.1(0.771) (0.926) (0.316) (0.343) (0.115) (0.067)
All, NBER Recessions -31.5 -3.1 11.0* -0.2 9.8 0.1(0.076) (0.383) (0.015) (0.991) (0.786) (0.230)
All, > GDP Growth Trend 14.3* -0.9 -0.3 -13.8* -30.8 0.0(0.049) (0.586) (0.857) (0.023) (0.196) (0.447)
Sources: Thomson Reuters, author 's own calculationsDescription: p-values; * p < 0.05, ** p < 0.01, *** p < 0.001; Regressed in Stata, robust standard errors,95% confidence intervals. Size and P/B are represented as quantiles. This is especially important for thesize component since market cap tends to increase over time. Cash is represented in percentiles, wherepercentiles are measured monthly for the entire NYSE sample (restricted to the mark-assignment rule).Percentiles are used since cash as percent of assets rise over time in the sample. CapEx is represented aspercent of sales. There is no need to adjust CapEx values over time because it remains rather stable.Momentum is the two-year compounded abnormal returns measured against the correspondingsize-valuation reference benchmark, where the size-valuation quantiles are measured and assigned two yearsbefore the announcement. The constant represents the unexplained three-year compounded abnormal return.NBER recessions start at the peak of a business cycle and end at the trough. Above GDP trend are periodswhere real GDP growth is above average. The average is measured quarterly between 1990 and 2014. Thoseyears have consistently low interest rates and goes through two full business cycles.
Foretold by previous academics, the regressions in table 3 are questionable in their
validity since traditional significance tests may not be applicable for multi-year compound
returns. For example, Ikenberry et al. (1995) question the stability in return distributions,
the skewness of share price returns and the clustering of observations in time. My sample
likely violates both the normality assumption since share price returns are skewed in the
long-run (share prices can only go down 100%, but they can go up infinite), and stationarity
since return distributions are vastly different in bull versus bear markets. These issues are
semi-controlled for by measuring abnormal returns in contrast to simple returns. Abnormal,
or “relative” returns adjust towards a more normally distributed dataset. In regard to
independence of observations I remove repurchase firms from the benchmarks in a rolling
20

5.3 Significance testing 5 RESULTS
sample: for each 12-month return measurement, any repurchase announcement made in the
last 24 months or 12 months forward is excluded from the benchmark. Relative returns
and the rolling sample exclusion may provide more reliable results in simple regressions,
but there is still a need for more appropriate testing models in regards to the investor's
buyback portfolio. Specifically for the BHR model, I can bypass most of the issues inherent
in linear regressions with a bootstrap approach.
5.3.1 Bootstrap approach
A bootstrap approach is used in Ikenberry et al. (1995) who reference Brock et al. (1992)
as their source. In a bootstrap approach, issues regarding standard errors and distributions
will also be prevalent in the formation of so-called pseudo-portfolios.
For each run, a security is drawn at random for each security in the buyback portfo-
lio. Each randomly drawn security must belong to the same size and valuation quantile
as the original announcement firm. Only securities that are available at the beginning of
the incumbent year on the NYSE can be matched (mark-assignment rule). Total returns
are measured in the same way as before where returns (equally-weighted) for each pseudo-
portfolio and size and P/B quantiles are remeasured at every 12-month increment. The
only difference is that I omit the rolling sample exclusions of repurchase announcements
from both the pseudo-portfolios and buyback portfolios (the buyback portfolios' perfor-
mance is therefore slightly different from the original method). For each pseudo-portfolio I
measure the one-, two-, and three-year average abnormal performance for announcements
made between January 1999 and December 2014. A histogram of the three-year abnormal
performance for 500 pseudo-portfolios can be seen in figure 5 and all descriptive statistics
are available in table 4. I only test all announcements in the bootstrap approach, along
with the results from only buying securities during recessions and expansionary periods. I
choose all announcements because its average return is higher compared to the infrequent
and frequent samples, and its sample size is larger.
Associated p-values can be measured for the buyback portfolios' abnormal returns, rep-
resented by theta, θ, in equation 3,
p(θ) = 1− F (θ), (3)
where F (θ) is the cumulative distribution function of theta under the null hypothesis.
As can be seen in figure 5, the distribution in returns is rather narrow which is the result of
many observations included in the averages. It is also the result of the rather large monthly
security samples, where the average selection for each month is 25 buyback firms, a figure
large enough to inhibit sizeable deviations from zero. Because I also remeasure returns on
an annual basis, within-sample outliers become more tame, and the annual remeasurement
21

5.3 Significance testing 5 RESULTS
of size and P/B quantiles improves benchmarking which also work against deviations.
Figure 5: Bootstrap distribution: 500 pseudo-portfoliosCompounded three-year abnormal returns, all announcements
0
10
20
30
40
50
60
70
80
90
100
Ob
serv
atio
ns
3-year abnormal returns – Bins in 0,5% intervals
Bin Associated with
Buyback Portfolio
Source: Thomson Reuters, author 's own calculationsDescription: The pseudo-portfolios are created via a bootstrap approach where every repurchase firm israndomly replaced with a firm of the same size and valuation quantile, but also limited to themark-assignment rule. This process is done for each run and repeated 500 times. Figure 5 display thedistribution for the three-year holding period, please see table 4 for further descriptive data.
Table 4: Descriptive statistics for bootstrap methods, all announcements
Buyback Pseudo-Portfolios
Investment Horizon Portfolio p(τ) Average Max Min
1-year Abnormal Returns 1.2%* 0.034 0.0% 2.3% -2.0%
2-year Abnormal Returns 2.4%* 0.028 0.1% 4.8% -3.2%
3-year Abnormal Returns 3.6%* 0.026 0.4% 6.5% -3.7%
NBER Recessions, 3y ARs -1.4% 0.684 1.8% 28.9% -15.3%
> GDP Growth Trend, 3y ARs 4.7%** 0.007 0.4% 5.4% -4.0%
Sources: Thomson Reuters, author 's own calculationsDescription: p-values; * p < 0.05, ** p < 0.01, *** p < 0.001. The values of NBER Recessions and > GDPGrowth Trend simulate the average of an investment strategy buying firms with a repurchase announcementduring specific time intervals. Recessions is given by NBER and expansionary periods are above averagereal GDP growth. The average is measured between 1990 and 2014, quarterly.
22

5.3 Significance testing 5 RESULTS
5.3.2 Fama and French three-factor model
A second method applicable for explaining abnormal portfolio returns is the Fama and
French three-factor model, a variant of the CTIME method. In Fama & French (1992), they
introduce a new and improved method of measuring risk and expected returns by adding
additional explanatory variables to the basic CAPM model. The Fama-French factor model
quickly surpassed the CAPM model both in the academic community and by investment
professionals alike. In their first factor model Fama and French control for market forces
that have been consistent over long periods of time which are: value stocks outperform
growth, and small-cap outperforms large-cap. These two market forces along with the
market excess return (either value or equally-weighted market return less the risk-free rate)
make up the Fama-French three-factor model.
Since my sample only consist of securities from the NYSE it would not be transferable to
simply download the data from the Kenneth French data library as their factors also include
the returns from securities listed on the NASDAQ and AMEX exchanges. Instead I mimic
their method with my sample. For each year I download market capitalization and total
equity as of December 31st from the preceding year. The sample is divided into small-cap
and large-cap by the median firm, and further divided into value stocks (<30th percentile
P/B ratios), neutral (percentiles 30 - 70), and growth (>70th percentile). This creates 6
portfolios ranging from small-value to large-growth. Consistent with the mark-assignment
rule, only securities available on the NYSE at the beginning of the year are used in the
creation of the 6 portfolios.
I measure monthly total returns where the buyback portfolio will resemble an investor
buying the companies that had a share repurchase announcement in the preceding month,
starting in January 1999. The investor will add securities to his or her portfolio at the
end of each month and will hold each security for thirty-six months (the regression starts
with returns in January 2000, which gives the investor enough time to build a portfolio
with a sufficient number of securities). Returns are equally-weighted and compounded on
a monthly basis. A similar approach is used in Ikenberry et al. (1995) and the regression
results in table 5 adhere to equation 4,
rbp,t − rf,t = α+ βm(rnyse,t − rf,t) + βs(rsmall,t − rlarge,t) + βpb(rvalue,t − rgrowth,t) + εt, (4)
where the buyback portfolios' monthly returns, rbp, less the risk-free rate, rf , are re-
gressed against the market excess return, rnyse − rf , the difference between the three small
and three large portfolios, rsmall − rlarge, and the difference between the two value portfo-
lios and the two growth portfolios, rvalue − rgrowth. Table 5 shows the results for monthly
returns between January 2000 and December 2015 (slightly different dates for occasional
announcements due to limited data).
23

5.4 Potential criticism 5 RESULTS
Table 5: Regression results from adjusted Fama-French three-factor modelMonthly returns January 2000 - December 2015
Coefficients
Portfolio α Rm - Rf (βm) SML (βs) VMG (βpb)
All Announcements 0.13 0.91*** -0.25*** 0.00(0.092) (0.000) (0.000) (0.990)
Frequent Announcements 0.12 0.89*** -0.22*** -0.03(0.132) (0.000) (0.000) (0.512)
Genuine Announcements 0.12 0.91*** -0.18* -0.04(0.128) (0.000) (0.017) (0.553)
Occasional Announcements -0.01 0.98*** -0.29*** -0.05(Jan 2002 - Dec 2015) (0.947) (0.000) (0.000) (0.362)
Sources: Thomson Reuters, Kenneth R. French Data Library for risk-free returns, rfDescription: p-values in parentheses; * p < 0.05, ** p < 0.01, *** p < 0.001; Regressed in Stata, robuststandard errors, 95% confidence intervals.
The three factor-model shows that the buyback portfolios are highly correlated with the
market, as would be expected considering the number of securities included in the buyback
portfolios. There is also a significant negative relationship between the buyback portfolios
and SML (small minus large) which show that the buyback portfolios underperform when
small-cap stocks outperform. This is likely the result of a large-cap overrepresentation
among buyback firms. The alpha value is not significant which contradict the pseudo-
portfolio estimations, a chasm predicted by Fama (1998) on the discussion of model issues
in long-run return studies. Although the significance level decreases, values are quite similar
to the BHR portfolios. Three-year monthly compounding of all announcements from the
factor model equates to 4.8% (1.001336 − 1), which can be compared to the BHR portfolio
average return of 4.1%.
5.4 Potential criticism
(i) My paper omits important variables such as employee option programmes and actual
shares bought back. Earlier articles found these factors to be informative and significant in
the context of abnormal returns. (ii) The factor-model can be criticized on independence
issues since the simulation will result in the investor buying the same security multiple times.
Frequent announcers will then be overrepresented. (iii) Nowhere do I include transaction
costs which will likely remove a considerable chunk from the gross results. Transaction
costs will be most prevalent in the factor model. (iv) The inclusion of a value-weighted
24

6 CONCLUSIONS
BHR model may have helped to bridge the gap between the equal-weighted BHR and
CTIME model, thus providing evidence of model issues.
6 Conclusions
At face value, there appears to be a minor positive drift by pursuing a buy-and-hold in-
vestment strategy based on buying firms announcing a share repurchase programme. But
the drift is rather small (even smaller with transaction costs) and its significance model-
dependent. However, I find investors are better off pursuing a buy-and-hold investment
strategy during expansionary economic periods. Companies pursuing buybacks during re-
cessions are indirectly increasing their leverage which can have knock-on effects, and dis-
posing of cash that could otherwise be used in more productive means such as efficiency
investments and bargain-hunting M&A. Earlier literature note that investors should avoid
companies undergoing option-funding programmes or simultaneous insider-selling. My con-
tribution help investors assess additional company characteristics in the context of buy-
backs. First, I caution investors from investing in companies with a considerable cash
position. These companies may have limited future prospects and are returning cash to
shareholders, instead of pursuing value-enhancing investments. Secondly, I advise from
buying CapEx intensive firms. These firms are likely to significantly diminish their invest-
ing activities going forward and the repurchase announcement signals this change in capital
allocation structure. The lack of confirming traits of undervaluation in conjunction with
outperformance during expansionary periods suggest insiders are no better than the market
to forecast macroeconomic indicators as a basis for timing stock purchases.
Complementary research in this area would be investor-surveys so we can gain a better
understanding of the investor community's interpretation of buybacks and how a repurchase
announcement can change an investment case.
25
REFERENCES REFERENCES
References
Bauman, W. S., Conover, C. M. & Miller, R. E. (1998), ‘Growth versus value and large-cap
versus small-cap stocks in international markets’, Financial Analysts Journal 54, 75–89.
Bonaime, A. A. & Ryngaert, M. D. (2013), ‘Insider trading and share repurchases: Do
insiders and firms trade in the same direction?’, Journal of Corporate Finance 22, 35–53.
Brav, A., Graham, J. R., Harvey, C. R. & Michaely, R. (2005), ‘Payout policy in the 21st
century’, Journal of Financial Economics 77, 483–527.
Brock, W., Lakonishok, J. & LeBaron, B. (1992), ‘Simple technical trading rules and the
stochastic properties of stock returns’, The Journal of Finance 47, 1731–1764.
Chan, K., Ikenberry, D. L. & Lee, I. (2007), ‘Do managers time the market? evidence from
open-market share repurchases’, Journal of Banking & Finance 31, 2673–2694.
Chan, K., Ikenberry, D. L., Lee, I. & Wang, Y. (2010), ‘Share repurchases as a potential
tool to mislead investors’, Journal of Corporate Finance 16, 137–158.
Chan, K., Ikenberry, D. & Lee, I. (2004), ‘Economic sources of gain in stock repurchases’,
The Journal of Financial and Quantitative Analysis 39, 461–479.
Chun, L. I., Ejara, D. D. & Gleason, K. C. (2010), ‘An empirical analysis of european stock
repurchases’, Journal of Multinational Financial Management 20, 114–125.
Comment, R. & Jarrell, G. A. (1991), ‘The relative signalling power of dutch-auction and
fixed-price self-tender offers and open-market share repurchases’, The Journal of Finance
46, 1243–1271.
Conrad, J. & Kaul, G. (1993), ‘Long-term market overreaction or biases in computed re-
turns?’, The Journal of Finance 48, 39–63.
De Bondt, W. F. & Thaler, R. H. (1989), ‘Anomalies: A mean-reverting walk down wall
street’, Journal of Economic Perspectives 3, 189–202.
Dittmar, A. K. (2000), ‘Why do firms repurchase stock’, The Journal of Business 73, 331–
355.
Fama, E. (1998), ‘Market efficiency, long-term returns, and behavioral finance’, Journal of
Financial Economics 49, 283–306.
Fama, E. F. & French, K. R. (1992), ‘The cross-section of expected returns’, The Journal
of Finance 47, 427–465.
26
REFERENCES REFERENCES
Grullon, G. & Michaely, R. (2002), ‘Dividends, share repurchases and the substitution
hypothesis’, Journal of Finance 58, 1649–1684.
Ikenberry, D., Lakonishok, J. & Vermaelen, T. (1995), ‘Market underreaction to open-
market share repurchases’, Journal of Financial Economics 39, 181–208.
Jagannathan, M. & Stephens, C. P. (2003), ‘Motives for multiple open-market repurchase
programs’, Financial Management 32, 71–91.
Kahle, K. M. (2002), ‘When a buyback isn't a buyback: open market repurchases and
employee options’, Journal of Financial Economics 63, 235–261.
Lakonishok, J. & Vermaelen, T. (1990), ‘Anomalous price behavior around repurchase ten-
der offers’, The Journal of Finance 45, 455–477.
Lam, E., Ma, T., Wang, S. & Wei, K. J. (2013), ‘What is the relation between cash holdings
and stock returns’, 26th Australian Finance and Banking Conference .
Lyon, J. D., Barber, B. M. & Tsai, C.-L. (1999), ‘Improved methods for tests of long-run
abnormal stock returns’, The Journal of Finance 54, 165–201.
Strege, D. G. (1999), ‘Employee strategies for stock based compensation’, SAGE Journals
Compensation and Benefits Review 31.
Thorndike, W. N. (2012), The outsiders: Eight unconventional CEOs and their radically
rational blueprint for success, Harvard Business Review Press.
Vermaelen, T. (1981), ‘Common stock repurchases and market signalling: An empirical
study’, Journal of Financial Economics 9, 139–183.
Yook, K. C. (2010), ‘Long-run stock performance following stock repurchases’, The Quar-
terly Review of Economics and Finance 50, 323–331.
27
A SUPPORTING TABLES
Appendix
A Supporting tables
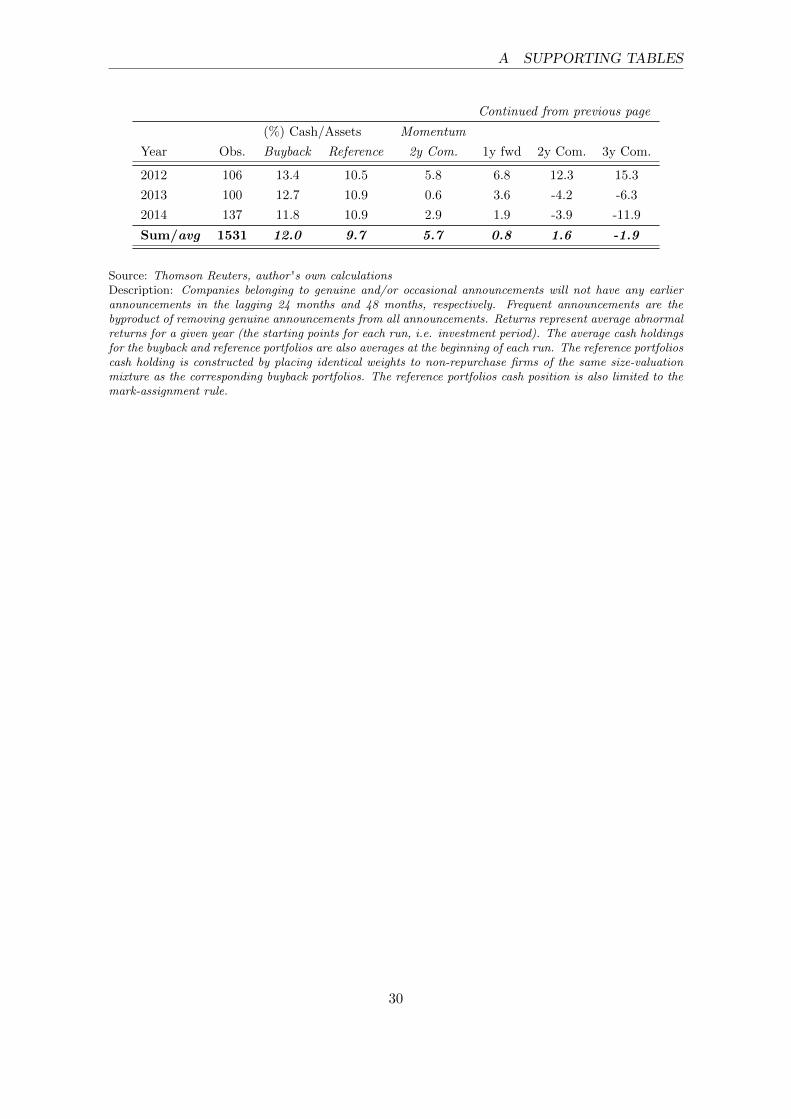
Table 6: Buyback portfolio abnormal returns & initial cash positionsAverage monthly values in %, except observations (sum)
(%) Cash/Assets Momentum
Year Obs. Buyback Reference 2y Com. 1y fwd 2y Com. 3y Com.
All Announcements
1999 733 8.4 5.1 -2.9 -8.7 -4.6 8.4
2000 659 7.4 5.6 3.8 6.2 14.4 20.3
2001 398 9.3 6.9 17.5 1.7 -2.3 -3.4
2002 338 11.7 7.1 31.1 5.2 6.5 0.5
2003 395 12.6 7.8 14.7 4.2 8.1 3.6
2004 503 11.8 8.9 11.0 -1.7 -5.7 -12.4
2005 603 11.0 9.4 1.0 -2.9 -8.0 -18.8
2006 624 11.4 10.7 2.7 -4.6 -11.5 -3.8
2007 727 10.9 8.6 -1.5 -6.7 -1.3 -1.7
2008 499 11.4 8.0 8.5 4.8 4.2 6.6
2009 203 13.8 10.5 14.3 -1.7 -3.7 3.1
2010 432 14.2 9.8 9.5 -1.2 5.5 7.1
2011 509 13.6 10.0 2.8 7.8 11.7 14.5
2012 419 13.8 9.3 10.7 3.6 6.3 20.0
2013 463 12.9 10.2 5.2 2.1 10.6 14.1
2014 603 11.3 10.5 6.0 7.8 6.4 7.4
Sum/avg 8108 11.6 8.7 8.4 1.0 2.3 4.1
Frequent Announcements
1999 437 8.6 6.4 -2.2 -1.2 4.6 11.5
2000 422 7.1 6.1 -3.0 8.1 19.4 29.8
2001 258 9.0 7.2 14.6 5.5 1.8 -3.0
2002 192 13.2 8.2 36.0 1.5 -7.3 -14.5
2003 222 14.0 9.4 10.8 4.3 10.9 7.0
2004 293 11.9 10.1 9.6 -0.8 -3.2 -10.2
2005 365 11.4 9.9 0.9 -1.4 -8.0 -19.5
2006 431 11.0 9.7 -0.9 -6.0 -14.6 -8.0
2007 500 10.6 9.0 -3.6 -6.8 -1.0 0.6
2008 320 11.3 8.9 9.7 6.8 6.3 5.9
2009 139 14.4 11.3 17.5 -10.3 -13.2 -6.1
2010 226 15.5 11.4 16.6 3.0 6.8 9.1
Continues on the next page
28

A SUPPORTING TABLES
Continued from previous page
(%) Cash/Assets Momentum
Year Obs. Buyback Reference 2y Com. 1y fwd 2y Com. 3y Com.
2011 264 14.8 12.0 0.0 7.5 13.1 21.0
2012 275 14.0 10.7 11.1 4.0 8.4 19.6
2013 292 12.8 10.1 8.6 1.5 12.6 13.8
2014 373 10.9 10.5 9.2 9.3 8.1 13.4
Sum/avg 5009 11.9 9.4 8.3 1.4 2.7 4.4
Genuine Announcements
1999 137 8.6 5.2 3.0 -10.7 -8.6 5.0
2000 152 8.6 5.6 18.8 0.7 -1.1 -2.5
2001 68 10.4 6.6 30.2 -2.6 -2.8 2.8
2002 110 10.9 6.8 5.5 8.6 26.2 14.9
2003 131 10.8 8.0 17.6 8.4 13.8 16.6
2004 155 12.0 9.1 11.9 -3.0 -9.4 -10.7
2005 188 10.3 9.0 -4.0 -4.9 -5.7 -9.5
2006 153 12.2 10.1 12.1 1.4 5.4 6.7
2007 173 12.1 8.0 1.0 1.4 -0.8 -6.2
2008 121 11.0 7.9 6.6 -1.1 -4.0 -3.9
2009 43 12.0 10.5 2.9 -4.6 -7.6 -4.7
2010 169 13.0 10.8 4.0 -0.7 3.9 2.9
2011 219 11.6 10.4 5.9 5.6 7.3 3.7
2012 126 13.1 9.9 5.3 4.7 7.7 14.7
2013 147 13.1 11.5 0.0 1.5 -1.3 5.1
2014 194 12.0 10.5 1.0 2.1 0.5 -4.4
Sum/avg 2286 11.4 8.7 7.7 0.5 1.6 2.0
Occasional Announcements
1999 n\a n\a n\a n\a n\a n\a n\a2000 n\a n\a n\a n\a n\a n\a n\a2001 90 13.4 6.7 34.9 -6.9 -9.9 -16.1
2002 76 12.8 8.1 11.1 6.6 24.3 13.8
2003 84 9.2 8.6 15.3 5.3 7.1 10.6
2004 139 12.3 9.5 13.3 -2.7 -5.5 -9.2
2005 163 11.5 9.4 -4.1 -5.2 -4.1 -9.5
2006 132 10.7 9.4 13.2 3.6 13.5 10.8
2007 142 13.5 9.0 -3.6 0.8 -4.8 -9.3
2008 126 10.1 8.7 8.1 2.1 -6.3 -5.9
2009 41 11.5 9.6 -5.4 -10.4 -7.5 -2.8
2010 68 13.4 11.8 -7.1 -3.9 0.7 -10.1
2011 127 11.7 12.0 -5.6 7.3 9.4 4.3
Continues on the next page
29
A SUPPORTING TABLES
Continued from previous page
(%) Cash/Assets Momentum
Year Obs. Buyback Reference 2y Com. 1y fwd 2y Com. 3y Com.
2012 106 13.4 10.5 5.8 6.8 12.3 15.3
2013 100 12.7 10.9 0.6 3.6 -4.2 -6.3
2014 137 11.8 10.9 2.9 1.9 -3.9 -11.9
Sum/avg 1531 12.0 9.7 5.7 0.8 1.6 -1.9
Source: Thomson Reuters, author 's own calculationsDescription: Companies belonging to genuine and/or occasional announcements will not have any earlierannouncements in the lagging 24 months and 48 months, respectively. Frequent announcements are thebyproduct of removing genuine announcements from all announcements. Returns represent average abnormalreturns for a given year (the starting points for each run, i.e. investment period). The average cash holdingsfor the buyback and reference portfolios are also averages at the beginning of each run. The reference portfolioscash holding is constructed by placing identical weights to non-repurchase firms of the same size-valuationmixture as the corresponding buyback portfolios. The reference portfolios cash position is also limited to themark-assignment rule.
30