investment on-it-students-perspective
TRANSCRIPT
INTERNATIONAL JOURNAL OF SCIENTIFIC & TECHNOLOGY RESEARCH VOLUME 4, ISSUE 07, JULY 2015 ISSN 2277-8616
145 IJSTR©2015 www.ijstr.org
Investment On IT: Students Perspective
Samsul Alam Abstract: The focus of this study is to seek the relevance for implementing in Information Technology by students in Dhaka University. The research takes into account 50 students studying at different disciplines. The respondents were visited randomly to get the relevant data. The paper applies statistical tools e.g. SPSS on the information received and analyzes the results towards the solution. The result of the study suggests that students‘ academic quality and knowledge enhancement have significantly strong relationship with investment in IT. However, the findings of this exploratory study offer insights that the money invested in IT for academic purpose is more advantageous than otherwise be invested especially for those whose academic curriculum mainly decorated in accordance with the modern up-to-date era of Information Technology. On the basis of intellectual interaction between premises and experiences gathered during study, investment on IT will help concerned students understanding how important IT is for their study. Index Terms: Intellectual interaction, Investment insights, IT importance, IT Payoff, Relationship of IT investment, Relevance of IT usage, Statistical tools, Up-to-date era of information technology.
————————————————————
1. INTRODUCTION The overriding message that can be gleaned from most current research on the implementation of computer-based technology in education is that technology is a means, not an end; it is a tool for achieving instructional goals, not a goal in itself. And yet, many schools and districts have invested in computer-based technology before establishing clear plans for how to use this important tool. In today‘s world, computer-based technology is not a frill, but an important component of any modern curriculum. During the last decade, technology expenditure by students is seen to be higher in Bangladesh. Since no one wants these funds to be wasted, educators need insight into how to maximize the positive impact of their technology. This paper is for educators and policymakers who want to learn from the research and experiences of others about how to make their technology investment a wise one. To address this issue, I summarize major research findings related to technology use and, based on these findings,ttempt to draw out implications for how to make the most of technology resources. This paper will focus on pedagogical and policy issues related to technology, not smaller issues such as what hardware configurations or software to use. This is not a ―how to‖ paper, but rather a paper about the key policy issues to be addressed in order to make technology use the most effective. Rather than attempting a comprehensive review of the literature, this paper draws on a selection of research studies. It was tried to choose studies that were the most methodologically sound. I favored those respondents who are the change maker in this sector. The students who doubt about whether he/she will invest in IT or not for their academic progress and other will be aware by being acknowledged of the study.
2. Background of the study The term ―technology‖ can be used to mean a very wide variety of things, from computers to pencils. In this paper, I use the term to refer broadly to computer-based tools —
hardware and software, the Internet, and computer-based multimedia that have impact on students‘ performance. In the early sections of the paper, it was begun by describing research on the relation between technology and student learning — addressing the question of what kinds of impact technology has on education. In order to understand the impact of technology on education, it is helpful to consider the purposes to which technology is applied. When students are learning ―from‖ computers, the computers are essentially tutors. In this capacity, the technology primarily serves the goal of increasing students‘ basic skills and knowledge. In learning ―with,‖ by contrast, students use technology as a tool that can be applied to a variety of goals in the learning process, rather than serving simply as an instructional delivery system. Students use the technology as a resource to help them develop higher order thinking, creativity, research skills, and so on. After discussing research on each of these kinds of technology, we turn to the ―lessons learned‖ from these studies and discuss a variety of key conditions that are necessary for technology to improve education. Information technology (IT) is changing the competitive dynamics in the present educational system. For example, students are using technology to improve their educational efficiency and knowledge to adapt with the current competitive world. In general, investment on IT by the students plays a vitally important role to enhance their educational excellence. The aim of this research is to find out the payoff from investing on IT by the students that will help take the exact decision whether the students will adopt IT or not. The key informants of this research are from undergraduate, graduate and post graduate students in Dhaka University. Though the explored study is using limited resources but its implication can shade light on very important aspects of IT payoff. This research covers three IT investments by the students e.g. PC, Smartphone, and Internet.
2.1 Statement of the problem This study will be conducted ―To measure the payoff from the IT investment by the students.‖
2.2 Objective of the Study This is a research work done by University students. The study objectives are as follows:
To take the right decision whether they will invest on IT or deposit in the bank
___________________
Samsul Alam is currently pursuing MBA(Appeared) & BBA program in Management Information Systems (MIS) in University of Dhaka, Bangladesh, PH-+8801922322724. E-mail: [email protected],

INTERNATIONAL JOURNAL OF SCIENTIFIC & TECHNOLOGY RESEARCH VOLUME 4, ISSUE 07, JULY 2015 ISSN 2277-8616
146 IJSTR©2015 www.ijstr.org
To review the efficiency of the IT investment by the students
To identify the percentage of students those who are using IT in their academic task
Explore the perception of the students regarding the use of IT in accessing information
Find out the change in the level of education among the students due to IT adoption
Find out the opinions about the importance of smartphone for their academic course
2.3 Objective of the Study The following limitations have been identified for the
preparation of research report: Lack of in-depth knowledge and analytical ability for
writing such research report Lack of sufficient secondary data Difficulty in collecting information from students of
diverse backgrounds Limitation in disclosing some data and information for
various reasons
2.4 Objective of the Study The paper covers the following aspects sequentially:
Introduction of the study Literature Review of previously conducted research
on the study Objectives of conducting the study Methodology used in conducting the research Description of the data used in the study Analysis of the obtained data in the study Findings of the study Recommendation for the users Conclusion of the study Future study
3 LITERATURE REVIEW With respect to IT sector payoff, foreign and some national experts undertook some studies. A study (Lindahl and Folkesson, 2012) studied with 31 preschool teachers, to examine the benefits and challenges of application of computers in preschool education. Research results have shown that the multiple conflicts of emotion on the use of computers. The study also have been evaluated the fitting the use of computer to the traditions of the applications in preschool education. Computer applications can be included in preschool education by understanding and taking into account the traditions, the values and habits of teachers related to the educational settings. If teachers feel threat to their values, traditions, habits in educational settings; they can exhibit a negative attitude against the use of computers. As a result, the computer applications are suggested to use provided that it is suitable to the educational traditions of teachers. (Ihmedieh in Jordan, 2009) of preschool teachers‘ beliefs and practices on use of computers in applications for teaching the reading and writing. Two scales were used; ―belief scale and ―practice scales for study evaluation. 154 preschool teachers participated a randomly selected survey and interviewed with 12 teachers. According to the results; practice sale is more determinant than the belief scale in use of computers in applications for teaching the reading and writing. Analyzing the use of computers in education, teachers‘ teaching habits in the classroom are more important than their
beliefs. Besides, trained teachers are using computers for teaching purposes more than the untrained teachers. Nearly every student at the university can afford to own a smartphone. The findings also suggest that students fully utilized smartphones as a regular mobile phones as well as a traditional computer and as a means to get connected to online social networks. Unfortunately the findings also suggest that the students lack of using smartphones as a means to support learning. Most of the students of Dhaka University do not use smartphone for their academic purposes properly. Most of the time they access internet through smartphone for using Facebook. Some of them use smartphone for academic purposes rightly. Besides depend on properly use of smartphone for academic purposes, postgraduate students are better than undergraduate students. Research shows that educators do not have very positive attitudes towards smartphone as tools for learning in higher education to date (Imran Hossain, 2014). (Sang-Zo Nam, 2013) surveyed how students of a university in South Korea use smartphones. Based on survey data from 135 participants, the most preferred usage and usual usages of the smartphone are evaluated. Perceived and relative significance of satisfaction to usages of the smartphone according to demographic variables such as gender and academic year have been evaluated. The results indicate that the most important usage of smartphone is ‗real-time communication‘ rather than ‗telephone‘ or ‗internet search‘. ‗Study‘ usage gets the least response in usual usage and the most important usage of smartphone. ‗Real-time communication‘ usage received the most affirmative response in serviceability too. The utilization of mobile phone services in the educational environment, explore the nature of mobile phone use among university students and investigate the perception of university students on mobile phone uses in library and information services. The study describes the current status of wireless technology. It also identifies different wireless phone application for mobile phones which facilitate and enlarged the education (Karim et al., 2006). (Nortcliffe & Middleton, 2013) explored the hypothesis that students are being innovative in the ways in which they are using their smart devices to support their formal and informal learning. The study involved five students who own smart devices who were invited to discuss their ownership of smartphone and tablet technologies and the ways they used them in their studies. The students first completed a short questionnaire and were then interviewed in small groups. The results agree with previous research into student use of smart devices and describe autonomous engagement facilitated by personally owned smart technologies. The study identifies continuous patterns of pervasive engagement by students and concludes that more thought should be given to disruptive innovation, digital literacy and employability. A study showed the efficiency of the use of paper and electronic dictionaries for learning vocabulary in an experimental study. The experimental group used electronic dictionaries while the control group used paper dictionaries. The results of the experiment revealed that the experimental group improved significantly regarding their vocabulary learning compared to the control group. Likewise, Jian, Sandnes, Law, Huang, and Huang (2009) investigated the role of electronic dictionaries in English learning of undergraduates of engineering and humanities. They reported

INTERNATIONAL JOURNAL OF SCIENTIFIC & TECHNOLOGY RESEARCH VOLUME 4, ISSUE 07, JULY 2015 ISSN 2277-8616
147 IJSTR©2015 www.ijstr.org
that the speed of reference was a very important merit of using electronic dictionaries while multimedia properties were not considered as a significant benefit (In Iran, Zarei and Gujjar, 2012). Many students (with 600 samples) in the Municipality of the Brong-Region of Ghana had learnt how to use the Internet from their teachers and were more likely to use the Internet Cafés as access point. Many of them also believed the cost of access was expensive. The paper also showed that more tertiary students are using the Internet technology to look for information for assignments. The Internet has also led to improved communications among tertiary students. Google and Facebook were the most preferred search engine and social network respectively. Poor Internet speed, inadequate number of computers in computer laboratories, and inadequate user skills were observed as the leading constraints to Internet use. Since a significant number of tertiary students are using the Internet, addressing the hindrances to its use will enhance teaching, research and learning (Charles Arthur mr. and Paul Osei Brafi, 2013).
4 RESEARCH METHODOLOGY This research report tries to fulfill all the study objectives by the methodology stated below:
4.1 Data Collection In order to make the report more meaningful, both the primary and secondary data have been collected.
4.1.1 Primary Data The primary data sources were a questionnaire survey. For this reason, I prepared a questionnaire regarding the use of IT by the students. I took opinions regarding IT from fifty undergraduate and graduate students of Dhaka University. 4.1.2 Secondary Data Secondary data sources were articles on the related factors in the conceptual framework of the report, Books regarding IT investment and website.
4.2 Analytical model and scaling technique In order to make the report more meaningful, both the primary and secondary data have been collected. 4.2.1 Analytical model An analytical model is a set of variables and interrelationship designed to represent, in whole or in part, some real system or process. Models can have many different forms. Here I show the geographical model. A geographical model provides a visual picture of the relationships between variables. Geographical model is visual. It is used to isolate variables and to suggest direction of relationships but are not designed to provide numerical results. It is logical preliminary steps.to develop mathematical models. The data has been analyzed using IBM SPSS Statistics-20 and Microsoft Excel-2010.
Figure 1: Factor influence for academic performance
4.2.2 Scaling technique I have used 5 point Likert scale, which is a part of non-comparative scaling technique. Model specification: The purpose of this analysis is to measure the relative importance of each independent variable on the dependent variable. Here, I have used multiple regressions in order to find out how independent variables affect dependent variables. Mathematical Model: Y= β0 + β1X1 +β2X2 + β4X4 + ei Where, Y= Academic performance (CGPA) of the students X1 = Personal computer X2 = Smartphone X4= Internet β=parameter/ coefficient of the model e= error of the model.
5 DESCRIPTION OF THE STUDY 5.1 Overview of IT investment (IT tools used by
students) The undergraduate, graduate and post-graduate students involve in the following IT investments: 5.1.1 Personal Computer (PC) Personal computers or PC‘s are probably one of the things that anyone would like to have these days. They can be used for playing games, research purposes and even for communication. PC used by students: Categories of computer used by students are as follows:
Mini Computer Micro Computer Desktop Computer Laptop Computer Handheld Computer (PDAS) Tablet Computer
Reasons for buying PC by the students:
To improve Research To enhance the presentation skill To perform assignment tasks To get the up-to-date information about home and
abroad

INTERNATIONAL JOURNAL OF SCIENTIFIC & TECHNOLOGY RESEARCH VOLUME 4, ISSUE 07, JULY 2015 ISSN 2277-8616
148 IJSTR©2015 www.ijstr.org
To connect with the social media like Facebook, Twitter and professional site like LinkedIn and so on
To influence Career Aspirations To gain Enhanced Creativity To make quick and easy information transfer To facilitate educational activities To improve grade in the examination To use as a medium of entertainment To use as a medium of communication
Reasons for buying Tablet PCs:
It‘s portable It‘s a great e-book reader It‘s comfortable to use It‘s very functional It uses a reliable OS It has powerful social networking tools It‘s affordable It‘s great for meetings It‘s better than a smartphone It‘s a better user experience
5.1.2 Smartphone Smartphone is one the most popular communication devices in this modern world. It is a mobile phone running a complete operating system in a manner similar to a traditional computer, which offer advanced computing abilities and connectivity options. These features enable new kinds of mobile services that in turn shape the usage habits of smartphone users (Alfawareh & Jusoh, 2014). University students are among the highest contributors to the increasing number of smart phone sales. The factor that most influences the increase in smart phone usage is to do many of the things that were once reserved for a personal computer, such as accessing the Web at higher speeds, viewing/editing documents, downloading files, creating music playlists, or managing multiple email/messaging accounts. Key reasons for buying Smartphone by the students: The following outcomes from Smartphone facilitate the students‘ academic performance:
To facilitate communication To solve any educational problem by contacting with
teachers, students etc. To use internet for accessing in the vast area of
information To get the facilities like PC To use like a camera or recorder To use Bluetooth infrared technology to transfer the
data from smartphone to smartphone or to computer and computer to smartphone without any cost in a few seconds.
Easy handle and carry because of its light weight To use as a digital dictionary To get up-to-date information To use as a medium of entertainment Easy to make a call Support various apps To send and receive Email instantly To have GPS service or Google earth To send and receive Short message service easily Video calling facilities To know Weather update
Self-camera and so on. 5.1.3 Internet The Internet, sometimes called simply "the Net," is a worldwide system of computer networks - a network of networks in which users at any one computer can, if they have permission, get information from any other computer (and sometimes talk directly to users at other computers). The Internet is a vital part of the education process; resources for learning and educating are implemented into lesson plans and homework every day. Students and teachers can access unlimited information to broaden their education. With Internet access by students, there is almost no limit to what students can learn. Reasons for using internet by the students:
a) Learning diverse cultures: There is so much that students can do with the Internet. Not only can they communicate with international students, they can gain from others' knowledge and experiences, participate in chat rooms, share ideas and solutions and learn about the many diverse cultures out there.
b) Facilitate interactive learning: The interactive learning that the Internet provides can help students with broader spectrum of knowledge increment.
c) Adjustment with different learning styles: Individual teaching techniques can become more available, which has been proven to be a factor in student achievement.
d) Linking with the teachers: Students have the chance to be able to learn at more than one place simultaneously. They may be in a small town but through the Internet, they can be linked to teachers in more populated areas.
e) E-mail: E-mail is an online correspondence system. With e-mail a student can send and receive instant electronic messages, which work like writing letters & delivered instantly.
f) Access to Information: The Internet is a virtual treasure trove of information. Any kind of information on any topic under the sun is available on the Internet. The ‗search engine‘ can help students to find any data subject that they need.
g) Shopping: Along with getting information on the Internet, we can also shop online. There are many online stores and sites that can be used to look for products as well as buy them using credit card. We do not need to leave our house and can do all our shopping from the convenience of our home.
h) Online Chat: There are many ‗chat rooms‘ on the web that can be accessed to meet new people, make new friends, as well as to stay in touch with old friends.
i) Downloading Software: This is one of the most happening and fun things to do via the Internet. We can download innumerable, academic, games, music, videos, movies, and a host of other entertainment software from the Internet, most of which are free.
j) Faster Communication: The foremost target of Internet has always been speedy communication and it has excelled way beyond the expectations. New innovations are only going to make it faster and more reliable. Now, students can communicate in a fraction
INTERNATIONAL JOURNAL OF SCIENTIFIC & TECHNOLOGY RESEARCH VOLUME 4, ISSUE 07, JULY 2015 ISSN 2277-8616
149 IJSTR©2015 www.ijstr.org
of second with a person who is sitting in the other part of the world.
k) Entertainment: Entertainment is another popular reason why many students prefer to surf the Internet. In fact, the Internet has become quite successful in trapping the multifaceted entertainment industry.
l) Social Networking: A student cannot imagine an online life without Facebook or Twitter. Social networking has become so popular amongst youth that it might one day replace physical networking. It has evolved as a great medium to connect with millions of people with similar interests. Apart from finding long-lost friends, students can also look for a job, business opportunities.
m) Online Services: The Internet has made life very convenient. With numerous online services, students can now perform all transactions online.
6 ANALYSIS OF THE DATA & FINDINGS OF THE
STUDY The analysis of the data will clarify the factors affecting the decision in case of IT investment. From the collected data, the estimation will be summarized. Alpha (α) - To find the effects of IT on Dhaka University students, a questionnaire-based survey was made. The questionnaire consisted of 32 questions. All these questions were specifically prepared and closely related with the use of IT. The collection of data was done at Dhaka university campus from 1 January to 25 January, 2015. A total of 51 questionnaires were distributed among students in Dhaka University of which 50 (response rate 98.03%) completed questionnaires were retrieved from students. The analysis performed below is based on survey feedback of students studying in DU. It will find out the real scenario for deciding on whether the student should invest on IT or not. Average Scores in Respondents’ Personal Information: As indicated earlier, 50 students participated in the survey. Among this information the following information was gathered from the study as for the respondents‘ personal data.
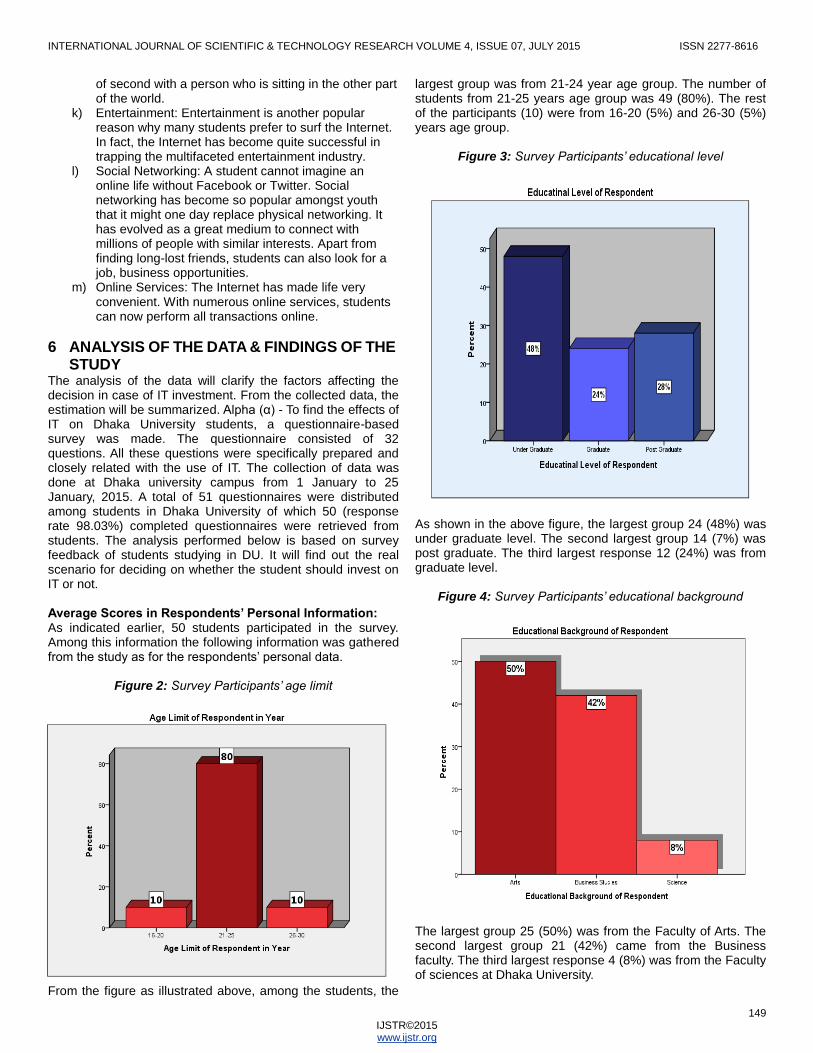
Figure 2: Survey Participants’ age limit
From the figure as illustrated above, among the students, the
largest group was from 21-24 year age group. The number of students from 21-25 years age group was 49 (80%). The rest of the participants (10) were from 16-20 (5%) and 26-30 (5%) years age group.
Figure 3: Survey Participants’ educational level
As shown in the above figure, the largest group 24 (48%) was under graduate level. The second largest group 14 (7%) was post graduate. The third largest response 12 (24%) was from graduate level.
Figure 4: Survey Participants’ educational background
The largest group 25 (50%) was from the Faculty of Arts. The second largest group 21 (42%) came from the Business faculty. The third largest response 4 (8%) was from the Faculty of sciences at Dhaka University.

INTERNATIONAL JOURNAL OF SCIENTIFIC & TECHNOLOGY RESEARCH VOLUME 4, ISSUE 07, JULY 2015 ISSN 2277-8616
150 IJSTR©2015 www.ijstr.org
Figure 5: Survey Participants’ birth place
The largest number of participants 39 (78%) came from rural areas. The 2nd largest group 7 (14%) was from small towns. The rest groups are 2 (4%) from metropolitan area and the city respectively. Average Scores in Respondents’ Personal Computer: The respondent given data are shown in the figure below for PC they use.
Figure 6: Survey Participants’ PC type
Among all respondents 23 (46%) do not use the computer, and the other who use PC include Laptop 18, Desktop 8 and 1 use Notebook.
Figure 7: Survey Participants’ time duration of using PC
Among all respondents who have a PC (27) used time duration include highest usage of (40.74%) of more than 3 years, then 1-2 years of about 22%, 1-6 months of about 19%, 2-3 years of about 4%.
Figure 8: Survey Participants’ investment in purchasing PC
Among all respondents having PC spent the cost for purchasing the PC allowed highest number in TK. 30,000-40,000 (about 48%), then 20-30 thousands, 40-50 thousands include about 19%. The highest cost occurred in about 7% respondent of more than 50 thousand TK.
Figure 9: Survey Participants’ PC brand
The Participants use mostly HP brand (about 30%). Again Dell (about 22%) and Samsung (about 15%) used by respondents.

INTERNATIONAL JOURNAL OF SCIENTIFIC & TECHNOLOGY RESEARCH VOLUME 4, ISSUE 07, JULY 2015 ISSN 2277-8616
151 IJSTR©2015 www.ijstr.org
Figure 10: Survey Participants’ money source of buying PC
The users collected money for buying the PC mainly from family income (about 74%), self-income and relative (about 11%) respectively. Figure 11: Survey Participants’ of using purpose
The users purchased the PC mainly for their academic and entertainment purposes (about 70%). Other purposes also include.
Figure 12: Survey Participants’ PC repairment cost
The participants spent 43% of tk. 500-1000 and 1000-1500 of 24%. Here other amount also occurred. Average Scores in Respondents’ Smart Phone Use: Among all respondents 32 (64%) students use Smart Phone. Other students don‘t have any Smart Phone. The other information regarding Smart Phone is as follows: Figure 13: Survey Participants’ Smart Phone usage duration
The users having SP used maximum time of during 1-2 (32%) years, 2-3 years (29%), and other time duration also has for using the Smart Phone.
Figure 14: Survey Participants’ Smart Phone brand used
The Participants use mostly Symphony brand (about 41%). Again Nokia (about 19%) and Samsung (about 16%) used by respondents.

INTERNATIONAL JOURNAL OF SCIENTIFIC & TECHNOLOGY RESEARCH VOLUME 4, ISSUE 07, JULY 2015 ISSN 2277-8616
152 IJSTR©2015 www.ijstr.org
Figure 15: Survey Participants’ Smart Phone investment amount
Among all respondents the cost for purchasing the SP allowed highest number in TK. 5,000-10,000 (about 60%), then 10-15 thousands (about 19%). Other amounts also included. Figure 16: Survey Participants’ Smart Phone usage purpose
The users purchased the SP mainly for communication (50%) and academic purposes (25%). Figure 17: Survey Participants’ Smart Phone usage mobile operator
The highest users use Grameen Phone (7) mobile operator for their Smart Phone. Again GP and BL used respectively by the
users. After GP the users use only BL 3 (6%) for their network. Figure 18: Survey Participants’ Smart Phone repairment cost
The participants spent 70% of tk. 100-500 and 500-1000 of 30%. Average Scores in Respondents’ Internet Use: 91% survey participants use intent for different purposes while rest (11%) don‘t. Other information regarding internet is follows: Figure 19: Survey Participants’ Internet usage device
Among 39 participants 15 users use internet on their smartphone while 12 students use PC and other 12 use both SP and PC.

INTERNATIONAL JOURNAL OF SCIENTIFIC & TECHNOLOGY RESEARCH VOLUME 4, ISSUE 07, JULY 2015 ISSN 2277-8616
153 IJSTR©2015 www.ijstr.org
Figure 20: Survey Participants’ Internet Service Provider
Among 39 participants mostly about 49% users use internet through WiFi connection, about 21% through broadband connection, about 10% by mobile network and so on.
Figure 21: Survey Participants’ Internet usage speed
Among 39 participants mostly about 46% users use internet through 512 kbps to 1 mbps, while others speed is 256-512 kbps about 31%. The highest speed found in the survey, the respondent has a 1-2 mbps that is of 10%. Again still now students use low speed bandwidth of 128-256 kbps.
Figure 22: Survey Participants’ frequency of Internet usage
Among all internet users (39) mostly about 49% use internet a
few times every day, 28% at least once a day, 21% at least once a day, the rest (3%) at least once a month.
Figure 23: Survey Participants’ monthly Internet cost
Among 39 participants mostly about 42% users spent TK. 100-200 in every month for using internet, 29% spent TK. 400-800, 26% 200-400, and the rest (3%) spent most 1200-2000 taka. Average Scores in Respondents’ Satisfaction Level: The participants who participated in the questionnaire fill in all 50 (100%) agreed on a matter that IT investment is beneficial for their academic purpose. Again how IT is beneficial in study is illustrated below:
Figure 24: Survey Participants’ opinion for IT importance
Mostly 53% respondents agreed that IT investment is strongly important for their academic purpose. Again 27% agreed IT is important, 16% moderately important. Only 4% respondents think IT investment for academic purpose is not necessary and thus they check the unimportant and strongly unimportant box.

INTERNATIONAL JOURNAL OF SCIENTIFIC & TECHNOLOGY RESEARCH VOLUME 4, ISSUE 07, JULY 2015 ISSN 2277-8616
154 IJSTR©2015 www.ijstr.org
Figure 25: Survey Participants’ opinion for IT benefit in study
Mostly about 63% respondents think that IT learning, saves time and increases productivity, helps skill development training, finds up-to-date information. Some respondents check solely some of the boxes.The respondents rated how IT is advantageous for their academic purposes. The rate is illustrated in the table below:
Figure 26: Statistical calculation for the rate given by respondent
Statistics
Grade of
IT for making it easier to
search for informatio
n relevant to study
Grade of IT for
improving
study skills
Grade of
IT for making it easier to
access and complete
study
Grade of IT for
making it
easier to
participate in class-related discussion
Grade of
IT for increasing knowledge in the field of
study
Grade of
IT for increasing motivation towar
ds completing study
Grade of
IT for ensur
ing academic qualit
y
N
Valid
50 50 50 50 50 50 50
Missing
0 0 0 0 0 0 0
Mean 5.74 5.24 5.38 4.84 5.62 4.64 5.68
Mode 7 5 7 7 7 4 7
Std. Deviation
1.322 1.271 1.510 1.683 1.244 1.535 1.236
Minimum 2 2 1 1 3 1 3
Maximum 7 7 7 7 7 7 7
Sum 287 262 269 242 281 232 284
Figure 27: Statistical calculation for the cost occurred for IT investment
Statistics
Cost for
purchasing PC
Cost required for PC
repairme
nt
Cost for
purchasing the
Smart
Phone
Cost for
Smart
Phone
repairing
Yearly
cost for
using intern
et
Total Cost
occurred
during 1st
year of investing in IT
N
Valid
50 50 50 50 50 50
Missing
0 0 0 0 0 0
Mean 19100.
00 156
6.00 5740.
00 188.
00 1805.
28 28399.
28
Figure 28: Graphical representation for the relationship of
CGPA and IT investment
Figure 29: IT payoff for 5 Years
Hardware Cost Repairing
Cost Internet
Cost Total Cost
28399 7016 7221 42636
Year 1 Return @ 14%
4 Year Return @ 20%
Total Return
32376 51164 83540

INTERNATIONAL JOURNAL OF SCIENTIFIC & TECHNOLOGY RESEARCH VOLUME 4, ISSUE 07, JULY 2015 ISSN 2277-8616
155 IJSTR©2015 www.ijstr.org
Total Return 83540
Total Cost 42636
Loss incurred for IT investment
40903
It is assumed that those who have CGPA of 3.45 will get job within at least 3 months before those have CGPA of 3.25
3 Months‘ Salary 90000
Loss incurred for IT investment 40903
Profit incurred for IT investment 49097
Again those who have invested in IT will have higher technical knowledge than those who did not invest in IT.
As a result the promotion will come earlier for IT investor than not IT investor. Finally IT pays a lot off.
Figure 30: IT payoff
IT Cost IT Return IT payoff
49858 90000 49097
49858 83540 33682
Investment Return Profit
IT payoff is more (14,415) than investing otherwise that is 31% Figure 31: Graphical representation for the relationship of IT
importance and education level
Among the 24 undergraduate students 13 think IT is strongly important, 5 moderately important, 5 important, and the rest 1 think IT is strongly unimportant. Among the 12 graduate students 7 think IT is strongly important, 1 moderately important, 3 important, and the rest 1 think IT is unimportant. Among the 13 undergraduate students 6 think IT is strongly
important, 1 moderately important, and the rest 5 think IT is important. Figure 32: Graphical representation for the relationship of IT
advantage and education level
Among the 23 undergraduate students 2 think IT saves time & increases productivity, 2 IT helps finding up-to-date information, 16 all of the facilities, 2 facilitates learning, saves time & increases productivity and helps skill development training, and the rest 1 think IT finding up-to-date information, assists research, & increases grade.Among the 12 undergraduate students 3 think IT facilitates learning, 1 skill development, 5 all of the facilities, 1 facilitates learning, saves time & increases productivity and helps skill development training, and the rest 2 think IT finding up-to-date information, assists research, & increases grade. Among the 13 undergraduate students 1 think IT facilitates learning, 1 think IT saves time & increases productivity, 9 all of the facilities, and the rest 1 think IT finding up-to-date information, assists research, & increases grade.
Hypothesis Testing: Hypothesis 1: Null hypothesis (Ho): Who invested in IT has less CGPA than those who did not invest in IT. Alternative hypothesis (H1): Who invested in IT has more CGPA than those who did not invest in IT.
Figure 33: Paired Samples Correlations
N Correlation Sig.
Pair 1
Whether the Respondent has a PC or NOT & CGPA obtained by the respondent
36 .359 .031
CGPA Computer Smart Phone Internet
IT Investment
Yes 3.48 3.43 3.46 3.45
No 3.32 3.40 3.26 3.25
INTERNATIONAL JOURNAL OF SCIENTIFIC & TECHNOLOGY RESEARCH VOLUME 4, ISSUE 07, JULY 2015 ISSN 2277-8616
156 IJSTR©2015 www.ijstr.org
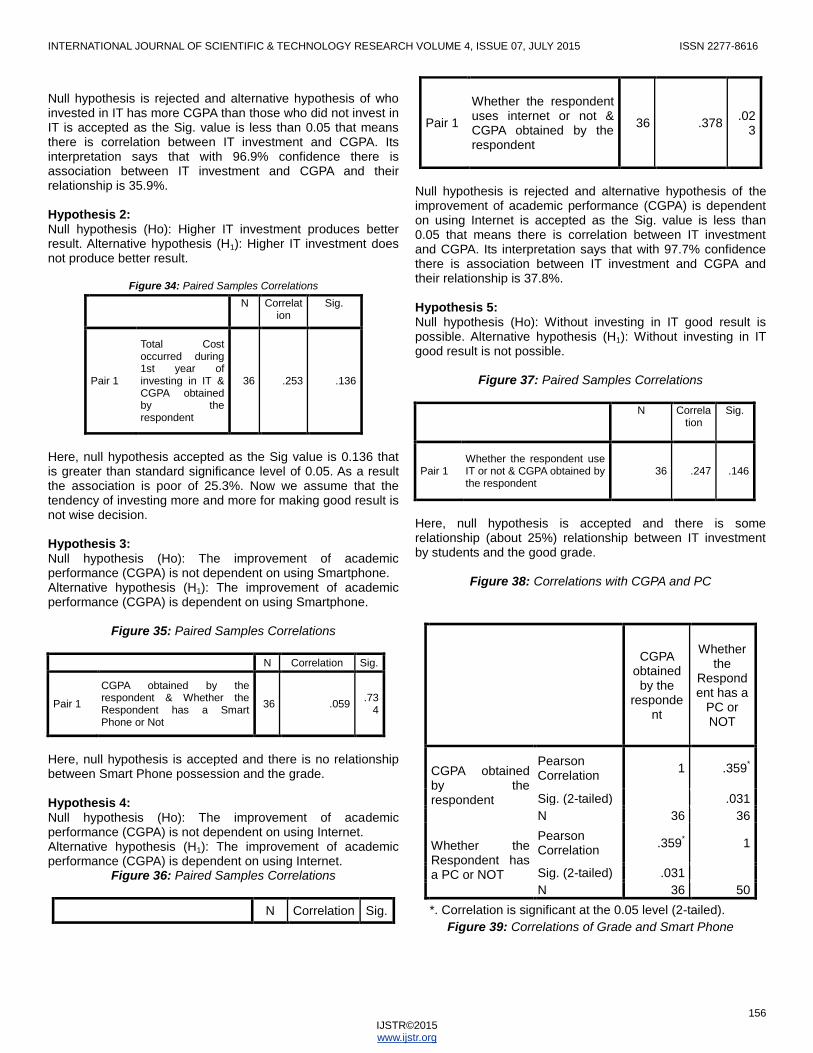
Null hypothesis is rejected and alternative hypothesis of who invested in IT has more CGPA than those who did not invest in IT is accepted as the Sig. value is less than 0.05 that means there is correlation between IT investment and CGPA. Its interpretation says that with 96.9% confidence there is association between IT investment and CGPA and their relationship is 35.9%. Hypothesis 2: Null hypothesis (Ho): Higher IT investment produces better result. Alternative hypothesis (H1): Higher IT investment does not produce better result.
Figure 34: Paired Samples Correlations
N Correlation
Sig.
Pair 1
Total Cost occurred during 1st year of investing in IT & CGPA obtained by the respondent
36 .253 .136
Here, null hypothesis accepted as the Sig value is 0.136 that is greater than standard significance level of 0.05. As a result the association is poor of 25.3%. Now we assume that the tendency of investing more and more for making good result is not wise decision. Hypothesis 3: Null hypothesis (Ho): The improvement of academic performance (CGPA) is not dependent on using Smartphone. Alternative hypothesis (H1): The improvement of academic performance (CGPA) is dependent on using Smartphone.
Figure 35: Paired Samples Correlations
N Correlation Sig.
Pair 1
CGPA obtained by the respondent & Whether the Respondent has a Smart Phone or Not
36 .059 .73
4
Here, null hypothesis is accepted and there is no relationship between Smart Phone possession and the grade. Hypothesis 4: Null hypothesis (Ho): The improvement of academic performance (CGPA) is not dependent on using Internet. Alternative hypothesis (H1): The improvement of academic performance (CGPA) is dependent on using Internet.
Figure 36: Paired Samples Correlations
N Correlation Sig.
Pair 1
Whether the respondent uses internet or not & CGPA obtained by the respondent
36 .378 .02
3
Null hypothesis is rejected and alternative hypothesis of the improvement of academic performance (CGPA) is dependent on using Internet is accepted as the Sig. value is less than 0.05 that means there is correlation between IT investment and CGPA. Its interpretation says that with 97.7% confidence there is association between IT investment and CGPA and their relationship is 37.8%. Hypothesis 5: Null hypothesis (Ho): Without investing in IT good result is possible. Alternative hypothesis (H1): Without investing in IT good result is not possible.
Figure 37: Paired Samples Correlations
N Correlation
Sig.
Pair 1 Whether the respondent use IT or not & CGPA obtained by the respondent
36 .247 .146
Here, null hypothesis is accepted and there is some relationship (about 25%) relationship between IT investment by students and the good grade.
Figure 38: Correlations with CGPA and PC
CGPA obtained
by the responde
nt
Whether the
Respondent has a
PC or NOT
CGPA obtained by the respondent
Pearson Correlation
1 .359*
Sig. (2-tailed) .031
N 36 36
Whether the Respondent has a PC or NOT
Pearson Correlation
.359* 1
Sig. (2-tailed) .031
N 36 50
*. Correlation is significant at the 0.05 level (2-tailed).
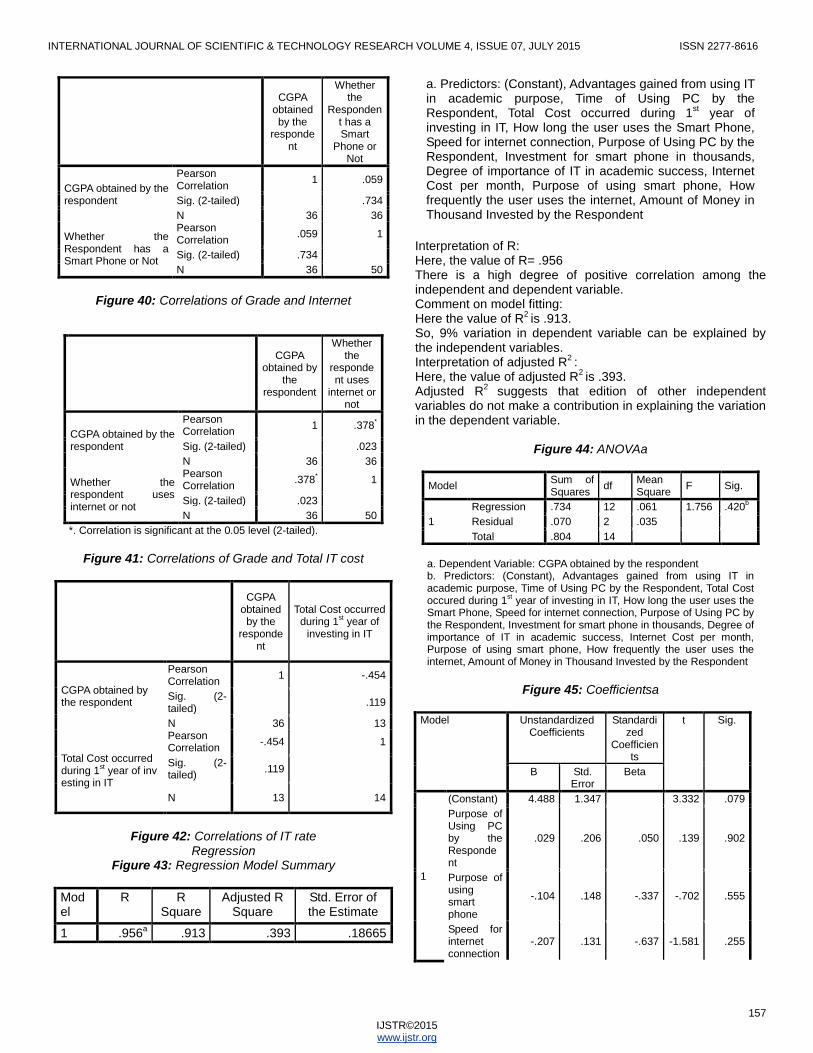
Figure 39: Correlations of Grade and Smart Phone
INTERNATIONAL JOURNAL OF SCIENTIFIC & TECHNOLOGY RESEARCH VOLUME 4, ISSUE 07, JULY 2015 ISSN 2277-8616
157 IJSTR©2015 www.ijstr.org
CGPA obtained by the
respondent
Whether the
Respondent has a Smart
Phone or Not
CGPA obtained by the respondent
Pearson Correlation
1 .059
Sig. (2-tailed) .734
N 36 36
Whether the Respondent has a Smart Phone or Not
Pearson Correlation
.059 1
Sig. (2-tailed) .734
N 36 50
Figure 40: Correlations of Grade and Internet
CGPA obtained by
the respondent
Whether the
respondent uses
internet or not
CGPA obtained by the respondent
Pearson Correlation
1 .378*
Sig. (2-tailed) .023
N 36 36
Whether the respondent uses internet or not
Pearson Correlation
.378* 1
Sig. (2-tailed) .023
N 36 50
*. Correlation is significant at the 0.05 level (2-tailed).
Figure 41: Correlations of Grade and Total IT cost
CGPA obtained by the
respondent
Total Cost occurred during 1
st year of
investing in IT
CGPA obtained by the respondent
Pearson Correlation
1 -.454
Sig. (2-tailed)
.119
N 36 13
Total Cost occurred during 1
st year of inv
esting in IT
Pearson Correlation
-.454 1
Sig. (2-tailed)
.119
N 13 14
Figure 42: Correlations of IT rate
Regression Figure 43: Regression Model Summary
Model
R R Square
Adjusted R Square
Std. Error of the Estimate
1 .956a .913 .393 .18665
a. Predictors: (Constant), Advantages gained from using IT in academic purpose, Time of Using PC by the Respondent, Total Cost occurred during 1
st year of
investing in IT, How long the user uses the Smart Phone, Speed for internet connection, Purpose of Using PC by the Respondent, Investment for smart phone in thousands, Degree of importance of IT in academic success, Internet Cost per month, Purpose of using smart phone, How frequently the user uses the internet, Amount of Money in Thousand Invested by the Respondent
Interpretation of R: Here, the value of R= .956 There is a high degree of positive correlation among the independent and dependent variable. Comment on model fitting: Here the value of R
2 is .913.
So, 9% variation in dependent variable can be explained by the independent variables. Interpretation of adjusted R
2 :
Here, the value of adjusted R2 is .393.
Adjusted R2
suggests that edition of other independent variables do not make a contribution in explaining the variation in the dependent variable.
Figure 44: ANOVAa
Model Sum of Squares
df Mean Square
F Sig.
1
Regression .734 12 .061 1.756 .420b
Residual .070 2 .035
Total .804 14
a. Dependent Variable: CGPA obtained by the respondent b. Predictors: (Constant), Advantages gained from using IT in academic purpose, Time of Using PC by the Respondent, Total Cost occured during 1
st year of investing in IT, How long the user uses the
Smart Phone, Speed for internet connection, Purpose of Using PC by the Respondent, Investment for smart phone in thousands, Degree of importance of IT in academic success, Internet Cost per month, Purpose of using smart phone, How frequently the user uses the internet, Amount of Money in Thousand Invested by the Respondent
Figure 45: Coefficientsa
Model Unstandardized Coefficients
Standardized
Coefficients
t Sig.
B Std. Error
Beta
1
(Constant) 4.488 1.347 3.332 .079
Purpose of Using PC by the Respondent
.029 .206 .050 .139 .902
Purpose of using smart phone
-.104 .148 -.337 -.702 .555
Speed for internet connection
-.207 .131 -.637 -1.581 .255
INTERNATIONAL JOURNAL OF SCIENTIFIC & TECHNOLOGY RESEARCH VOLUME 4, ISSUE 07, JULY 2015 ISSN 2277-8616
158 IJSTR©2015 www.ijstr.org
How frequently the user uses the internet
-.136 .149 -.473 -.912 .458
Total Cost occured during 1st year of investing in IT
-1.157E-005
.000 -.501 -.740 .537
Time of Using PC by the Respondent
.008 .075 .046 .105 .926
Amount of Money in Thousand Invested by the Respondent
.277 .178 1.057 1.556 .260
How long the user uses the Smart Phone
-.007 .105 -.035 -.066 .953
Investment for smart phone in thousands
-.106 .174 -.290 -.608 .605
Internet Cost per month
.095 .133 .352 .714 .549
Degree of importance of IT in academic success
.058 .100 .214 .583 .619
Advantages gained from using IT in academic purpose
-.044 .029 -.632 -1.527 .266
a. Dependent Variable: CGPA obtained by the respondent
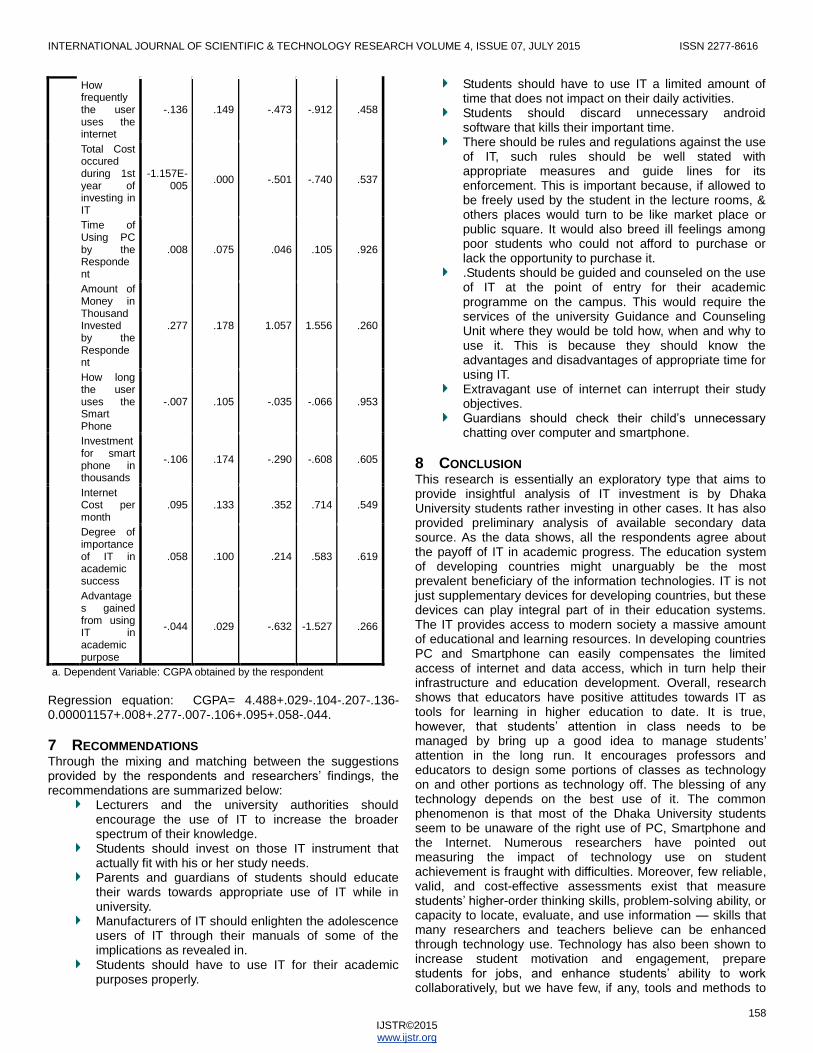
Regression equation: CGPA= 4.488+.029-.104-.207-.136-0.00001157+.008+.277-.007-.106+.095+.058-.044.
7 RECOMMENDATIONS Through the mixing and matching between the suggestions provided by the respondents and researchers‘ findings, the recommendations are summarized below:
Lecturers and the university authorities should encourage the use of IT to increase the broader spectrum of their knowledge.
Students should invest on those IT instrument that actually fit with his or her study needs.
Parents and guardians of students should educate their wards towards appropriate use of IT while in university.
Manufacturers of IT should enlighten the adolescence users of IT through their manuals of some of the implications as revealed in.
Students should have to use IT for their academic purposes properly.
Students should have to use IT a limited amount of time that does not impact on their daily activities.
Students should discard unnecessary android software that kills their important time.
There should be rules and regulations against the use of IT, such rules should be well stated with appropriate measures and guide lines for its enforcement. This is important because, if allowed to be freely used by the student in the lecture rooms, & others places would turn to be like market place or public square. It would also breed ill feelings among poor students who could not afford to purchase or lack the opportunity to purchase it.
.Students should be guided and counseled on the use of IT at the point of entry for their academic programme on the campus. This would require the services of the university Guidance and Counseling Unit where they would be told how, when and why to use it. This is because they should know the advantages and disadvantages of appropriate time for using IT.
Extravagant use of internet can interrupt their study objectives.
Guardians should check their child‘s unnecessary chatting over computer and smartphone.
8 CONCLUSION This research is essentially an exploratory type that aims to provide insightful analysis of IT investment is by Dhaka University students rather investing in other cases. It has also provided preliminary analysis of available secondary data source. As the data shows, all the respondents agree about the payoff of IT in academic progress. The education system of developing countries might unarguably be the most prevalent beneficiary of the information technologies. IT is not just supplementary devices for developing countries, but these devices can play integral part of in their education systems. The IT provides access to modern society a massive amount of educational and learning resources. In developing countries PC and Smartphone can easily compensates the limited access of internet and data access, which in turn help their infrastructure and education development. Overall, research shows that educators have positive attitudes towards IT as tools for learning in higher education to date. It is true, however, that students‘ attention in class needs to be managed by bring up a good idea to manage students‘ attention in the long run. It encourages professors and educators to design some portions of classes as technology on and other portions as technology off. The blessing of any technology depends on the best use of it. The common phenomenon is that most of the Dhaka University students seem to be unaware of the right use of PC, Smartphone and the Internet. Numerous researchers have pointed out measuring the impact of technology use on student achievement is fraught with difficulties. Moreover, few reliable, valid, and cost-effective assessments exist that measure students‘ higher-order thinking skills, problem-solving ability, or capacity to locate, evaluate, and use information — skills that many researchers and teachers believe can be enhanced through technology use. Technology has also been shown to increase student motivation and engagement, prepare students for jobs, and enhance students‘ ability to work collaboratively, but we have few, if any, tools and methods to

INTERNATIONAL JOURNAL OF SCIENTIFIC & TECHNOLOGY RESEARCH VOLUME 4, ISSUE 07, JULY 2015 ISSN 2277-8616
159 IJSTR©2015 www.ijstr.org
measure impact in these domains. Thus, it is not surprising that the impact of technology on education continues to be debated by educators and researchers alike. Debates aside, there is a substantial body of research that suggests that technology can have a positive effect on student achievement under certain circumstances and when used for certain purposes. However, there is no magic formula that educators and policymakers can use to determine if this ―return‖ is actually worth the ―investment.‖ Perhaps, rather than asking, ―Is technology worth the cost?‖ the more important question is, ―Under what conditions does technology have the most benefits for students?‖ The research presented in this paper seeks to answer this question, and offers some suggestions that policymakers should seriously consider as they seek to enhance learning through technology use.
9 FUTURE STUDY Some limitations of the present study should be noted. First, the sample is rather small and has employed simple statistical analysis. Second, participation of female respondent is not included in the study. Future research should investigate further analysis of IT use by students studying at different University of Bangladesh and its impact on academic performance.
ACKNOWLEDGMENT Special gratitude to Professor Dr. Hasibur Rashid who deserves thanks for completing this research work as his instruction contributed to this study.
REFERENCES [1] Cathy ringstaff, loretta kelley, ―the learning return on our
Educational technology investment‖, a review of findings from research, wested rtec, san francisco, 2002.
[2] Karim, n., darus, s. And hussin, r., ―mobile phone Applications in academic library services: a student‘s feedback survey‖ campus-wide information systems, 23(1), 35-51, 2006.
[3] Nortcliffe, a., & middleton, a., ―smartphone feedback: using an Iphone to improve the distribution of audio feedback‖ international journal of electrical engineering education special edition, 48(3), 280–293, 2011.
[4] Md. Hasibur rashid, zahiruddin md. Babar, and asraful alam Biswas, ―incorporating management information systems in small & medium enterpises of bangladesh‖, bangladesh journal of mis, volume 2, 3, 4, & 5, december 2012.
[5] Shimon sarraf, jennifer brooks, and james s cole, ―taking Surveys with smartphones: a look at usage among College students‖, indiana university, center for Postsecondary research, paper presented at the 2014 Annual conference for the american association for Public opinion research, anaheim, california, 2014.
[6] Arthur, charles mr. And brafi, paul osei, "internet use among Students in tertiary institutions in the sunyani municipality, ghana" library philosophy and practice (e-journal). Paper 859, 2013; available at:
http://digitalcommons.unl.edu/libphilprac/859.
[7] Alfawareh, h. M., & jusoh, s., ―smartphones usage among University students: najran university case‖ international journal of academic research, 6(2), 321-326., 2014.
[8] Kumar, m., ―impact of the evolution of smart phones in Education technology and its application in technical and professional studies: indian perspective‖ international journal of managing information technology (ijmit), 3(3),2011; available at: http://arxiv.org/ftp/arxiv/papers/1109/1109.0937.pdf
[9] Bomhold, c., ―educational use of smart phone technology: a Survey of mobile phone application use by undergraduate university students‖ 47(4), 424-436, 2013.
[10] Woodcock, b., middleton, a., and nortcliffe, a., ―considering The smartphone learner: an investigation into student interest in the use of personal technology to enhance their learning‖, student engagement and experience journal, 1(1) 1-15, 2012.
[11] Kuhlmeier, d., and knight, j., ―antecedents to internet based Purchasing: a multinational study‖, international marketing review, 22 (4), 460-73, 2005.