investment insights - jll · considerable growth in the second half of 2015, totaling $3.2 billion,...
TRANSCRIPT

Investment Insights
Montréal | H2-2015

Market insights for the real estate investor.

In this reportOverview 4Multi-residential 11Office 14Retail 17Industrial 20Land 23Forward-Looking Trends 26

Market Overview

$0$200,000,000$400,000,000$600,000,000$800,000,000
$1,000,000,000$1,200,000,000$1,400,000,000$1,600,000,000
Industrial Office Retail Multi-Residential Land
Billions $
H2 - 2014 H2 - 2015
10%
24%
41%
16%
9%
12%
13%
25%
44%
6%
Sales Volume by Asset Type - H2 2015
Industrial
Office
Retail
Multi-Residential
Land
JLL | Montréal | Capital Markets Investment Insights | H2-2015 | Page 5
The Greater Montréal Area’s (GMA) real estate investment market saw considerablegrowthinthesecondhalfof2015,totaling$3.2billion,a91percentincreaseascomparedtoH1-2015.Thesurgeininvestmentactivityinthesecondhalfof2015wasakeyfactorinpushingsalesvolumespast2014levelsandismainlyattributabletoseverallargerandsignificantinvestmenttransactionsinthemulti-residentialandretailmarkets.Excludinglandtransactions,therewere439transactionsoverthecourseof2015representingapproximately$4.33billioninsales.
TheCanadianeconomyexperiencedarelativelyminimalgrowthinGDP,only1.2percentin2015.Theprovince’sGDPalsofollowedsuit,droppingfrom1.5percentin2014to1.3percentin2015.Whileexportssawsignificantgrowthinthefirsthalfoftheyear,mainlyattributedtoaerospaceandmetalmanufacturingexportssuchasaluminum,thetrendslowedastheyeardrewtoaclose.AccordingtotheInstitutdelastatistiqueduQuébec(ISQ),manufacturingrealGDPwasupby1.3percentyear-over-yearinthefirstsevenmonthsof2015andrealmerchandiseexportswereupby5.3percentinthefirstninemonthsoftheyear.Employmentwasalsoupinthefirstelevenmonthsof2015to1.0percent,comparedto2014,withzerogrowthduringtheyear.
Despitetheslightlyunderwhelmingeconomicperformanceinthefirsthalfof2015,theCanadianlabourmarkethasremainedresilient:Thelabourforcesawgainsof23,000inDecember.However,theunemploymentrateremainedstableonamonth-to-monthbasisasmorepeopleenteredtheworkforce.Duringthecourseof2015,anadditional110,000peoplejoinedtheworkforcewhichaccountslargelyfortheslightincreaseintheunemploymentratenationally.Thisisborneoutbythefactthattheemploymentratehasremainedstableat61.2percent.Thelabourforcehasseenemploymentgainsofapproximately158,000over2015,reflectinganimprovedconfidenceintheCanadianeconomy.Theunemploymentrateiscontinuingtooutperformthelong-termaverageforCanadawhichbetween1966and2015stoodat7.7percent.
OverviewH2-2014 Versus H2-2015 Sales Volume ($ million)
Sales Volume by Asset Type – H2-2014
Sales Volume by Asset Type – H2-2015
Source:CollettePlante,JLR,RCA
24%
8%
30%
21%
17%
Industrial
Office
Retail
Multi-Residential
Land
10%
28%
31%
15%
16%
Industrial
Office
Retail
Multi-Residential
Land

JLL | Montréal | Capital Markets Investment Insights | H2-2015 | Page 6
On-Going DevelopmentMontréal’simpressivedevelopmentboomcontinuesas2015drawstoaclosewithseveralprojectsunderwayandmanyothersplannedfor2016.BrossardwillseeQuartierTODerecteddirectlyacrossfromQuartierDix30,alongHighway10.ThisnewDevimcoprojectwillincludeapproximately2,000newhousingunits,commercialandofficespace,hotels,aconventioncentre,apublicsquare,bikepaths,andmanygreenspaces.Constructionwillspantentofifteenyearsandisestimatedtototal$1.0billion.
AnotherimportantprojectintheworksisthedevelopmentofEspaceMontmorencyinLaval.Theprojectwillbecomprisedoftenbuildings,featuringshops,offices,ahotel,andentertainmentvenues.The277,000-square-footprojectistheproductofthepartnershipbetweendeveloperMontoni,investmentfirmClaridge,andtheQuébecFederationofLabour’sSolidarityFund,andwillcostapproximately$420million.
Finally,theTownofMountRoyalgavethegreenlighttotheconstructionofanewmega-mallattheintersectionoftheDécarieExpresswayandtheMetropolitanHighway,a$1.7billion,2.5-million-square-footretailprojectexpectedtogenerateapproximately15,000jobsand$800millioninannualretailsales.
Intermsofmajorinfrastructureprojects,2015sawthecompletionoftheMUHC’snewsuper-hospitalinthewestendofthecity,aswellasthebeginningofconstructionworkontheTurcotInterchangeandthenewChamplainBridge.

0.0
1.0
2.0
3.0
4.0
5.0
6.0
7.0
8.0
9.0
0.0
2.0
4.0
6.0
8.0
10.0
12.0
14.0
16.0
2006
-Q1
2006
-Q2
2006
-Q3
2006
-Q4
2007
-Q1
2007
-Q2
2001
-Q3
2007
-Q4
2008
-Q1
2008
-Q2
2008
-Q3
2008
-Q4
2009
-Q1
2009
-Q2
2009
-Q3
2009
-Q4
2010
-Q1
2010
-Q2
2010
-Q3
2010
-Q4
2011
-Q1
2011
-Q2
2011
-Q3
2011
-Q4
2012
-Q1
2012
-Q2
2012
-Q3
2012
-Q4
2013
-Q1
2013
-Q2
2013
-Q3
2013
-Q4
2014
-Q1
2014
-Q2
2014
-Q3
2014
-Q4
2015
-Q1
2015
-Q2
2015
-Q3
2015
-Q4
10yrQuarterlyGOCYield Series2 Series3
0.00
1.00
2.00
3.00
4.00
5.00
6.00
7.00
8.00
9.00
0
2
4
6
8
10
12
14
16
2006
-Q1
2006
-Q2
2006
-Q3
2006
-Q4
2007
-Q1
2007
-Q2
2001
-Q3
2007
-Q4
2008
-Q1
2008
-Q2
2008
-Q3
2008
-Q4
2009
-Q1
2009
-Q2
2009
-Q3
2009
-Q4
2010
-Q1
2010
-Q2
2010
-Q3
2010
-Q4
2011
-Q1
2011
-Q2
2011
-Q3
2011
-Q4
2012
-Q1
2012
-Q2
2012
-Q3
2012
-Q4
2013
-Q1
2013
-Q2
2013
-Q3
2013
-Q4
2014
-Q1
2014
-Q2
2014
-Q3
2014
-Q4
2015
-Q1
2015
-Q2
10yrQuarterlyGOCYield S&P/TSXCappedREITIndex YieldSpread
JLL | Montréal | Capital Markets Investment Insights | H2-2015 | Page 7
Five(5)Year 10-Year Long TermDec-15 0.74% 1.40% 2.16%Dec-14 1.34% 1.79% 2.33%Dec-13 1.90% 2.72% 3.20%Dec-12 1.37% 1.82% 2.37%
REIT OutlookBecauseofthedropinlong-terminterestrates,CanadianREITsfinished2015onanegativenote,decreasingby10.1percentonaveragefortheyear.Ten-yearGovernmentofCanada(GOC)bondyieldsfurtherendedtheyearat1.4percent.Withalargeyieldspreadof440basispoints(bps)andaweakCanadiandollar,itisanopportunetimetopurchaseREITs.
The low interest rate environment has helped stimulate the market for bothlendersandborrowers,givinginvestorseasieraccesstoequityfortheirrealestateinvestmentsaswellasincreaseddebtcapitalfordevelopmentprojects.ItisexpectedthatGovernmentbondyieldswillcontinuetheirdeclinewellinto2016,wideningtheREITyieldspread.CapratesremainedlowwhichplayedanimportantroleindrivingREITunitpriceshigherin2015.
ResearchsuggestsanumberofkeyfactorsthatshouldresultinapositiveoutlookforCanadianREITsgoinginto2016.TherecentplungeinoilpriceswillhaveanadverseimpactontheCanadianeconomyasawhole,whichwilllikelyhelpkeepinterestrateslow.Thisshouldincreaseinvestorappetite,andasdemandfortopqualityassetsremainsstrong,weexpecttoseecontinuedinvestmentactivitygoinginto2016.
A Deal BDeal C DealFive(5)year 2.45% 2.70% 3.20%
Government Bond Yields
Commercial Mortgage Rates
Bond Versus REIT Yields
Source:BankofCanada
(%) (%)

JLL | Montréal | Capital Markets Investment Insights | H2-2015 | Page 8
Daily REIT Pricing [12/23/2015]
12/22/2015 12/21/2015 9/23/2015 6/25/2015 12/22/2014 Market Cap ($
Millions)DivYield
Close Close % Change Close % Change Close % Change Close % Change
RiocanREIT 24.15 24.31 -0.66% 24.28 -0.54% 27.05 -10.72% 26.90 -10.22% 7,749 5.84%H&RREIT 20.45 20.30 0.74% 20.16 1.44% 22.51 -9.15% 21.59 -5.28% 5,691 6.60%GraniteREIT 38.60 36.99 -1.00% 36.87 4.69% 43.26 -10.77% 40.95 -5.74% 1,815 5.97%CTREIT 13.10 13.13 -0.23% 13.03 0.54% 12.18 7.55% 12.14 7.91% 1,183 5.06%BoardwalkREIT 48.44 48.46 -0.04% 54.25 -10.71% 58.14 -16.68% 62.85 -22.93% 2,294 4.21%CominarREIT 14.76 14.82 -0.40% 16.29 -9.39% 17.97 -17.86% 18.38 -19.70% 2,512 9.96%CAPREIT 26.95 26.90 0.19% 28.10 -4.09% 27.97 -3.65% 24.89 8.28% 3,438 4.53%AlliedPropertiesREIT 31.73 31.89 -0.50% 34.52 -8.08% 35.91 -11.64% 37.20 -14.70% 2,489 4.73%DreamOfficeREIT 17.65 17.72 -0.40% 20.83 -15.27% 25.24 -30.07% 24.68 -28.48% 1,901 12.69%ArtisREIT 12.90 12.83 0.55% 12.42 3.86% 13.97 -7.66% 14.21 -9.22% 1,789 8.37%CrombieREIT 12.89 12.83 0.47% 12.83 0.47% 12.68 1.66% 12.83 0.47% 1,002 6.90%MorguardREIT 13.81 13.51 2.22% 13.68 0.95% 16.41 -15.84% 18.20 -24.12% 848 6.95%DreamGlobalREIT 8.63 8.58 0.58% 8.94 -3.47% 10.07 -14.30% 8.61 0.23% 974 9.27%InnVestREIT 5.18 5.15 0.58% 5.06 2.37% 5.30 -2.26% 5.79 -10.54% 690 7.71%
Expect to see REITs returning to positive growth going in
2016 as oil prices remain low and demands for high quality
assets increases
Source:Yahoo!Finance

JLL | Montréal | Capital Markets Investment Insights | H2-2015 | Page 9
Cap RateQ4 - 2012 Q4 - 2013 Q4 - 2014 Q1 - 2015 Q2 - 2015 Q3 - 2015 Q4 - 2015 Trend
OfficeDowntown
Downtown Prestige 5.5% 5.5% 5.5% 5.3% 5.3% 5.3% 5.5%Downtown Class A 5.8% 5.8% 5.8% 5.5% 5.5% 5.5% 5.5%
MidtownClass A 6.8% 6.8% 6.8% 6.5% 6.5% 6.5% 6.5%ClassB 7.3% 7.3% 7.3% 7.0% 7.0% 7.0% 7.0%
SuburbsClass A 6.8% 6.8% 6.8% 6.5% 6.5% 6.5% 6.8%ClassB 7.5% 7.5% 7.5% 7.3% 7.3% 7.3% 7.5%
RetailRegionalShoppingCentres 5.0% 5.0% 5.0% 4.8% 4.8% 4.8% 5.3%Sub-regionalShoppingCentres 6.5% 6.5% 6.5% 6.3% 6.3% 6.3% 6.5%
Power CentresDominant Power Centres 5.5% 5.5% 5.5% 5.3% 5.3% 5.8% 6.0%Other Power Centres 7.3% 7.3% 7.3% 7.0% 7.0% 7.0% 7.0%
Community ShoppingCentres 8.0% 8.0% 8.0% 7.8% 7.8% 7.8% 6.5%NeighbourhoodCentres 7.8% 7.8% 7.8% 7.5% 7.5% 7.5% 7.3%
ApartmentsTopQualityApartment(Concrete) 5.0% 4.5% 4.5% 4.3% 4.3% 4.8% 4.5%TopQualityApartment(Wood/Brick) 6.0% 5.5% 5.5% 5.3% 5.3% 5.8% 5.3%
Senior HomesApartments 6.8% 6.8% 6.8% 6.5% 6.5% 6.5% 6.5%RoomandBoard 8.3% 8.3% 8.3% 8.0% 8.0% 8.0% 8.0%
IndustrialMulti-Tenant 8.0% 8.0% 7.8% 7.5% 7.5% 7.5% 7.0%Single-Tenant 7.3% 7.0% 6.8% 6.5% 6.5% 6.5% 6.5%
Cap RatesDemandforrealestateremainshighintheGreaterMontréalArea,supportedbythelowCanadiandollar,whichshouldkeepcaprateslowfortheforeseeablefuture.Furthermore,returnsonrealestatearebecomingmoreattractivefollowingarecentdropinlong-terminterestratesthisyear.Theaveragenationalcapitalizationrateacrossallassetclassessatat6.1percentattheendof2015,bringingthespreadbetweenCanadiancapratesandthe10yearGOCbondyieldto440bps.
ClassAofficebuildingsintheMontréaldowntowncorearetradingbetween5.0and6.0percentwhilecapratesforClassAsuburbanofficesareaveragingbetween6.2and7.2percent.Retailassetsrangeconsiderablydependingontheiruseandlocation:regionalshoppingmallstradedbetween4.8and5.8percentversusfoodanchoredstripcentreswhichaveragedbetween6.0and7.0percent.Overallreturnsremainlowerinthemulti-residentialsector,withcapratesforapartmentassetsthelowestamongallassetclasses.Suburbanmultiple-residentialcomplexestradedbetween4.8and5.8percentwhilecapratesfordowntownmultipleunitcomplexesaveragedbetween4.0and5.0percent.Industrialassetsremainedthehighestyieldingamongstallpropertytypesthisyear.Capratesformulti-tenantbuildingsaveragedbetween6.5and7.5percentwhilesingle-tenantindustrialassetstradedat6.0and7.0percent.
Source:DesjarlaisPrévostandJLLResearch

3.00%
4.00%
5.00%
6.00%
7.00%
8.00%
9.00%
Q4 -2010
Q4 -2011
Q4 -2012
Q4 -2013
Q1 -2014
Q2 -2014
Q3 -2014
Q4 -2014
Q1 -2015
Q2 -2015
Q3 -2015
Q4 -2015
JLL | Montréal | Capital Markets Investment Insights | H2-2015 | Page 10
3.00%
4.00%
5.00%
6.00%
7.00%
8.00%
9.00%
Q4 -2010
Q4 -2011
Q4 -2012
Q4 -2013
Q1 -2014
Q2 -2014
Q3 -2014
Q4 -2014
Q1 -2015
Q2 -2015
Q3 -2015
Q4 -2015
Downtown Class A Office-SuburbanRegionalShoppingCentres Dominant Power CentresTopQualityApartment(Concrete) TopQualityApartment(Wood/brick)Industrial Multi-Tenant IndustrialSingle-Tenant
Cap Rate Trends
With the Canadian dollar and interest rate at extreme lows, cap rates should remain low
for the foreseeable future.

Multi-residential

The multi-residential market saw a significant increase in
sales volumes over the second half of 2015, totaling $914
million, over double first half volumes and a 58 percent increase year-over-year.

JLL | Montréal | Capital Markets Investment Insights | H2-2015 | Page 13
$0
$100,000,000
$200,000,000
$300,000,000
$400,000,000
$500,000,000
$600,000,000
$700,000,000
$800,000,000
Q12013
Q22013
Q32013
Q42013
Q12014
Q22014
Q32014
Q42014
Q12015
Q22015
Q32015
Q42015
Millions $
Themulti-residentialmarketsawasignificantincreaseinsalesvolumesoverthesecondhalfof2015.Fourthquartersalesvolumesincreasedbyalmost8percentto$727.7millioncomparedtothethirdquarterwith$676.7million.Thesecondhalfsalesvolumestotaledapproximately$1.4billion,whichamountstooverthreetimesthefirsthalfsalesvolumes.Therewereatotalof38multi-residentialtransactionsinthefourthquarter,comparedto34transactionsinthethirdquarterof2015.Theaveragepriceperdoorstayedstableintothefourthquarter,at$107,435fortransactionsover$1.0millionacrosstheGMA.
Themostnotabletransactionthisquarterwasthesaleof16propertieslocatedinMontréal.CAPREITacquiredthe3,661-unitportfoliofor$490million,or$133,843perdoor.TheacquisitionincreasesCAPREIT’sportfoliotoapproximately46,600suitesacrossCanada.
Anothernotabletransactioninthefourthquarterwasthe623-unitcomplexlocatedat2-10RadissonStreetinGatineau.SkylineCommercialREITboughtthecomplexfor$64,200,000or$103,150perdoor.Thesaleincludedthepurchaseoffivevacantlotswithpotentialfordevelopment.
VacancyratesintheprimaryrentalmarketincreasedslightlyintheGMAby17bpsto4.0percentwhiletotalaveragemonthlyrentalratesalsoincreasedby3.5percentto$744year-over-year.Thetotalaveragerentalratefortwo-bedroomapartmentsintheGMAwasat$760,withrentalratesvaryingbetween$610inMontréal-Nordand$1,411inDowntownMontréal.CapratesforMontréalapartmentshaveremainedstablesinceMarchofthisyear.Topqualityapartments(concrete)tradedatarateof4.3%to4.8%,whiletopqualityapartments(brick/wood)rangedfrom5.0%to5.5%.
Cap RateTop Quality Concrete H2-2015: 4.50-4.75% | H2-2014: 4.25-4.75%Top Quality Brick/Wood H2-2015: 5.50-5.75% | H2-2014: 5.00-5.50%
Sales VolumeH2-2015: $1.4 billion | H2-2014: $579 million
Number of TransactionsH2-2015: 72 | H2-2014: 78
Multi-residential
Notable Transactions
16 Properties Portfolio, Montréal Vendor: F. D. L. Compagnie Ltée.Purchaser: CAP REITSale price: $490,000,000 Number of Units: 3,661Price per Door: $133,842
2-10 Radisson Street, GatineauVendor: Omers Realty CorporationPurchaser: Skyline Commercial REITSale Price: $64,200,000Number of Units: 623Price per Door: $123,050
135 Place de la Côte-Vertu, MontréalVendor: Optrust Multi-Residential Inc.Purchaser: Gestion Saphir Li Inc.Sale price: $21,800,000Number of units: 144Price per door: $151,389
Multi-Residential - Sales Volume ($)
Source:CollettePlante,JLR,RCA

Office

Total second half volumes totaled $410 million.
Compared to the first half of the year, the total sales volume experienced a 13
percent increase, despite the significant decrease in sales
quarter-over-quarter.

$0$100,000,000$200,000,000$300,000,000$400,000,000$500,000,000$600,000,000$700,000,000$800,000,000
Q12013
Q22013
Q32013
Q42013
Q12014
Q22014
Q32014
Q42014
Q12015
Q22015
Q32015
Q42015
Millions $
JLL | Montréal | Capital Markets Investment Insights | H2-2015 | Page 16
OfficeTheofficeinvestmentmarketreturnedtoitsnormallevelsinthefourthquarterafterarecordthirdquarter,whichsawthesaleofWestmountSquareandtheKPMGToweranddrovesalesvolumesto$361.5million.VolumesforQ4-2015wereamoremodest$53.9millionandendedthesecondhalfof2015at$415.0million.Comparedtothefirsthalfoftheyear,thetotalsalesvolumeexperiencedanimportantincrease,despitethesignificantdecreaseinsalesquarter-over-quarter.
Themostnotabletransactioninthefourthquarterwastheacquisitionof8000DécarieBoulevardinMontréaljustoffofhighway15byLesImmeubles8000Décarie.The135,000-square-footofficebuildingsoldfor$28.0million,or$208.0persquarefoot.TenantsincludeCIBC,LaPrep,NexiaFriedman,andOVOClinique.
Demandfornewofficespaceisdrivingconstruction,especiallyinthedowntowncore.Thefourthquartercounts12officebuildings,or2,166,122squarefeet,underconstructionthroughouttheGMA,with194,883squarefeetsettobedeliveredinthefirsthalfof2016,andanother431,312squarefeetinthesecondhalfof2016.
Notable Transactions
8000 Décarie Boulevard, MontréalVendor: HOOPPPurchaser: Gad BittonSale price: $28,000,000Price per Square Foot: $208.00
606-608 Champlain Street, Saint-Jean-sur-RichelieuVendor: Placements Barnabé Grégoire Inc. Purchaser: Place Barnabée Inc.Sale price: $5,500,000
14770 Pierrefonds Boulevard, PierrefondsVendor: Northwest Healthcare Properties HoldingsPurchaser: Holding Jeremi D. Ltée. Sale price: $3,626,000 Price per Square Foot: $176.62
Office - Sales Volume ($)
Cap RateClass A - Downtown H2-2015: 5.25-5.75% | H2-2014: 5.75-6.00%Class A - Suburban 2015: 6.25-7.00% | H2-2014: 6.50-6.75%
Sales VolumeH2-2015: $415 million | H2-2014: $873 million
Number of TransactionsH2-2015: 21 | H2-2014: 21
Source:CollettePlante,JLR,RCA

Retail
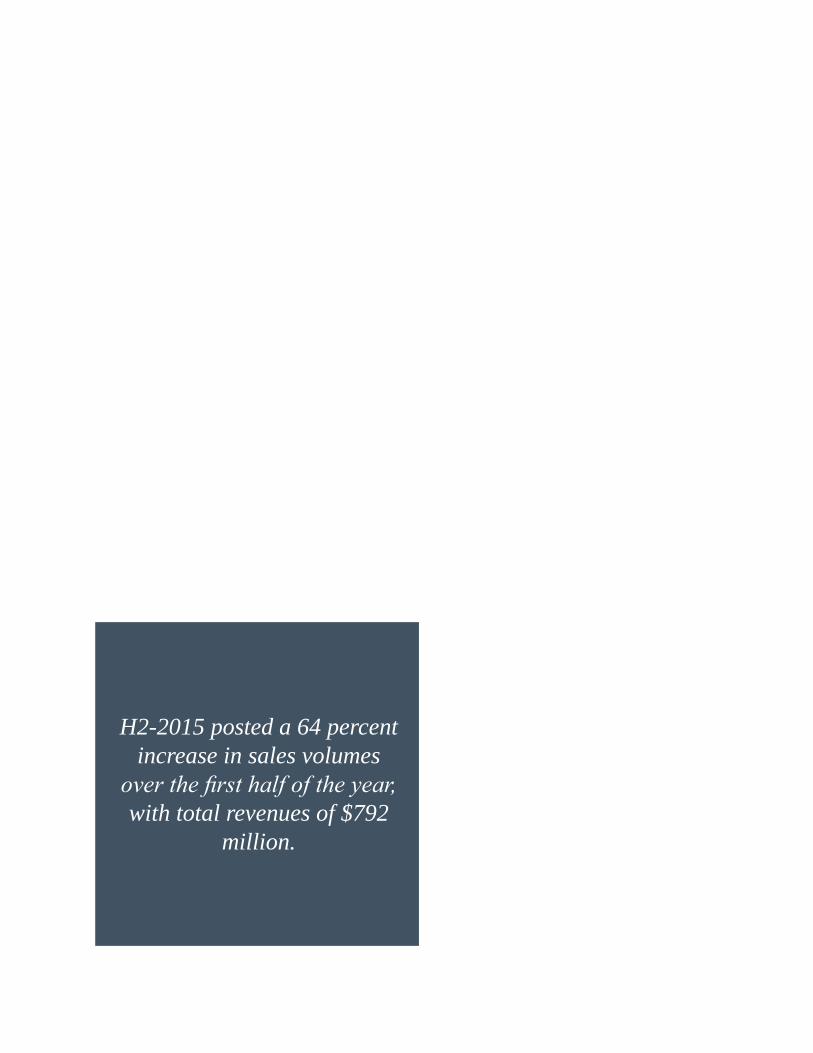
H2-2015 posted a 64 percent increase in sales volumes
over the first half of the year, with total revenues of $792
million.

JLL | Montréal | Capital Markets Investment Insights | H2-2015 | Page 19
$0$100,000,000$200,000,000$300,000,000$400,000,000$500,000,000$600,000,000$700,000,000$800,000,000$900,000,000
$1,000,000,000
Q12013
Q22013
Q32013
Q42013
Q12014
Q22014
Q32014
Q42014
Q12015
Q22015
Q32015
Q42015
Millions $
Source:CollettePlante,JLR,RCA
RetailFourthquartersalesvolumefortheretailinvestmentmarketdecreasedsignificantlyfromthepreviousquarter,totalingapproximately$229.0million.Regardless,H2-2015stillposteda64.0percentincreaseoverthefirsthalfoftheyear,withtotalrevenuesof$792.0million.Thetotalnumberoftransactionsinthesecondhalfoftheyeartotaledjust58,comparedto75forthefirsthalfoftheyear.WhileH1-2015sawahighernumberoftransactions,thesecondhalfoftheyearhadalmostdoublethesalesvolume.
ThemostnotabletransactionthispastquarterwasRioCanREIT’s$69.0millionacquisitionof3514TaschereauBoulevardinLongueuil.TheGreenfieldParkCentreisanchoredbyMaxiandWinners,withL’Équipeur,BureauenGros,andJackAstor’samongtheothertenants.Anothersignificanttransactionthisquarterwasthesaleof1280BeaumontAvenueinMontréal.Métroacquiredthepropertyfor$21.0million.
Retail - Sales Volume ($)
Notable Transactions
3514 Taschereau Boulevard, LongueuilVendor: KimcoPurchaser: RioCan REITSale price: $68,774,554Price per Square Foot: $183.39
1280 Beaumont Avenue, MontréalVendor: Jean-Guy Racicot Purchaser: MétroSale price: $21,000,000Price per Square Foot: $314.03
2200-2236 Laurentides Boulevard, LavalVendor: ALRE PropertiesPurchaser: Fiera Properties Sale price: $11,607,000Price per Square Foot: $234.54
Cap RateRegional Shopping Centre H2-2015: 5.00-5.50% | H2-2014: 5.00-5.25%Dominant Power Centre 2015: 5.75-6.25% | H2-2014: 5.50-5.75%
Sales VolumeH2-2015: $792 million | H2-2014: $1.5 billion
Number of TransactionsH2-2015: 58 | H2-2014: 62

Industrial
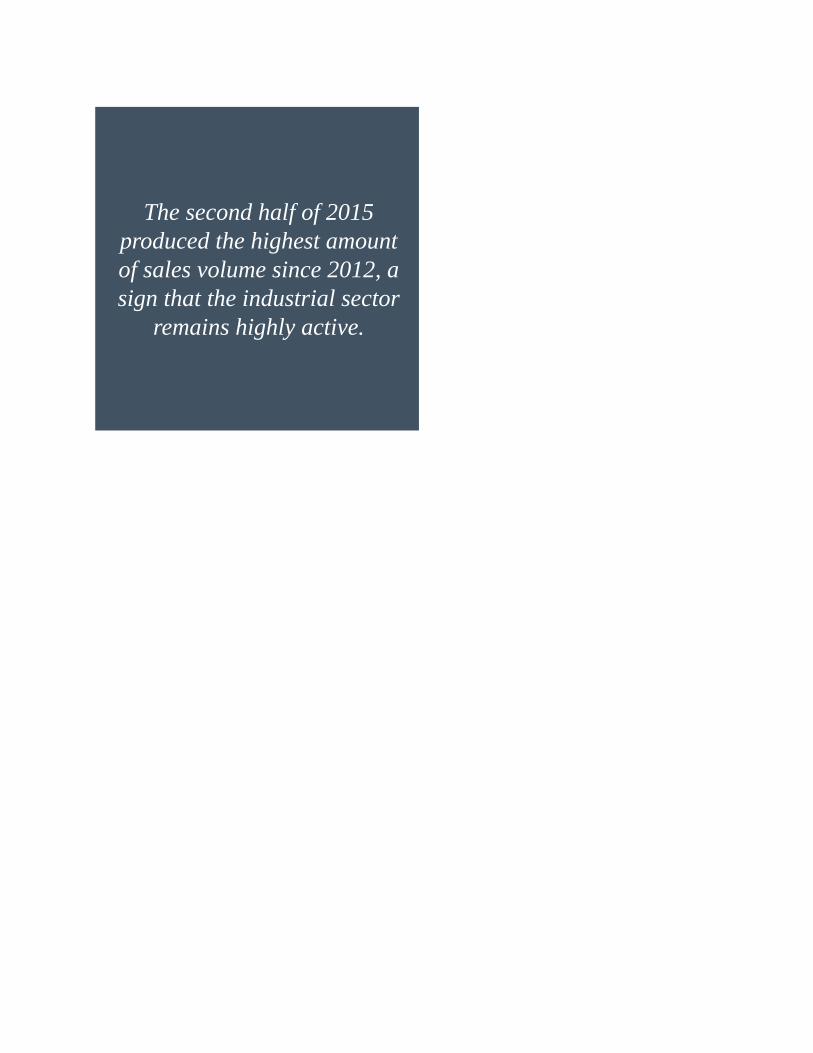
The second half of 2015 produced the highest amount of sales volume since 2012, a sign that the industrial sector
remains highly active.

$0
$50,000,000
$100,000,000
$150,000,000
$200,000,000
$250,000,000
Q12013
Q22013
Q32013
Q42013
Q12014
Q22014
Q32014
Q42014
Q12015
Q22015
Q32015
Q42015
Millions $
Source:CollettePlante,JLR,RCA
JLL | Montréal | Capital Markets Investment Insights | H2-2015 | Page 22
IndustrialIndustrialinvestmentsalesalsosawasignificantdecreaseinthefourthquarter,byalmost24.0percent,tototal$170.0million.Inspiteofthis,second-halfsalesvolumestillreached$404.0million,a7.5percentincreasefromthefirsthalfoftheyear.Thesecondhalfof2015producedthehighestamountofsalesvolumesince2012,asignthattheindustrialsectorremainshighlyactive.
Themostnotabletransactionthispastquarterwasthesaleof2100-2200ReverchonAvenueinDorval,atwo-propertysale.2100ReverchonAvenueisa58,000-square-footindustrialbuildingoccupiedbyDBSchenker,aglobaltransportandlogisticscompanyforDeutscheBahn,while2200ReverchonAvenue,a309,000squarefootwarehouse,isoccupiedbyAirCanadaCargoFacility.Thetwobuildingssoldforacombinedpriceof$35.0million,or$95.4persquarefoot.
Anothersignificanttransactionwastheacquisitionof177HymusBoulevardinPointe-ClairebyDivco.The242,000-square-footpropertyisoccupiedbyLumen,theleadingdistributorofelectricalandautomationequipmentintheprovinceofQuébecandSonecable,asubsidiaryofLumenthatspecializesinwiresandcables.Thepropertywassoldfor$12.5million,or$51.7persquarefoot.
Notable Transactions
2100-2200 Reverchon Avenue, DorvalVendor: CacAir Cargo EastPurchaser: Ral Canada HoldingsSale price: $35,000,000Price per Square Foot: $95.36
117 Hymus Boulevard, Pointe-ClaireVendor: Sonepar ManagementPurchaser: DivcoSale Price: $12,500,000Price per Square Foot: $51.67
750 Stuart Graham Blvd. S., DorvalVendor: Cac Air Cargo EastPurchaser: Ral Canada HoldingsSale Price: $11,624,000Price per Square Foot: $163.10
Sales VolumeH2-2015: $404 million | H2-2014: $346 million
Number of TransactionsH2-2015: 51 | H2-2014: 52
Industrial - Sales Volume ($)
Cap RateSingle-tenantH2-2015: 6.50-7.00% | H2-2014: 7.00-7.25%Multi-tenant 2015: 7.00-7.50% | H2-2014: 8.00-8.25%

Land

$0
$50,000,000
$100,000,000
$150,000,000
$200,000,000
$250,000,000
Q12013
Q22013
Q32013
Q42013
Q12014
Q22014
Q32014
Q42014
Q12015
Q22015
Q32015
Q42015
Millions $
Source:CollettePlante,JLR,RCA
JLL | Montréal | Capital Markets Investment Insights | H2-2015 | Page 24
Land investments increased in volume for the fourth
quarter, which finished at $112.5 million, compared to the previous quarter which
totaled $77.8 million, a 45.0 percent increase.
LandLandinvestmentsincreasedinvolumeforthefourthquarter,whichfinishedat$112.6million,comparedtothepreviousquarterwhichtotaled$77.8million,a45.0percentincrease.Thisroundedoffthesecondhalfoftheyearwithatotalof$190.3million,asignificantdecreasefromthefirsthalfoftheyear,whichtotaled$350.4million.
ThemostnotabletransactionthispastquarterwasthesaleoftheformerconventonMont-RoyalinOutremont,purchasedbyOlivierLeclercfor$29.5millionfromUniversitédeMontréal.Leclercwillbuildanewluxurycondoproject,withunitscostingabout$550persquarefoot.
Notable Transactions
Mont-Royal Boulevard, OutremontVendor: Université de MontréalPurchaser: Olivier LeclercSale Price: $29,500,000Price per Square Foot: $105.55
Vauquelin Boulevard, LongueuilVendor: Sovima Habitations Inc.Purchaser: Vauquelin 2 Inc.Sale Price: $10,500,000Price per Square Foot: $391.75
Montée Masson, LavalVendor: Jean-Guy HamelinPurchaser: Total Metal Recuperation Inc.Sale Price: $7,500,000Price per Square Foot: $30.86
Land - Sales Volume ($)
Sales VolumeH2-2015: $190 million | H2-2014: $342 million
Number of TransactionsH2-2015: 41 | H2-2014: 55

Forward-Looking Trends

JLL | Montréal | Capital Markets Investment Insights | H2-2015 | Page 26
Forward-Looking TrendsIn2016,provincialexportsareexpectedtopickupandboostthemanufacturingmarket.Québec’srealGDPgrowthshouldreachafive-yearhighof1.9percentbeforedecreasingslightlyto1.7percentin2017.Employmentisforecastedtogrowby0.8percentin2016whichwillencourageconsumerconfidence.ThemanufacturingsectorwillalsoseeaslightincreaseinactivityandboostCanadianexports.AccordingtotheInternationalEnergyAgency’sforecast,globaloilproductionwillcontinuetoexceeddemanduntilatleastthesecondhalfof2016.ThetotalCPIinflationrateiscurrentlyat1.0percentandisexpectedtostayrelativelylowthroughout2016and2017,butwillriseto2.0percentoncethemarketreachesstabilization.ThelowCanadiandollarisspurringinterestfrominternationalinvestors,lookingtoexpandtheirportfoliosintotheCanadianmarket,atrendthatshouldcontinue,especiallyifinterestratesremainlow.
InvestorsarereassessingallocationstowardsQuébec,manylookingtoincreasetheirinvestmentsintheprovince.Thekeydriverisarelativelystableeconomy,withexportgrowthtotheUnitedStatessupportingoccupancylevelsandvalues.InvestorswhohavepreviouslyavoidedQuebecandfavouredoilproducingprovincesarenowaskingifitistimetoinvestinQuebec.Themainchallengewillbetocontinuefindingenoughqualityproductinordertosatisfytheinvestmentdemand.ThiswilllikelykeepadownwardpressureoncapratesforA-gradeproductgoingforward.

Helping you maximize your real estate investments.

About JLLAboutJLLJLL(NYSE:JLL)isaprofessionalservicesandinvestmentmanagementfirmofferingspecializedrealestateservicestoclientsseekingincreasedvaluebyowning,occupyingandinvestinginrealestate.AFortune500companywithannualfeerevenueof$4.7billionandgrossrevenueof$5.4billion,JLLhasmorethan230corporateoffices,operatesin80countriesandhasaglobalworkforceofapproximately58,000.Onbehalfofitsclients,thefirmprovidesmanagementandrealestateoutsourcingservicesforapropertyportfolioof3.4billionsquarefeet,or316millionsquaremeters,andcompleted$118billioninsales,acquisitionsandfinancetransactionsin2014.Itsinvestmentmanagementbusiness,LaSalleInvestmentManagement,has$57.2billionofrealestateassetsundermanagement.JLListhebrandname,andaregisteredtrademark,ofJonesLangLaSalleIncorporated.
About JLL ResearchJLL’sresearchteamdeliversintelligence,analysis,andinsightthroughmarket-leadingreportsandservicesthatilluminatetoday’scommercialrealestatedynamicsandidentifytomorrow’schallengesandopportunities.Ourmorethan400globalresearchprofessionalstrackandanalyzeeconomicandpropertytrendsandforecastfutureconditionsinover60countries,producingunrivalledlocalandglobalperspectives.Ourresearchandexpertise,fueledbyreal-timeinformationandinnovativethinkingaroundtheworld,createsacompetitiveadvantageforourclientsanddrivessuccessfulstrategiesandoptimalrealestatedecisions.
ThispublicationisthesolepropertyofJonesLangLaSalleIP,Inc.andmustnotbecopied,reproducedortransmittedinanyformorbyanymeans,eitherinwholeorinpart,withoutpriorwrittenconsentofJonesLangLaSalleIP,Inc.
COPYRIGHT©JONESLANGLASALLEIP,INC.2016
Prepared by:
LaurenceMarinResearchAnalyst+1 514 667 [email protected]
JonesLangLaSalleRealEstateServicesInc.RealEstateAgency1PlaceVilleMarie,Suite3838Montréal,Québec,H3B4M6Tel.+15148498849
Forfurtherinfomation,pleasevisitourwebsite:www.jll.ca
For more information, please contact:
MarkSinnettExecutiveVicePresidentRealEstateBroker+1 514 667 [email protected]
ScottSpeirsVicePresidentRealEstateBroker+1 514 667 [email protected]
JosephvonMaltzahnAssociateVicePresidentRealEstateBroker+1 514 667 [email protected]
RobertA.MacDougallSeniorVicePresidentCharteredRealEstateBroker+1 514 667 [email protected]
Armen MarkarianAssociateCommercialRealEstateBroker+1 514 667 [email protected]
SebastienGattiAssociateCommercialRealEstateBroker+1 514 667 [email protected]
AlexisAube-MartinSeniorFinancialAnalyst+1 514 667 [email protected]
YannCharlesAssociateCommercialRealEstateBroker+1 514 667 [email protected]
MCLaflamme-SandersBusinessManager+1 514 667 [email protected]
LaurenceBérardMarketing Assistant+1 514 667 [email protected]