investment corner participant communications an academic angle · 2 2015 mutual fund education...
TRANSCRIPT

Spring/Summer 2016
Ohio’s behavioral finance approach to improving participant outcomes
DC MattersInvestment cornerMoney market reform Page 14
Participant communicationsThe New Retirementality Page 18
An academic angleDear future selfPage 24

Understanding what drives participant behaviors can have a tremendous impact in helping to build a successful retirement program.
Welcome to the latest edition of DC Matters. We’re proud to bring you this publication, a recent STAR Award2 winner for its innovations in retirement thought leadership. Each issue of this publication ref lects our passion and commitment to helping plan sponsors understand the trends and nuances of the market. We hope you find the information and ideas contained in DC Matters to be helpful in your pursuit of better participant outcomes.
The evolution of DC plansAccording to a recent Willis Towers Watson study, DC/DB plan assets in the US are now split 60%/40%, respectively.1 This dynamic has added pressure for DC plans to fill in the retirement savings gap. The good news is that DC plan design and investment options are becoming more innovative and adaptable to participant needs. One of the biggest challenges we’ve seen for DC plans is that they empower people to make decisions on topics that are unfamiliar to them. This heightens the importance of auto enrollment, auto escalation, target date funds and advice solutions — which are all designed to help alleviate the complexity and burden participants face when figuring out how much to save and where to invest.
A behavioral economics perspectiveUnderstanding how people make decisions has spurred the growing field of behavioral economics. For DC plans, that includes designing communications around behavioral economic concepts and participant behavior. Participants may have the right intentions or beliefs, but their behavior isn’t always aligned with their beliefs in a way that leads to the best outcomes. A better understanding of what drives participant behaviors — in addition to building education and communication strategies based on that understanding — can have a tremendous impact in building a successful retirement program.
In this issue, we explore several key behavioral economic principles to help participants make choices that are more aligned with their retirement-savings objectives.
At the end of the day In our 35 years’ experience working with plan sponsors, we’ve watched DC plans evolve from a supplemental retirement vehicle to, in most cases, the primary means for retirement savings. DC plans are a much-needed means to help people save for retirement, and we are truly committed to helping participants get the most out of their plans.
Regards,
Marty Flanagan, President and CEO Invesco
Marty Flanagan with panelists Kevin Holt, Rob Waldner and Tim Bellman at a recent client event.
1 Source: Willis Towers Watson’s “Global Pension Assets Study 2016”2 2015 Mutual Fund Education Alliance STAR Award for Thought Leadership/White Papers in the Retirement Category for the Large Plus Asset Level. The STAR
judging system features key criteria that measure the elements of design, usability, content/message and educational value. Judging is performed by leading fund industry executives in marketing, communication, and design.

DC Matters Spring/Summer 2016 1
Table of contents
DC digestLessons from abroad
What we can learn from the UK DC system Page 2
Food for thought Just another manic Monday
Getting employees to read your benefits emails Page 4
Facts and figuresDC trends
Page 5
Plan sponsor forumOhio Deferred Compensation Program
Keeping it simple, playing it SMarT Page 6
Hail to the chief (economist)Global economic outlook
Diverging economies may bring further volatility to the markets Page 10
Investment cornerMoney market reform
Evaluating capital preservation options Page 14
Participant communicationsThe New Retirementality
What will retirement look like? Page 18
What’s up on Capitol Hill?Legislative insights
Retirement legislation on the horizon Page 20
An academic angleDear future self
Bonding with your future self to help boost retirement savings
Read the full story on Page 24
Nuts & boltsThinking of going custom?
Weighing the benefits and challenges of custom funds Page 28
Invesco’s official magazine for defined contribution plan sponsors
2
DC digestLessons from abroad
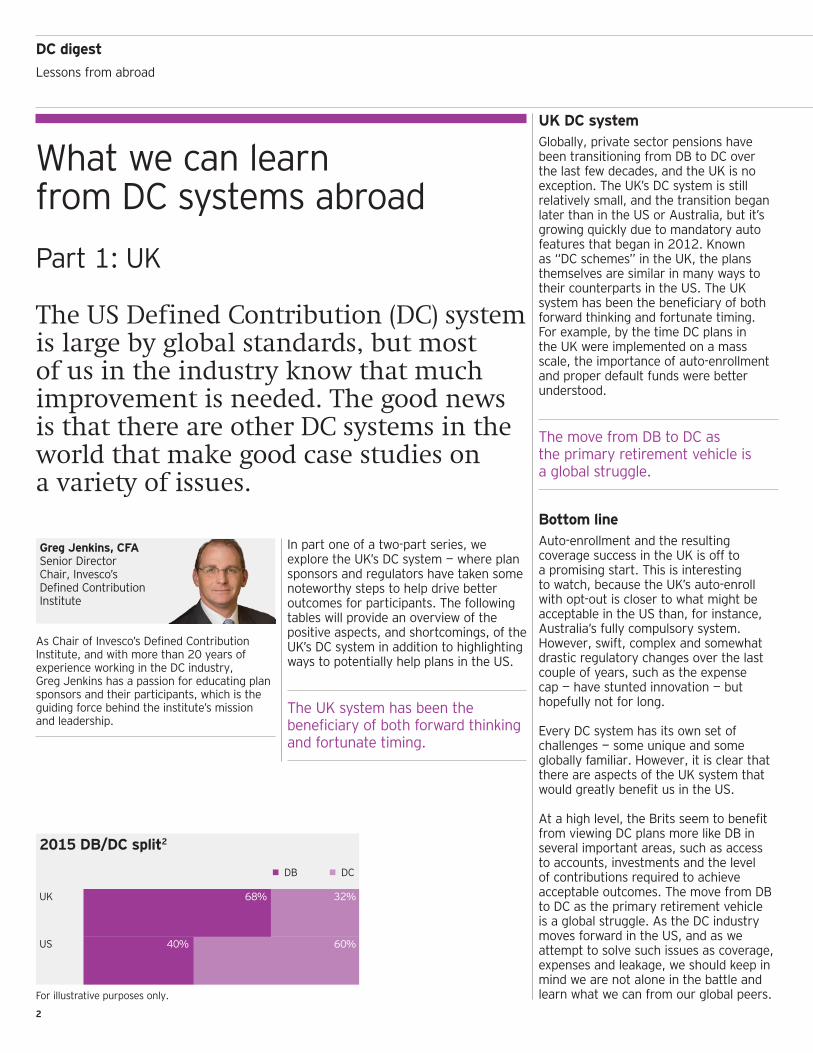
Greg Jenkins, CFASenior Director Chair, Invesco’s Defined Contribution Institute
As Chair of Invesco’s Defined Contribution Institute, and with more than 20 years of experience working in the DC industry, Greg Jenkins has a passion for educating plan sponsors and their participants, which is the guiding force behind the institute’s mission and leadership.
In part one of a two-part series, we explore the UK’s DC system — where plan sponsors and regulators have taken some noteworthy steps to help drive better outcomes for participants. The following tables will provide an overview of the positive aspects, and shortcomings, of the UK’s DC system in addition to highlighting ways to potentially help plans in the US.
The UK system has been the beneficiary of both forward thinking and fortunate timing.
UK DC systemGlobally, private sector pensions have been transitioning from DB to DC over the last few decades, and the UK is no exception. The UK’s DC system is still relatively small, and the transition began later than in the US or Australia, but it’s growing quickly due to mandatory auto features that began in 2012. Known as “DC schemes” in the UK, the plans themselves are similar in many ways to their counterparts in the US. The UK system has been the beneficiary of both forward thinking and fortunate timing. For example, by the time DC plans in the UK were implemented on a mass scale, the importance of auto-enrollment and proper default funds were better understood.
The move from DB to DC as the primary retirement vehicle is a global struggle.
Bottom lineAuto-enrollment and the resulting coverage success in the UK is off to a promising start. This is interesting to watch, because the UK’s auto-enroll with opt-out is closer to what might be acceptable in the US than, for instance, Australia’s fully compulsory system. However, swift, complex and somewhat drastic regulatory changes over the last couple of years, such as the expense cap — have stunted innovation — but hopefully not for long.
Every DC system has its own set of challenges — some unique and some globally familiar. However, it is clear that there are aspects of the UK system that would greatly benefit us in the US.
At a high level, the Brits seem to benefit from viewing DC plans more like DB in several important areas, such as access to accounts, investments and the level of contributions required to achieve acceptable outcomes. The move from DB to DC as the primary retirement vehicle is a global struggle. As the DC industry moves forward in the US, and as we attempt to solve such issues as coverage, expenses and leakage, we should keep in mind we are not alone in the battle and learn what we can from our global peers.
What we can learn from DC systems abroad
Part 1: UK
The US Defined Contribution (DC) system is large by global standards, but most of us in the industry know that much improvement is needed. The good news is that there are other DC systems in the world that make good case studies on a variety of issues.
2015 DB/DC split2
• DB • DC
UK 68% 32%
US 40% 60%
For illustrative purposes only.

DC Matters Spring/Summer 2016 3
Read Greg’s blog at blog.invesco.us.com
1 Source: Department for Work and Pensions 20142 Source: Towers Watson Global Pension Study 20163 Source: Barnett Waddingham/Standard Life DC Report, March 20164 Source: Spence Johnson, UK Defined Contribution Intelligence 20155 Source: nestpensions.org.uk6 Source: Plan Sponsor Council of America, 58th Annual Survey, 20167 Source: The Pensions Regulator, Automatic Enrollment Commentary and analysis, July 20158 Source: Aon UK Defined Contribution Survey, 20159 Source: Aon Hewitt 2014 Universe Benchmarks
Key takeaways
Multi-employer schemes – The government-sponsored National Employee Savings Trust (NEST) and the private People’s Pension are two of a handful of multi-employer schemes, or “master trusts,” as they are known in the UK. They are available to any self-employed person or employer.
– These schemes have been extremely successful in bringing high-quality, large employer-style plans to the small market. Master trusts now cover 33% of DC scheme members, with 1.7 million new members added in 2015 alone.4
Mandatory auto enrollment and minimum contributions
– Mandatory auto-enrollment is being phased-in between 2012 and 2017 — beginning with the largest employers.
– Opt-outs are allowed. Opt-out rates have been lower than expected at about 10%, with 56% of employers in one survey reporting opt-out rates of less than 5%.1,3
– 59.2% (5.2 million) of UK employees were automatically enrolled in a DC plan in 2015, up from 3 million in 2014.7
– Minimum contribution requirements are being gradually phased-in and will peak in 2019, with a minimum of 8% total contribution: 3% employer, 5% employee (including 1% tax relief).1
Higher use of default funds
– On average, 90% of participants utilize the plan’s default option.8 In the US, only 68% of participants have balances in default funds.9
– 84% of default funds are lifestyle options, which are glidepath-driven model portfolios.4 – Target date funds are not as common in the UK, but are beginning to gain traction.
Greater acceptance of alternative investments
– The use of alternative investment strategies is more common in UK DC plans than in the US, where alternatives adoption has been slow.6
– With larger plans, the alternatives exposure is typically found in lifestyle portfolios through multi-asset strategies called diversified growth funds (DGFs), similar to what is popularly used in UK DB plans. Among larger DC plans, 24% of default assets are invested in multi-asset portfolios.4
– Direct real estate is more common in UK DC plans, and is even included in the target date fund allocations for the government-sponsored NEST scheme.5
Limits on default fund charges
– The expense rates of default funds are now limited to 75 basis points due to a new regulation that took effect in 2015. One of the limiting features of the expense cap is that it includes most administrative costs.
Less leakage – Loans are not allowed, and hardship withdrawals have stricter standards than in the US.
Key challenges
Adjusting to flexible payout options
– Mandatory annuity payouts were dismantled somewhat unexpectedly in 2014. As a result, the glidepaths of many default lifestyle funds (which assumed an annuity purchase) have become incompatible with the needs of scheme members.
– Some plan sponsors and providers are adapting to the new rules by implementing two glidepath options for participants based on whether they plan to buy an annuity or not.
Auto enrollment administration
– Auto-enrollment has been successful in general, but it is an administrative burden for employers due to the complexity of the rules.3
Benchmarking – Due to the lack of reporting requirements in the UK, comparisons and benchmarking of scheme features have been challenging, particularly in the area of investments and default options.

4
Food for thoughtJust another manic Monday
Read Jeff’s blog at blog.invesco.us.com
Plan sponsors spend a significant amount of time crafting and deploying employee benefit communications, with 73% using email to get the word out. Despite these efforts, 80% of participants do not open/read materials and, of those who do open, almost half don’t fully understand the content.1
Jeffrey Hemker National Manager, Retirement DivisionInvesco
With more than 30 years of experience in the industry, Jeff Hemker has been a featured speaker at educational seminars and industry events throughout his career. He is a frequent blogger and shares his passion for helping improve participant retirement readiness. Mr. Hemker graduated from the University of Wisconsin-La Crosse and Roosevelt University. He is a Certified Investment Management AnalystSM (CIMA®) professional.
Have you noticed a manic feeling on Monday mornings when your inbox is packed with new email, but you’re in a hurry to get to work? So you scan through this deluge quickly, routinely deleting the apparently “unimportant” messages.
But wait … somewhere in this weekly rush may be opportunity lost — for you and certainly for employees. As plan sponsors, you often have important information to communicate to employees about their benefits — retirement changes, health plan offerings — many associated with critical deadlines. It’s imperative that employees read and internalize the information to get the most out of their benefits program — but how?
Fine-tune your timing What’s the takeaway from this Monday morning delete ritual? Simply that Monday isn’t the best time to send emails. In fact, research shows that most emails are read on Tuesday, Wednesday and Thursday. Interestingly, Tuesday and Thursday — two of the highest-volume days — are also the two days with the highest open rates.2
What is the optimal time of day to send your email? Think mid-week at midday — the highest percentage of email open rates occurs on Tuesday through Thursday, typically between 9 a.m. and 11 a.m. and again from 1 p.m. to 3 p.m.2
The ‘open’ questionAt the heart of the art and science of sending email communications is the question: How do I get my email opened? The answer has two key parts: subject line and preview text.
1. The most effective subject lines are short, descriptive and to the point. If employees read email on mobile devices, subject lines typically cut off at somewhere around 30 characters. If, for example, your subject line is, “Learn more about how you can save and invest in your retirement plan,” the recipient may see only this: “Learn more
about how you can…” That’s hardly a compelling invitation to open your email. “Are you prepared to retire?” or “Hurry. Deadline approaching.” are better subject lines.
2. Leverage preview text. Preview text is a snippet of copy — usually the first 75 to 100 characters — pulled from the body of your email and typically displayed underneath the sender and subject line in a subscriber’s inbox. Consider this text your extended subject line and craft it carefully. Here are three preview text tips:• Keep it under 75 characters.• Don’t repeat the subject line, elaborate
on it.• Use it as a teaser for your email content.
Be judicious with contentWhat can be opened can also be closed — and usually is if your email content isn’t compelling. Be disciplined about what you include. Some pointers:• Avoid randomly tossing every benefit
and plan feature into your email. Instead, pick a single hit-them-over-the-head theme and stick to it.
• Be punchy, use a lot of verbs, and avoid flowery or hyperbolic language.
• Because most readers skim rather than read, make it easy for them by using bullet points and bolded key phrases instead of paragraphs.
• Finally, remember the Rule of Three, the writing principle that readers are more likely to consume information when presented in threes.
If all else fails, you can always consider snail mail — a radical idea, for sure.
Getting employees to read your benefits emails
1 Source: International Foundation of Employee Benefit Plans, Benefits Communications Survey, February, 20162 Source: Mail Chimp, 2015

DC Matters Spring/Summer 2016 5
Facts and figuresDC trends
For more information, visit invesco.com/dc
Savings gap
The gender gapWhy are women on the hook to save more? Income disparities and time out of the workforce for childcare contribute to reduced retirement savings and Social Security. And women’s generally longer life spans can lead to an increase in health care and basic living costs.
At age 45, both men and women fall short of the savings they need to retire comfortably at age 65. But women are 26% further behind than men.1
Short$268,000
26% gap
Short$212,000
$ $ $$ $ $
Preparing for long-term care
of people age 65+
7
24
70% of people turning 65 can expect to use some form of long- term care during their lives.2
$21.86/hourly average cost of a home health aide.2
$95,707/year average cost of a private room in a skilled nursing home2
Going automatic3
9 out of 10annuity owners have a positive outlook and are confident about their lifestyle in retirement.4
DC plan sponsor adoption of automatic enrollment has increased 19% in the last five years.
4.2% average automatic deferral rate
47.9% of plan sponsors align automatic rates with the full company match
51.3% 2010
61.0%2015
Plugging the leak
Bridge jobsBridge jobs are increasingly popular among the American workforce, with 42% planning to “semi-retire” in the future.6
40¢
Age <55 contributions
Forty cents of every dollar savers under age 55 contribute to a DC account eventually leaks from the retirement system.5
1 Source: Financial Finesse, “2015 Gender Gap in Financial Wellness”2 Source: Lincoln Financial Group, “2013 Cost of Care Survey”3 Source: Callan, 2016 Defined Contribution Trends4 Source: LIMRA Secure Retirement Institute, Nov. 6, 20145 Source: PLANSPONSOR, “Leakage is a serious problem for 401(k) plans,” Feb. 8, 20166 Source: Reproduced with permission from “The Future of Retirement,” published in 2015 by HSBC Holdings plc.

6
Plan sponsor forumOhio Deferred Compensation Program
Keith Overly Executive DirectorOhio Deferred Compensation Program
Keith Overly has been the Executive Director of the Ohio Deferred Compensation Program (Ohio DC) since 2003. Ohio DC provides a supplemental defined contribution plan to Ohio local and state government employees and administers over 218,000 participant accounts and assets in excess of $11 billion. Before joining Ohio DC, Mr. Overly had 29 years of local government service in Ohio and Michigan including serving as chief financial officer in three cities and most recently, Deputy City Manager in Kalamazoo, Michigan. Mr. Overly is an Executive Board member of the National Association of Government Defined Contribution Administrators (NAGDCA). He is also a member of the Governmental Finance Officers Association (GFOA), the Ohio GFOA, the International Foundation of Employee Benefit Plans, and the Defined Contribution Institutional Investment Association (DCIIA). He is also a past member of the GFOA Executive Board and served on the GFOA Committee on Retirement and Benefit Administration for 13 years. Mr. Overly is a frequent speaker at professional conferences. His education includes a BA from Wittenberg University and MPA from the University of Dayton.
Keeping it simple, playing it SMarT
DC Matters interviewed Keith Overly, Executive Director of the Ohio Deferred Compensation Program, one of the largest 457(b) plans in the US. Under his guidance, the program has evolved innovative strategies that have helped boost enrollment and savings.

DC Matters Spring/Summer 2016 7
What are the main challenges you’ve encountered? Like many plan sponsors, our biggest challenge is addressing inertia. Most people either aren’t engaged or not sufficiently engaged in their retirement planning. Consequently, they’re not saving at all, not saving enough and not increasing their savings. Another challenge is unwise investment decisions, whether because of personal bias, loss aversion or lack of knowledge or time.
A challenge more specific to us is that we’re a multi-employer plan with more than 1,800 employers, many of whom aren’t sufficiently engaged to be effective partners in helping us encourage their employees to do a better job of saving for retirement.
What is your plan’s overall philosophy? Our program is a good value that offers quality investment options and services at a low cost. Within that construct, our philosophy is to keep it simple. We’ve initiated simpler, more effective ways to enroll, communicate and educate.
In addition, we have representatives throughout Ohio who conduct onsite enrollment and education at an employer’s request. We also have retirement planning specialists who focus on participants near or in retirement with one-on-one interviews and reviews with participants.
How do you keep it simple for employers? Employers typically have to take only minimal action to partner with us. For example, in addition to publishing a monthly employer newsletter, we create a monthly industry update article that employers can post on their websites as an employee education tool. We also have a portal on the Ohio Business Gateway — a website that aggregates state business-related functions — that enables employers to submit employee data and contributions to us electronically.
We’ve encountered some resistance. In some cases, employers feel that auto enrollment is too paternalistic. In other cases, though, I believe it’s an issue of status quo bias.
Can you describe your plan’s enrollment options?We offer four different types of enrollment process options so employers and employees can choose the one that best suits their needs:1. Auto enrollment, which we’ve tried to
make easy for employers 2. An easy enrollment form, which is
especially helpful, for example, in schools, where time with teachers is limited because they’re in class most of the day
3. An opt-in/opt-out enrollment form 4. A long form, which is for employees
who want to make their own investment decisions
How have employers adapted to your plan’s auto enrollment feature? We’ve encountered some resistance. In some cases, employers feel that auto enrollment is too paternalistic. In other cases, though, I believe it’s an issue of status quo bias where there’s either resistance to change or the feeling that it’s just easier to do things as they’re doing them now. Whatever the reason, I think it gets back to the lack of employer engagement in retirement planning.
How have you promoted the auto escalation feature, known as the SMarT program, with employees? We’ve pursued various marketing efforts — such as targeted emails, newsletters and web banners — to promote it. But a very effective promotion has been providing annual statements that include separate projections showing how enrolling in the SMarT program can significantly increase participant assets over time. We also insert SMarT enrollment forms in those statements. The result has generally been about 1,000 new SMarT enrollments within 30 days of those annual statements being sent.
We also recently redesigned our easy enrollment form and our opt-in/opt-out enrollment form with SMarT auto escalation as the default, unless a participant actively checks the exemption box. As a result, in 2015 we increased the percentage of new hires or new enrollments remaining on auto escalation from about 8% to 58%.
A very effective promotion has been providing annual statements that include separate projections showing how enrolling in the SMarT program can significantly increase participant assets over time.
Has the redesign of those enrollment forms to incorporate active choice principles been effective? Yes, but first let me offer some context. Our program is offered to all public employees in Ohio, including local and state government. State government is our single largest employer; roughly 25% to 30% of our total participants are state employees. When we learned that state employees may have been employed for several years before they heard about our program, we worked to pass legislation requiring all newly hired state employees to complete an opt-in/opt-out form.
When the institutional-looking form we originally developed resulted in an unsatisfactory level of employee noncompliance, we decided to redesign the form in a simple, more user-friendly format. We collaborated with the National Association of Retirement Plan Participants and Dr. Punam Keller, a behavioral change expert from Dartmouth College, to replace the more traditional opt-in/opt-out form with a behavioral-based form that incorporates active choice principles. The following excerpt shows how a graphic simplifies the concept of compounding returns.

8
Plan sponsor forumOhio Deferred Compensation Program Continued
When the institutional-looking form we originally developed resulted in an unsatisfactory level of employee noncompliance, we decided to redesign the form in a simple, more user-friendly format.
The form requests a thumbs-up/thumbs-down decision to help employees make the best selection by concisely explaining the consequences of their decision to either opt-in or opt-out.
We’ve asked all state of Ohio departments and agencies to include the form in their new hire orientation package. Even though that mandate is for the state employees only, roughly 200 local government employers have voluntarily chosen to use the form to compel an election from employees. That’s a side benefit that we didn’t anticipate initially.
Like our opt-in/opt-out form, our easy enrollment form, is designed to be read and completed in just a couple minutes.
We’ve had very good success with the simplified forms. For example, six months after we introduced the redesigned opt-in/opt-out form in January 2015, new enrollments for the state increased by about 25%. In addition, SMarT enrollments increased by about 41% last year. At year end, SMarT auto escalation enrollment had increased to 20,000 from 14,000, representing about 18% of all our program’s actively deferring participants.
Six months after we introduced the redesigned opt-in/opt-out form, new enrollments for the state increased by about 25%.
What was the genesis of your program’s innovative educational videos featuring Professor Penny? People are now getting the bulk of their information from the internet and smartphones. So we wanted to expand our capabilities to reach participants by combining behavioral concepts with these communication trends to appeal to today’s shorter attention spans.
Opt-in opt-out enrollment form
Facts and figures
New enrollments for the state increased by about
25%within six months after the form was redesigned.
SMarT enrollments for the state increased by about
41%
Data as of December 2015

DC Matters Spring/Summer 2016 9
Visit ohio457.org to view the Professor Penny video series
To make the topics of retirement planning and investing less intimidating, we decided to create short videos (two to three minutes) that simplify the explanation of plan features and investment concepts and eliminate jargon. The concept of Professor Penny resulted from brainstorming with Flickr-lit Productions, which produced the videos. The real Professor Penny, shown below, challenged us to explain complex topics in simple language that a nine-year-old could easily read from a sheet of paper.
How successful has Professor Penny been? About 90% of people who log in to our website just want to check account balances. Professor Penny is encouraging people to look beyond their balances and use the resources offered on the website. Whenever a new video goes live and we promote it, we see a very large increase in the number of people who visit the website pages.
People are now getting the bulk of their information from the internet and smartphones. So we wanted to expand our capabilities to reach participants by combining behavioral concepts with these communication trends to appeal to today’s shorter attention spans.
Ohio was an early adopter of the white label fund concept. How successful has that been with participants? Our stable value fund option has been white labeled for a couple of decades and currently holds about 40% of our total participant assets. The fund is popular, at least in part, because its objective is preservation of principal.
About 10 years ago, we decided to white label our target date funds. Our thinking was that people in those funds are generally less engaged and don’t want to make investment decisions themselves. There was no negative feedback from white labeling in this case; in fact, about 35% of our participants are currently invested in target date funds.
Within the last two years, we white labeled two replacement funds, a large-cap growth fund and an intermediate bond fund. We’ve seen more success with the large-cap growth fund. Despite cautioning participants not to make decisions on past returns, I believe acceptance of that fund is more a reaction to recent performance than a measure of acceptance of white labeling.
So we’ve dipped our toes into white labeling rather than jumping in altogether, in part because our plan competes with other plans on the local government level. We also know that many of our participants like brand name funds. We felt that going entirely with white label funds might drive some participants to go into competing plans with brand name funds and potentially higher fees.
What goals do you have for the program in the near future? We’re developing a more easily adaptable participant website that will simplify participant transactions. It will include new tools intended to help shift participant focus from short-term gains and losses to retirement planning. Introducing more white label investment options over time is also a goal. By doing so, we hope to focus participants more on the investment objectives than on brand names.
With an increasing number of baby boomer participants in or nearing retirement, we’re also focused more on retention efforts to encourage them to keep their money invested with us because we provide good investment options at a low cost that they may not get with an IRA. Our goal is to provide guidance during that big change in their lives.
We’ve dipped our toes into white labeling rather than jumping in altogether. We know that many of our participants like brand name funds.
What advice would you offer other plan sponsors? First, focus on improving the participant outcomes by looking at what your participants are doing and trying to ascertain where improvement is needed. For example, is there a problem with how they’re diversifying their portfolios? Or do they need to begin saving earlier or save more?
Then be willing to experiment by starting with desired outcomes, identifying key metrics and measuring your success. Our auto enrollment campaign, for example, started as a pilot project with just a few employers to test drive it before we rolled it out on a larger scale. Use participant focus groups to learn about their concerns and gauge their reactions to new concepts. Be open to continual improvement — in our experience, redesigning and refining communication tools and processes has been a gradual evolution.
Enhanced Active Choice is being applied and operationalized by the National Association of Retirement Plan Participants (NARPP) in the form of Intuitive Sustained Engagement (ISE). ISE is an intellectual property of NARPP and is being marketed to recordkeepers and to plan sponsors for a licensing fee.

10
Diverging economies may bring further volatility to the markets
Hail to the chief (economist)Global economic outlook
Read John’s blog at blog.invesco.us.com
US 2.1%
Eurozone 1.5%
UK 2.0%
The recovery in the US, already nearly seven years old, will not die of old age. Unless credit is tightened unexpectedly and the yield curve becomes inverted, business investment and consumer spending will continue to regain momentum.
John GreenwoodChief Economist Invesco
Based in London, John Greenwood is Chief Economist of Invesco Ltd. with responsibility for providing economic analysis and forecasts to Invesco portfolio managers and clients.
Summary
• Looking back at the first quarter of 2016, the key feature was the abrupt sell-off between the start of the year and mid-February in financial markets — equities, lower-rated corporate bonds and commodities. The sell-off was based on misplaced fears of recession in the US, added to concerns about the continuing slowdown in China and its impact on commodity markets. These anxieties proved to be misplaced principally because the key drivers of the US economic recovery remained intact.
• Influenced by the weakness in financial markets and indicators such as “financial conditions,” the Federal Reserve’s Open Market Committee (FOMC) postponed a widely anticipated
rate hike in March. Instead they published FOMC members’ fed funds rate expectations, which showed only two rate hikes during 2016.
The US is the only major economy where bank credit growth has returned to normal.
• However, the key indicator to watch was the rate of growth of bank credit. The US is the only major economy where bank credit growth has returned to normal. Even since the December rate hike, total bank loans have continued to grow at over 8% per annum to mid-March. This, together with balance sheet repair in the private sector, has enabled US equity markets to shrug off the early phase of interest rate hikes and return to end-December levels.
• By contrast, the eurozone and Japan are still in the midst of extended programs of quantitative easing (QE), intended mainly to keep interest rates low along the length of the yield curve (rather than directly to boost the rates of growth of money and purchasing power), and hence to stimulate the two economies.
DC Matters Spring/Summer 2016 11
Diverging economies may bring further volatility to the markets
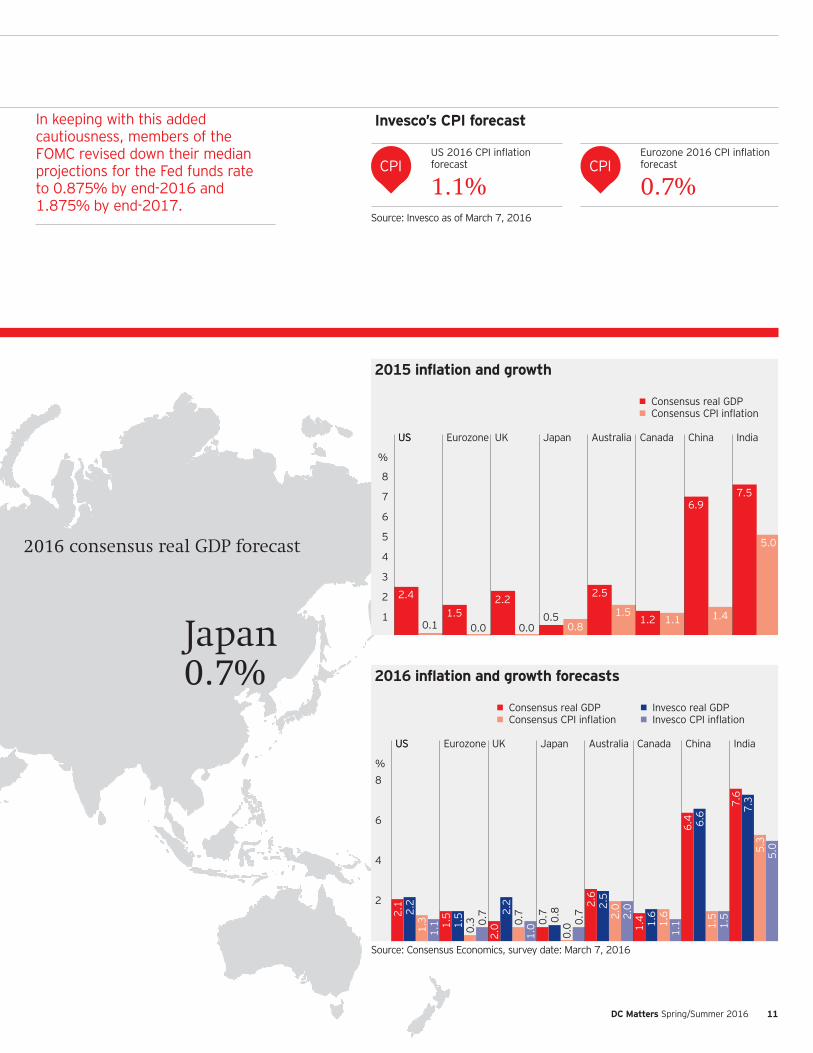
Invesco’s CPI forecast
CPIUS 2016 CPI inflation forecast
1.1%CPI
Eurozone 2016 CPI inflation forecast
0.7%Source: Invesco as of March 7, 2016
Eurozone 1.5%
Japan 0.7%
2015 inflation and growth
• Consensus real GDP• Consensus CPI inflation
US
%
2.4
0.11.5
2.2
0.00.5
0.8
2.5
1.51.2 1.1
6.9
1.4
7.5
5.0
0.0
IndiaChinaCanadaAustraliaJapanUKEurozone US
1
2
3
4
5
6
7
8
2016 inflation and growth forecasts
• Consensus real GDP • Invesco real GDP• Consensus CPI inflation • Invesco CPI inflation
US
%
2.1
2.2
1.3
1.1 1.
5
2.0
2.2
0.7
1.0 0.
7
0.0 0.
72.
62.
52.
02.
01.
4 1.6
1.6
1.1
6.4 6.6
1.5
1.5
7.6
7.3
5.3
5.0
1.5
0.3 0.
7
0.8
IndiaChinaCanadaAustraliaJapanUKEurozone US
2
4
6
8
Source: Consensus Economics, survey date: March 7, 2016
2016 consensus real GDP forecast
In keeping with this added cautiousness, members of the FOMC revised down their median projections for the Fed funds rate to 0.875% by end-2016 and 1.875% by end-2017.

12
Hail to the chief (economist)Global economic outlook Continued
• However, the QE programs of the European Central Bank (ECB) and the Bank of Japan (BoJ) both suffer critical design flaws. Hence both are failing to gain traction, and it is no coincidence that both the eurozone and Japan are experiencing sub-par growth, near-deflation and negative interest rates.
• In the UK, the Bank of England (BoE) is in an intermediate position. It implemented a textbook example of QE, but then it leaned too harshly on the banks, preventing any growth of their balance sheets.
Divergences in monetary policy between the Fed and the BoE on the one hand and the ECB and BoJ on the other imply probable further volatility in the currency, fixed income and equity markets.
• The overall picture is one in which both growth and inflation will remain subdued against the backdrop of very low money and credit growth during the past few years.
• In the emerging economies, the slowdown in China, together with ongoing recessions in Brazil and Russia, are impacting commodity markets. Despite the recent upturn in oil and iron ore prices, numerous basic industries have massive excess capacity that will likely weigh on global trade volumes for at least the next year — possibly longer.
• Beyond that, emerging market (EM) commodity producers are likely to suffer further currency depreciation, while EM manufacturers should start to benefit from the steady recovery in the US.
• In addition, the recovery in the US, already nearly seven years old, will not die of old age. Unless credit is tightened unexpectedly and the yield curve becomes inverted, business investment and consumer spending will continue to regain momentum.
United StatesWith the gradual healing of private sector balance sheets and the normalization of bank credit growth, domestic demand continued to grow moderately in the first part of the first quarter of 2016.
However, the recovery in core CPI inflation to 2.3% in February eroded personal incomes and outlays in the latter half of the quarter. As inflation stabilizes at a low rate of increase, I expect real GDP growth to resume a moderate upward path. For the year as a whole I forecast real GDP growth to be 2.2% on average.
Another area of continuing strength is the US labor market. In March, payroll employment grew by a solid 215,000, following an upwardly revised 245,000 in February. Even more significant, the strong expansion of the labor force and employment in February and March (averaging 388,000 per month) kept the unemployment rate at 5.0% in March.
On the inflation front, there has been excessive concern at the possibility of a return of inflation, often naively based on the threat of wage increases. The reality is that with no acceleration in money and credit growth, it is unlikely that inflation can increase significantly. For 2016, I forecast a 1.1% increase in headline CPI inflation, rising to 1.4% in 2017, still well below the Fed’s 2% target.
The eurozoneIn Europe, the second estimate of real GDP confirmed the slowdown in the euro-area in the fourth quarter of 2015 to 0.3% quarter-on-quarter, following on from 0.6% in the first quarter, 0.4% in the second quarter and 0.3% in the third quarter. The net result was an overall growth rate for 2015 as a whole of just 1.5%.
The ECB’s QE program continues to be less stimulating to markets and the broader euro-area economy than it should be due to basic design flaws. It is no coincidence that the two main areas that are experiencing negative interest rates, sub-par growth and near-deflation — i.e., Japan and the eurozone — are also the economies where the major central banks have implemented flawed versions of QE.
The fundamental problem is that the ECB and the BoJ are trying to implement QE through the normal credit creation channels of the banking system (which aren’t working) and relying on interest rate cuts, instead of creating new money in the hands of firms and households outside of the banking system by asset purchases directly from these non-bank entities.
United KingdomThe recovery of the UK economy continued in 2015 but slowed from 0.7% real GDP growth per quarter in 2014 to just over 0.5% per quarter in 2015. As in previous years of this recovery, services have been leading the way, with manufacturing and construction lagging behind. Personal consumption has been firm, helped by the decline in the inflation rate, which has temporarily boosted real wages. Overall, however, the real growth rate of the UK economy remains subdued, with the Office for Budget Responsibility (OBR) forecasting 2.0% for 2016.
These arguments (for and against the Brexit) will no doubt continue until the last hours or even minutes before referendum day, implying that investors must expect further turbulence in the pre-referendum period.
Two politically driven events dominated the first quarter in the UK: the decision by the Conservative government to call a referendum on June 23 to determine whether the UK will remain in the European Union (EU) or leave, and the budget on March 16. The outcome of the referendum on British membership of the EU — which has come to be known as the Brexit debate — looks very evenly balanced. From an economic and market

DC Matters Spring/Summer 2016 13
Follow us on twitter attwitter.com/InvescoUS
viewpoint, voting to leave would doubtless generate huge uncertainty compared with voting to remain. On the other hand, there can be little doubt that the bureaucracy in Brussels has become a significant financial burden for UK industry, and the UK economy might well be able to grow more vigorously outside the EU than within it.
JapanGrowth in Japan slumped in the fourth quarter of 2015, falling by 0.3%, leaving overall growth for the calendar year at just 0.5% — a disappointing outcome after three years of Abenomics since the election of December 2012.
The stronger yen has been threatening weaker profits for exporters, leading to downward pressure on wage negotiations. As a result, wage increases are expected to be below 2% in 2016, suggesting another year of lackluster consumption spending.
On the monetary policy front, the big event of the quarter was the adoption of negative rates by the BoJ Policy Board on Jan. 29. This is a drastic move, prompted by the failure of all previous QE to move the dial on growth or inflation. The decision led to a sharp fall in the value of the yen, a momentary upward movement in the stock market, but a sharp weakening of bank shares and the overall market in early February. In sum, the economy appears marooned in the doldrums.
China and non-Japan AsiaThe slowdown in world trade has hit China and other Asian economies especially hard. Asian emerging markets are heavily reliant on exports. Entrepôt economies such as Hong Kong and Singapore naturally have export levels that are multiples of their national incomes. Therefore, declines in exports are having a dramatic effect on East Asian economies’ reported GDP growth rates.
There are three main explanations for this collapse in trade. Firstly, the QE programs in the US, the EU and Japan have boosted asset prices but have had little effect on consumer demand.
Secondly, there has been a collapse of demand in the commodity-producing countries, such as Russia and Brazil, due to their weakening terms of trade (the fall in their export prices relative to their import prices). Thirdly, even the import of components to China has declined as more of the Asian supply chain has been relocated to China itself.
CommoditiesSo far in 2016, the commodity markets have seen a bounce. Brent Crude is up 41% from its low of US$26 per barrel on Jan. 1, 2016, to US$36.70 as of March 29, 2016. Gold has seen an 11.3% rise since January to US$1,214 per ounce. However the fundamentals that led to the dramatic falls in the commodity markets since mid-2014 still persist. These include: the slowdown in China, the recessions in Brazil and Russia, the emergence of new supplies of energy such as US shale oil, Iran and Iraq ramping up production, and commodity investment projects in Chile and elsewhere coming on stream. Given that the fundamentals have not improved, the recent recovery in commodity prices seems destined to be a false dawn.
Since it will take several years for the leading EM economies to repair their balance sheets and restore internal and external balance, it must be expected that commodity prices, global economic activity and global inflation will all remain subdued for at least the next year or two.
ConclusionThe two key problems facing the developed economies been the inter-related issues of balance sheet repair in the private sector and the lack of money and credit growth from the banking system. These are the primary explanations for sub-par growth, near-deflationary conditions, and — most recently — negative interest rates in Japan and the Eurozone.
While the US and the UK are generally emerging from these problems, they nevertheless must attempt to recover and grow in an environment that is adversely affected by the policy missteps in the euro-area and Japan. These problems will continue to act as a drag on global growth in 2016 and into 2017.
Added to the problems of the developed economies are the more recent recessions and slowdowns in the EM arena. Their problems follow directly from the huge stimulus policies enacted in these countries in the aftermath of the global financial crisis. Too much money and credit has built up a vulnerability to debt that must now be unwound. Many of the EM economies were also very dependent on commodity exports, and the collapse of commodity prices will depress incomes in these economies. Since it will take several years for the leading EM economies to repair their balance sheets and restore internal and external balance, it must be expected that commodity prices, global economic activity and global inflation will all remain subdued for at least the next year or two.
1 Source: BloombergAll data provided by Invesco unless otherwise noted. Data as of March 7, 2016, unless otherwise noted. Unless otherwise specified, data was supplied by
Mr. Greenwood. Where John Greenwood has expressed opinions, they are based on current market conditions as of April 1, 2016 and are subject to change without notice.

14
Investment cornerMoney market reform
Jennifer Gilmore, CFA® Head of Stable Value Portfolio Management, Senior Portfolio Manager, Invesco
Jennifer Gilmore is responsible for the development of Invesco’s stable value portfolio strategy and for ensuring this strategy is consistently applied across the firm’s portfolios. Ms. Gilmore earned a BA degree in finance from Transylvania University and an MBA from Rollins College. She is a CFA charterholder and a member of the Women’s Bond Club of New York and the Invesco Women’s Network management committee.
Andy Apostol, CEBSHead of Stable Value Client Service, Invesco
Andy Apostol has 23 years of stable value experience and is responsible for overseeing stable value client relationships, developing capital preservation thought leadership and representing stable value. Mr. Apostol, who earned a BS degree in business administration from the University of Oregon, holds a Certified Employee Benefits Specialist (CEBS) designation and is a member of the International Foundation of Certified Employee Benefits Specialists. Mr. Apostol is active in Toastmasters International and a member of the Phoenix Society of Financial Analysts.
DC plans have typically selected between money market and stable value funds as their capital preservation option. However, recent reforms to the rules governing money funds will add administrative complexity to institutional prime funds frequently used in DC plans, causing plan sponsors to reevaluate their capital preservation options. In this article, we briefly outline the new money market fund regulatory reforms and their impact on DC plans.
The US Securities and Exchange Commission (SEC) has approved amendments to Rule 2a-7, which governs money market funds, setting in motion several structural and operational reforms that are scheduled to take effect in October 2016.
Evaluating capital preservation options
In light of US money market reforms, many defined contribution (DC) plan sponsors and consultants are weighing the pros and cons of their capital preservation choices in terms of yield, daily liquidity needs, net asset value stability and liquidity restrictions.

DC Matters Spring/Summer 2016 15
Money market fund reformsSeveral structural and operational reforms are scheduled to take effect Oct. 14, 2016.
Exhibit 1: Summary of operational changes
Floating net asset values (NAV)
Institutional prime and municipal money market funds will be required to transact at floating net asset values.
Liquidity fees Money fund boards will have discretion to impose up to a 2% liquidity fee during periods when the fund’s weekly liquid assets fall below 30%. Funds will be required to impose a liquidity fee of 1% if the weekly liquid assets fall below 10% (unless the fund’s board determines that imposing such a fee is not in the best interests of the fund).
Redemption gates Boards will have discretion to temporarily suspend redemptions if the weekly liquid assets fall below 30%. The maximum payout deferral will be 10 business days over any 90-day period.
Exhibit 2: The net result of money market reforms will be the creation of three distinct money market fund categories
Retail money market funds Institutional prime and municipal money market funds
Government money market funds
Price (NAV) type Stable $1 Floating Stable $1Liquidity fees Yes Yes OptionalRedemption gates Yes Yes Optional
Category 1: Retail money market fundsThe new reforms limit access to retail money market funds to “natural persons.” Under the reform, the definition of a natural person was expanded to include individual investors in DC plans, individual retirement accounts (IRAs), educational 529 plans, health savings plans and ordinary trusts. The new reforms allow DC plans to invest in retail funds that will not be subject to the floating NAV.
Considerations that must be addressed related to retail money market funds include:• Plan administrative issues similar
to those outlined previously for institutional prime money market funds
• Forfeitures for terminated employees with balances in the plan — the natural persons test would be violated once the forfeited balance is no longer attributable to the individual participant, leaving some ambiguity regarding the fund’s ability to meet the new regulatory requirements.
Category 2: Institutional prime money market fundsInstitutional prime funds are drawing much attention from DC plan sponsors, as they consider whether a floating net asset value prime fund meets suitability requirements as a capital preservation option. While withdrawal fees may not be palatable for plan participants, redemption gates could be more problematic with today’s DC plans, where daily valuation and unrestricted trading have become the norm.
There are several issues that plan sponsors must consider in making such decisions, including:• Recordkeeping systems.
Recordkeepers must build the systems and technology to administer liquidity fees and redemption gates that would apply to both retail and institutional prime money market funds.
• Administration. Plan sponsors and recordkeepers will need to establish processes for administering liquidity fees and redemption gates should the fund manager announce the implementation in the middle of a trading day.
• Participant communication. Floating NAVs, liquidity fees and redemption gates are material considerations that may need to be formally communicated to plan participants. Importantly, the SEC provided guidance clarifying its position that floating net asset value funds may not state that they will seek to maintain stable net asset values, as share prices will fluctuate.
Category 3: Government money market fundsGovernment money market funds will retain the most-desired traits for a capital preservation option — a stable $1.00 net asset value, same-day liquidity, no required liquidity fees or redemption gates. These traits will most likely be appealing to DC plan sponsors. The level of demand for securities that meet the requirements for government money market funds, as well as the impact on yield, are still yet to be determined.

16
Investment cornerMoney market reform Continued
Stable value fundsStable value funds, which are available only to DC plans, are a fourth capital preservation alternative. Stable value funds are designed to provide plan participants with a positive daily return, as is the case with money market funds and bank savings accounts.
While money market yields reflect rates available in the cash market, stable value funds have historically produced returns that are comparable to high-quality, short- to intermediate-term bond funds over full market cycles. Stable value funds consist primarily of investment contracts issued by a financial institution that are paired with portfolios of fixed income securities, i.e., bonds.
The investment contracts smooth the volatility of the underlying fixed income investments, resulting in a positive return that gradually tracks changes in market interest rates. While bond prices fluctuate based on changes in interest rates, the investment contracts allow participants to transact at contract value (principal plus accrued interest) without experiencing principal fluctuations.
Plan participants have daily access to their stable value balances under normal plan operations to make investment transfers or to take distributions allowed under the plan. Stable value funds are subject to different regulations than money market funds and are therefore not impacted by the recent SEC money market fund reforms.
Evaluating performanceAn important consideration in evaluating the capital preservation options are their return characteristics. Exhibits 3 and 4 illustrate the historical stable value performance relative to money market and fixed income investments. In addition, stable value and money market funds have produced positive daily returns without the volatility typically seen in bond funds.
While bond funds immediately recognize gains and losses resulting from changing market interest rates, stable value funds amortize gains and losses through the crediting rates of the investment contracts.
Exhibit 3: Volatility of stable value monthly returns relative to money market and fixed income investments
• Stable value • Short-term bonds • Money market
-1.5-1.0-0.50.00.51.01.52.0
201520142013201220112010200920082007200620052004
Monthly gross returns %
Source: Invesco, iMoneyNet and Barclays. Data from Jan. 1, 2004, through Dec. 31, 2015. Chart prepared using index performance results from Invesco, iMoneyNet and Barclays and calculations from our internal Invesco system. Gross-of-fee returns are presented gross of management fees, but net wrap, subadvisor and other expenses. Net returns will be lower. Past performance is not a guarantee of future results. An investment cannot be made directly in an index.
Exhibit 4: Historical stable value performance relative to money market and fixed income investments
• Stable value • Short-term bonds • Money market
Annualized gross returns %
1 year 3 years 5 years 10 years
1.83
0.02 0.57
1.67
0.02 0.53
1.88
0.020.73
2.92
1.14
2.51
1
2
3
Source: Invesco, iMoneyNet and Barclays. Data from Jan. 1, 2005, through Dec. 31, 2015. Gross of fee returns are presented gross of management fees, but net wrap, subadvisor and other expenses. Net returns will be lower. Past performance is not a guarantee of future results. An investment cannot be made directly in an index.
Exhibit 5: Participant growth of $1.00 1/1/04–12/31/15
• Stable value • Money market
1.00
1.10
1.20
1.30
1.40
1.50
1.60
$ 2004 2005 2006 2007 2008 2009 2010 2011 2012 2013 2014 12/15
$1.45
$1.16
Source: Invesco, iMoneyNet and Barclays. Data from Jan. 1, 2004, through Dec. 31, 2015. Gross-of-fee returns are presented gross of management fees, but net wrap, subadvisor and other expenses. Net returns will be lower. Past performance is not a guarantee of future results. An investment cannot be made directly in an index.
Exhibits 3–5 are represented in the charts above: Barclays 1–3 Year Government/Credit Index (Short Bond), iMoneyNet MFR Money Funds Index (Money Market). The Invesco Stable Value Trust is used as a proxy for stable value.

DC Matters Spring/Summer 2016 17
Read our blogs atblog.invesco.us.com
1 SVIA Investment & Policy Survey for 2014 released May 26, 2015 (http://www.stablevalue.org/news/surveys).2 Source: iMoneyNet, Inc. as of Sept. 30, 2015
Stable value has not experienced the monthly return volatility that is typical of bond products.
Capital preservation options have long been a staple for pre-and post-retirees to help reduce volatility and uncertainty.
As illustrated in Exhibit 4, stable value funds have delivered returns that are comparable to short-to-intermediate duration, high-quality fixed income investments over a full market cycle. While the Fed’s accommodative monetary policy has driven the return difference between money market funds and stable value funds to historically wide levels, it is also demonstrated in Exhibit 5 that stable value investments have
outperformed money market investments over the last two decades, creating more wealth for DC plan participants.
Plan sponsor considerationsWhile plan sponsors are free to continue to offer institutional prime money market funds within their DC plans, the introduction of floating NAVs and liquidity restrictions pose several administrative and communication issues worthy of consideration. Sponsors wishing to avoid floating net asset values, redemption gates and liquidity fees will most likely focus on stable value and government money market funds. It’s an important fiduciary decision that entails having a healthy understanding of the new rules and the impact they may have on participants.
It’s an important fiduciary decision that entails having a healthy understanding of the new rules and the impact they may have on participants.
Capital preservation is an important part of investor portfolios
Assets invested in stable value funds:
$721 billionAssets invested in money market funds:
$972 billionSources: SVIA Investment & Policy Survey for 2014 released May 26, 2015, and iMoneyNet, Inc. as of Sept. 30, 2015
Exhibit 6: Stable value vs. government money market funds
Stable value funds Government money market funds
Asset class Asset class
– $721 billion1 invested in stable value assets– Available in nearly half of all 401(k) plans– A conservative investment option only available in tax
qualified DC plans
– $972 billion2
Investment objectives Investment objectives
– Preservation of principal– Liquidity at book value– Competitive yields (intermediate)
– Preservation of principal– Liquidity– Competitive government money
fund yield
Potential benefits to investors Potential benefits to investors
– Same-day liquidity– Principal stability and daily rising NAV– Long-term returns consistent with short-term bonds
(see Exhibit 4)
– Same-day liquidity – Principal stability and stable NAV – US government investments
Impact of money market reform Impact of money market reform
– Does not apply to stable value, as it’s not a money market fund
– Retain stable net asset value– Fees and gates optional– Strengthened government fund definition

18
DC plan sponsors are continually challenged with finding the best approach to educating employees about the importance of planning, investing and saving enough for a comfortable retirement.
Invesco Consulting has learned from our instant response “dial” research that a fear-based approach backfires when trying to inspire employees to save more for retirement. Instead, visualization exercises are a good tool to use, beginning with three critical questions people typically ask themselves as they look ahead to retirement:1. What will my retirement look like?2. When is it going to happen?3. How am I going to get there?
Idea 1: The power of visualizationIncentivizing employees to save and plan for retirement should start with a vision. Let’s focus on the first question above with two ideas you can adapt when conducting employee education meetings or drafting retirement education communications.
What will my retirement look like? That is both a very simple and very profound question. Visualization exercises can help employees clarify what role work may play in their later years.
When we’ve asked employees to visualize their retirement, we often hear “gardening,” “time with grandchildren” or even “lots of golf.” However, it’s important to think through the actual number of hours in a day and how to fill them. By filling in how long they plan to golf or host grandchildren on the worksheet below, employees can more clearly visualize what a 16-hour day (plus eight hours of sleep) in retirement might look like.
What will the ideal week in retirement look like?
Morning Afternoon Evening
Sunday
Monday
Tuesday
Wednesday
Thursday
Friday
Saturday
Participant communicationsThe New Retirementality
To learn more, visit the participant communication page at invesco.com/dc
What will retirement look like?
Lisa KuengDirector, Creative CampaignsInvesco Consulting
Lisa Kueng is a national speaker and the developer of many of Invesco’s consulting programs, including the “Your Prosperity Picture” workshop for women investors and “The New Retirementality,” and is co-author of “Picture Your Prosperity: Smart Money Moves to Turn Your Vision into Reality.” Ms. Kueng has been a keynote presenter at hundreds of industry conferences and has been featured in Business Week, The New York Times, NPR’s “Marketplace Weekend” and Fund Marketing Alert. Lisa holds a BS degree in journalism with a concentration in speech communications from the University of Illinois and has earned her Registered Corporate Coach designation. She is currently a member of the Invesco Women’s Network, a volunteer for One Million Degrees and a regular guest speaker at Loyola University in Chicago.

DC Matters Spring/Summer 2016 19
After completing the worksheet, most retirees realize not only how much time is available in retirement, but also that hobbies can fill only so much of the day. Many are more receptive to exploring other opportunities that having all that time affords them.
Exercise 2: Earning a ‘playcheck’If your employees are like 84% of baby boomers who expect work to be part of the future, the “playcheck” exercise can help them design a future plan that may include work. Invesco Consulting’s “The New Retirementality” is about identifying aptitudes and passions and finding a way to pursue them, ideally while also getting paid. In essence, the program’s goal is to help employees focus on collecting a “playcheck” — instead of a paycheck — for doing something so enjoyable that it almost feels like getting paid for play.
To begin the second visualization exercise, share this with your employees:
• I’d like to share a story about Bruce. He’s 72 years old and on his third career. He started off as a military pilot for 20 years. In his 40s, he retired from the Air Force, but not the workforce. Instead, he went back to school, got a PhD in psychology, and worked as a clinical psychologist until he retired again at 65 years old. But he wanted to find another challenge he could sink his teeth into.
• Interestingly, he found financial planning. He loves what he does — meeting with friends, talking about what’s important to them, and helping them identify solutions to their financial challenges. At 72, he intends to keep doing this as long as possible.
Then ask: What exactly does the term “playcheck” mean to you?
To help employees define that, ask them to contemplate these questions as a starting point to help jump-start their thinking about the specifics of what work might look like in the years ahead.
Creating your ‘playcheck’
1. What do you like best about the work you do?
2. What do you like least about your work?
3. What would the ideal working scenario look like?
4. What sort of work are you most passionate about and could do forever?
Bottom lineLook at ways to motivate employees by helping them visualize what their retirement will look like. Help them shift their focus from money exclusively to discover what to do in retirement — because if they can visualize it and be inspired, they’re more likely to commit to it.
“The New Retirementality” is based on The New Retirementality: Planning Your Life and Living Your Dreams at Any Age You Want, Second Edition by Mitch Anthony (©2006) published by Kaplan Business. Used with permission. Invesco Distributors, Inc. is not affiliated with Mitch Anthony.

20
What’s up on Capitol Hill?Legislative insights
Prospects for further development in 2016
2015 was not an extraordinarily active year for retirement-related legislative initiatives … but the 114th Congress still passed twice as many total bills that were signed into law by President Barack Obama as the 113th Congress did in its first year.
Much of the discussion concerning retirement centered on the increased emphasis on retirement readiness.
The “newsmaker of the year” on the regulatory front in the retirement space has been the ongoing saga of the re-proposed fiduciary regulation issued by the Department of Labor (DOL) in April 2015.
Jon VoglerSenior Analyst, Retirement Research, Invesco Consulting
Jon Vogler draws on his extensive pension expertise to offer retirement insights for Invesco. In addition to writing retirement blogs, he tracks legislative and regulatory developments and contributes as a writer and editor to a variety of retirement-related Invesco communications. Mr. Vogler has spent more than 25 years in the research, writing, compliance and underwriting areas of the retirement services industry.

DC Matters Spring/Summer 2016 21
Read Jon’s blog at blog.invesco.us.com
We expect this focus on participant outcomes in retirement to increase in 2016 through greater emphasis on automatic contributions, targeted participant communication and lifetime income strategies.
Retirement readiness
After years of concentrating on methods to boost coverage and participation in employer-sponsored retirement plans, there was a renewed focus in 2015 on the concept of retirement readiness — evaluating whether participants have enough monthly income for the retirement
years. We expect this focus on participant outcomes in retirement to increase in 2016 through greater emphasis on automatic contributions, targeted participant communication and lifetime income strategies.
Fiduciary definition AaAa
On April 6, 2016, the DOL released its long-awaited final fiduciary rule that expands the types of retirement investment advice covered by fiduciary protections.
As a background, on April 14, 2015, the DOL reproposed a regulation to replace a 1975 regulation that has a five-part functional test of what constitutes
investment advice and therefore triggers fiduciary status.
The DOL initially proposed a replacement to the 1975 rule in 2010 but withdrew it in 2011 amid a firestorm of criticism from the financial services industry and members of Congress that the rule was overbroad, the problem hadn’t been thoroughly analyzed, and the higher compliance costs resulting from the proposed solution would preclude broker-dealers and advisors from offering guidance to lower- and middle-income investors.
The final fiduciary rule defines a fiduciary as any individual receiving compensation for making investment recommendations to plan sponsors, plan participants, or IRA owners based on the particular needs of the advice recipient or directed to specific advice recipients regarding the advisability of a particular investment decision. According to a White House

22
What’s up on Capitol Hill?Legislative insights Continued
factsheet, being a fiduciary under the final regulation means that an advisor must provide impartial advice in the client’s best interest and cannot accept any payments creating conflicts of interest unless the advisor qualifies for an exemption intended to ensure that the customer’s interests are protected.
The final DOL fiduciary rule specifies that investment education is exempt from the definition of investment advice, if certain conditions are met, so advisors can provide education on retirement savings if they follow the rules set forth in the regulation.
The rule clarifies what does and does not constitute fiduciary advice, and includes examples of communications that would not rise to the level of a recommendation and thus would not be considered advice. It specifies that investment education is exempt from the definition of investment advice, if certain conditions are met, so advisors can provide education on retirement savings if they follow the rules set forth in the regulation.
While the final rule is quite similar to the previous version of the rule issued in April 2015, it does reflect some changes proposed in a round of hearings held in August 2015 and the DOL’s receipt of thousands of comment letters from financial services firms, industry trade associations, think tanks, consumer groups and members of Congress. The final rule retains the core fiduciary standard requiring that advisors and brokers act in their clients’ best interests, as well as the extension of fiduciary coverage for IRAs and rollover advice.
Modifications found in the final rule include clarification of the best interest contract (BIC) exemption, which permits advisors to receive forms of variable compensation, such as commissions, provided that certain conditions are met and a range of disclosures are offered. In addition, under the final rule, recommendations to plan sponsors managing more than $50 million in assets (versus $100 million in the proposed rule) will not be considered investment advice if certain conditions are met and thus will not require an exemption.
The fiduciary standard with respect to investment advice as provided for in the final rule will become effective in April 2017, as will a subset of the features necessary to comply with the BIC
exemption. The full phase-in of the BIC exemption requirements must be done by Jan. 1, 2018.
Fee disclosure
In March 2014, the DOL issued a proposed rule that would require service providers who use multiple or lengthy documents to meet Section 408(b)(2) fee disclosure obligations to provide a guide to help plan fiduciaries review required disclosures. This rule was opposed by retirement industry groups who noted that there is not a “compelling need” for such a detailed guide, which they said would drive up compliance costs. The DOL was scheduled to provide a final rule requiring a guide or similar arrangement for 408(b)(2) disclosures in September 2015, but that did not occur. This was among several items put on the back burner by the DOL in the wake of the fiduciary rule reproposal; it may reappear in 2016.
Annuity guidance
In July 2015, the DOL provided clarification about the fiduciary duties plan sponsors have in selecting annuities for defined contribution plan menus, largely that sponsors must periodically evaluate products and providers for as long as the products are offered as options on the plan menu. That duty ends when the product is no longer on the menu, the DOL explained.
The guidance states that “the prudence of a fiduciary decision is evaluated with respect to the information available at the time the decision was made — and not based on facts that come to light only with the benefit of hindsight.” Further, the periodic review of annuities is dependent on “facts and circumstances” that could trigger a red flag, such as a downgrade to the credit rating of the provider or other signals of faltering financial health.
Complaints received from participants about late payments could also prompt reviews. Plan sponsors would not be

DC Matters Spring/Summer 2016 23
required to review annuity providers each time a participant elects an annuity at distribution, the DOL notes.
According to experts, another issue raised by the guidance is that the periodic review of annuities selected for a plan might be in conflict with a recent US Supreme Court ruling in the landmark 401(k)-fee case Tibble v. Edison. The high court determined that plan fiduciaries have an ongoing duty to monitor 401(k) investments, though the DOL’s guidance points to the six-year statute of limitations following a participant’s selection of an annuity.
Another factor that might discourage sponsors from considering annuities in 2016 is that there are limited resources for easily comparing such insurance products, though there are ratings agencies that cast light on insurers.
State-run retirement programs for private-sector employees
Over the past two years, an increasing number of states have begun to consider bills that would establish state-run retirement plans for private-sector employees. A few states (e.g., Illinois and California, among others) have passed laws providing for these plans. One sticking point that emerged during this process was the question of whether these plans would be subject to the protections and conditions of ERISA. In fact, several state program outlines were drafted to be contingent on ERISA not applying to the program.
On Nov. 16, 2015, the DOL unveiled its proposed rule to clarify the application of ERISA to state-run IRA programs, which includes modification of the existing payroll deduction safe harbor. The proposal allows for an ERISA exemption for IRAs that feature auto enrollment and payroll deduction and are offered by states as a default program where an employer is required to sponsor a plan. Several conditions apply to the modified safe harbor, including (a) the program is established by a state pursuant to state law, (b) the program is administered by the state establishing the program, or by
a state agency or instrumentality that is responsible for investing the employee savings or for selecting investment alternatives for employees to choose, (c) the state assumes responsibility for the security of payroll deductions and employee savings, (d) participation in the program is voluntary for employees, (e) the employer’s participation in the program is required by state law, and (f) the employer’s involvement is limited to the following: (i) collecting payroll deductions and remitting them to the program, (ii) providing program information to employees, (iii) maintaining records of payroll deductions and remittance of payments, and (iv) providing information to the state necessary to the operation of the program.
The DOL also released Interpretive Bulletin 2015-02, which offers guidance on three approaches [marketplace, prototype plan or multiple employer plan (MEP)] a state could select to facilitate the adoption of ERISA-covered plans by private employers. While several organizations support state-run programs for private-sector employees on the grounds that they will boost coverage levels and retirement savings amounts, there are lingering concerns among some observers about (a) the potential for these programs to undermine incentives for small businesses to start or continue their own retirement plans and (b) the DOL’s analysis permitting certain state-run plans to be exempt from ERISA. We’ll have to wait and see how much further these state-run plans for private sector employees advance in 2016.
Impact investing for retirement plans
In new guidance issued in 2015, the DOL said that its 2008 declaration that fiduciaries may never subordinate the economic interests of the plan (participants and beneficiaries) to unrelated objectives “has unduly discouraged fiduciaries from considering economically targeted investments (ETIs) and environmental, social and governance (ESG) factors under appropriate circumstances” in retirement plan investing.
“In particular, the DOL is concerned that the 2008 guidance may be dissuading fiduciaries from (1) pursuing investment strategies that consider ESG factors, even when they are used solely to evaluate the economic benefits of investments and identify economically superior investments, and (2) investing in ETIs even where economically equivalent,” the new guidance read. “Some fiduciaries believe the 2008 guidance sets a higher but unclear standard of compliance for fiduciaries when they are considering ESG factors or ETI investments.”
The 2015 guidance actually elevated ESG factors from “tiebreaker” status. “Such issues are not merely collateral considerations or tie-breakers, but rather are proper components of the fiduciary’s primary analysis of the economic merits of competing investment choices.”
The new 2015 guidance basically returns to the standard in a 1994 interpretive bulletin that assured fiduciaries that in so-called “tiebreaker” scenarios, where they are choosing between two options, they can weigh the benefits of choosing the more targeted strategy focused on values or principles “when investments are otherwise equal with respect to their economic and financial characteristics.” It continues to stress the primary importance of risk and return when choosing investments, but notes that “ESG issues may have a direct relationship to the economic value of the plan’s investment.”
The 2015 guidance actually elevated ESG factors from “tiebreaker” status. “Such issues are not merely collateral considerations or tie-breakers, but rather are proper components of the fiduciary’s primary analysis of the economic merits of competing investment choices,” the new guidance notes.
The new guidance may have a significant impact on how fiduciaries evaluate their investment selections in 2016 and beyond.
Source: Congress.gov, as of Jan. 8, 2016

24
Bonding with your future self to help boost retirement savings

DC Matters Spring/Summer 2016 25
An academic angleDear future self
Dr. Hal HershfieldAssistant Professor of Marketing,UCLA Anderson School of Management
Hal E. Hershfield is a behavioral-finance researcher and Assistant Professor of Marketing at UCLA’s Anderson School of Management. Prior to joining UCLA, Professor Hershfield taught at NYU’s Stern School of Business and was a Post-Doctoral Fellow at the Kellogg School of Management at Northwestern University. His research focuses on judgment, decision-making and social psychology, with a particular interest in how thinking about time can strongly impact decision-making and emotional experience. Professor Hershfield received his BA degree in psychology and English from Tufts University in 2001, and his PhD in psychology from Stanford University in 2009. His work has been published in top journals including Psychological Science, the Journal of Personality and Social Psychology, Organizational Behavior and Human Decision Processes, and the Journal of Marketing Research. He has also contributed writing to The New York Times, the Huffington Post, Psychology Today and Harvard Business Review. His recent TEDxEast talk, “How Can We Help Our Future Selves?” focuses on attending to the decisions made today that will better anticipate what we may need in years to come.
A retirement savings crisis is now apparent. As people live longer, nearly half of all households are at risk of coming up short on retirement money. And while many working households may feel they simply don’t have enough to spare for retirement savings — some of the biggest barriers to saving are psychological.
Facts and figures
American households unable to maintain their standard of living in retirement — 2013:
52%
American households unable to maintain their standard of living in retirement — 2001:
38%
Source: Center for Retirement Research at Boston College, National Retirement Risk Index

26
An academic angleDear future self Continued
Follow Hal on Twitter attwitter.com/hal_eh
We are our own worst enemyIn the last century, more years have been added to life expectancy than in of all the previous millennia combined. The problem is that saving rates have not kept up with longer life expectancies.
Neuroimaging research revealed that our brains consider our future selves to be almost unknowable — a stranger.
According to the Center for Retirement Research at Boston College, in 2013, 52% of today’s working-age households were at risk of being unable to maintain their pre-retirement levels of consumption once they stopped working, up from 38% in 2001. Despite best intentions, Americans are farther behind than ever in their struggle to save.
So, why is it so difficult for people to set aside money for the long-term future? Low earnings and high temptations to spend are obvious reasons. But perhaps the most basic cause is a fundamental human frailty: We view our future selves as strangers.
Estimating with any precision what we will want 20, 30 or 40 years from now is almost impossible. We don’t know our future desires because we don’t know our future selves.
That is true for people of all ages, but the lost opportunity is greatest for young people because money set aside at an early age has more years to grow.
Meet your future selfSince the person who will enjoy retirement savings seems like someone else, why should they deny themselves the pleasure of spending that money today?
Our research has found a way around that barrier: by providing a virtual glimpse into the future that could help motivate employees — especially younger workers — to save more for retirement. In a series of studies, my colleagues and I explored the connection between future selves and savings and found that the more connected we feel to our future selves, the more likely we are to save.
It’s an unusual concept to think about our future selves as another person, but it helps explain why so many of us privilege today over tomorrow.

DC Matters Spring/Summer 2016 27
The researchWe began by conducting neuroimaging research, which revealed that our brains consider our future selves to be almost unknowable — a stranger, essentially. For example, we asked study volunteers to think about other people — like Matt Damon or Natalie Portman — while we used functional magnetic resonance imaging, known as fMRI, to measure their brain activity by tracking blood flow. We also asked the participants to imagine themselves 10 years in the future.
As it turned out, the activity recorded in the subjects’ brains when imagining their future selves and the celebrities looked eerily similar. It’s little wonder that getting ourselves to behave now can be so difficult — it’s like we’re acting for the benefit of some person we’ve never actually met.
Next we explored whether this disconnect translates into lower motivation to save for the future. Could we show vivid examples of people’s future selves to them, and could that encourage them to save more?
To study the behavioral impact, we developed a virtual reality environment where subjects could “see” their future selves. We digitally altered photographs of the subjects — in a sort of aging mirror — allowing them to see what they’ll look like when they reach retirement, at roughly 68 to 70 years old.
Half the people in the study saw a version of their older selves while the rest saw a virtual version of their current selves. Later, study participants were asked a series of questions about finances and retirement. Those who had seen their older selves were willing to put twice as much money into a long-term saving account as those who had seen their current selves.
When people can really connect to themselves and say, “That person at age 70, that’s me, actually,” they tend to want to take care of that person more.
People in the study who looked at their future selves allocated twice as much money toward a hypothetical retirement savings account.
Just imagine an employee orientation where plan participants get to see themselves at 70 — now how much do they want to contribute to their 401(k)s?
Conclusion: Nice to meet meOn a neuro level, the more the future self looks like another person, the worse people are at saving and the more likely they’d opt for that immediate reward rather than waiting for that larger reward in the future.
Fortunately, resources are available for savers to become acquainted with their future selves. In fact, age-progression imaging is an experiment people can try at home. A number of online applications can age uploaded photos. Similar tools can be used by financial advisers with their clients or could be incorporated into the services that retirement plan providers or plan sponsors offer to employees. Just imagine an employee orientation where plan participants get to see themselves at 70 — now how much do they want to contribute to their 401(k)s?
What will you look like when you’re old? Check out AgingBooth, a face aging App.
Connecting with our future selves
Professor Hershfield’s age progression at 68 years old
Virtual age-morphing isn’t the only technique that can enable savers to feel as if the future is now. Here are a few other ideas that can help people make a better connection to their future selves:• Write a letter. It may sound a little cheesy, but writing a letter to their future self,
or having their future self write a letter to them, makes that future self more real. • Ask how their future self would react to decisions. Before making big purchase
decisions, have them stop and ask themselves, “How will my future self react?” Thirty years from now, will they be glad they splurged on that $5,000 vacation or the $200 jeans? It’s a good way to get them out of the emotional pull of the present.
• Spend more time with parents or grandparents. In a way, our parents and grandparents act as proxies for our own future selves. Spending time with them can actually help pre-retirees imagine what they’ll be like in the future. They may look like them and even share similar interests.
• Respect the elderly. Our research also explored whether there is a connection between respecting the elderly and saving more. And there appears to be because, like parents and grandparents, the elderly act as a proxy for our future selves. Perhaps volunteering at a nursing home or finding another way to increase their respect for the elderly could end up boosting their own bottom line at the same time.
What will you look like when you’re old? Check out AgingBooth, a face-aging App.
App Store is a service mark of Apple Inc.

DC Matters Spring/Summer 2016 28

DC Matters Spring/Summer 2016 29
Weighing the benefits and challenges of custom funds
Nuts & boltsThinking of going custom?
Sabrina M. Bailey Senior Vice PresidentGlobal Head, Defined Contribution SolutionsNorthern Trust Asset Management
Sabrina Bailey, Global Head of the Defined Contribution (DC) Solutions Group, is responsible for developing and deploying Northern Trust Asset Management’s DC strategy globally, leading the DC solutions team and partnering with distribution to ensure clients have access to the expertise they need — when they need it. Ms. Bailey has addressed various industry groups at conferences and is frequently quoted in the media. She has spent the majority of her career consulting with plan sponsors, most recently serving as the US Defined Contribution Segment Leader for Mercer Investments before joining Northern Trust. She is an acting member of the Pensions & Investments DC West 2015 Conference Advisory Board and is an active member of the Defined Contribution Institutional Investment Association.
When deciding whether to go with a custom or an off-the-shelf solution, there are several key elements to consider, including owning or outsourcing the asset allocation design and maintenance, understanding the potential challenges of a custom approach and recognizing the benefits that custom funds can offer.
The decision to adopt a custom approach, specifically for a target date strategy, should stem from a belief that a pre-packaged option is not suitable for an organization’s employee demographic.
Owning or outsourcing the asset allocation When creating a custom asset allocation, plan sponsors assume additional fiduciary liability for both the selection of investments as well as for how those investments should be allocated and transitioned over time. As plan fiduciaries, committee members must determine whether — in addition to the oversight of the plan’s core investment options — if they should also devote time and energy to creating and approving the
Custom funds — including custom target date and white label funds — are growing in popularity as DC plan sponsors look to address their participants’ unique needs or simply leverage the benefits of an open architecture concept within their investment menu. While much of the attention has been on custom target date funds, a similar custom approach can be used for single asset classes or inf lation strategies to provide the benefits of a multi-manager approach.
Source: Northern Trust’s DC Tracker serves as a barometer for participant flows within a universe of approximately 100 DC plans, representing $265 billion in assets, a subset of the total DC assets serviced by Northern Trust, as of Dec. 31, 2014. Large plans are representative of the top 25 plans.
Facts and figures
Size helps:
Large plans with multi-manager custom funds:
44%
Large plans with custom TDFs:
40%
All DC plans with custom TDFs:
30%

30
asset allocation of custom funds. If not, an outsourced approach is a viable alternative for sharing the fiduciary responsibilities with a provider who has expertise in advising on asset allocation solutions.
The decision to adopt a custom approach, specifically for a target date strategy, should stem from a belief that a pre-packaged option is not suitable for the organization’s employee demographic. This decision can be reached after an analysis has been undertaken that profiles the plan population’s unique needs and potential impact. Using this process, plan sponsors need to consider:• How conservative or aggressive the
slope of the glide path should be.• The suitability of all the underlying
asset classes.• Asset class implementation by style
(active or passive), strategy and type of vehicle (collective trusts, mutual funds or separate accounts).
The existence of a defined benefit (DB) plan is a particularly critical consideration, as it leads some plan sponsors, who may view a DB plan as a fixed income component of the employees’ overall asset allocation, to take a more aggressive approach to the glide path. Other plan sponsors may take the opposing view — seeing the DB plan as alleviating pressure on the DC plan as the sole retirement funding vehicle — and, therefore, they assume less risk in the glide path. The presence of a closed or frozen DB plan adds an additional complication, as some longer-tenured employees may be covered by the DB plan while newer employees are not.
A custom approach may be optimal for a DC plan sponsor’s employee population, but careful consideration should be given to the all-in cost to implement the strategy. If, net of expenses, participants will be positively impacted through excess returns over meaningful periods of time, then the custom solution under consideration has passed one of the most crucial validations needed for a custom approach.
Custom funds employ a thoughtful process to streamline an investment menu and offer a professionally crafted architecture so participants make more informed selections.
Measuring potential outcomes of a custom target date strategyScenario analysis is a multi-dimensional process designed to reasonably measure the likelihood that a given glide path will allow investors to amass an adequate amount of assets to sustain them through their retirement years. It provides a comprehensive way to evaluate the performance potential of target date funds. The process also focuses on specific future outcomes and measures both the success of wealth accumulation and longevity risk.
Plan sponsors can use scenario analysis to evaluate how effectively the custom target date strategy can meet the plan’s unique needs. Many plan sponsors feel they have a responsibility to maximize the number of participants who can achieve sufficient savings to fund their retirement. Therefore, a robust glide path design should incorporate scenario analysis to see the impact of various pre-retirement savings and post-retirement drawdown scenarios.
Potential challenges of a custom fund approachCustom fund structures have a few potential challenges that a plan sponsor will need to understand before implementing this structure in their DC menu. However, these challenges are not insurmountable; in fact, they can be addressed once a plan sponsor is aware of them.
Nuts & boltsThinking of going custom? Continued

DC Matters Spring/Summer 2016 31
To learn more about how to evaluate a custom approach within your DC plan, visit northerntrust.com/dcsolutions.
• Communication. As with any plan change, plan sponsors will need to communicate the change to their participants in a manner that also educates them on the new structure. In the case of a custom fund, plan sponsors will likely need to address the change of name from the fund manager to a custom name that will provide participants with a sense of comfort in the new structure. As part of this communication, plan sponsors should consider whether or not it makes sense to move the entire menu to a naming convention that does not include the fund manager name, but rather focuses on the asset class or fund objective (i.e., “Large Cap”).
• Historical performance. When adopting a custom fund structure, the new fund will often lack a performance track record. So rather than frame the conversation in terms of past performance (which is not indicative of future results), plan sponsors may consider focusing on the investment option’s desired outcome. They may
also choose to use targeted risk levels, as well as the individual track records and target weights of the underlying components as a representation of historical performance. In most cases, focusing on the fund’s objective and desired outcome provides a clearer picture to participants as they make their investment decisions.
• Operational support. There are a few critical items that come with an off-the-shelf solution that don’t come standard with a custom fund. The first is the calculation of a daily price for the custom fund. The good news is that most custodians (and some recordkeepers) are able to calculate daily prices easily. The bad news is that it will add to the cost of the custom fund, as will the need for a custom fund fact sheet to provide ongoing fund information to participants. Although, in most cases, the recordkeeper can help facilitate a feed of information to a platform to create a fact sheet consistent with other investment options in the plan.
Plan sponsors should consider whether or not it makes sense to move the entire menu to a naming convention that does not include the fund manager name, but rather focuses on the asset class or fund objective (i.e., “Large Cap”).
The benefits of custom fundsThere are several key benefits that custom funds offer within a DC menu. First, they offer the ability to reduce risk for participants through the use of multiple managers in a custom fund structure, which may lead to better investment choices and overall performance. Second, the simplification of communicating changes to the custom fund structure over time can free up time to focus on other important plan initiatives.
• Reducing risk through a multi-manager approach. Perhaps the most attractive benefit of custom funds is how they facilitate a multi-manager structure, which can help reduce the risk of poor investment choices and concentration risk with a single manager. Multi-manager funds in a DC plan take much of the guesswork out of the hands of participants who are likely prone to base allocation decisions on brand, past performance and a naïve understanding of diversification. For instance, instead of offering several large- and small-cap funds on the menu, consider a single, custom all-cap fund that thoughtfully combines complementary strategies for participants to reduce concentration risk and optimize the risk-return profile over time. “Anecdotally speaking, we’ve heard tales from a number of plan sponsors that participants simply allocated equally to each fund offered in a plan’s investment menu,” said Gaobo Pang, PhD, Senior Behavioral Finance Specialist at Northern Trust. “This is dubbed naïve diversification.” A major reason for this behavior is that participants were perplexed by the overly complicated fund options and misperceived that such a diversification would do the trick.

32
Nuts & boltsThinking of going custom? Continued
For more information, visit invesco.com/dc
Important information This material is provided for informational purposes only. Information is not intended to be and should not be construed as an offer, solicitation or recommendation with respect to any transaction and should not be treated as legal advice, investment advice or tax advice. Current or prospective clients should under no circumstances rely upon this information as a substitute for obtaining specific legal or tax advice from their own professional legal or tax advisors. Information is confidential and may not be duplicated in any form or disseminated without the prior consent of Northern Trust. Northern Trust and its affiliates may have positions in, and may effect transactions in, the markets, contracts and related investments described herein, which positions and transactions may be in addition to, or different from, those taken in connection with the investments described herein. All material has been obtained from sources believed to be reliable, but the accuracy, completeness and interpretation cannot be guaranteed. Information contained herein is current as of the date appearing in this material only and is subject to change without notice. Indices and trademarks are the property of their respective owners. All rights reserved.
There are risks involved in investing including possible loss of principal. There is no guarantee that the investment objectives of any fund or strategy will be met. Risk controls and models do not promise any level of performance or guarantee against loss of principal.
Custom funds employ a thoughtful process to streamline an investment menu and offer a professionally crafted architecture so participants can make more informed selections. Also, those companies that still maintain a traditional DB plan alongside their DC plan may be able to leverage managers from the DB plan and use them as sub-advisors in a custom fund. Plan sponsors see the benefit in this arrangement, as it allows them to use a manager who is well-vetted and effective — likely leading to favorable pricing and a lower marginal cost.
• Streamlining communications. For plan sponsors, the communication burden of making a change to investment options can be dramatically reduced. In a traditional DC plan, making a change to investment options involves a series of steps — all of which tie up valuable resources. The process can be inefficient and stressful for the investment committee, various functions within the organization and participants. In a custom fund environment, no advanced communications are needed assuming the name of the investment option isn’t changing, which means investment committee decisions can be implemented more efficiently.
Notification of any change can be delivered to participants through various channels, such as updated fee disclosure (when required), custom fund fact sheets or online account communications. Aside from the efficiency benefits custom funds can provide to plan sponsors, the benefits to plan participants may be even greater. Participants simply remain invested in the identical strategy with minimal disruption or fanfare, so the change appears relatively seamless. And, the simplified communications minimize participant confusion that may otherwise occur in a traditional model.
Bottom line Custom funds can certainly help streamline the DC menu and improve outcomes for participants. Understanding what it takes to implement a custom fund will help in the decision making process to select a custom or off-the-shelf approach. While the set up may require some additional resources, a custom approach can create potential efficiencies in the long run. More importantly, a custom approach can help participants invest successfully for retirement.
To learn more about how to evaluate a custom approach within your DC plan, visit northerntrust.com/dcsolutions.
A custom approach to address inflation
As plan sponsors look to provide an investment option to help their participants address the potential threat of inflation, many are considering using a custom fund approach to incorporate the right combination of asset classes.
The most typical asset classes we see included in an inflation component are real estate, TIPS and commodities.
Using a custom approach enables the plan sponsor to create an asset allocation that addresses their specific risk and return expectations.
It can also allow for a combination of active and passive strategies under one custom fund strategy.

DC Matters Spring/Summer 2016 33
About us
As one of the world’s leading independent global investment management firms, we are uniquely positioned to help plan sponsors achieve their investment objectives.
Invesco offers a wide range of investment capabilities across equity, fixed income and alternative asset classes, delivered through a diverse set of investment vehicles.
By the numbers
Providing investment solutions to DC plan sponsors
35 yearsGlobal assets under management
$775.6 billionDC assets under management
$100.6 billionAlternative investment strategies under management
$104.1 billionFixed income investment strategies under management
$252.5 billionEquity investment strategies under management
$370.9 billionBalanced investment strategies under management
$48.1 billionEmployees worldwide
>6,000Countries where Invesco is on the ground
>20Countries where Invesco serves clients
120
Invesco
Source: Invesco. Invesco Ltd. Client-related data, investment professional, employee data and AUM are as of Dec. 31, 2015, and include all assets under advisement, distributed and overseen by Invesco. Invesco PowerShares Capital Management LLC is the sponsor for the PowerShares QQQ and BLDRS products. ALPS Distributors, Inc. is the distributor of PowerShares QQQ, BLDRS Funds and the PowerShares DB Funds. Invesco PowerShares Capital Management LLC and Invesco Distributors, Inc. are indirect, wholly owned subsidiaries of Invesco Ltd. Invesco Distributors, Inc. is the US distributor for Invesco Ltd.’s retail products. Invesco Ltd. is not affiliated with ALPS Distributors, Inc. or Deutsche Bank. The entities listed are each indirect, wholly owned subsidiaries of Invesco Ltd., except ALPS Distributors Inc., Deutsche Bank and Invesco Great Wall in Shenzhen, which is a joint venture between Invesco and Great Wall Securities, and the Huaneng Invesco WLR Investment Consulting Company Ltd. in Beijing, which is a joint venture between Huaneng Capital Services and Invesco WLR Limited. Please consult your Invesco representative for more information.
Not all products are available to all investors. Please consult your Invesco representative for more information.Invesco Advisers, Inc. is an investment adviser; it provides investment advisory services to individual and institutional clients and does not sell securities.
Institutional Separate Accounts and Separately Managed Accounts are offered by Invesco Advisers, Inc. and other affiliated investment advisers, which provide investment advisory services and do not sell securities. Invesco Distributors, Inc. is the U.S. distributor for Invesco Ltd.’s retail mutual funds, exchange-traded funds and institutional money market funds. Both are indirect, wholly owned subsidiaries of Invesco Ltd.

Important Information
Please note: Invesco Distributors, Inc. became the distributor of the PowerShares QQQ and BLDRs products on Jan. 2, 2016, and the PowerShares DB products on June 20, 2016.
Before investing, investors should carefully read the prospectus/summary prospectus and carefully consider the investment objectives, risks, charges and expenses. For this and more complete information about the Funds call 800 983 0903 or visit powershares.com for prospectus/summary prospectus. PowerShares® is a registered trademark of Invesco PowerShares Capital Management LLC, investment adviser. Inves-co PowerShares Capital Management LLC (PowerShares) and Invesco Distributors, Inc., ETF distributor, are indirect, wholly owned subsidiaries of Invesco Ltd. Note: Not all products available at all firms. Advisors, please contact your home office.
invesco.com/us PSALPS-INS-1 11/16 Invesco Distributors, Inc. US13330
Follow us on twitter attwitter.com/InvescoUS
For more information, visit invesco.com/dc
Read our blogs at blog.invesco.us.com
FOR DEFINED CONTRIBUTION PLAN SPONSOR USE ONLY — NOT FOR USE WITH THE PUBLIC
The opinions expressed are those of the authors, are based on current market conditions and are subject to change without notice. These opinions may differ from those of other Invesco investment professionals. The comments should not be construed as recommendations, but as an illustration of broader themes. Forward-looking statements are not guarantees of future results. They involve risks, uncertainties and assumptions, there can be no assurance that actual results will not differ materially from expectations. Past performance is no guarantee of future results.
This magazine is not intended to be legal or tax advice or to offer a comprehensive resource for tax-qualified retirement plans. The tax information contained herein is general and is not exhaustive by nature. Federal and state tax laws are complex and constantly changing. You should always consult your own legal or tax professional for information concerning your individual situation. The information presented is based on current interpretation of pending retirement legislation and regulations. State laws may differ. Always consult your own legal or tax professional for information concerning your individual situation. All material presented is compiled from sources believed to be reliable and current, but accuracy cannot be guaranteed.
This magazine is for informational purposes only and is not to be construed as an offer to buy or sell any financial instruments and should not be relied upon as the sole factor in an investment making decision. As with all investments there are associated inherent risks. Please obtain and review all financial material carefully before investing.
Note: For more information on any of the topics discussed please contact your Invesco Representative.
MSCI EAFE Index is an unmanaged index considered representative of stocks of Europe, Australasia and the Far East. The index is computed using the net return, which withholds applicable taxes for non-resident investors.
MSCI Emerging Market Index is an unmanaged index considered representative of stocks of developing countries. The index is computed using the net return, which withholds applicable taxes for non-resident investors.
The consumer price index (CPI) is a measure that examines the weighted average of prices of a basket of consumer goods and services.Barclays 1–3 yr Government Index is an unmanaged index considered representative of short-term US corporate and US government bonds with maturities of
one to three years.iMoneyNet MFR Money Funds Index is an unmanaged index that measures money market fund.An investment cannot be made directly into an index.Institutional Separate Accounts are offered by Invesco Advisers, Inc., an investment advisor; it provides investment advisory services to individual and
institutional clients and does not sell securities. Invesco Distributors, Inc., is the US distributor for Invesco Ltd.’s Collective Investment Trusts (CITs), also known as collective trust funds. The Invesco Collective Investment Trusts (CITs), also known as collective trust funds, are bank collective trust funds for which Invesco Trust Company serves as trustee and investment manager. They are available exclusively to qualified retirement plans. The funds are not FDIC-insured or registered with the Securities and Exchange Commission. Fund investors and potential investors are strongly encouraged to review the funds’ Declaration of Trust for additional information regarding the operation and investment objectives of the funds. These firms are indirect, wholly owned subsidiaries of Invesco Ltd.
invesco.com/dc DCMTRS-BRO-3 04/16 Invesco Advisers, Inc. Invesco Distributors, Inc. US3415
About riskAll investing involves risk, including the risk of loss. Asset allocation/diversification does not guarantee a profit or eliminate the risk of loss.
A target date fund identifies a specific time at which investors are expected to begin making withdrawals, e.g., Now, 2020, 2030. The principal value of the fund is not guaranteed at any time, including at the target date.
About risk for Invesco Stable Value TrustInvestors could lose all or a portion of their investment in the Fund. Investors should not invest in the Fund unless they can readily bear the consequences of such loss.
Wrap contract risk includes default by a wrap issuer; costs reduce Fund performance; new wraps have less favorable terms or higher costs; poor Fund performance may lead to constrained Fund investments, reducing Fund performance; small number of wrap issuers concentrates exposure; termination of a wrap could result in loss of book value coverage.
The Fund’s credited rate will generally lag market interest rates. Wrap contract crediting rates may go down if a large number of participants request redemptions from the Fund.
The prices of securities held by the Fund may go down due to general market and economic conditions.
The Fund’s principal investment may not maintain the same purchasing power in the future if inflation rises.
Leveraging magnifies changes, favorable or unfavorable, in the value of the portfolio’s securities.
Bond prices fall as interest rates rise, and rise as interest rates fall. Bond portfolios are riskier when interest rates rise. Long maturity bonds have more interest rate risk.
Yield curve risk refers to the risk that the Fund will be adversely impacted by changes in the differences between interest rates on shorter term and longer term debt instruments.
Credit risk is the risk of an issuer’s financial health deteriorating, which may result in a credit rating downgrade and the issuer’s inability to make timely bond payments.
Spread risk is the risk that changes in the difference between the yields of debt instruments (whether due to credit quality or otherwise) could adversely affect the Fund.
When the Fund has difficulty in selling an asset quickly, it faces liquidity risk.
If a callable bond is redeemed before maturity, the Fund may be forced to reinvest the principal at a lower interest rate.
Homeowners may pay off their mortgages early. This forces the Fund to reinvest the principal sooner than expected, which could be at a lower interest rate.
For some derivatives, the Fund could lose more than the amount invested. If the Fund uses derivatives to “hedge” portfolio risk, the hedge may not succeed.
The Fund may engage in frequent trading to achieve its investment objective. If the Fund does trade frequently, it may incur increased costs, which can lower the Fund’s return.
The investment techniques and risk analyses used by the Fund’s portfolio managers may not produce the desired results.
The Fund or the vehicles in which it invests may participate in securities lending programs. The lending fund bears the risk of investment loss associated with
any reinvestment of securities lending collateral held by the lending fund.
The Fund may itself invest in an investment vehicle, such as a private investment or commingled fund. When it does so, the investing fund is subject to the underlying risk of that investment vehicle’s portfolio securities.
The actual cost of investing may be higher than the expenses listed in the expense table for a variety of reasons, including termination of a voluntary fee waiver or losing portfolio fee breakpoints if average net assets decrease. The risk of expenses increasing because of a decrease in average net assets is heightened when markets are volatile.
The investment is not a deposit or obligation of, or guaranteed or endorsed by, any bank and is not insured by the Federal Deposit Insurance Corporation, the Federal Reserve Board, or any other U.S. governmental agency.
Affiliated managers may trade in securities at the same time as the Fund and, therefore, may potentially affect prices or available opportunities.
The Fund is exempt from registration with the SEC. Units of the Fund are exempt from registration with the SEC. Neither is registered with any state securities regulator.
The Fund is not registered as a commodity pool with the CFTC because the Trustee is exempt from having to register as a commodity pool operator under CFTC Rule 4.5.
For additional information, please visit invescotrustcompany.com.