investment banking industrial technology quarterly …
TRANSCRIPT

INDUSTRIAL TECHNOLOGY QUARTERLY
©2016 Raymond James & Associates, Inc., member New York Stock Exchange/SIPC
INVESTMENT BANKING
1
INDUSTRIAL TECHNOLOGY QUARTERLY
INDUSTRIAL TECHNOLOGY COVERAGE TEAM
Information obtained from third-party sources is considered reliable, but we do not guarantee that the information herein is accurate or complete. This report was prepared within Raymond James & Associates' Investment Banking Department and is for information
purposes only. This report is not a product of Raymond James & Associates' Research Department; recipients of this report should not interpret the information herein as sufficient grounds for an investment decision or any other decision. The report shall not constitute
an offer to sell or the solicitation of an offer to buy any of the securities mentioned herein; past performance does not guarantee future results. This report includes logos or other words or devices that may be registered trademarks of their respective owners. Such use is
solely for purposes of convenience in referring to the trademark owners and their products/services. This report and its contents are not endorsed, sponsored or affiliated with any trademark owner. Raymond James and its affiliates are not affiliated with any trademark
owner but may provide certain financial services to one or more trademark owners or their affiliates.
WINTER 2016
Gary Downing
(727) 567-1157
Frank McGrew
(615) 645-6797
Michael Stockburger
(901) 579-2705

INDUSTRIAL TECHNOLOGY QUARTERLY
©2016 Raymond James & Associates, Inc., member New York Stock Exchange/SIPC
INVESTMENT BANKING
2
KEY DEVELOPMENTS AND INDUSTRY THEMES
The Internet revolution has completely reshaped the way businesses interact with consumers over
the past fifteen years, but the next wave of change should completely revolutionize everything from
manufacturing, agriculture, transportation and other industrial sectors. The IIoT will combine the
global reach of the internet with a new ability to control and monitor the physical world in real-time,
which will bring about unprecedented data and efficiencies. Click here for the full report.
Imagine the next generation workplace. As you pull in to your parking garage at the office, an app
on your smartphone communicates with the building and directs you to an open parking space near
where you need to enter. Upon walking into the building, you are directed to where you will be
working for the day, based on your needs, and this workspace is conditioned to your preferences –
light, temperature, etc. This is all possible at the Edge in Amsterdam. Click here to learn more.
Rockwell Automation recently introduced a new diagnostic reliability tool to help industrial
manufacturers drive a streamlined maintenance strategy on mission-critical, integrated equipment
lines. The service is designed to help proactively maintain electrical and automation control
equipment and lessen time-consuming, manual tasks as devices become more connected. Click
here to read more.
The Raymond James Investment Banking HVAC coverage team will be attending the annual AHR
Expo winter conference in Orlando from January 25th – 27th. With over 2,000 exhibitors and over
60,000 HVAC professionals expected, the floor is sure to be lively with the latest innovations in the
HVAC industry. Attending the show? Please contact Frank McGrew (615-645-6797) or Michael
Stockburger (901-579-2705) to arrange a time to meet with our team.
http://www3.weforum.org/docs/WEFUSA_
IndustrialInternet_Report2015.pdf
http://www.bloomberg.com/features/2015-
the-edge-the-worlds-greenest-building/
The Industrial Internet
of Things (“IIoT”)
The World’s Greenest
Building
New Service from
Rockwell Automation
Annual HVAC Show
http://www.arcweb.com/Blog/Post/917/Ne
w-Diagnostic-Reliability-Service-from-
Rockwell-Automation-Drives-
Maintenance-Strategies-and-Operational-
Effectiveness
INDUSTRIAL TECHNOLOGY QUARTERLY
©2016 Raymond James & Associates, Inc., member New York Stock Exchange/SIPC
INVESTMENT BANKING
3
Median
# of ∆ in Stock Price % of 52 - TEV / LTM TEV / 2016E
Sector Companies 3-Month 12-Month Week High TEV ($MMs) Revenue EBITDA Revenue EBITDA
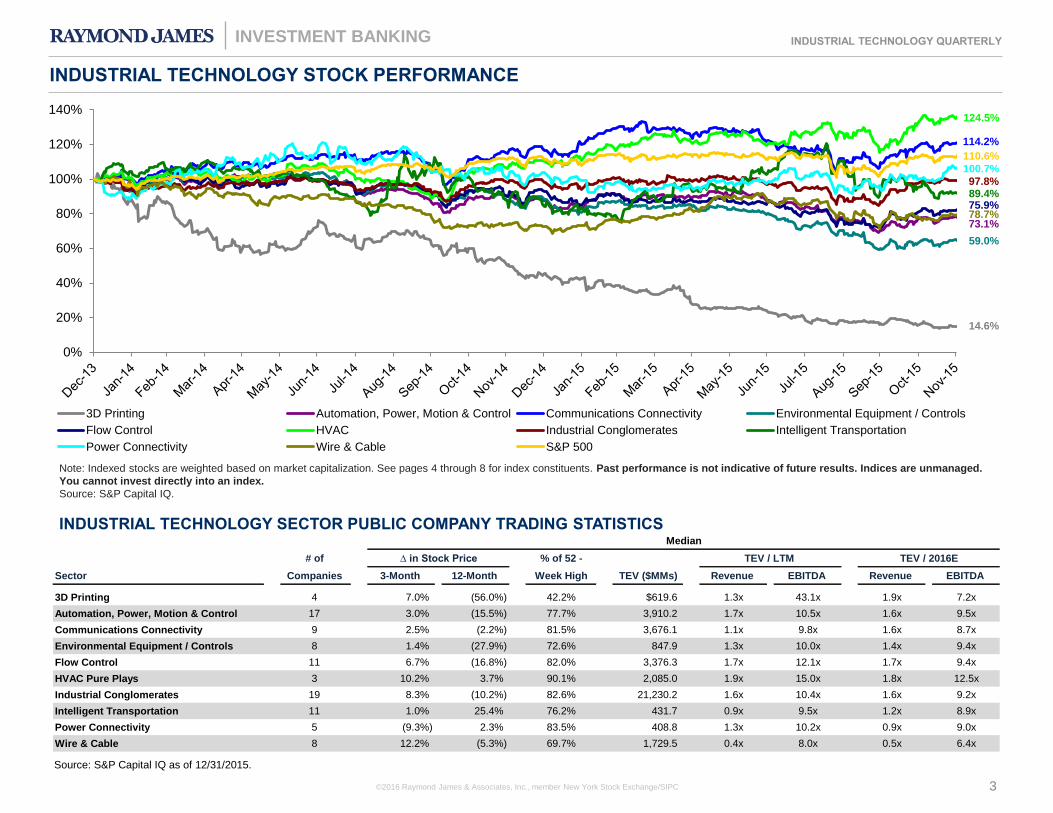
3D Printing 4 7.0% (56.0%) 42.2% $619.6 1.3x 43.1x 1.9x 7.2x
Automation, Power, Motion & Control 17 3.0% (15.5%) 77.7% 3,910.2 1.7x 10.5x 1.6x 9.5x
Communications Connectivity 9 2.5% (2.2%) 81.5% 3,676.1 1.1x 9.8x 1.6x 8.7x
Environmental Equipment / Controls 8 1.4% (27.9%) 72.6% 847.9 1.3x 10.0x 1.4x 9.4x
Flow Control 11 6.7% (16.8%) 82.0% 3,376.3 1.7x 12.1x 1.7x 9.4x
HVAC Pure Plays 3 10.2% 3.7% 90.1% 2,085.0 1.9x 15.0x 1.8x 12.5x
Industrial Conglomerates 19 8.3% (10.2%) 82.6% 21,230.2 1.6x 10.4x 1.6x 9.2x
Intelligent Transportation 11 1.0% 25.4% 76.2% 431.7 0.9x 9.5x 1.2x 8.9x
Power Connectivity 5 (9.3%) 2.3% 83.5% 408.8 1.3x 10.2x 0.9x 9.0x
Wire & Cable 8 12.2% (5.3%) 69.7% 1,729.5 0.4x 8.0x 0.5x 6.4x
0%
20%
40%
60%
80%
100%
120%
140%
3D Printing Automation, Power, Motion & Control Communications Connectivity Environmental Equipment / Controls
Flow Control HVAC Industrial Conglomerates Intelligent Transportation
Power Connectivity Wire & Cable S&P 500
Note: Indexed stocks are weighted based on market capitalization. See pages 4 through 8 for index constituents. Past performance is not indicative of future results. Indices are unmanaged.
You cannot invest directly into an index.
Source: S&P Capital IQ.
INDUSTRIAL TECHNOLOGY STOCK PERFORMANCE
INDUSTRIAL TECHNOLOGY SECTOR PUBLIC COMPANY TRADING STATISTICS
Source: S&P Capital IQ as of 12/31/2015.
14.6%
59.0%
73.1% 78.7% 75.9% 89.4% 97.8%
100.7%
110.6%
114.2%
124.5%

INDUSTRIAL TECHNOLOGY QUARTERLY
©2016 Raymond James & Associates, Inc., member New York Stock Exchange/SIPC
INVESTMENT BANKING
4
($ in U.S. millions, except per share data)
Market % of
Price Change in Stock Price 52-Week Enterprise Market LTM EBITDA EV / Revenue EV / EBITDA
Automation, Power, Motion & Control Ticker 12/31/15 3-Month(2)
12-Month(2) High Value Cap Revenue EBITDA Margin LTM 2016E LTM 2016E
ABB Ltd. ABBN $17.94 4.3% (15.0%) 81.8% $42,482.0 $39,748.3 $36,585.0 $5,385.0 14.7% 1.2x 1.2x 7.9x 8.6x
Altra Industrial Motion Corp. AIMC 25.08 8.5% (11.7%) 85.0% 842.7 652.4 765.0 100.6 13.1% 1.1x 1.2x 8.4x 7.9x
Ametek Inc. AME 53.59 2.4% 1.8% 92.9% 14,337.2 12,748.1 4,010.5 1,074.0 26.8% 3.6x 3.5x 13.3x 12.6x
Brady Corp. BRC 22.98 16.9% (15.9%) 79.3% 1,302.3 1,162.3 1,171.7 138.5 11.8% 1.1x 1.2x 9.4x 8.9x
Cognex Corporation CGNX 33.77 (1.7%) (18.3%) 64.3% 2,513.1 2,865.2 557.9 183.7 32.9% 4.5x 5.4x 13.7x 16.4x
Eaton Corporation plc ETN 52.04 1.4% (23.4%) 70.5% 32,235.1 24,084.1 21,363.0 3,396.0 15.9% 1.5x 1.6x 9.5x 9.4x
Echelon Corporation ELON 5.64 (5.1%) (66.8%) 33.4% 0.1 24.9 38.9 (4.6) NM NM - NM -
FARO Technologies Inc. FARO 29.52 (15.7%) (52.9%) 46.1% 352.6 513.6 330.4 29.3 8.9% 1.1x 1.0x 12.0x 8.5x
Generac Holdings Inc. GNRC 29.77 (1.1%) (36.3%) 58.6% 3,012.3 1,999.4 1,363.5 270.1 19.8% 2.2x 2.2x 11.2x 10.4x
Hubbell Inc. HUBB 101.04 N/A N/A 96.7% 1,083.0 918.7 3,409.5 600.5 17.6% 0.3x 0.3x 1.8x 1.8x
Littelfuse Inc. LFUS 107.01 17.4% 10.7% 93.1% 2,254.6 2,386.2 854.5 178.0 20.8% 2.6x 2.4x 12.7x 10.9x
Rockwell Automation Inc. ROK 102.61 1.1% (7.7%) 80.8% 12,874.6 13,522.9 6,307.9 1,312.7 20.8% 2.0x 2.1x 9.8x 9.6x
Regal Beloit Corporation RBC 58.52 3.7% (22.2%) 71.9% 4,227.8 2,613.6 3,459.4 481.6 13.9% 1.2x 1.2x 8.8x 7.4x
Schneider Electric SE SU 57.08 5.1% (13.3%) 70.7% 40,238.3 32,783.5 29,058.2 4,297.4 14.8% 1.4x 1.4x 9.4x 9.0x
Trimble Navigation Limited TRMB 21.45 30.6% (19.2%) 77.7% 6,009.6 5,372.8 2,317.0 384.4 16.6% 2.6x 2.6x 15.6x 11.2x
Woodward, Inc. WWD 49.66 22.0% 0.9% 87.8% 3,910.2 3,139.9 2,038.3 339.1 16.6% 1.9x 1.9x 11.5x 10.4x
Zebra Technologies Corporation ZBRA 69.65 (9.0%) (10.0%) 58.3% 6,434.1 3,628.8 2,876.8 417.9 14.5% 2.2x 1.7x 15.4x 9.6x
Median 77.7% $3,910.2 $2,865.2 $2,317.0 $384.4 16.2% 1.7x 1.6x 10.5x 9.5x
Mean 73.5% 10,241.7 8,715.6 6,853.4 1,093.2 17.5% 1.9x 1.9x 10.6x 9.5x
($ in U.S. millions, except per share data)
Market % of
Price Change in Stock Price 52-Week Enterprise Market LTM EBITDA EV / Revenue EV / EBITDA
3D Printing Ticker 12/31/15 3-Month(2)
12-Month(2) High Value Cap Revenue EBITDA Margin LTM 2016E LTM 2016E
3D Systems Corporation DDD $8.69 (24.8%) (73.6%) 26.2% $839.3 $974.0 $670.2 $17.6 2.6% 1.3x 1.3x 47.7x 7.2x
Arcam AB ARCM 21.86 25.3% 27.2% 97.1% 399.9 448.9 64.0 7.7 12.0% NM 4.6x NM 30.6x
The ExOne Company XONE 10.04 49.6% (40.2%) 56.0% 127.8 145.8 39.9 (21.7) NM 3.2x 2.4x NM NM
Stratasys Ltd. SSYS 23.48 (11.4%) (71.7%) 28.4% 962.0 1,221.7 739.7 25.0 3.4% 1.3x 1.3x 38.5x 7.2x
Median 42.2% $619.6 $711.4 $367.1 $12.6 3.4% 1.3x 1.9x 43.1x 7.2x
Mean 51.9% 582.2 697.6 378.5 7.1 6.0% 1.9x 2.4x 43.1x 15.0x
PUBLICLY TRADED INDUSTRIAL TECHNOLOGY COMPANY UNIVERSE(1)
Source: S&P Capital IQ.
1. Financial information, market values, and market multiples as of 12/31/2015; revenue multiples in excess of 6x and EBITDA multiples in excess of 50x excluded.
2. Stock price performance (3-month and 12-month) is based on price as of 12/31/2015.

INDUSTRIAL TECHNOLOGY QUARTERLY
©2016 Raymond James & Associates, Inc., member New York Stock Exchange/SIPC
INVESTMENT BANKING
5
($ in U.S. millions, except per share data)
Market % of
Price Change in Stock Price 52-Week Enterprise Market LTM EBITDA EV / Revenue EV / EBITDA
Environmental Equipment / Controls Ticker 12/31/15 3-Month(2)
12-Month(2) High Value Cap Revenue EBITDA Margin LTM 2016E LTM 2016E
CECO Environmental Corp. CECE $7.68 (6.2%) (50.6%) 50.2% $431.0 $261.5 $342.3 $43.3 12.7% 1.3x 0.9x 9.9x 7.5x
CIRCOR International, Inc. CIR 42.15 5.1% (30.1%) 71.2% 752.1 694.8 755.1 89.0 11.8% 1.0x 1.2x 8.5x 8.9x
CLARCOR Inc. CLC 49.68 4.2% (25.5%) 74.0% 2,770.5 2,478.8 1,521.9 278.2 18.3% 1.8x 1.9x 10.0x 10.5x
Colfax Corporation CFX 23.35 (21.9%) (54.7%) 43.6% 4,429.3 2,900.8 4,111.9 529.9 12.9% 1.1x 1.2x 8.4x 9.8x
Donaldson Company, Inc. DCI 28.66 2.1% (25.8%) 74.5% 4,233.8 3,801.7 2,371.2 371.0 15.6% 1.8x 1.9x 11.4x 11.8x
Energy Recovery, Inc. ERII 7.07 230.4% 34.2% 74.4% 364.9 387.7 43.2 (12.8) NM NM 3.9x NM 9.4x
ESCO Technologies Inc. ESE 36.14 0.7% (2.1%) 90.4% 943.7 933.1 537.3 82.0 15.3% 1.8x 1.6x 11.5x 9.3x
Fuel-Tech, Inc. FTEK 1.89 (1.0%) (50.7%) 50.3% 29.4 43.8 74.1 (1.7) NM 0.4x 0.4x NM NM
Median 72.6% $847.9 $814.0 $646.2 $85.5 14.1% 1.3x 1.4x 10.0x 9.4x
Mean 66.1% 1,744.4 1,437.8 1,219.6 172.4 14.4% 1.3x 1.6x 9.9x 9.6x
($ in U.S. millions, except per share data)
Market % of
Price Change in Stock Price 52-Week Enterprise Market LTM EBITDA EV / Revenue EV / EBITDA
Communications Connectivity Ticker 12/31/15 3-Month(2)
12-Month(2) High Value Cap Revenue EBITDA Margin LTM 2016E LTM 2016E
Amphenol Corporation APH $52.23 2.5% (2.9%) 86.3% $17,394.3 $16,100.5 $5,564.7 $1,287.9 23.1% 3.1x 3.0x 13.5x 12.9x
ARRIS Group, Inc. ARRS 30.57 17.7% 1.3% 81.5% 5,343.9 4,483.3 4,960.0 575.7 11.6% 1.1x 0.9x 9.3x 5.9x
AVX Corp. AVX 12.14 (7.3%) (13.3%) 80.1% 1,167.6 2,036.9 1,242.1 230.1 18.5% 0.9x 1.0x 5.1x 5.7x
Belden Inc. BDC 47.68 2.1% (39.5%) 49.9% 3,676.1 2,001.4 2,320.9 330.7 14.2% 1.6x 1.6x 11.1x 8.7x
CommScope Holding Company, Inc. COMM 25.89 (13.8%) 13.4% 75.9% 9,673.9 4,936.3 3,493.2 732.8 21.0% 2.8x 1.9x 13.2x 9.2x
Huber+Suhner AG HUBN 46.29 10.4% (2.2%) 89.2% 776.1 900.1 787.9 89.0 11.3% 1.0x 1.1x 8.7x 8.6x
Radiall SA RLL 233.29 9.6% (17.1%) 79.7% 368.7 422.5 323.9 75.3 23.2% 1.1x - 4.9x -
RF Industries, Ltd. RFIL 4.40 (3.1%) 8.1% 90.7% 29.8 37.7 29.8 2.4 8.2% 1.0x - 12.2x -
TE Connectivity Ltd. TEL 64.61 7.9% 2.2% 87.6% 25,533.2 24,959.2 12,233.0 2,610.0 21.3% 2.1x 2.0x 9.8x 9.3x
Median 81.5% $3,676.1 $2,036.9 $2,320.9 $330.7 18.5% 1.1x 1.6x 9.8x 8.7x
Mean 80.1% 7,107.1 6,208.7 3,439.5 659.3 16.9% 1.6x 1.6x 9.8x 8.6x
PUBLICLY TRADED INDUSTRIAL TECHNOLOGY COMPANY UNIVERSE(1)
Source: S&P Capital IQ.
1. Financial information, market values, and market multiples as of 12/31/2015; revenue multiples in excess of 6x and EBITDA multiples in excess of 50x excluded.
2. Stock price performance (3-month and 12-month) is based on price as of 12/31/2015.

INDUSTRIAL TECHNOLOGY QUARTERLY
©2016 Raymond James & Associates, Inc., member New York Stock Exchange/SIPC
INVESTMENT BANKING
6
($ in U.S. millions, except per share data)
Market % of
Price Change in Stock Price 52-Week Enterprise Market LTM EBITDA EV / Revenue EV / EBITDA
HVAC Pure Plays Ticker 12/31/15 3-Month(2)
12-Month(2) High Value Cap Revenue EBITDA Margin LTM 2016E LTM 2016E
AAON Inc. AAON $23.22 19.8% 3.7% 91.6% $1,207.1 $1,256.0 $346.1 $80.2 23.2% 3.5x 3.2x 15.0x 13.4x
Lennox International, Inc. LII 124.90 10.2% 31.4% 90.1% 6,510.8 5,627.4 3,446.1 421.6 12.2% 1.9x 1.8x 15.4x 12.5x
Nortek Inc. NTK 43.62 (31.1%) (46.4%) 46.9% 2,085.0 709.4 2,531.9 229.7 9.1% 0.8x 0.8x 9.1x 6.7x
Median 90.1% $2,085.0 $1,256.0 $2,531.9 $229.7 12.2% 1.9x 1.8x 15.0x 12.5x
Mean 76.2% 3,267.6 2,531.0 2,108.0 243.8 14.8% 2.1x 1.9x 13.2x 10.8x
($ in U.S. millions, except per share data)
Market % of
Price Change in Stock Price 52-Week Enterprise Market LTM EBITDA EV / Revenue EV / EBITDA
Flow Control Ticker 12/31/15 3-Month 12-Month High Value Cap Revenue EBITDA Margin LTM 2016E LTM 2016E
Badger Meter Inc. BMI $58.59 0.9% (1.3%) 88.9% $913.6 $850.3 $371.3 $60.0 16.2% 2.5x 2.3x 15.2x 13.7x
Flowserve Corp. FLS 42.08 2.3% (29.7%) 65.3% 6,967.4 5,507.0 4,654.7 820.7 17.6% 1.5x 1.6x 8.5x 9.0x
Franklin Electric Co., Inc. FELE 27.03 (0.7%) (28.0%) 67.8% 1,419.6 1,253.1 1,005.0 131.2 13.1% 1.4x 1.5x 10.8x 9.4x
Gorman-Rupp Co. GRC 26.73 11.5% (16.8%) 82.0% 665.4 697.2 412.3 56.8 13.8% 1.6x 1.7x 11.7x -
Graco Inc. GGG 72.07 7.5% (10.1%) 89.3% 4,362.0 4,029.6 1,266.9 336.7 26.6% 3.4x 3.2x 13.0x 11.8x
IDEX Corporation IEX 76.61 7.4% (1.6%) 95.4% 6,408.9 5,862.1 2,044.8 513.4 25.1% 3.1x 3.1x 12.5x 12.1x
Itron, Inc. ITRI 36.18 13.4% (14.4%) 86.7% 1,672.2 1,371.1 1,897.5 114.8 6.0% 0.9x 0.8x 14.6x 8.6x
Pentair plc PNR 49.53 (3.0%) (25.4%) 71.1% 12,783.8 7,942.3 6,490.8 1,077.8 16.6% 2.0x 1.9x 11.9x 9.9x
Rexnord Corporation RXN 18.12 6.7% (35.8%) 64.1% 3,376.3 1,818.6 1,986.6 302.3 15.2% 1.7x 1.7x 11.2x 8.6x
Watts Water Technologies, Inc. WTS 49.67 (6.0%) (21.7%) 78.9% 2,003.5 1,714.3 1,485.9 128.2 8.6% 1.3x 1.4x 15.6x 9.4x
Xylem Inc. XYL 36.50 11.1% (4.1%) 96.1% 7,210.9 6,546.9 3,701.0 598.0 16.2% 1.9x - 12.1x -
Median 82.0% $3,376.3 $1,818.6 $1,897.5 $302.3 16.2% 1.7x 1.7x 12.1x 9.4x
Mean 80.5% 4,344.0 3,417.5 2,301.5 376.4 15.9% 1.9x 1.9x 12.5x 10.3x
PUBLICLY TRADED INDUSTRIAL TECHNOLOGY COMPANY UNIVERSE(1)
Source: S&P Capital IQ.
1. Financial information, market values, and market multiples as of 12/31/2015; revenue multiples in excess of 6x and EBITDA multiples in excess of 50x excluded.
2. Stock price performance (3-month and 12-month) is based on price as of 12/31/2015.

INDUSTRIAL TECHNOLOGY QUARTERLY
©2016 Raymond James & Associates, Inc., member New York Stock Exchange/SIPC
INVESTMENT BANKING
7
($ in U.S. millions, except per share data)
Market % of
Price Change in Stock Price 52-Week Enterprise Market LTM EBITDA EV / Revenue EV / EBITDA
Industrial Conglomerates Ticker 12/31/15 3-Month(2)
12-Month(2) High Value Cap Revenue EBITDA Margin LTM 2016E LTM 2016E
3M Company MMM $150.64 6.3% (8.3%) 88.4% $102,284.0 $92,751.0 $30,695.0 $8,496.0 27.7% 3.3x 3.3x 12.0x 11.6x
Carlisle Companies Incorporated CSL 88.69 1.5% (1.7%) 84.5% 6,159.5 5,765.3 3,457.0 611.6 17.7% 1.8x 1.6x 10.1x 9.0x
Crane Co. CR 47.84 2.6% (18.5%) 67.9% 3,300.6 2,777.8 2,790.7 461.5 16.5% 1.2x 1.2x 7.2x 7.0x
Danaher Corp. DHR 92.88 9.0% 8.4% 95.1% 76,898.9 63,649.3 20,346.0 4,673.4 23.0% 3.8x 3.3x 16.5x 14.2x
Dover Corporation DOV 61.31 7.2% (14.5%) 77.1% 11,524.5 9,500.9 7,239.7 1,381.0 19.1% 1.6x 1.6x 8.3x 8.8x
Emerson Electric Co. EMR 47.83 8.3% (22.5%) 76.2% 34,890.8 31,154.8 22,304.0 4,264.0 19.1% 1.6x 1.7x 8.2x 8.4x
General Electric Company GE 31.15 23.5% 23.3% 98.9% 577,354.7 293,989.7 146,598.0 28,420.0 19.4% 3.9x 4.5x 20.3x 24.8x
Honeywell International Inc. HON 103.57 9.4% 3.7% 96.4% 80,462.5 79,820.5 38,865.0 7,222.0 18.6% 2.1x 2.0x 11.1x 9.6x
Ingersoll-Rand Plc IR 55.29 8.9% (12.8%) 78.0% 18,411.8 14,433.4 13,215.4 1,768.5 13.4% 1.4x 1.4x 10.4x 9.2x
ITT Corporation ITT 36.32 8.6% (10.2%) 82.6% 2,749.5 3,250.6 2,478.8 405.4 16.4% 1.1x 1.1x 6.8x 6.5x
Illinois Tool Works Inc. ITW 92.68 12.6% (2.1%) 92.6% 38,503.4 33,688.4 13,634.0 3,350.0 24.6% 2.8x 2.9x 11.5x 11.0x
Johnson Controls Inc. JCI 39.49 (4.5%) (18.3%) 72.4% 31,968.9 25,585.9 37,179.0 3,086.0 8.3% 0.9x 0.8x 10.4x 8.0x
Roper Technologies, Inc. ROP 189.79 21.1% 21.4% 96.9% 21,230.2 19,131.8 3,584.9 1,237.3 34.5% 5.9x 5.5x 17.2x 15.4x
Parker-Hannifin Corporation PH 96.98 (0.3%) (24.8%) 75.6% 14,756.9 13,187.3 12,311.2 1,766.0 14.3% 1.2x 1.3x 8.4x 8.8x
Siemens Aktiengesellschaft SIE 98.14 13.5% (4.3%) 84.6% 98,898.1 79,356.3 84,410.5 9,039.7 10.7% 1.2x 1.2x 10.9x 8.4x
SPX Corporation SPXC 9.33 (21.7%) (89.1%) 10.3% 682.6 380.7 4,533.8 274.3 6.1% 0.2x 0.4x 2.5x 5.2x
Stanley Black & Decker, Inc. SWK 106.73 10.1% 11.1% 96.0% 20,103.0 15,980.3 11,358.3 1,867.9 16.4% 1.8x 1.7x 10.8x 10.5x
Tyco International plc TYC 31.89 (4.7%) (27.3%) 72.1% 15,202.7 13,481.7 9,902.0 1,530.0 15.5% 1.5x 1.5x 9.9x 9.7x
United Technologies Corporation UTX 96.07 8.0% (16.5%) 77.2% 104,064.1 85,216.1 63,978.0 11,574.0 18.1% 1.6x 1.8x 9.0x 9.4x
Median 82.6% $21,230.2 $19,131.8 $13,215.4 $1,867.9 17.7% 1.6x 1.6x 10.4x 9.2x
Mean 80.1% 66,286.7 46,479.1 27,835.9 4,812.0 17.9% 2.0x 2.0x 10.6x 10.3x
($ in U.S. millions, except per share data)
Market % of
Price Change in Stock Price 52-Week Enterprise Market LTM EBITDA EV / Revenue EV / EBITDA
Intelligent Transportation Ticker 12/31/15 3-Month(2)
12-Month(2) High Value Cap Revenue EBITDA Margin LTM 2016E LTM 2016E
Hill & Smith Holdings PLC HILS $11.16 7.7% 30.5% 98.1% $1,004.9 $873.4 $729.5 $101.6 13.9% 1.4x 1.4x 9.9x 8.9x
Image Sensing Systems, Inc. ISNS 3.65 (2.7%) 37.2% 74.3% 15.6 18.3 20.5 (4.8) NM 0.8x - NM -
Indra Sistemas, S.A. IDR 9.42 (6.5%) 7.4% 76.2% 2,465.8 1,542.7 3,364.3 (123.6) NM 0.7x 0.8x NM 9.0x
Init Innovation in Traffic Systems AG IXX 17.92 (19.5%) (19.6%) 59.7% 193.9 179.7 119.0 20.8 17.4% 1.6x 1.5x 9.3x 8.2x
International Road Dynamics Inc. IRD 1.05 55.9% 95.9% 97.6% 20.8 15.0 40.0 1.9 4.6% 0.5x - 11.2x -
Iteris, Inc. ITI 2.15 (12.6%) 25.4% 72.6% 49.6 68.7 74.5 (1.1) NM 0.7x 0.6x NM 15.6x
Jenoptik AG JEN 15.63 13.6% 38.8% 95.2% 991.3 894.5 734.1 92.9 12.7% 1.4x 1.3x 10.7x 9.6x
Kapsch TrafficCom AG KTCG 40.61 27.7% 112.7% 99.6% 556.5 528.0 518.3 63.1 12.2% 1.1x 1.0x 8.8x 7.8x
Mobileye N.V. MBLY 42.28 (7.0%) 4.2% 65.6% 8,982.4 9,161.9 208.7 66.5 31.9% NM NM NM 44.3x
Redflex Holdings Limited RDF 0.25 41.7% (66.0%) 31.0% 29.2 27.4 95.7 8.7 9.1% 0.3x - 3.4x -
Vaisala Oyj VAIAS 26.00 1.0% 9.4% 89.7% 431.7 468.7 349.4 45.3 13.0% 1.2x 1.2x 9.5x 7.2x
Median 76.2% $431.7 $468.7 $208.7 $20.8 12.8% 0.9x 1.2x 9.5x 8.9x
Mean 78.1% 1,340.2 1,252.6 568.6 24.6 14.3% 1.0x 1.1x 9.0x 13.8x
PUBLICLY TRADED INDUSTRIAL TECHNOLOGY COMPANY UNIVERSE(1)
Source: S&P Capital IQ.
1. Financial information, market values, and market multiples as of 12/31/2015; revenue multiples in excess of 6x and EBITDA multiples in excess of 50x excluded.
2. Stock price performance (3-month and 12-month) is based on price as of 12/31/2015.

INDUSTRIAL TECHNOLOGY QUARTERLY
©2016 Raymond James & Associates, Inc., member New York Stock Exchange/SIPC
INVESTMENT BANKING
8
($ in U.S. millions, except per share data)
Market % of
Price Change in Stock Price 52-Week Enterprise Market LTM EBITDA EV / Revenue EV / EBITDA
Wire & Cable Ticker 12/31/15 3-Month(2)
12-Month(2) High Value Cap Revenue EBITDA Margin LTM 2016E LTM 2016E
Asia Pacific Wire & Cable Corp. Ltd. APWC $1.53 12.5% (41.4%) 56.7% $83.7 $21.1 $418.0 $6.8 1.6% 0.2x - 12.3x -
Encore Wire Corp. WIRE 37.09 13.5% (0.6%) 76.5% 707.8 766.6 1,052.1 79.0 7.5% 0.7x 0.7x 9.0x 6.8x
General Cable Corporation BGC 13.43 12.9% (9.9%) 63.0% 1,710.7 656.6 5,575.5 313.3 5.6% 0.3x 0.5x 5.5x 6.6x
LEONI AG LEO 39.64 (23.1%) (26.1%) 58.6% 1,748.4 1,294.8 4,939.7 340.2 6.9% 0.4x 0.4x 5.1x 4.9x
Nexans Société Anonyme NEX 36.60 11.9% 32.7% 85.0% 2,194.9 1,557.4 7,193.5 348.6 4.8% 0.3x 0.4x 6.3x 5.4x
Optical Cable Corp. OCC 2.83 (13.5%) (37.5%) 51.3% 31.0 20.0 82.1 2.5 3.0% 0.4x - 12.5x -
Prysmian S.p.A. PRY 22.00 9.8% 33.7% 91.8% 5,812.3 4,708.9 8,252.9 529.0 6.4% 0.7x 0.7x 11.0x 8.0x
Sumitomo Electric Industries Ltd. 5802 14.34 13.2% 13.9% 83.9% 15,969.5 11,376.5 24,651.8 2,293.3 9.3% 0.6x 0.6x 7.0x 6.2x
Median 69.7% $1,729.5 $1,030.7 $5,257.6 $326.8 6.0% 0.4x 0.5x 8.0x 6.4x
Mean 70.8% 3,532.3 2,550.2 6,520.7 489.1 5.7% 0.4x 0.5x 8.6x 6.3x
($ in U.S. millions, except per share data)
Market % of
Price Change in Stock Price 52-Week Enterprise Market LTM EBITDA EV / Revenue EV / EBITDA
Power Connectivity Ticker 12/31/15 3-Month(2)
12-Month(2) High Value Cap Revenue EBITDA Margin LTM 2016E LTM 2016E
AZZ incorporated AZZ $55.57 14.1% 18.4% 92.1% $1,773.4 $1,433.4 $850.3 $166.0 19.5% 2.1x 1.9x 10.7x 9.3x
Crompton Greaves Limited 500093 2.90 12.7% 2.3% 94.9% 2,055.6 1,816.7 1,594.8 25.6 1.6% 1.3x 0.9x NM 15.1x
Powell Industries, Inc. POWL 26.03 (13.5%) (47.0%) 57.7% 256.4 297.1 661.9 37.6 5.7% 0.4x 0.5x 6.8x 8.4x
Volex plc VLX 0.78 (19.5%) (22.7%) 60.2% 75.0 69.7 407.7 2.2 0.5% 0.2x 0.2x 34.3x 3.8x
XP Power Ltd. XPP 21.41 (9.3%) 3.9% 83.5% 408.8 407.1 164.8 42.0 25.5% 2.5x 2.4x 9.7x 9.0x
Median 83.5% $408.8 $407.1 $661.9 $37.6 5.7% 1.3x 0.9x 10.2x 9.0x
Mean 77.7% 913.8 804.8 735.9 54.7 10.6% 1.3x 1.2x 15.4x 9.1x
PUBLICLY TRADED INDUSTRIAL TECHNOLOGY COMPANY UNIVERSE(1)
Source: S&P Capital IQ.
1. Financial information, market values, and market multiples as of 12/31/2015; revenue multiples in excess of 6x and EBITDA multiples in excess of 50x excluded.
2. Stock price performance (3-month and 12-month) is based on price as of 12/31/2015.

INDUSTRIAL TECHNOLOGY QUARTERLY
©2016 Raymond James & Associates, Inc., member New York Stock Exchange/SIPC
INVESTMENT BANKING
9
13.2x14.8x
12.2x
9.6x
11.1x
13.1x
10.7x 10.4x
14.3x
12.6x
9.8x
0.0x
2.0x
4.0x
6.0x
8.0x
10.0x
12.0x
14.0x
16.0x11.7x
9.0x8.6x
4.6x
8.4x 8.0x
6.2x
8.6x
9.7x
8.0x
9.2x
0.0x
2.0x
4.0x
6.0x
8.0x
10.0x
12.0x
14.0x
11.2x 11.2x 11.5x
5.9x
10.4x
11.8x
8.5x
9.9x
13.2x
11.1x
10.1x
0.0x
2.0x
4.0x
6.0x
8.0x
10.0x
12.0x
14.0x
22.1x
35.2x
21.5x
6.9x
31.3x29.1x
16.2x
38.9x
0.0x
38.0x
9.6x
0.0x
5.0x
10.0x
15.0x
20.0x
25.0x
30.0x
35.0x
40.0x
45.0x
3D PRINTING AUTOMATION, POWER, MOTION & CONTROL
COMMUNICATIONS CONNECTIVITY ENVIRONMENTAL EQUIPMENT / CONTROLS
HISTORICAL ENTERPRISE VALUE TO EBITDA MULTIPLES
Source: S&P Capital IQ.
1. LTM median multiples as of 12/31/2015; see publicly traded Industrial Technology comparable company groups on pages 4 through 8 for companies within each industry.
NM
Median: 29.2x
Median: 10.9x
Median: 8.2x
Median: 12.1x

INDUSTRIAL TECHNOLOGY QUARTERLY
©2016 Raymond James & Associates, Inc., member New York Stock Exchange/SIPC
INVESTMENT BANKING
10
9.7x
11.7x11.3x
7.9x 8.2x8.7x
7.4x 7.4x
10.5x
9.4x9.9x
0.0x
2.0x
4.0x
6.0x
8.0x
10.0x
12.0x
14.0x
10.0x9.3x 9.8x
6.1x
9.9x 10.0x
7.9x
9.2x
11.2x 11.3x
9.8x
0.0x
2.0x
4.0x
6.0x
8.0x
10.0x
12.0x
8.5x
10.2x
8.0x
6.6x
8.4x
10.3x
9.0x
10.3x
13.6x 13.2x
14.7x
0.0x
2.0x
4.0x
6.0x
8.0x
10.0x
12.0x
14.0x
16.0x
10.1x
11.6x 11.9x
7.1x
11.5x10.4x
9.2x
10.5x
13.9x
11.5x 11.1x
0.0x
2.0x
4.0x
6.0x
8.0x
10.0x
12.0x
14.0x
16.0x
HISTORICAL ENTERPRISE VALUE TO EBITDA MULTIPLES
FLOW CONTROL HVAC PURE PLAYS
INDUSTRIAL CONGLOMERATES INTELLIGENT TRANSPORTATION
Median: 11.1x Median: 10.3x
Median: 9.7x
Median: 9.6x
Source: S&P Capital IQ.
1. LTM median multiples as of 12/31/2015; see publicly traded Industrial Technology comparable company groups on pages 4 through 8 for companies within each industry.

INDUSTRIAL TECHNOLOGY QUARTERLY
©2016 Raymond James & Associates, Inc., member New York Stock Exchange/SIPC
INVESTMENT BANKING
11
7.1x 7.4x7.1x
4.1x
10.4x
6.7x
5.1x5.9x
8.4x
6.7x 6.6x
0.0x
2.0x
4.0x
6.0x
8.0x
10.0x
12.0x
8.6x
11.2x
8.2x
5.6x4.9x
11.3x
8.4x 8.5x
13.2x
11.8x
9.7x
0.0x
2.0x
4.0x
6.0x
8.0x
10.0x
12.0x
14.0x
HISTORICAL ENTERPRISE VALUE TO EBITDA MULTIPLES
POWER CONNECTIVITY WIRE & CABLE
Median: 6.7x Median: 8.8x
Source: S&P Capital IQ.
1. LTM median multiples as of 12/31/2015; see publicly traded Industrial Technology comparable company groups on pages 4 through 8 for companies within each industry.

INDUSTRIAL TECHNOLOGY QUARTERLY
©2016 Raymond James & Associates, Inc., member New York Stock Exchange/SIPC
INVESTMENT BANKING
12
Date Enterprise EV / LTM
Announced Closed Target Buyers/Investors Sector Value ($M) Revenue EBITDA
12/14/2015 Pending SPX Cooling Technologies, Inc., Dry Cooling Business Paharpur Cooling Towers Limited Automation, Power, Motion & Control 48.0$ - -
11/7/2015 Pending TE Connectivity Ltd., Circuit Protection Business Littelfuse Inc. Automation, Power, Motion & Control 350.0 - -
11/5/2015 Pending COM DEV International Ltd. Honeywell International Inc. Industrial Conglomerates 345.8 2.1x 19.2x
11/2/2015 11/2/2015 Kele, Inc. Snow Phipps Group, LLC; Snow Phipps Fund 2, L.P. Automation, Power, Motion & Control - - -
10/29/2015 12/10/2015 Juno Lighting, LLC Acuity Brands, Inc. Automation, Power, Motion & Control 385.0 1.7x 12.0x
10/26/2015 Pending CliniSys Solutions Limited Roper Technologies, Inc. Industrial Conglomerates 261.1 - -
10/26/2015 10/26/2015 Atlas Medical Software Roper Technologies, Inc. Industrial Conglomerates 48.0 - -
10/8/2015 10/21/2015 Aderant Holdings, Inc. Roper Technologies, Inc. Industrial Conglomerates 675.0 - -
10/1/2015 10/1/2015 Priamus SYSTEM Technologies AG Barnes Group Inc. Automation, Power, Motion & Control - - -
10/1/2015 10/1/2015 Automated Quality Technologies, Inc. Motion Tech Automation, LLC Automation, Power, Motion & Control - - -
9/24/2015 10/1/2015 Gulf Coast Downhole Technologies, LLC Prysmian S.p.A. Wire & Cable 66.0 1.9x -
9/24/2015 10/28/2015 Clearlogx, Inc. H2O Innovation Inc. Flow Control - - -
9/16/2015 10/22/2015 Adept Technology Inc. Omron Management Center of America, Inc. Automation, Power, Motion & Control 190.8 3.5x NM
8/31/2015 8/31/2015 KB Electronics, Inc. Nidec America Corporation Automation, Power, Motion & Control - - -
9/1/2015 10/2/2015 ABEL GmbH & Co. KG Rotex Global, Coperion Corp., Terrasource Global Flow Control 106.7 3.2x 11.9x
8/31/2015 10/5/2015 Wolverine Advanced Materials, LLC ITT Corporation Industrial Conglomerates 300.0 - -
8/31/2015 8/31/2015 Engineered Products Company Donaldson Company, Inc. Environmental Equipment / Controls - - -
8/25/2015 8/25/2015 Thermocouple Technology, Inc. Viking Capital Holdings Automation, Power, Motion & Control - - -
8/15/2015 9/21/2015 ERICO Global Company Pentair plc Flow Control 1,800.0 - -
8/4/2015 8/4/2015 Prodomax Automation Ltd. Kensington Capital Partners Limited Automation, Power, Motion & Control - - -
8/3/2015 8/3/2015 Rimrock Corporation Lincoln Electric Holdings Inc. Automation, Power, Motion & Control - - -
8/3/2015 8/3/2015 B+ Equipment SAS Sealed Air Corporation Automation, Power, Motion & Control - - -
8/3/2015 8/3/2015 IDEX Corporation, Ismatec Product Line Cole-Parmer Instrument Company, LLC Flow Control 28.0 2.2x -
7/30/2015 7/30/2015 IEF-Werner GmbH INDUS Holding AG Automation, Power, Motion & Control - - -
7/30/2015 Pending Delta Tau Data Systems, Inc. OMRON Corporation Automation, Power, Motion & Control - - -
7/30/2015 12/1/2015 Custom Sensors & Technologies (Huizhou) Ltd. Sensata Technologies Holding NV Automation, Power, Motion & Control - - -
7/30/2015 Pending Custom Sensors & Technologies US Corporation Sensata Technologies Holding NV Automation, Power, Motion & Control - - -
7/28/2015 12/29/2015 Elster Group SE Honeywell International Inc. Industrial Conglomerates 6,523.6 4.0x -
7/26/2015 9/2/2015 Magnetek Inc. Columbus McKinnon Corporation Automation, Power, Motion & Control 165.4 1.5x 12.1x
7/23/2015 8/12/2015 THERMOPLAY S.p.A Barnes Group Inc. Automation, Power, Motion & Control 54.9 1.4x -
6/29/2015 Pending Spectronix Ltd. Emerson Process Management Asia Pacific Pte Ltd Automation, Power, Motion & Control 74.7 1.8x 9.3x
6/27/2015 Pending FCI Asia Pte Ltd. Amphenol East Asia Limited Power Connectivity 1,275.0 - -
6/21/2015 7/27/2015 Sutron Corporation Hach Company, Inc. Communications Connectivity 38.9 1.5x 55.8x
6/10/2015 6/10/2015 Alfa Valvole Srl IDEX Corporation Flow Control 115.5 3.4x -
6/8/2015 7/6/2015 Cognex Corporation, Surface Inspection Systems Division Ametek Inc. Automation, Power, Motion & Control 160.0 2.7x -
5/12/2015 8/31/2015 Pall Corporation Danaher Corp. Industrial Conglomerates 13,655.5 4.8x 20.4x
5/3/2015 9/3/2015 PMFG, Inc. CECO Environmental Corp. Automation, Power, Motion & Control 157.4 1.0x NM
4/22/2015 1/4/2016 Pace plc ARRIS Group, Inc. Communications Connectivity 2,017.0 0.8x 7.3x
4/2/2015 4/2/2015 Nuheat Industries Ltd. Pentair Thermal Management LLC Flow Control 96.0 - -
3/31/2015 3/31/2015 Hartzell Aerospace Group ITT Corporation Industrial Conglomerates 53.1 1.6x 8.5x
1/27/2015 8/28/2015TE Connectivity Ltd., Telecom, Enterprise and Wireless
BusinessCommScope Holding Company, Inc. Communications Connectivity 3,059.0 1.6x 10.2x
Median: 1.9x 12.0x
Average: 2.2x 16.7x
Source: S&P Capital IQ.
Note: Only includes transactions greater than $10 million.
SELECT RECENT INDUSTRIAL TECHNOLOGY M&A TRANSACTIONS
INDUSTRIAL TECHNOLOGY QUARTERLY
©2016 Raymond James & Associates, Inc., member New York Stock Exchange/SIPC
INVESTMENT BANKING
13
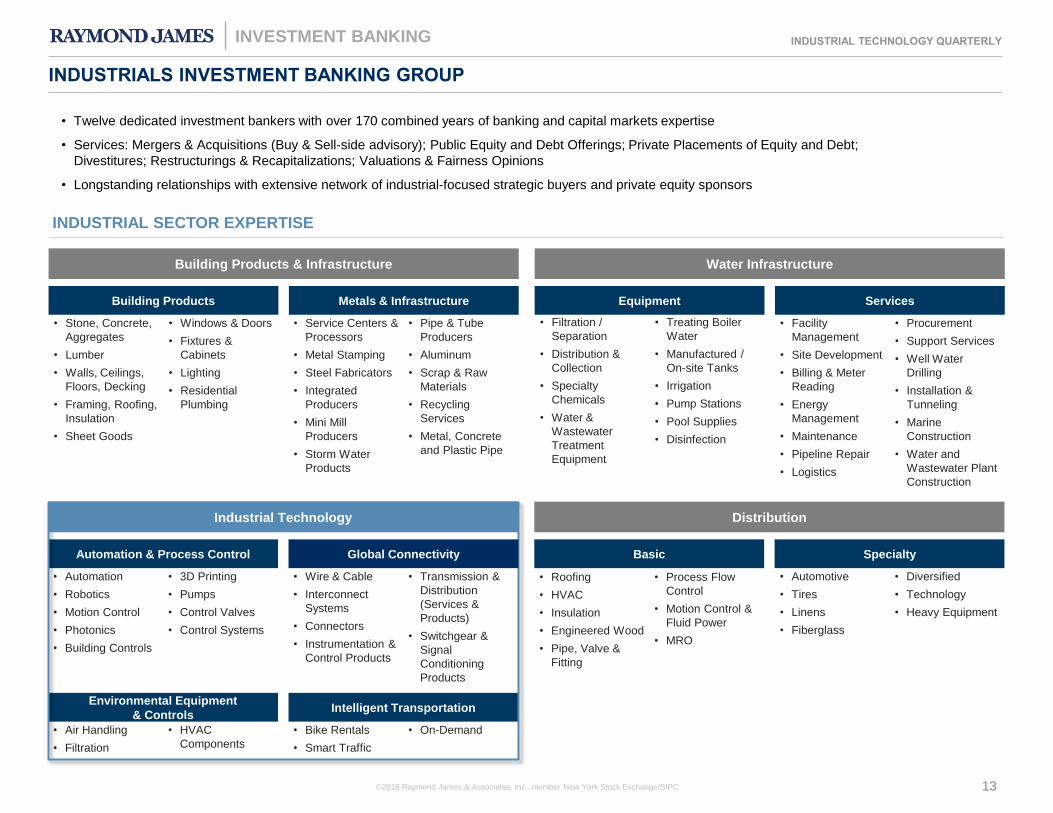
• Twelve dedicated investment bankers with over 170 combined years of banking and capital markets expertise
• Services: Mergers & Acquisitions (Buy & Sell-side advisory); Public Equity and Debt Offerings; Private Placements of Equity and Debt;
Divestitures; Restructurings & Recapitalizations; Valuations & Fairness Opinions
• Longstanding relationships with extensive network of industrial-focused strategic buyers and private equity sponsors
INDUSTRIAL SECTOR EXPERTISE
INDUSTRIALS INVESTMENT BANKING GROUP
Building Products & Infrastructure Water Infrastructure
Distribution
Building Products Metals & Infrastructure Equipment Services
Automation & Process Control
Environmental Equipment
& Controls Intelligent Transportation
Basic Specialty
• Stone, Concrete,
Aggregates
• Lumber
• Walls, Ceilings,
Floors, Decking
• Framing, Roofing,
Insulation
• Sheet Goods
• Windows & Doors
• Fixtures &
Cabinets
• Lighting
• Residential
Plumbing
• Service Centers &
Processors
• Metal Stamping
• Steel Fabricators
• Integrated
Producers
• Mini Mill
Producers
• Storm Water
Products
• Pipe & Tube
Producers
• Aluminum
• Scrap & Raw
Materials
• Recycling
Services
• Metal, Concrete
and Plastic Pipe
• Filtration /
Separation
• Distribution &
Collection
• Specialty
Chemicals
• Water &
Wastewater
Treatment
Equipment
• Treating Boiler
Water
• Manufactured /
On-site Tanks
• Irrigation
• Pump Stations
• Pool Supplies
• Disinfection
• Facility
Management
• Site Development
• Billing & Meter
Reading
• Energy
Management
• Maintenance
• Pipeline Repair
• Logistics
• Procurement
• Support Services
• Well Water
Drilling
• Installation &
Tunneling
• Marine
Construction
• Water and
Wastewater Plant
Construction
• Automation
• Robotics
• Motion Control
• Photonics
• Building Controls
• 3D Printing
• Pumps
• Control Valves
• Control Systems
• Wire & Cable
• Interconnect
Systems
• Connectors
• Instrumentation &
Control Products
• Transmission &
Distribution
(Services &
Products)
• Switchgear &
Signal
Conditioning
Products
• Air Handling
• Filtration
• HVAC
Components
• Bike Rentals
• Smart Traffic
• On-Demand
• Roofing
• HVAC
• Insulation
• Engineered Wood
• Pipe, Valve &
Fitting
• Process Flow
Control
• Motion Control &
Fluid Power
• MRO
• Automotive
• Tires
• Linens
• Fiberglass
• Diversified
• Technology
• Heavy Equipment
Global Connectivity
Industrial Technology