investing in the city of cape town - national · pdf filethe city of cape town’s aim is...
TRANSCRIPT
INVESTING IN THE CITY OF CAPE TOWN
28 August 2015

Vision, Delivery & Investment strategies
The Vision
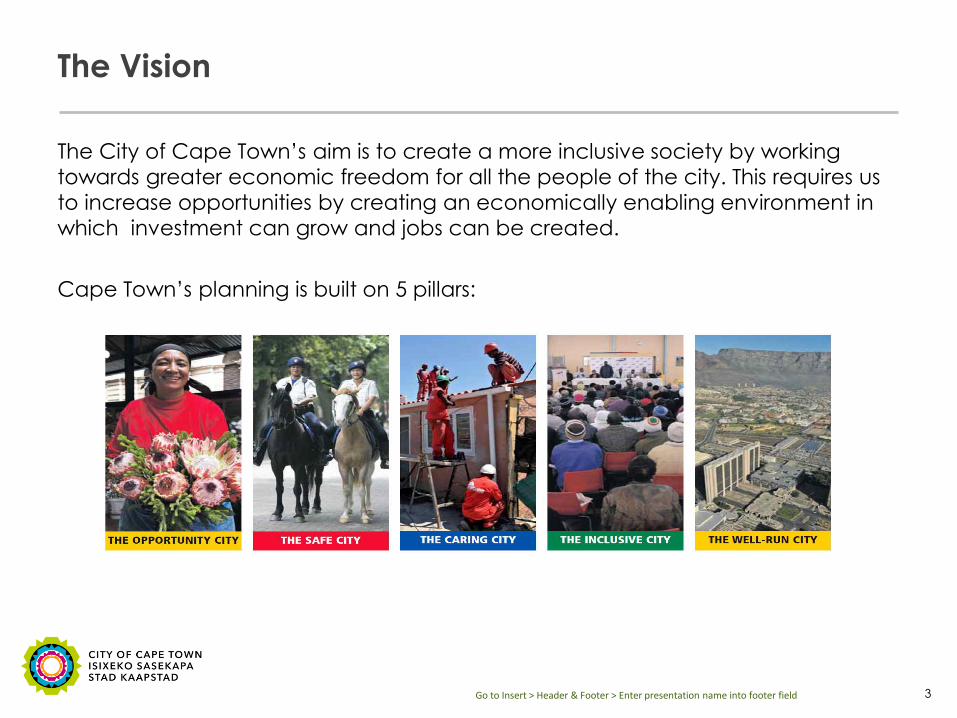
The City of Cape Town’s aim is to create a more inclusive society by working
towards greater economic freedom for all the people of the city. This requires us
to increase opportunities by creating an economically enabling environment in
which investment can grow and jobs can be created.
Cape Town’s planning is built on 5 pillars:
Go to Insert > Header & Footer > Enter presentation name into footer field 3
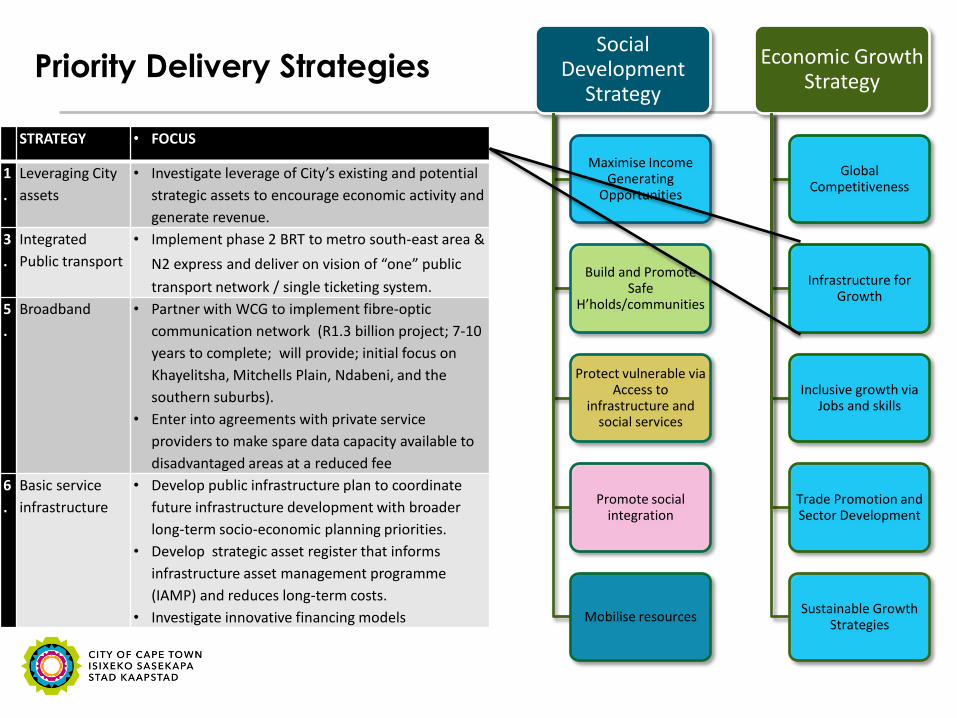
Social Development
Strategy
Maximise Income Generating
Opportunities
Build and Promote Safe
H’holds/communities
Protect vulnerable via Access to
infrastructure and social services
Promote social integration
Mobilise resources
Economic Growth Strategy
Global Competitiveness
Infrastructure for Growth
Inclusive growth via Jobs and skills
Trade Promotion and Sector Development
Sustainable Growth Strategies
STRATEGY • FOCUS
1
.
Leveraging City
assets
• Investigate leverage of City’s existing and potential
strategic assets to encourage economic activity and
generate revenue.
3
.
Integrated
Public transport
• Implement phase 2 BRT to metro south-east area &
N2 express and deliver on vision of “one” public
transport network / single ticketing system.
5
.
Broadband • Partner with WCG to implement fibre-optic
communication network (R1.3 billion project; 7-10
years to complete; will provide; initial focus on
Khayelitsha, Mitchells Plain, Ndabeni, and the
southern suburbs).
• Enter into agreements with private service
providers to make spare data capacity available to
disadvantaged areas at a reduced fee
6
.
Basic service
infrastructure
• Develop public infrastructure plan to coordinate
future infrastructure development with broader
long-term socio-economic planning priorities.
• Develop strategic asset register that informs
infrastructure asset management programme
(IAMP) and reduces long-term costs.
• Investigate innovative financing models
Priority Delivery Strategies
Current Investment Strategy
5 Go to Insert > Header & Footer > Enter presentation name into footer field
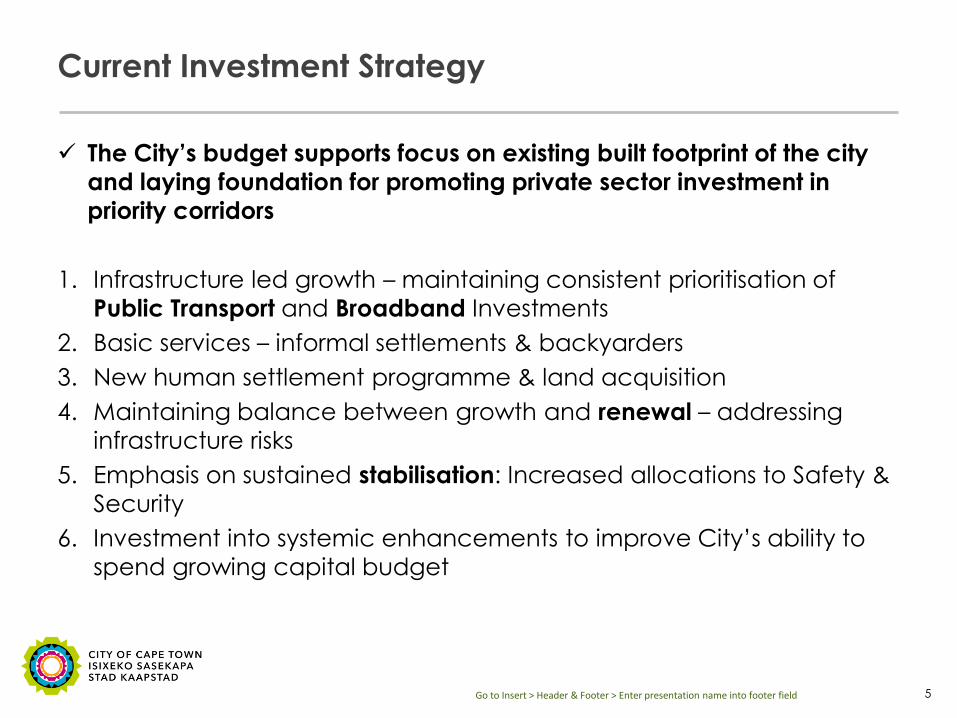
The City’s budget supports focus on existing built footprint of the city
and laying foundation for promoting private sector investment in
priority corridors
1. Infrastructure led growth – maintaining consistent prioritisation of
Public Transport and Broadband Investments
2. Basic services – informal settlements & backyarders
3. New human settlement programme & land acquisition
4. Maintaining balance between growth and renewal – addressing
infrastructure risks
5. Emphasis on sustained stabilisation: Increased allocations to Safety &
Security
6. Investment into systemic enhancements to improve City’s ability to
spend growing capital budget

Investment Strategy looking forward:
Transit Oriented Development
1. Progressive investment alignment across government and in space
2. Public Transport & Human Settlement development alignment
3. Integrated Human Settlement re-think
4. A pipeline of Catalytic Investment Opportunities
6 Go to Insert > Header & Footer > Enter presentation name into footer field
Transportation
IPTN
Respond to 820,000 peak hour “trips” by 2030
Emphasis on existing rail (+ Blue Downs extension) &
MyCiti network
Increasing financial and economic sustainability of systems and increasing mobility / access
Human Settlements
IHSF
Respond to 650,000 accommodation interventions by
2030
Emphasis on land, housing code & funding, institutional / HR,
partnerships
Increasing breadth and reach of programmes & defining realistic
interventions

Investment Strategy in space
Current integration zones
Priority zones/ corridors
Spatial Development Framework
Mayoral Urban Regeneration Programme Areas
Priority Investment Zones:
Integration Zones
Mayoral Urban Regeneration
Programme Areas
Integrated Public Transport Network
Existing Built Footprint

Investment Priorities

Priority Investments Underway: Infrastructure:
Public Transport
Go to Insert > Header & Footer > Enter presentation name into footer field 9
With over 5 years since IRT bus operations were introduced in the City of Cape
Town what is it that we need to keep the same, improve on and do
fundamentally differently.
Passengers are tired of inferior services and deserve better public transport
Our focus in Cape Town is to achieve
public transport that is safe, reliable,
rapid, comfortable and affordable
by using the challenges
faced as learning experiences and
finding opportunities
for improving service
delivery
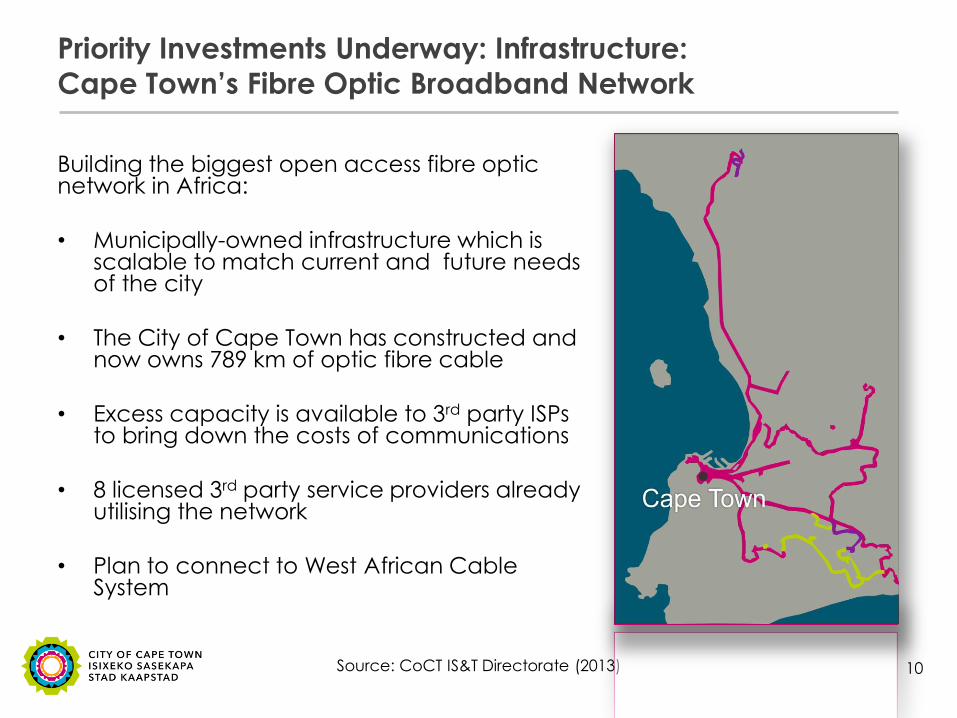
Priority Investments Underway: Infrastructure:
Cape Town’s Fibre Optic Broadband Network
Building the biggest open access fibre optic network in Africa: • Municipally-owned infrastructure which is
scalable to match current and future needs of the city
• The City of Cape Town has constructed and now owns 789 km of optic fibre cable
• Excess capacity is available to 3rd party ISPs
to bring down the costs of communications
• 8 licensed 3rd party service providers already utilising the network
• Plan to connect to West African Cable
System
10 Source: CoCT IS&T Directorate (2013)
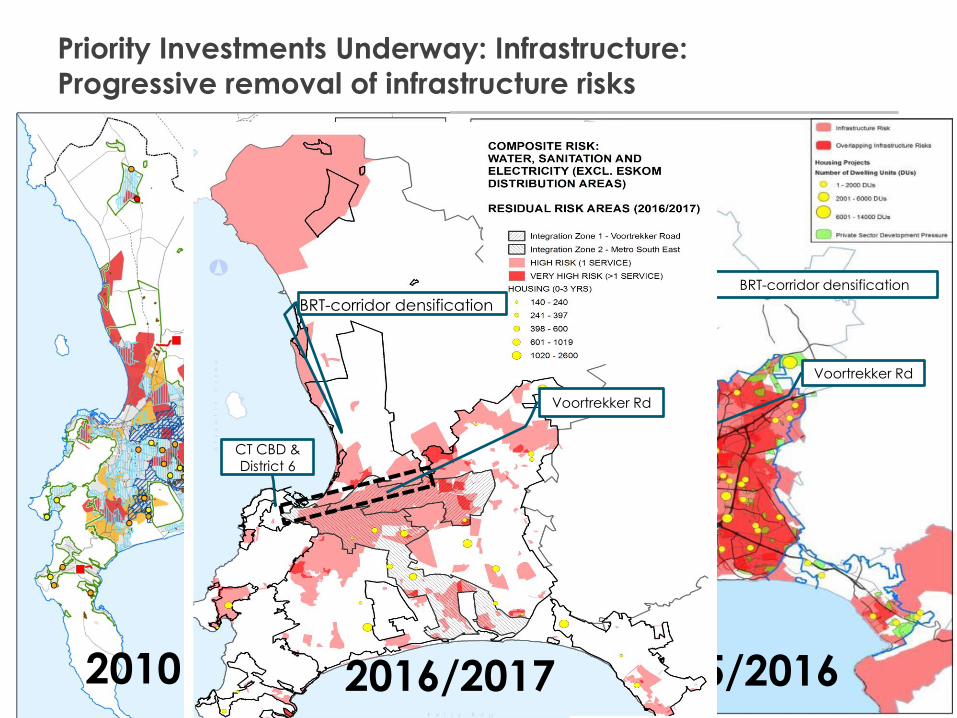
2015/2016
CT CBD &
District 6
BRT-corridor densification
Voortrekker Rd
2010 2016/2017
CT CBD & District 6
Voortrekker Rd
BRT-corridor densification
Priority Investments Underway: Infrastructure:
Progressive removal of infrastructure risks
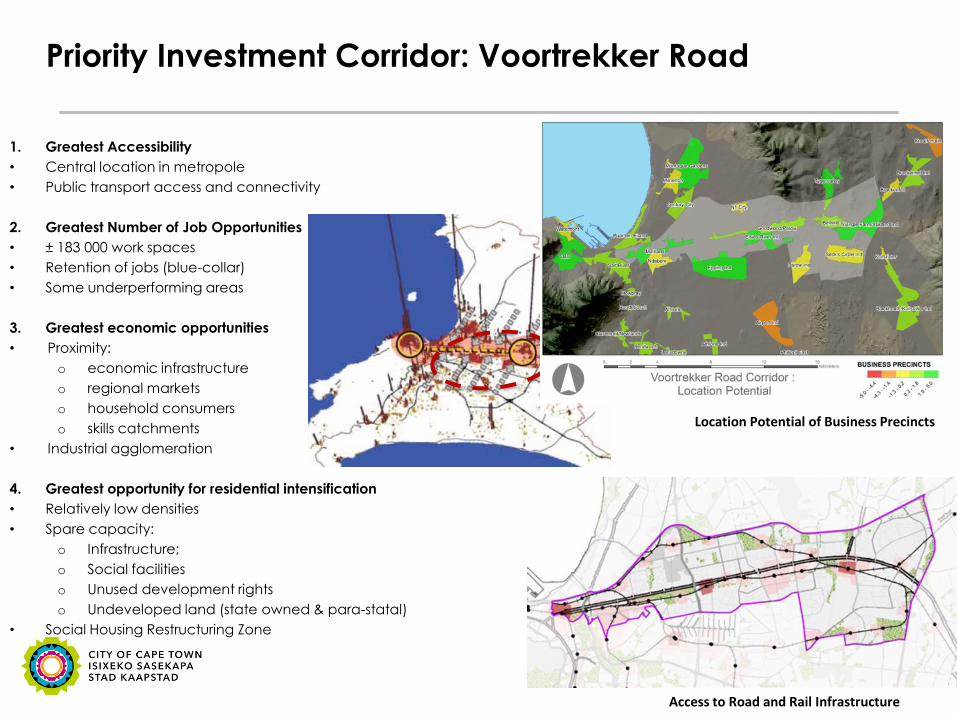
1. Greatest Accessibility
• Central location in metropole
• Public transport access and connectivity
2. Greatest Number of Job Opportunities
• ± 183 000 work spaces
• Retention of jobs (blue-collar)
• Some underperforming areas
3. Greatest economic opportunities
• Proximity:
o economic infrastructure
o regional markets
o household consumers
o skills catchments
• Industrial agglomeration
4. Greatest opportunity for residential intensification
• Relatively low densities
• Spare capacity:
o Infrastructure;
o Social facilities
o Unused development rights
o Undeveloped land (state owned & para-statal)
• Social Housing Restructuring Zone
12
Priority Investment Corridor: Voortrekker Road
Location Potential of Business Precincts
Access to Road and Rail Infrastructure

Flagship Investment Opportunities under development:
Property
Go to Insert > Header & Footer > Enter presentation name into footer field 13
Bulked up, mixed use transit oriented development:
570 000 m²
Residential: 20%
Public Institution:
20%
Commercial: 35%
Retail: 12%
Light Industry: 7%
ARTS 6%

Cape Town’s Investment Readiness
14

Client Satisfaction:
Dedicated to creating an enabling environment for business
Results from Customer Satisfaction Survey 2013/14:
• 88% of businesses said overall the City’s performance was good, very good or excellent
• 91% of businesses said City service provision was good, very good or excellent
• 87% of businesses said their trust in the City was fairly strong, very strong or extremely strong
• 83% of businesses rated Cape Town as “very good” or “excellent” in terms of the city as a business tourist destination. Confirmation of confidence that businesses have in the City as a favourable place to do business.
Source: TNS, CCT (2014) 15
2015 Financial Overview
• The City has once again achieved an annual result consistent with its long term goals of financial and economic sustainability, and this considering changes in consumer behaviour due to the drive for reduced water and electricity consumption levels
• This is the City’s 4th completed year of its current 5 year IDP plan in which it has exceeded its projected internal financial performance indicators
• The City has sustained positive liquidity and cash flows, which is indicative of public confidence and consumer resilience, and effective cash flow management
• The City’s balance sheet remains strong with evident credibility as reflected in its credit rating and appeal to the investor market
• The City’s strategy in containing consumer debt has remained positive

Financial Highlights at a Glance (figures in R millions)
Financial performance Actual Budget %
achieved
Operating revenue 29 250 29 026 100.77
Year on year growth % 12.50 12.91
Operating expenditure 27 393 29 281 93.55
Year on year growth % 7.47 12.74
Growth differential 5.19 .14
Capital expenditure 5 252 6 128 85.70%
Statement of Financial
Performance
Capital
Statement of Financial
Position
Financial position 2015 2014
Debtors (net) 5 313 4 718
Cash and Investments 8 341 7 874
Borrowings 6 761 7 034
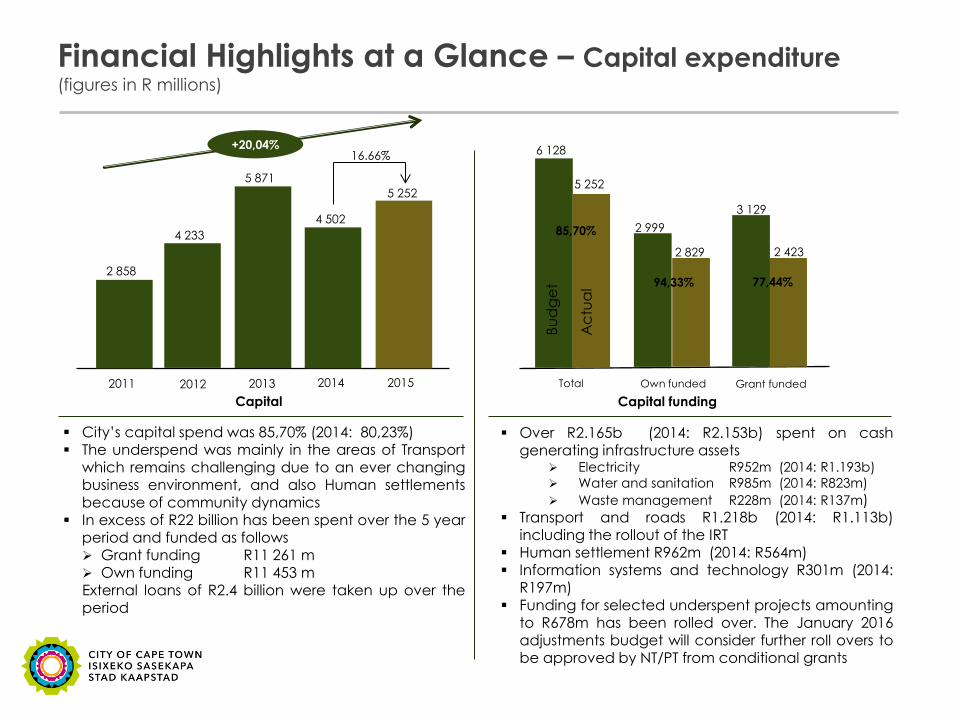
Financial Highlights at a Glance – Capital expenditure (figures in R millions)
6 128
5 252
2 999
2 829
3 129
2 423
Bu
dg
et
Ac
tua
l
Grant funded Own funded Total
Capital funding
94,33% 77,44%
85,70%
Over R2.165b (2014: R2.153b) spent on cash generating infrastructure assets
Electricity R952m (2014: R1.193b)
Water and sanitation R985m (2014: R823m)
Waste management R228m (2014: R137m)
Transport and roads R1.218b (2014: R1.113b) including the rollout of the IRT
Human settlement R962m (2014: R564m) Information systems and technology R301m (2014:
R197m) Funding for selected underspent projects amounting
to R678m has been rolled over. The January 2016 adjustments budget will consider further roll overs to be approved by NT/PT from conditional grants
16.66%
4 233
5 871
4 502
5 252
2011 2012 2013 2014 2015
+20,04%
2 858
Capital
City’s capital spend was 85,70% (2014: 80,23%) The underspend was mainly in the areas of Transport
which remains challenging due to an ever changing business environment, and also Human settlements
because of community dynamics In excess of R22 billion has been spent over the 5 year
period and funded as follows Grant funding R11 261 m Own funding R11 453 m External loans of R2.4 billion were taken up over the period

Financial Highlights at a Glance – Loan debt
Total debt: total realistic
revenue ratio is 31,48% (2014:
35,54%) and above the
internal benchmark of 35%.
Should the sinking fund be
taken into account the ratio
would be 23,16% (2014:
27,27%)
The repayment of the City’s
three bonds, amounting to
R4.2b, has been guaranteed
by once-off monetary
deposits, totalling R1.5b
No loans were taken up
during the 14/15 fin year
resulting in savings of more
than R130m
Overall debt profile well within
lenders’ financial covenants
0%
5%
10%
15%
20%
25%
30%
35%
40%
45%
-
1 000 000
2 000 000
3 000 000
4 000 000
5 000 000
6 000 000
7 000 000
8 000 000
2011 2012 2013 2014 2015
Total Debt: Total Revenue
short term debt Long term debt
Total debt (net): income % Total debt (gross): income %

Financial Highlights at a Glance
2015 2014
Adjusted liquidity ratio (:1) 0.9 0.9
Cost coverage ratio (:1) 1.89 1.84
Debt coverage by own revenue(:1) 4.89 4.13
Cash interest coverage (:1) 7.8 5.6
Cash generated from operations / revenue 20.76% 17.77%
Selected key ratios
Credit rating
Debtors payment ratio
2015 2014
Credit rating A1 Aa3
2015 2014
As per AFS 95.64% 96.35%
As per National Treasury 96.68% 97.22%

Funding Strategy: Borrowing
• The City prefers balance sheet as opposed to project funding for the following reasons
– Projects can be prioritised in terms of the City’s needs & plans and not ad hoc funding availability
– Costs can potentially be negotiated in terms of better cost structures
– Potentially less onerous covenants and other terms and conditions
• Better and more flexible cash flow management
• Internal key indicators are set in place to maintain strong balance sheet position and credit rating
• Annuity as opposed to bullet structured instruments to minimise idle cash in the creation of sinking funds and to ensure a more incremental budgeted tariff growth
• Loan tenors aligned to the useful lives of the assets as far as possible to maximise equitable cost allocation

Conclusion

Hot off the press
On 29 July 2015 the City of Cape Town’s Full Council resolved that:
Go to Insert > Header & Footer > Enter presentation name into footer field 23
C 11/07/15 FUNDING TO SUPPORT THE CAPITAL PROGRAMME RESOLVED that:
(a) authority be granted to commence a process, as set out in Section
46 of the Local Government: Municipal Finance Management Act (MFMA), Act 56 of 2003, for taking up external loan funding of up to R2 billion to finance the capital programme:
(i) subject to a competitive process being concluded;
(i) a report be submitted on the preferred bidder for Council approval
in terms of Section 46 of the MFMA. (a) authority be granted to commence a process, as set out in Section
45 of the MFMA, to obtain a short-term credit facility of up to R1 billion in the 2015/16 financial year and a report be submitted for Council approval.
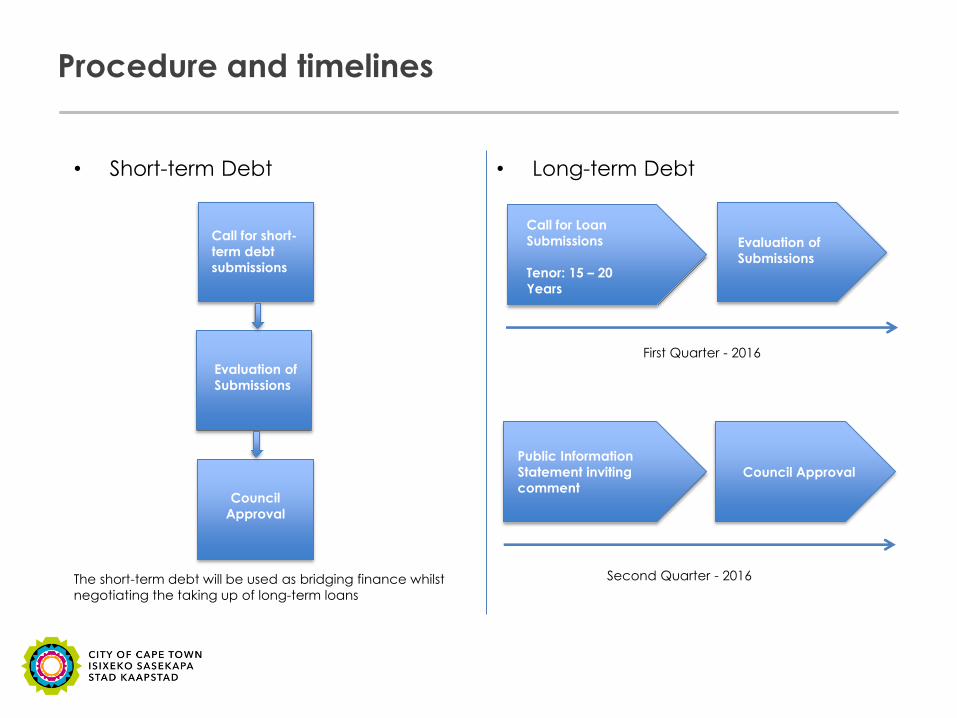
Procedure and timelines
• Short-term Debt
The short-term debt will be used as bridging finance whilst
negotiating the taking up of long-term loans
Call for Loan
Submissions
Tenor: 15 – 20
Years
Evaluation of
Submissions
Public Information
Statement inviting
comment Council Approval
Second Quarter - 2016
• Long-term Debt
First Quarter - 2016
Call for short-
term debt
submissions
Evaluation of
Submissions
Council
Approval

In Conclusion
The opportunity and safe city
The inclusive and caring city
The well–run city
The City continues to secure through careful planning and
governance an environment attractive to investors and
which provides for the wellbeing and security of its citizens
The City’s social programmes and investments continue to
enhance social cohesion and community life
The City has maintained its vested public image of sound
financial management and governance

Thank You