investing in clean agriculture -...
TRANSCRIPT
INVESTING IN CLEAN AGRICULTURE:HOW CALIFORNIA CAN STRENGTHEN AGRICULTURE,
REDUCE POLLUTION AND SAVE MONEY
by Gary Wolff, P.E., Ph.D.

© Copyright 2005, All Rights Reserved
Editor: Nicholas L. CainDesigner: Bryan Kring, Gas Tank Graphix, Oakland, CaliforniaCopy Editor: Joe Sadusky, Gas Tank Graphix, Oakland, California
Pacific Institute for Studies in Development, Environment, and Security654 13th StreetPreservation ParkOakland, California 94612
Tel: 510-251-1600Fax: 510-251-2203
INVESTING IN CLEAN AGRICULTURE:HOW CALIFORNIA CAN STRENGTHEN AGRICULTURE,
REDUCE POLLUTION AND SAVE MONEY
by Gary Wolff, P.E., Ph.D.
January 2005

ABOUT THE INSTITUTE
THE PACIFIC INSTITUTE IS DEDICATED TO protecting our natural world, encouraging sustainable development, and improving global security.
Founded in 1987 and based in Oakland, California, we provide independentresearch and policy analysis on issues at the intersection of development, environment, and security. The Pacific Institute currently has five main areas of research: Water and Sustainability, Environment and Security, CommunityStrategies for Sustainability and Justice, Economic Globalization and theEnvironment, and Global Change. More information on our programs and publications can be found online at: http://www.pacinst.org.
ABOUT THE AUTHOR
GARY WOLFF, P.E., PH.D., IS THE principal economist and engineer for thePacific Institute. Dr. Wolff is an expert in the economics and engineering
of the water sector, including conservation, end-use efficiency, privatization, andincentive policies. His work encompasses water, wastewater, and storm-waterissues. More generally, he maintains an active interest in all public policies andengineering technologies that lead to better management of natural resourcesand pollution. More information about his work is available from the PacificInstitute's website at http://www.pacinst.org/about_us/staff_board/wolff/.

ACKNOWLEDGEMENTS
MANY PEOPLE HELPED WITH THIS REPORT and the lengthy exploration of databehind it. They include, in alphabetical order: Alisha Deen (Environmental
Justice Coalition for Water), Nick Cain (Pacific Institute), Jenny Derry (SantaClara County Farm Bureau), Rich Demoura (University of California at Davis),Jonathan Kaplan (Natural Resources Defense Council), Mary Ellen Dick (City ofSan Jose), George Farnsworth (California Department of Pesticide Regulation),Rebecca Flournoy (Policy Link), Bill Jennings (Waterkeepers of NorthernCalifornia), Susan Kegley (Pesticide Action Network of North America), GaryNelson (California Agricultural Statistics Service), Pete Price (Price Consulting),Leland Swenson (Community Alliance with Family Farmers), and Bill Croyle(Central Valley Regional Water Quality Control Board). Early exploration of theseissues was helped enormously by Paul Ebner, Eric Hsieh, Jason Malinksy, JessicaRider and Yan Zha (former or current students at the University of California atBerkeley or the Goldman School of Public Policy at UC Berkeley). Many others,too lengthy to list, have contributed to my knowledge of California agricultureover the years. I also gratefully acknowledge the financial support of the ClarenceE. Heller Charitable Foundation and the Horace W Goldsmith Foundation. Allerrors are my own.

TABLE OF CONTENTS
EXECUTIVE SUMMARY __________________________________________________________ 7
INTRODUCTION _______________________________________________________________ 8
TAKING THE LONG VIEW: California Farms and Efficiency _________________________________ 9
PESTICIDE REGULATION: Safe Standards Versus Use-Reduction ___________________________ 10
The Multiple Benefits of Pesticide Use Reduction _____________________________________ 11
Opportunities for Change, Opportunities for Profit ____________________________________ 13
How Much Pesticide Use Reduction Is Cost-Effective? _________________________________ 15
Perceptions of Risk and Barriers to Change _________________________________________ 15
Programs Versus Incentives ____________________________________________________ 16
OUR RECOMMENDATION _______________________________________________________ 17
Impacts on Growers __________________________________________________________ 18
An Alternative Policy _________________________________________________________ 20
Why Act Now? ______________________________________________________________ 21
REFERENCES ________________________________________________________________ 23
APPENDIX A: Assessing the Statewide Potential to Reduce Pesticide Use AND Increase Profitability in California Agriculture __________________________ 27
Figure 1: Harvested Acres by Crop Category in California, 1960-2002 _______________________ 9
Figure 2: Pesticide Expenditures as a Percent of Net Farm Income in California _______________ 11
Table 1: Pesticide Intensity and Gross Revenue per Acre in California _______________________ 9
Table 2: Financial Benefit by Commodity Type, per Acre per Year __________________________ 19
Table A-1: Estimated Wholesale Price of Selected Pesticides in California, 2002 ______________ 28
Box 1: Pesticide Use Reduction Experience Outside California ____________________________ 10
Box 2: Pesticide Use and Government Budgets: Potential Impacts _________________________ 12
Box 3: Pesticide Overuse and Knowledge ___________________________________________ 14
Box 4: Some Examples of the Technical Potential for Use Reduction _______________________ 15
Box 5: The Sinclair Paint Decision ________________________________________________ 20

EXECUTIVE SUMMARY
GLOBAL COMPETITION, suburban encroachment,tighter regulations, and rising input costs aremaking farming in California more difficult
and often less profitable. At the same time, pesticidepollution from farming is causing significant harm toCalifornia’s surface and groundwater, air quality, andto human health. But there is a way to address theseproblems that helps farmers and protects the public:raise the pesticide mill fee and use revenues toencourage voluntary changes in on-farm practices.
The California Performance Review is causing stateleaders to consider significant reform. A system thatencourages farmers to “go beyond compliance” willmake future regulation of agricultural runoff and airemissions simpler, less costly, and more effective.
Pesticide regulation in California has focused almostexclusively on safe standards for use. But safe standards are only one way to reduce the harms andrisks of pesticide use. Policies that cost-effectivelyreduce total use are also possible, and have been used successfully to reduce pesticide use from 20-75% in Iowa, Denmark, and Sweden. Even modest reductions (e.g., 10%) achieved voluntarilyby farmers would be a significant accomplishmentwith many benefits for the environment, farmers, and human health.
This report evaluates a policy of temporarily increasing the existing pesticide fee by 79 mills (7.9% of the wholesale cost of pesticides, for threeyears), with rebate of most revenue to participatingfarmers. The remainder would be spent to train participating farmers in voluntary sustainable farming techniques, and to provide insurance against the risk of crop loss from alternative practices. This policy would:
• Help farmers respond proactively to the morestringent water and air quality regulations that areinevitable as urban populations expand into farmareas (misperceptions of the risk of alternativepractices are common and are a major impedimentto adoption of cost-effective practices that areavailable today)
• Reduce pesticide pollution and the environmentaland health harms it causes
• In the long run, save the state and local governmentsmoney by reducing future health, regulatory, andclean-up costs that are often borne by taxpayers.
Because urban users of pesticides pay about 50% ofthe pesticide mill fee, a system that spends additionalmill fee revenue to encourage change in the farm sector does not create a net burden on farmers. Infact, it would bring about $60 million per year intothe farm sector from the urban sector. This is fair and desirable for urban users1 since many of the environmental and health harms of excess pesticideuse on farms are now borne by downstream urbandwellers. By temporarily increasing the mill feestatewide and using revenue to support farmers whovoluntarily clean up their farm practices, urbandwellers and farmers would be working together tosolve many problems — economic, environmental,and medical — that will cost much more to ignore or to “solve” through litigation and the usual political battles.
Investing in Clean Agriculture: How California Can Strengthen Agriculture, Reduce Pollution and Save Money 7
1 Some sellers of consumer pesticides have threatened to litigate over what they perceive as an existing “subsidy” from urban to agricultural pesticide users. They believe
current California Department of Pesticide Regulation spending benefits farmers at the expense of urban pesticide sellers and users. An alternative policy – discussed toward
the end of this report – that would be less offensive to these parties is a higher mill fee on agricultural pesticides only, and a water source protection fee levied on non-
agricultural water consumers.
Even modest reductions in
pesticide use—achieved
voluntarily by farmers—
would have many benefits
for the environment,
farmers, and human health.

INTRODUCTION
CALIFORNIA’S AGRICULTURAL SECTOR IS
impressive. It produces a very wide range of fruit, vegetable, nut, and row crops, as
well as meat, dairy products, and horticultural products like cut flowers and landscape plants.Annual gross revenue is about $28 billion (DOF,2003),2 almost 50% more than the combined outputof the second- and third-largest producing states(Texas and Iowa). On the other hand, unintentional by-products of farming like air and water pollutionare a significant financial burden for current andfuture generations of Californians that should be“netted against” farm sector output in a completeand rational accounting system.
According to the work of others cited throughoutthis document, maintaining a strong agricultural sector while reducing the unintended consequences of farming requires a transition to sustainable agriculture.3 The 1990 U.S. Farm Bill defined sustainable agriculture as “an integrated system ofplant and animal production practices that will, overthe long term: satisfy human food and fiber needs;enhance environmental quality and the naturalresource base upon which the agricultural economydepends; … integrate where appropriate, natural biological cycles and controls; sustain the economicviability of farm operations; and enhance the qualityof life for farmers and society as a whole.”
This is not a radical definition or a call for the end of farming, as we know it.4 It is in our opinion theonly way to escape long-term social forces that couldbe very detrimental to farms and farmers and foodsecurity.5 These forces — global competition, suburbanencroachment, tighter regulations, and rising inputcosts — are making farming in California more difficult and less profitable. A “business as usual”future likely involves fewer farms and farm acreage,6
water sold or transferred to cities, less business forrural merchants, and fewer jobs for farm workers.
The combination of these pressures has and will continue to lead toward higher value-added commodities that under conventional practices useconsiderably more pesticides per acre, as described in the next section.
Global competition is here to stay, and tighter regulations are appropriate. Pollutants in stormrunoff from farms affect the water supply of at least20 million Californians and are harmful to otherparts of the California economy (e.g., fishing andrecreation), groundwater is often being extractedfaster than nature can recharge it, and air quality in some farming areas is now worse than in urbanareas.7 Environmentalists and regulators are not driving farmers off the land; underlying social trendslike rapid population growth, urbanization, and global competition are, and they aren’t going to stop.
2 This is about 2% of annual economic output in California.
3 Parts of the transition have begun. Swezey and Broome (2000) say “alternative farming systems could comprise at least 20% and as much as 60% of all California cropland
in production by 2025.” But what could be and what will be are obviously different.
4 Committees of the National Research Council composed of leading agriculturalists in academia, business, government, and the nonprofit sector have twice made similar
recommendations (NRC, 1989 and 1996).
5 Food security refers to sufficient production of food to support the local population in an extended crisis, e.g., a war that disrupts regional or international trade.
6 The US Census of Agriculture (2002 and 1997) shows about a 10% decline in farm acreage in California in the last 15 years (about 27.6 million acres in 2002 versus about
30.6 million acres in 1987). Total harvested acreage (see Figure 1), however, has not declined noticeably since 1960, which suggests that either non-cropland farms (e.g.,
ranches) are being consumed by urban sprawl or that non-crop farmland uses are converted to crops as croplands near urban centers are consumed by sprawl.
7 Kegley, et. al. (2003) and Kegley, et. al. (1999) summarize current science and data on air quality and ecological impacts of pesticide use in California.
8 Introduction
Sustainable agriculture
is the only way to
escape long-term social
forces that could be very
detrimental to farms
and farmers.

Investing in Clean Agriculture: How California Can Strengthen Agriculture, Reduce Pollution and Save Money 9
TAKING THE LONG VIEW:CALIFORNIA FARMS AND EFFICIENCY
IF WE WANT TO MAINTAIN THE STRENGTH of theCalifornia farm sector in the long run, we need to get past the usual political divides and ask
what is needed to achieve sustainable agriculture asdefined in the Farm Bill. In the long run, Californiaagriculture must use more information and knowledgeand less of nearly every other input (e.g., land, water,pesticides, fuels). We are already part of the “FruitfulRim” region identified by the USDA as producing22% of US agricultural production on only 8% ofcropland.8 And the historical trend toward highvalue-added commodities like fruits, nuts, vegetables,and melons (Figure 1) will likely continue.
Figure 1: Harvested Acres by Crop Category in California,1960-20029
This trend has increased pesticide use per averageacre, because higher value-added crops use pesticidesmore intensively (Table 1). Unless we widely implementthe best available clean production practices, the natural response of farmers to global competitionand other pressures (i.e., to intensify production anduse more pesticides) will lead to a head-on collisionwith the natural response of a larger and more affluent California population (i.e., to protect water and air quality). Taking the long view meansrecognizing and solving this conflict before itbecomes a political crisis.
Table 1: Pesticide Intensity and Gross Revenue per Acre in California
Notes: (1) From Kegley, et.al. (2000), using 1998 data
(2) Estimate by author, using 2000 data from the DOF (2003)
Another important trend in California is the budgetcrisis and the way it is affecting government programs.Even after Proposition 58 bond revenues of $15 billion are used in fiscal year 2004-2005, billions ofdollars of deficits are projected for later fiscal years.Actions that help the budget not just this year oreven next, but in the long-term, are needed. That iswhy the California Performance Review has beenundertaken, and the Governor has made someadministrative decisions with significant potential tocreate long-term savings.10 Farm policies in Californianeed to be reformed based on the long view. We need policy innovations in regulation, not just belt-tightening accompanied by promises to eliminate inefficiency in the state bureaucracy. This report focuses on pesticide policy, but places itin the context of other, broader policy issues such as water and air quality protection, long-term control of health care costs, and crop production risk management.
Row Crops 7.13 $ 640Fruits and Nuts 51.25 $2,936Vegetables and Melons 21.24 $4,856
Pounds of GrossPesticides/Acre1 Revenue/Acre2
10,000,000
8,000,000
6,000,000
4,000,000
2,000,000
0
1960 1970 1980 1990 2000
Vegetables and Melons
Fruits and Nuts
Field Crops
Harv
este
d Ac
res
8 See www.usda.gov/emphases/harmony/issues/resourceregions/resourceregions.htm.
9 Data faxed by Gary Nelson, California Agricultural Statistics Service, “Principal Crops: Harvested Acres, California, 1950-Present (June 2004).”
10 For example, the Governor appointed Jeanne Woodford to run the California Department of Corrections. She has created programs at San Quentin that seem to reduce
recidivism at little state expense. Since it costs on average $31,000 per year to house a prisoner, and two-thirds of those released return to prison within 18 months (twice
the national average rate), policies that reduce the number of prisoners who return are very helpful to the state budget, in the long term (The New York Times Magazine,
March 14, 2004).
10 Pesticide Regulation: Safe Standards Versus Use-Reduction
PESTICIDE REGULATION: SAFE STANDARDS VERSUS USE-REDUCTION
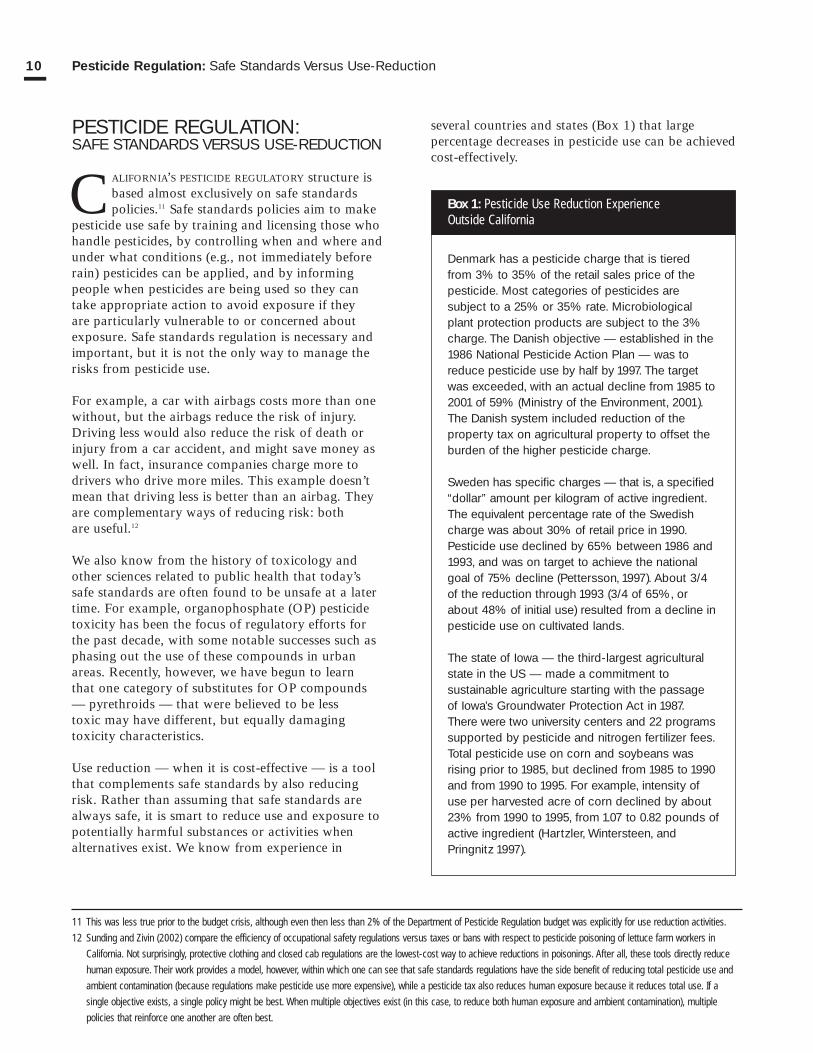
CALIFORNIA’S PESTICIDE REGULATORY structure isbased almost exclusively on safe standardspolicies.11 Safe standards policies aim to make
pesticide use safe by training and licensing those whohandle pesticides, by controlling when and where andunder what conditions (e.g., not immediately beforerain) pesticides can be applied, and by informing people when pesticides are being used so they cantake appropriate action to avoid exposure if they are particularly vulnerable to or concerned aboutexposure. Safe standards regulation is necessary andimportant, but it is not the only way to manage therisks from pesticide use.
For example, a car with airbags costs more than onewithout, but the airbags reduce the risk of injury.Driving less would also reduce the risk of death orinjury from a car accident, and might save money aswell. In fact, insurance companies charge more todrivers who drive more miles. This example doesn’tmean that driving less is better than an airbag. Theyare complementary ways of reducing risk: both are useful.12
We also know from the history of toxicology andother sciences related to public health that today’ssafe standards are often found to be unsafe at a latertime. For example, organophosphate (OP) pesticidetoxicity has been the focus of regulatory efforts forthe past decade, with some notable successes such asphasing out the use of these compounds in urbanareas. Recently, however, we have begun to learn that one category of substitutes for OP compounds— pyrethroids — that were believed to be less toxic may have different, but equally damaging toxicity characteristics.
Use reduction — when it is cost-effective — is a toolthat complements safe standards by also reducingrisk. Rather than assuming that safe standards arealways safe, it is smart to reduce use and exposure topotentially harmful substances or activities whenalternatives exist. We know from experience in
several countries and states (Box 1) that large percentage decreases in pesticide use can be achievedcost-effectively.
11 This was less true prior to the budget crisis, although even then less than 2% of the Department of Pesticide Regulation budget was explicitly for use reduction activities.
12 Sunding and Zivin (2002) compare the efficiency of occupational safety regulations versus taxes or bans with respect to pesticide poisoning of lettuce farm workers in
California. Not surprisingly, protective clothing and closed cab regulations are the lowest-cost way to achieve reductions in poisonings. After all, these tools directly reduce
human exposure. Their work provides a model, however, within which one can see that safe standards regulations have the side benefit of reducing total pesticide use and
ambient contamination (because regulations make pesticide use more expensive), while a pesticide tax also reduces human exposure because it reduces total use. If a
single objective exists, a single policy might be best. When multiple objectives exist (in this case, to reduce both human exposure and ambient contamination), multiple
policies that reinforce one another are often best.
Denmark has a pesticide charge that is tiered from 3% to 35% of the retail sales price of thepesticide. Most categories of pesticides are subject to a 25% or 35% rate. Microbiologicalplant protection products are subject to the 3%charge. The Danish objective — established in the1986 National Pesticide Action Plan — was toreduce pesticide use by half by 1997. The targetwas exceeded, with an actual decline from 1985 to2001 of 59% (Ministry of the Environment, 2001).The Danish system included reduction of the property tax on agricultural property to offset theburden of the higher pesticide charge.
Sweden has specific charges — that is, a specified“dollar” amount per kilogram of active ingredient.The equivalent percentage rate of the Swedishcharge was about 30% of retail price in 1990.Pesticide use declined by 65% between 1986 and1993, and was on target to achieve the nationalgoal of 75% decline (Pettersson, 1997). About 3/4of the reduction through 1993 (3/4 of 65%, orabout 48% of initial use) resulted from a decline inpesticide use on cultivated lands.
The state of Iowa — the third-largest agriculturalstate in the US — made a commitment to sustainable agriculture starting with the passage of Iowa’s Groundwater Protection Act in 1987.There were two university centers and 22 programssupported by pesticide and nitrogen fertilizer fees.Total pesticide use on corn and soybeans was rising prior to 1985, but declined from 1985 to 1990and from 1990 to 1995. For example, intensity ofuse per harvested acre of corn declined by about23% from 1990 to 1995, from 1.07 to 0.82 pounds ofactive ingredient (Hartzler, Wintersteen, andPringnitz 1997).
Box 1: Pesticide Use Reduction Experience Outside California

The Multiple Benefits of Pesticide Use Reduction
Pesticide use reduction has multiple benefits. It canstrengthen the financial bottom line for Californiacommodity growers while reducing water pollution.And it can be implemented in a voluntary way that“goes beyond compliance” in order to reduce thecost and severity of inevitable, future water qualityregulations for agricultural runoff.
Spending on pesticides as a percent of net income has grown steadily in the last decade (Figure 2). Thetrend has made profitability more difficult to attain.A trend like that cannot be sustained for inputs.Controlling costs through more efficient use of inputs is necessary for California’s farm sector tothrive. Pesticide use reduction policies that lead towider adoption of cost-effective pest managementpractices can help to increase net income forCalifornia farmers.
Pesticide use reduction would also reduce environmental impacts. Agricultural runoff has beenexempt, historically, from water quality regulation.An intense regulatory and legal battle is now underway over future regulation of agriculturalrunoff. Recent actions of the Central Valley Regional
Water Quality Control Board and the State WaterResources Control Board with regard to this issuewill be challenged in court. The debate is no longerabout whether farm runoff will be regulated; it isnow about the details of future regulation. Pesticideuse reduction policies could make future regulationof agricultural runoff simpler, less costly, and more effective.
Pesticide use reduction can also help with state and local budget problems, eventually. A crediblenationwide estimate of the costs of pesticide use
Investing in Clean Agriculture: How California Can Strengthen Agriculture, Reduce Pollution and Save Money 11
13 A credible statewide analysis of these costs has not been performed in California. Numerous studies, however, confirm the environmental and health damages caused by
pesticide use, although these damages are expressed in physical rather than economic terms. See for example, Solomon (2000).
14 Data from DOF (2003 and 2000).
Figure 2: Pesticide Expenditures as a Percent of Net Farm Income in California14
25%
20%
15%
10%
5%
0%
1990 1992 1994 1996 1998 2000 2002 2004
Pesticide policies can help
increase net income for
farmers while reducing
environmental impacts.

Health care spending among those aged 0-64 in California isabout $62 billion per year (Kominski and Roby, 2004). Medi-Calexpenditures are budgeted at $33 billion in fiscal year 2004-05(DOF, 2004). County government spends about $5.3 billion eachyear on health related services (CICG, 2003). And hospitals andsafety net clinics in California spend over $3 billion per year caring for the uninsured (Kominski and Roby, 2004). More thanhalf of the nearly 10 million emergency room visits each year(CCIG, 2003) are for non-urgent services that cost six times moreto provide in this way than through a doctor’s office. Asthma,especially in children, has risen dramatically in California. Asthmahospitalizations cost $480 million in California in 2000, with abouta third of these stays paid through Medi-Cal (Department ofHealth Services Strategic Plan for Asthma). Dr. David Pepper,director of the Asthma Education and Management Program atthe Fresno University of California Medical Center, says outpatientcosts for treating asthma are about $1,000 per patient per year(personal communication, Susan Kegley).
How much of these expenditures is pesticide-related? We don’tknow with certainty. But numerous reputable, peer-reviewedstudies support the link between pesticide exposure and humanhealth problems (Solomon, 2000). And numerous pesticides areknown causes or contributors to asthma. See, for example, theAssociation of Occupational and Environmental Health Clinics on-line look up system (http://www.aoec.org/aoeccode.htm).
Monitoring data on pesticides in California’s water supplies or air(from spray drift) is far from comprehensive. But the little weknow suggests strongly that exposure and consequent healthcosts are significant. For example, a study by the US Geological
Survey (1998) of domestic groundwater wells in the San Joaquin-Tulare Basin found at least one pesticide in 59 of 100samples, and at least three pesticides in 29 samples. CaliforniaDepartment of Health Services records showed 79 sites in TulareCounty, 40 in Fresno County, 25 in Orange County, and 20 in LosAngeles County as containing pesticides at levels that exceededEPA cancer levels (Heavner, 1999).
Every honest review of the evidence concludes that there aresubstantial costs associated with pesticide use other than thecost of purchase. The size of those costs is the only question.Suppose, for comparison with the policies suggested in thisreport, that 1% of the health costs above were pesticide-related.This would amount to $620 million per year of total health carespending for Californians aged 0-64; $330 million per year ofMedi-Cal expenses; $53 million per year of county spending forhealth care; or $30 million per year of emergency room expenses.Even the least of these is significantly more over time than thecost of the policies discussed in this report ($31 million per year,for only three years; see subsequent discussion). The potentialhealth benefits alone justify serious consideration of innovationsin pesticide policy in California.
Some of the other impacts that may affect government budgetsare emergency response costs, monitoring costs, loss of fish andbirds and associated license revenues, and loss of beneficialinsects and pollinators (which reduce crop income, and thusincome and sales tax revenues). A comprehensive examination ofthe potential budget implications of reduced pesticide use inCalifornia has not been done, but would be worthwhile, perhapsas part of the annual budget process.
Box 2: Pesticide Use and Government Budgets: Potential Impacts
(Pimentel, 1997) found there are two dollars of cost to society for each dollar spent by farmers topurchase pesticides. These “external costs” includemedical expenses and harms to businesses thatdepend on natural systems (e.g., fishing, recreation,and tourism). Since Californian’s spend about $1.7billion per year for pesticides, external costs are possibly in excess of $3 billion per year.13
Realistically, these external costs cannot be fullyinternalized by increasing pesticide prices. One wouldneed to double or triple the price of pesticides, whichis neither economically nor politically feasible.Furthermore, it is not possible to conclusively connect
12 Pesticide Regulation: Safe Standards Versus Use-Reduction
How large is the
opportunity to cost-effectively
reduce pesticide use in
California agriculture?

Investing in Clean Agriculture: How California Can Strengthen Agriculture, Reduce Pollution and Save Money 13
pesticide use with line item budget expenditures. Butwe can recognize that the social costs of pesticide usewill decline if pesticide use declines, and that some ofthese social costs are paid for via government budgets.Some examples of the possible magnitude of budgetaryimpacts are provided in Box 2. Like the prison recidi-vism example in footnote 10, there are policy choicesthat have long-term impacts on budgets, even thoughquantifying those impacts is not possible at present.
Opportunities for Change,Opportunities for Profit
All farmers can reduce pesticide use, but doing so is economically desirable from their perspective only when the net reduction in expenses plus pricepremiums for products is greater than the value oflosses in yield. A large body of peer-reviewedresearch based on field trials shows that lower pesticide input practices — including but not limited to organic practices — can be as or evenmore profitable than business as usual.15
For example, Zalom (1997) provides historical exam-ples of integrated pest management (IPM) techniquesto reduce insecticide use in fruit crops that were verybeneficial economically. These include control of redscale on citrus in California that costs 80% less thansimilar levels of control using organophosphatechemicals alone, control of spider mites in orchardsfor 50-66% less than that of previous practices, andannual returns on investment from IPM research foralmonds of between 500 and 600%.
Research at the University of California at Davisdemonstrated this point for other crops in theCalifornia setting (Klonsky and Livingston, 1994).The Davis researchers compared four cropping systems over four years for five crops: tomatoes, safflower, corn, winter grains, and beans. At premiumprices for organic products, the organic system wassignificantly more profitable for tomatoes, corn, andbeans. At conventional prices for all products, cornwas most profitable in a low-input system16, andbeans were still most profitable in the organic system.Winter grains were profitable only in the low-inputsystem; that is, conventional and organic practicesfor growing winter grain created net losses.
The challenge to California farmers is nicely stated in a pamphlet prepared by Iowa State University:“Eight Ways to Reduce Pesticide Use” (Wintersteen,et. al., 1999). The pamphlet provides examples ofreductions in pesticide use that increased profits onIowa farms, and summarizes the theme that runsthrough the success stories:
Profit margins vary widely in farming. The key is to think in terms of net return, rather thanmaximizing yield. For example, a $5,000 insecticide application that results in a $3,500increase in yield amounts to a $1,500 loss in profits. When commodity prices change, farminput use has to be reconsidered. Because pricesvary over time, it is important to reevaluate pestmanagement at least yearly. … Using a $50sledgehammer when a $5 hammer will do isunnecessary and unprofitable. It takes an independent manger to use a hammer when the neighbors are using sledgehammers, but a profitable balance sheet is persuasive in the end. (p. 1)
15 In addition to the examples provided in the text, see Reichelderfer (1981 and 1985); Cate and Hinkle (1993); Ikerd, Monson, and Van Dyne (1993); Diebel, Williams, and
Llewelyn (1995); Hanson, Lichtenberg, and Peters (1997); Schillhorn van Veen, et. al. (1997); Srivastava, Smith and Forno (1999); USDA (2001); and
www.sustainablecotton.org/BASIC.
16 Low input is less than common practice, but not organic. See Klonsky and Livingston (1994) for details.
Even if the potential
for cost-effective reductions
in pesticide use is large,
uncertainty about new
technologies and practices
is a very real obstacle
to change.

Maximizing net return is more information-intensivethan maximizing yield. It requires that applicationsof chemical controls be made based on factors otherthan time of year or stage of crop development orcontract requirements that say one has to spray atspecified intervals (e.g., every month). Maximizingreturn requires that controls should be used whenmonitoring or other site-specific knowledge indicatesthat a pest is present or will soon be present at levelsthat will cost the farmer more in lost yield than the cost of control. Farmers who don’t have thisknowledge will tend to overuse pesticides. For example, several studies show that farmers whodepend on the advice of pest advisors who also sellpesticides use 25-50% more pesticides than farmerswho do not (Box 3).–
17 Hall and Moffitt (2002) report that the Director of the California Department of Food and Agriculture worked with the California legislature in 1980-1981 on a policy to
summarize the already-required written reports of pest control advisors by commodity and to offer the summaries to growers to aid in their choice of advisors. A bill to this
effect was introduced but defeated.
14 Pesticide Regulation: Safe Standards Versus Use-Reduction
Robert Van den Bosch (1978), one of the entomologists whohelped to invent the techniques we now call Integrated PestManagement (IPM), believed that pest control advisors should beprohibited from having a financial interest in the sale of pesticides, just as medical doctors are licensed separately from pharmacists because an inherent conflict of interest exists between the function of prescribing medicines and selling them.
His concerns have been supported by empirical studies such as those of Hall (1977), Burrows (1983), Hall and Duncan (1984),and Wiebers, et. al. (2002). The first three studies found thatfarmers who depended on advice from independent pest management consultants used about 50% less pesticides,experienced slight reductions in yield, and were as profitable as farmers who relied on pesticide salesmen for advice.The last study found that tomato growers who relied on their own judgment spent 26% less (saving about $5.5 per acre) than growers who relied on the advice of pest advisors who also sell pesticides.
The study on tomatoes looked only at spending on insecticides to control fruit and army worm damage in late-season
processing tomatoes in California. This study is particularly relevant because the IPM Group of the University of California(1998) has developed procedures for control of these pests thatsignificantly reduce late-season insecticide use without a corresponding increase in worm damage.
The study shows that superior practices are not always adopted,and helps explain why that is so. One reason is incomplete growers’ knowledge, both actual and as perceived by pesticidesalesmen.
Nearly two decades ago, Pingali and Carlson (1985) showed that the level of fungicide and insecticide use is dependent onknowledge by growers. Weibers et. al. (2002) also find that “More pesticides are suggested for use on fields where growersare perceived to be less informed … Therefore, increasing theperception of grower education through improved training would help to reduce chemical pesticide use. Furthermore,such training is likely to increase the profitability of farmers …”(p. 97)
Box 3: Pesticide Overuse and Knowledge
If we want to maintain the
strength of the California
farm sector in the long run,
we need to get past the
usual political divides.

Investing in Clean Agriculture: How California Can Strengthen Agriculture, Reduce Pollution and Save Money 15
How Much Pesticide Use Reduction Is Cost-Effective?
How large is the opportunity to cost-effectivelyreduce pesticide use in California agriculture? Weknow the technical opportunity is large. For example,Zalom (1997) estimated that pesticide use for fivecrops in California (apples, grapes, oranges, pears,peaches) could be reduced from 10.4% (oranges) to22.6% (apples) if IPM techniques were fully appliedto all acres of these crops. He estimated a furtherreduction in use of approximately 33% was possibleif the most efficient application technology wereused. The total reduction potential amounted to 40-50% of use. This estimate, and others (Box 4),shows that although some California farmers haveimplemented resource-efficient, knowledge-intensivepest management practices,18 there are still manytechnical opportunities to reduce pesticide use.
But how much of this is cost-effective to implement?We know that some is, as the studies and examples in the previous section demonstrate. But we do nothave a comprehensive statewide estimate of the cost-effective potential for use reduction. We attempted to perform that assessment for some of the most pesticide intensive crops in California.19
Unfortunately, the attempt was not successfulbecause sufficient pesticide price data were not available. Fortunately, the data are available in principle. Appendix A describes the approach wetook to answering this very important question, the data problem we faced, and how it could be overcome by a relatively small commitment of staffresources at the California Department of PesticideRegulation (DPR).
Perceptions of Risk and Barriers to Change
Even if the potential for cost-effective reductions in pesticide use is large, uncertainty about new technologies and practices is a very real obstacle tochange. Risk-averse farmers will give up some profitin order to reduce the variability of net returns fromfarming (Headly, 1985; Tisdell et. al., 1984). Boschand Pease (2000) provide a thorough discussion andreference list for this issue.
Fernandez-Cornejo et. al. (1994) found that farmerswho adopted IPM practices were less risk averse than farmers who did not adopt. This is consistentwith a belief that IPM practices are more risky than conventional practices. But Hanemann andFarnsworth (1981) found that this belief existed primarily among farmers who had not used IPM;farmers familiar with IPM techniques believed theyinvolved less risk than conventional practices. Hencethe perception of risk is as important as the reality.Wiebers et. al. (2002) conclude: “Improved trainingcould also change the current perception of manygrowers that IPM qualitative techniques are riskincreasing. This would lead to increased IPM adoption and lower chemical pesticide use.”
18 Some growers have taken significant steps toward lower pesticide use practices. For example, Tanimura and Antle (the nation’s largest independent lettuce producer),
Driscoll (strawberries), Dole (almonds), Paramount Farms (citrus), Pavitch family farms (table grapes and raisins), and Fetzer, Frog’s Leap, and Frey Vineyards (wine) use all or
some of their acreage for organic production of premium products (Holmes, et. al., 2001). And Robert Mondavi and Gallo vineyards have reduced chemical inputs to cut
expenses and reduce liability.
19 Data on intensity of pesticide use by commodity are presented in Table 2 later in this report.
The Biologically Integrate Farming Systems (BIFS) Programof the University of California Sustainable AgriculturalResearch and Education Program (SAREP) was establishedin 1994. It was modeled on an almond project that SAREPparticipated in created by the Community Alliance WithFamily Farmers. That project found that almond yields fromorganic orchards could be comparable with those from conventional orchards. At least nine BIFS projects in nine different farming systems have been funded since 1995.
For example, a wine grape BIFS project involving 43 growersand 2,370 acres used intensive monitoring of weeds, pests,and beneficial insects to obtain a reduction in the proportionof BIFS vineyards sprayed for mites or leafhoppers from54% in 1996 to 28% in 1998. The percentage of acreagetreated with pre-emergence herbicides declined from 70%to 59%. Similarly, a BIFS prune project involving 877 experimental acres farmed by 33 prune growers found thatgrowers could eliminate wintertime sprays of diazinon — anorganophosphate insecticide routinely found in Californiarivers — without adverse effects on farming operations.And a BIFS apple project found that pheromone mating disruption for coddling moth on 311 acres in 11 appleorchards allowed a reduction in use of organophosphatesand carbamates of 59% and 92%, respectively. (Personalcommunication with Marco Barzman, SAREP coordinator,and www.sarep.ucdavis.edu).
Box 4: Some Examples of the Technical Potential for Use Reduction
Federal crop insurance requirements have reinforcedthe misperception that all lower pesticide use practices are more risky. The requirements deny payment of claims to farmers who do not implementall available measures to prevent losses. This canforce farmers to spray when they would not do so otherwise.
Commencing in 2003, however, the US RiskManagement Agency (RMA) waived this requirementfor growers who pay a 5% surcharge on their cropinsurance premiums (e.g., organic growers).Unfortunately, by imposing a surcharge, the RMA is demonstrating that it believes that growers who are cautious in their use of pesticides have a greaterchance of damage from pests than conventionalgrowers. This is demonstrably untrue for some commodities in some locations.
Factually, lower pesticide use practices can be moreor less risky than higher use practices depending onthe practice, the crop, its location, soil type, andother issues. Public policy that corrects inaccurateperceptions of risk through farmer education and on-farm demonstrations is likely to increase farmprofits and have the socially desirable side effect ofreducing pesticide use.
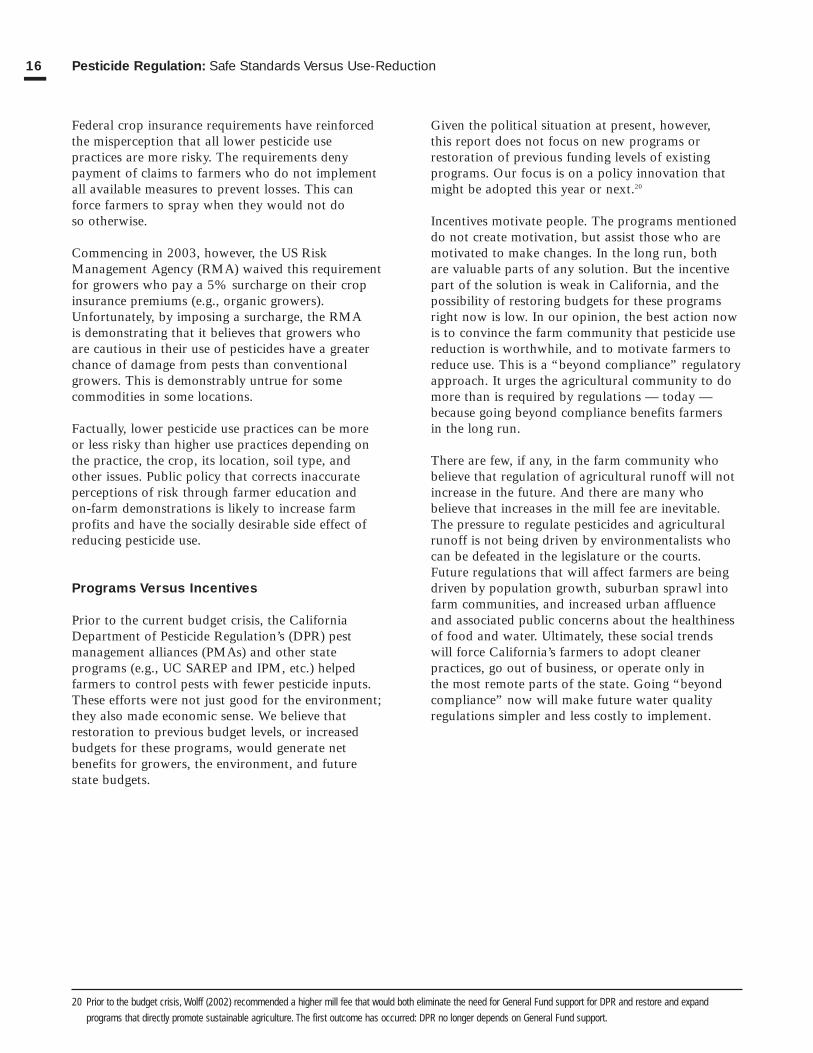
Programs Versus Incentives
Prior to the current budget crisis, the CaliforniaDepartment of Pesticide Regulation’s (DPR) pestmanagement alliances (PMAs) and other state programs (e.g., UC SAREP and IPM, etc.) helpedfarmers to control pests with fewer pesticide inputs.These efforts were not just good for the environment;they also made economic sense. We believe thatrestoration to previous budget levels, or increasedbudgets for these programs, would generate net benefits for growers, the environment, and futurestate budgets.
Given the political situation at present, however, this report does not focus on new programs orrestoration of previous funding levels of existing programs. Our focus is on a policy innovation thatmight be adopted this year or next.20
Incentives motivate people. The programs mentioneddo not create motivation, but assist those who aremotivated to make changes. In the long run, both are valuable parts of any solution. But the incentivepart of the solution is weak in California, and thepossibility of restoring budgets for these programsright now is low. In our opinion, the best action nowis to convince the farm community that pesticide usereduction is worthwhile, and to motivate farmers toreduce use. This is a “beyond compliance” regulatoryapproach. It urges the agricultural community to domore than is required by regulations — today —because going beyond compliance benefits farmers in the long run.
There are few, if any, in the farm community whobelieve that regulation of agricultural runoff will notincrease in the future. And there are many whobelieve that increases in the mill fee are inevitable.The pressure to regulate pesticides and agriculturalrunoff is not being driven by environmentalists whocan be defeated in the legislature or the courts.Future regulations that will affect farmers are beingdriven by population growth, suburban sprawl intofarm communities, and increased urban affluence and associated public concerns about the healthinessof food and water. Ultimately, these social trends will force California’s farmers to adopt cleaner practices, go out of business, or operate only in the most remote parts of the state. Going “beyondcompliance” now will make future water quality regulations simpler and less costly to implement.
20 Prior to the budget crisis, Wolff (2002) recommended a higher mill fee that would both eliminate the need for General Fund support for DPR and restore and expand
programs that directly promote sustainable agriculture. The first outcome has occurred: DPR no longer depends on General Fund support.
16 Pesticide Regulation: Safe Standards Versus Use-Reduction

OUR RECOMMENDATION
INCREASING THE PESTICIDE MILL FEE without a financial offset to the farm sector may not bepolitically feasible. The 21 mill fee21 authorization
that resulted from the fiscal year 2003-2004 budgetnegotiations shows how far away we are, politically,from the mill fees of 45 and 27 recommended bySenate and Assembly committees, respectively.Pesticide manufacturers and their sales associateswere able to derail these recommendations by arguing that the proposal would increase costs forfarmers and urban pesticide users.
Several countries, however, have overcome similar political hurdles by rebating revenue fromenvironmental or resource use fees in a way that offsets the average burden of the increased fee.22 A“refunded emissions payment” (Sterner, 1998) or“feebate” structure can create large incentives without burdening the economic sector paying thefees. This approach may convince farmers that theincreased fee will not burden them. In fact, becauseCalifornia’s mill fee applies to all pesticide use, not just agricultural use, this structure can return perhaps $2 to growers as a group for each $1 ofadditional fee.23, 24 An alternative policy that exemptsnonagricultural pesticide sales but has similar payments to farmers is described later in this report.
Here’s how it might work. First, increase the mill feeon all pesticides from 2.1% to 10% of wholesaleprices (i.e., from 21 to 100 mills), effective one yearafter legislation is adopted. The surcharge of 7.9%above the current level would sunset automaticallyfour years after legislation is adopted (i.e., it wouldbe in effect for only three years). This surchargewould probably raise $126 – $138 Million of additional revenue in its first year.25
Second, rebate most revenue (75-80%) to participatingfarmers as a percentage of gross revenue from cropsales, payable after income tax returns for the previous year are submitted. The actual percentage of gross revenue a farmer receives would depend onhow much revenue is raised each year, and howmany farmers participate that year.
Participation each year would require only twoactions by a farmer. First, they would need to attendan on-farm water quality and pest managementcourse modeled on the water quality courses offeredthrough the Farm Bureaus in the central coast regionof the state (see http://groups/ucanr.org/signup/index.cfm for details). El Dorado County is exploring asimilar program, and the Central Valley RegionalWater Quality Control Board is considering the possibility of using this type of course as a component in future agricultural runoff regulations.Our recommendation, however, has no regulatorycomponent. It would be a voluntary program to seehow much improvement participating farmers canachieve, and how many are willing to participate.Farmers have reportedly responded very positively to
Investing in Clean Agriculture: How California Can Strengthen Agriculture, Reduce Pollution and Save Money 17
21 A mill is 1/10 of a percent, so 21 mills is 2.1%. California’s fee on pesticides at their first point of sale within the state (in essence, a markup on wholesale rather than retail
prices) has a long history. See DPR (2003) for a thorough discussion.
22 Hall et. al. (1989) consider a wide range of policy options for pesticide-related problems and argue that pesticide fees or subsidies for low input or organic farming are the
best options overall, but due to competitiveness concerns have lower political feasibility. Rebating revenues appropriately is a policy variation developed in the 1990s
specifically to overcome the competitiveness objection.
23 DPR (2003) reports that about 50% of current pesticide fee revenues are from agricultural products. The definition of agriculture used to obtain this estimate, however, may
include revenues from sources other than production agriculture. Consequently, the 2:1 ratio is approximate, and might be too small.
24 Without the urban contribution that makes net gains for farmers possible, farmers are unlikely to support a fee increase with rebate unless this policy is the “lesser of policy
evils.” Despite their rhetoric about the advantages of market-based tools for environmental protection, industry groups rarely support these tools if a fee increase is involved.
See Wolff (2000) for a lengthier discussion. Fortunately, in this case, a net gain is possible and “worse evils,” in the form of future regulation of farm runoff, exist to motivate
the farm community to try this policy approach.
25 DPR (2003) states that each mill raises about $1.6 million; hence 79 additional mills would raise about $126 million. Calculations by the author, however, using actual
revenue since 1998, suggest that each mill might yield $1.7 million or so; hence 79 mills might raise about $138 million at first.
Going “beyond compliance”
now will make future water
quality regulations simpler
and less costly to implement.

the central coast program (personal communication,Jenny Derry, Executive Director, Santa Clara CountyFarm Bureau).
In these courses, farmers learn how to reduce pollut-ed runoff from their farms using a variety of tech-niques, including but not limited to lower pesticideapplication rates. The course curriculum would needto be reviewed by a wide range of stakeholders to besure the full range of options are presented, impar-tially. Farmers who take these types of courses alsocreate a confidential plan for their own farm, whichthey are expected to implement voluntarily aftercompleting the course. Farmers would need to attendthe course in each year they seek a rebate. Coursesafter the first year would need to be designed as sitevisits to see in the field what other farmers are doing,and to discuss with other farmers and various expertsimplementation obstacles and solutions.
Second, each participating farmer would need to fillout a one-page form — perhaps integrated with theirincome tax filing each year — providing the informa-tion required to issue a rebate check.
Not all revenue would be rebated, because there area few other expenses needed to make this programwork. One is administrative overhead. Based onSwedish experience with a similar system for reduc-ing emissions of nitrogen oxides from electric powerplants, overhead would consume less than 1% of rev-enue. The mill fee and income tax systems alreadyexist; this policy would not require new bureaucra-cies.
A more significant expense is payment for the on-farm courses. Based on experience in the centralcoast region — where the Farm Bureaus have workedin collaboration with UC Agricultural Extension staff— one could offer yearly courses to all farmers inCalifornia for $15 million per year or less.
Finally, it will cost up to another $15 million peryear to eliminate the perverse incentive in the federalcrop insurance program mentioned above. Currently,farmers are required to pay a 5% surcharge on theirinsurance premiums to avoid rejection of claimsbecause a farmer did not use “all available means” toprotect the crop. It would be desirable for the state topay the 5% “organic” surcharge for all participatingfarmers. This helps to offset the perception of risk
associated with lower pesticide use practices. Itwould also help the U.S. Risk Management Agencyto obtain data on the frequency and size of claims asa function of pesticide use practices.
Impacts on Growers
We evaluated the impacts of the fee and rebate proposal on the costs and returns from growingselected commodities (Table 2), assuming 80% offarmers participate. When cost and return study datafrom UC agricultural extension were available, weevaluated the most pesticide-intensive commoditiesidentified by Kegley et. al. (2000). We also evaluatedselected commodities with lower pesticide intensity.Seventeen of 22 (77%) of the commodities evaluatedare estimated to receive more money in rebates than they would pay in additional mill fee. Since the 22 crops evaluated are skewed toward the mostpesticide-intensive crops, the list shows that mostCalifornia farmers will get back more money inrebates than they pay in higher mill fees.
Net benefit after rebate (furthest column to the right)reflects a rebate of 0.64% of gross income (secondcolumn from the left) less the additional mill fee (second column from the right). Gross income andpre-reform pesticide costs per acre are fromUniversity of California cost and return studies located at http://www.agecon.ucdavis.edu/outreach/crop/cost.htm. The rebate per acre was estimated astotal revenue of $132 million less other costs ($15million insurance premium, $15 million of coursecosts, about $1 million for administration), divided
18 Our Recommendation
Most California farmers
will get back more money
in rebates than they pay
in higher mill fees.

Investing in Clean Agriculture: How California Can Strengthen Agriculture, Reduce Pollution and Save Money 19
by 80% of $19.7 billion of crop revenue in 2002(DOF, 2003), times gross income per acre. This is a rebate of 0.64% of gross income for the 80% offarmers assumed to participate.
The five crops estimated to have negative benefitshave low market value relative to the amount theyspend on pesticides. For example, pesticides arereported to be nearly 22% of the gross income ofcotton and nearly 14% of the gross income of pears.The dividing line, in this respect, is 8.2% of grossincome. That is, any farmer who spends less than8.2% of gross income on pesticides in any year of the program and participates in the water quality and pest management course would receive a rebatecheck larger than the additional mill fee he or shewould pay in that year. Since California farmers in2002 spent about 5.3% of gross farm income on pesticides on average (DOF, 2003), most farmers will benefit financially from the policy.
Overall, the system would have minimal or positivefinancial impact on the vast majority of Californiagrowers. This is possible because urban pesticideusers would pay around half of the increase in mill fee but would not receive rebates. But urbanusers would benefit from fewer pesticides in theirwater supplies and healthier natural systems throughout the state. These in turn create benefitssuch as clean drinking water, safe recreation, andstronger fishing and tourism industries, which havepositive health and economic ripple effects for urban users.
The impacts in Table 2 were calculated assuming that farmers do not change their pesticide use practices. This is a reasonable starting point foranalysis and also illustrates impacts on an “average”grower when pesticide use declines. However, pesticide use may decline under the policy, reducingrevenue from the additional mill fee and the rebate
26 Pesticide use data from DPR (2002); acres planted by commodity in 2002 from DOF (2003).
Strawberries, Conventional 140.27 $30,648 $1,562 $120.88 $74Strawberries, Organic Not Available $31,875 $628 $48.59 $154Pears 119.72 $5,682 $784 $60.70 -$25Carrots 82.44 $2,106 $221 $17.10 -$4Lemons 63.15 $6,840 $290 $22.44 $21Grapes, Table and Raisin 53.85 $2,550 $70 $5.42 $11Peaches 53.80 $4,620 $198 $15.32 $14Nectarines 49.59 $8,400 $347 $26.85 $27Grapes, Wine 47.51 $5,650 $193 $14.93 $21Watermelon 47.28 $5,515 $335 $25.92 $9Tomatoes, Processing 36.37 $1,802 $115 $8.89 $3Tomatoes, Fresh 25.18 $5,720 $132 $10.21 $26Almonds 20.88 $2,527 $268 $62.21 -$5Walnuts 11.66 $3,348 $187 $14.47 $7Rice 11.35 $640 $29 $2.24 $2Olives, Table 11.07 $2,125 $150 $11.61 $2Melons 9.82 $3,140 $235 $18.18 $2Cotton, Pima 9.30 $1,035 $224 $17.33 -$11Corn 4.85 $506 $13 $1.01 $2Wheat 0.92 $320 $3 $0.23 $2Pasture 0.45 $144 $7 $0.53 $0Alfalfa 0.24 $666 $64 $4.98 -$1
Table 2: Financial Benefit by Commodity Type, per Acre per Year (ranked by intensity of pesticide use)
Commodity Intensity Gross Pre-Reform Additional Net Benefitof Use26 Income Pesticide Cost Mill Fee After Rebate (lbs/ac/yr) ($/ac/yr) ($/ac/yr) ($/ac/yr) ($/ac/yr)

payments.27 These changes will approximately offsetone another for a grower whose pesticide spendingdeclines equal to the statewide average decline.Growers who reduce pesticide spending by more than average will do better financially than shown in the table; those who reduce pesticide spending less will do less well.
An Alternative Policy
As noted previously, some sellers of pesticides havesuggested they will sue the DPR because they believetoo much of current mill fee revenue is used to deliver services that primarily benefit agriculture. Alaw to increase the mill fee for all users but primarilyspend it to initiate change in the agricultural sectormight be challenged in court. There are three waysthis concern might play out over time. First, 2/3majorities in both the State Assembly and Senatecould authorize the increased mill fee, which wouldmake a legal challenge impossible. The basis for achallenge to the current or future mill fee is that it is not a fee, but a tax requiring approval by a supermajority.
Second, if majorities in the Assembly and Senate, butnot supermajorities, approved a policy such as thatabove, legal challenges to it may fail. The CaliforniaSupreme Court Sinclair Paint Decision (see Box 5) isclear that fees do not have to be levied in proportionto the benefits received by those who pay them. Theycan be levied as a general exercise of the police powers of the state, in order to regulate one or moreharms associated with use of a product. Spendingsupported by the fee must have a reasonable “nexus”with the activity upon which the fee is levied. Actionto reduce pesticide pollution of surface, ground, anddrinking water in the state seems to have a reasonablenexus with the activity of pesticide use. Nothing inthe case law suggests that a fee on one class of regulated parties (e.g., urban pesticide users) fails tohave a reasonable nexus with spending to change thebehavior of another class of regulated users (e.g.,farmers). Since at least 20 million urban Californiansobtain drinking water from sources affected by
agricultural runoff, actions of these classes of regulated parties are not at all independent.
Third, one could address the threat of litigation overa higher mill fee by implementing an alternative butsimilar policy. One could exempt urban pesticideusers from the higher mill fee and raise the funds lost
27 One way of estimating the reduction in use that will result from an increase in pesticide price is to assume that price elasticities estimated in other situations apply here. For
example, McIntosh and Williams (1992) and Capalbo and Vo (1998) estimated that the elasticity of pesticide use in agriculture was between -0.1 and -0.5. These numbers
imply that the 79 mill increase in fee proposed would lead to a reduction in pesticide use somewhere between about 0.8% and 4%. But such estimates are crude because
they do not account for the message, if any, that accompanies the price change. For example, the increase in mill fee from 9 to 22 in 1993 did not lead to any measurable
decline in pesticide use, possibly because the fee increase was for purely administrative purposes and not part of an effort to encourage use reduction. Opposite examples
are those in Denmark, Sweden, and Iowa described in Box 1, where use reductions were much larger than these elasticities would suggest, probably because fee increases
were part of widely publicized attempts to encourage use reduction.
28 The Chemical Specialty Manufacturers Association has been particularly vocal on this topic.
20 Our Recommendation
The California Legislature enacted the Childhood LeadPoisoning Prevention Act of 1991 (the Act) by a simplemajority. The Act provided evaluation, screening, and medically necessary follow-up services for children whowere deemed potential victims of lead poisoning. The Act’sprogram was entirely supported by fees assessed on manufacturers or other persons contributing to environmen-tal lead contamination. Those persons able to show thattheir industry did not contribute to environmental lead contamination, or that their lead-containing product does notand did not “result in quantifiably persistent environmentallead contamination,” are exempt from paying the fees.
The Sinclair Paint Company challenged the Act on theground that these fees were in legal effect taxes required tobe enacted by a two-thirds vote of the Legislature. TheCalifornia Supreme Court ruled unanimously against theSinclair Paint Company in June of 1997 (Opinion No.S054115). They cited case law that “clearly indicates thatthe police power is broad enough to include mandatoryremedial measures to mitigate the past, present, or futureadverse impact of the fee payer’s operations, at least where,as here, the measure requires a causal connection or nexusbetween the product and its adverse effects.” They furthernoted that Sinclair should be permitted to attempt to proveat (a subsequent) trial that the amount of fees exceeded thereasonable cost of providing the protective services forwhich the fees were charged, or to try to show that no clearnexus exists between its products and childhood lead poisoning, or that the amount of the fees bore no reasonablerelationship to the social or economic “burdens” its operations generated. Sinclair, however, apparently did notpursue the matter further.
Box 5: The Sinclair Paint Decision
Investing in Clean Agriculture: How California Can Strengthen Agriculture, Reduce Pollution and Save Money 21
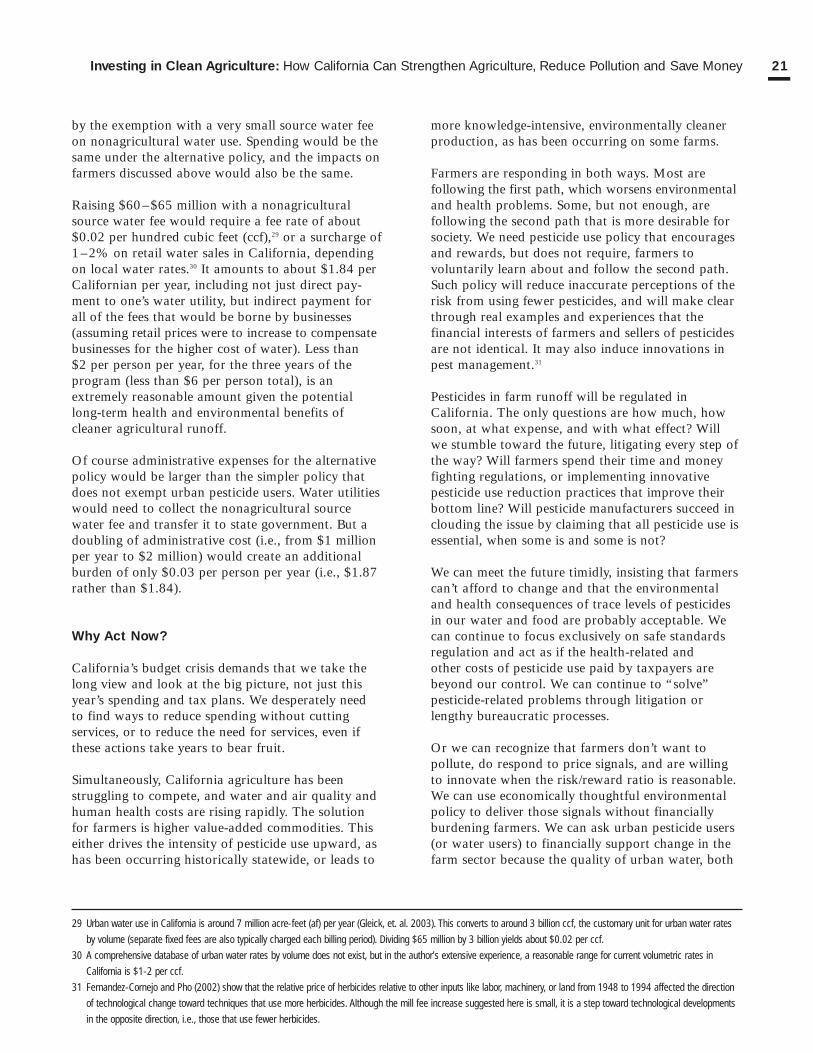
by the exemption with a very small source water feeon nonagricultural water use. Spending would be thesame under the alternative policy, and the impacts onfarmers discussed above would also be the same.
Raising $60–$65 million with a nonagriculturalsource water fee would require a fee rate of about$0.02 per hundred cubic feet (ccf),29 or a surcharge of1–2% on retail water sales in California, dependingon local water rates.30 It amounts to about $1.84 perCalifornian per year, including not just direct pay-ment to one’s water utility, but indirect payment forall of the fees that would be borne by businesses(assuming retail prices were to increase to compensatebusinesses for the higher cost of water). Less than $2 per person per year, for the three years of the program (less than $6 per person total), is anextremely reasonable amount given the potentiallong-term health and environmental benefits of cleaner agricultural runoff.
Of course administrative expenses for the alternativepolicy would be larger than the simpler policy thatdoes not exempt urban pesticide users. Water utilitieswould need to collect the nonagricultural sourcewater fee and transfer it to state government. But adoubling of administrative cost (i.e., from $1 millionper year to $2 million) would create an additionalburden of only $0.03 per person per year (i.e., $1.87rather than $1.84).
Why Act Now?
California’s budget crisis demands that we take thelong view and look at the big picture, not just thisyear’s spending and tax plans. We desperately need to find ways to reduce spending without cutting services, or to reduce the need for services, even ifthese actions take years to bear fruit.
Simultaneously, California agriculture has been struggling to compete, and water and air quality andhuman health costs are rising rapidly. The solutionfor farmers is higher value-added commodities. Thiseither drives the intensity of pesticide use upward, ashas been occurring historically statewide, or leads to
more knowledge-intensive, environmentally cleanerproduction, as has been occurring on some farms.
Farmers are responding in both ways. Most are following the first path, which worsens environmentaland health problems. Some, but not enough, are following the second path that is more desirable forsociety. We need pesticide use policy that encouragesand rewards, but does not require, farmers to voluntarily learn about and follow the second path.Such policy will reduce inaccurate perceptions of therisk from using fewer pesticides, and will make clearthrough real examples and experiences that the financial interests of farmers and sellers of pesticidesare not identical. It may also induce innovations inpest management.31
Pesticides in farm runoff will be regulated inCalifornia. The only questions are how much, howsoon, at what expense, and with what effect? Will we stumble toward the future, litigating every step ofthe way? Will farmers spend their time and moneyfighting regulations, or implementing innovative pesticide use reduction practices that improve theirbottom line? Will pesticide manufacturers succeed inclouding the issue by claiming that all pesticide use isessential, when some is and some is not?
We can meet the future timidly, insisting that farmerscan’t afford to change and that the environmentaland health consequences of trace levels of pesticidesin our water and food are probably acceptable. Wecan continue to focus exclusively on safe standardsregulation and act as if the health-related and other costs of pesticide use paid by taxpayers arebeyond our control. We can continue to “solve” pesticide-related problems through litigation orlengthy bureaucratic processes.
Or we can recognize that farmers don’t want to pollute, do respond to price signals, and are willingto innovate when the risk/reward ratio is reasonable.We can use economically thoughtful environmentalpolicy to deliver those signals without financiallyburdening farmers. We can ask urban pesticide users(or water users) to financially support change in thefarm sector because the quality of urban water, both
29 Urban water use in California is around 7 million acre-feet (af) per year (Gleick, et. al. 2003). This converts to around 3 billion ccf, the customary unit for urban water rates
by volume (separate fixed fees are also typically charged each billing period). Dividing $65 million by 3 billion yields about $0.02 per ccf.
30 A comprehensive database of urban water rates by volume does not exist, but in the author’s extensive experience, a reasonable range for current volumetric rates in
California is $1-2 per ccf.
31 Fernandez-Cornejo and Pho (2002) show that the relative price of herbicides relative to other inputs like labor, machinery, or land from 1948 to 1994 affected the direction
of technological change toward techniques that use more herbicides. Although the mill fee increase suggested here is small, it is a step toward technological developments
in the opposite direction, i.e., those that use fewer herbicides.

potable and ambient, will improve. We can complement the safe standards approach with a use reduction approach that lowers the risk of water pollution and health problems. And by doing thesethings we can reduce the long-term, difficult-to-quantify budget burden created by pesticide overuse,while strengthening the California farm economy.
Once the courts have imposed more stringent regulations on pesticide runoff from farms, it will be far tougher and more expensive to takeaction. Once the California Performance Review recommendations have been adopted or rejected, significant government reforms will be a lower priority. Our proposal, which uses a temporary, higher mill fee to fund incentives for farmers whovoluntarily put into place pesticide use reduction and runoff management techniques, is good for theeconomy, public health, and the environment. Thetime to act is now.
22 Our Recommendation
We can continue to “solve”
pesticide-related problems
through litigation or lengthy
bureaucratic processes—
or we can innovate.

Investing in Clean Agriculture: How California Can Strengthen Agriculture, Reduce Pollution and Save Money 23
REFERENCES
Bosch, Darrell J. and James W. Pease. 2000.Economic risk and water quality protection in agriculture. Review of agricultural economics. 22 (2):438-63.
Burrows, T.M. 1983. Pesticide demand and integrated pest management: a limited dependentvariable analysis. American Journal of AgriculturalEconomics. 65:806-810.
Capalbo, S.M. and T.T.Vo. 1998. A review of the evidence on agricultural productivity and aggregatetechnology. Agricultural productivity: measurementand explanation. Resources for the Future:Washington.
Cate, J.R. and M.K. Hinkle. 1993. Integrated pestmanagement: the path of a paradigm. NationalAudubon Society: Washington.
CICG. 2003. California County Fact Book, SpecialHealth Section. California Institute for CountyGovernment and the California Association ofCounties: Sacramento.
Diebel, Penelope, Jeffery Williams, and RichardLlewelyn. 1995. An economic comparison of conventional and alternative cropping systems for arepresentative northeast Kansas farm. Review ofAgricultural Economics. 323:35.
Department of Finance (DOF). 2004. State BudgetHighlights 2004-05. California Department ofFinance: Sacramento.
Department of Finance (DOF). 2003. CaliforniaStatistical Abstract. California Department ofFinance: Sacramento.
Department of Finance (DOF). 2000. CaliforniaStatistical Abstract. California Department ofFinance: Sacramento.
Department of Pesticide Regulation (DPR). 2003.Funding California’s pesticide regulatory program.California Department of Pesticide Regulation:Sacramento.
Fernandez-Cornejo, J., E.D. Beach and W.Y. Huang.1994. The adoption of integrated pest managementtechnologies by vegetable growers in Florida,Michigan, and Texas. Journal of Agricultural AppliedEconomics. 26(1):158-72.
Fernandez-Cornejo, Jorge and Yvon Pho. 2002.“Induced innovation and the economics of herbicideuse.” In Economics of pesticides, sustainable foodproduction, and organic food markets, edited byHall, Darwin C. and L. Joe Moffitt. Elsevier: Oxford.
Gleick, Peter, Dana Haasz, Christine Henges-Jeck,Veena Srinivasan, Gary Wolff, Kathering KaoCushing, and Amardip Mann. 2003. Waste Not,Want Not: The Potential for Urban WaterConservation in California. Pacific Institute:Oakland.
Hanson, James, Erik Lichtenberg, and Steven Peters.1997. Organic versus conventional grain productionin the Mid-Atlantic: an economic and arming systemoverview. American Journal of AlternativeAgriculture. 1.
Hall, Darwin C. 1977. The profitability of integratedpest management: case studies for cotton and citrusin the San Joaquin Valley. Bulletin of theEntomological Society of America. 23(4):267-74.
Hall, Darwin C., and G.M. Duncan. 1984.Econometric evaluation of new technology with anapplication to integrated pest management. AmericanJournal of Agriculture Economics. 66(5):624-633.
Hall, Darwin C., B. Baker, J. Franco, and D.A. Jolly.1989. Organic food and sustainable agriculture.Contemporary Policy Issues. 7(4):47-72.
Hall, Darwin C., and L. Joe Moffitt. 2002.“Adoption and diffusion of sustainable food technology and policy.” In Economics of pesticides,sustainable food production, and organic food markets, edited by Hall, Darwin C. and L. JoeMoffitt. Elsevier: Oxford.
Hanemann, W.M. and R.L.Farnsworth. 1981. Therole of risk preference and perceptions in the adop-tion of integrated pest management. Unpublishedmanuscript. University of California at BerkeleyDepartment of Agricultural and Resource Economics.
Hartzler, Robert, Wendy Wintersteen, and BrentPringnitz. 1997. A survey of pesticides used in Iowacrop production in 1995. Iowa State University:Ames, Iowa.
Holmes, H., J. Kelly, B. Meister, and A. Thrupp.2001. Roots of change: agriculture, ecology, andhealth in California. Funders Agriculture WorkingGroup: San Francisco.

Headly, J.C. 1985. Cost-benefit analysis: definingresearch needs. Hoy, M.A., and D.C. Herzog, editors,Biological control in agricultural IPM systems.Academic Press: New York.
Heavner, Brad. 1999. Toxics on Tap: Pesticides inCalifornia Drinking Water Sources. California PublicInterest Group: San Francisco.
Ikerd, John, Sandra Monson, and Donald Van Dyne.1993. Alternative farming systems for US agriculture:new estimates of profit and environmental effects.Choices Magazine.
Kegley, Susan, L. Neumeister, and T. Martin. 1999.Disrupting the balance. Pesticide Action Network ofNorth America: San Francisco.
Kegley, Susan, S. Orme, and L. Neumeister. 2000.Hooked on poison: pesticide use in California 1991-1998. Pesticide Action Network of North America:San Francisco.
Kegley, Susan, Anne Katten, and Marion Moses.2003. Secondhand pesticides, airborne pesticide driftin California. Pesticide Action Network of NorthAmerica: San Francisco.
Klonsky, Karen and Peter Livingston. 1994.Alternative systems aim to reduce inputs, maintainprofits. California Agriculture. 5.
Kominski, Gerald F. and Dylan H. Roby. 2004.Estimating the Cost of Caring for California’sUninsured. UCLA Center for Health Policy Research:Los Angeles.
Ministry of the Environment. 2001. Nature and environment, selected indicators. Denmark’s Ministryof the Environment: Copenhagen.
McIntosh, C.S., and A.A. Williams. 1992.Multiproduct production choices and pesticide regulation in Georgia. Southern Journal ofAgricultural Economics. July:135-44.
Mullen, John D., Julian M. Alston, Daniel A.Sumner, Marcia T. Kreith, and Nicolai V. Kuminoff.2003. Returns to University of California pest man-agement and extension: overview and case studiesemphasizing IPM. Agricultural Issues Center ANRPublication. 3482. University of California: Davis.
National Research Council (NRC). 1996.Ecologically based pest management: new solutionsfor a new century. National Academy Press:Washington.
National Research Council (NRC). 1989. Alternativeagriculture. National Academy Press: Washington.
Pettersson, Olle. 1997. “Pesticide use in Swedishagriculture: the case of a 75% reduction.” InTechniques for reducing pesticide use: economic andenvironmental benefits, edited by David Pimentel.Wiley & Sons: New York.
Pimentel, David, and Anthony Greiner. 1997.“Environmental and socio-economic costs of pesti-cide use.” In Techniques for reducing pesticide use:economic and environmental benefits, edited byDavid Pimentel. Wiley & Sons: New York.
Pingali, P.L. and G.A. Carlson. 1985. Human capital,adjustments in subjective probability, and thedemand for pest controls. American Journal ofAgricultural Economics. 57:853-861.
Reichelderfer, K.H. 1981. “Economic feasibility ofbiological control of pests” In Biological control incrop production, edited by G.C. Papvizes. AllanheldOsmun: New York.
Reichelderfer, K.H. 1985. “Factors affecting the economic feasibility of the biological control ofweeds.” In Proceedings of the VI InternationalSymposium on biological control of weeds, 19-25August, Vancouver Canada, edited by E.S. Delfosse.Agriculture Canada: Ottawa.
Robert Van den Bosch. 1978. The pesticide conspira-cy. Doubleday & Company: Garden City, New York.
Schillhorn van Veen, T.W., D.A. Forno, S. Joffe, D.L.Umali-Denigner, and S. Cooke. 1997. Integrated pestmanagement: strategies and policies for effectiveimplementation. World Bank: Washington.
Solomon, Gina. 2000. Pesticides and Human Health:a Resource for Health Care Professionals. Physiciansfor Social Responsibility: Berkeley; and Californiansfor Pesticide Reform: San Francisco.
Srivastava, J.P., N.J.H. Smith, and D.A. Forno. 1999.Integrating biodiversity in agricultural intensification.World Bank: Washington.
24 References

Investing in Clean Agriculture: How California Can Strengthen Agriculture, Reduce Pollution and Save Money 25
Tisdell, C.A., B.A. Auld, and K.M. Menz. 1984. Onassessing the value of biological control of weeds.Protection Ecology. 6:169-79.
Solomon, Gina. 2000. Pesticides and human health: aresource for health care professionals. Physicians forSocial Responsibility and Californians for PesticideReform: Berkeley
Sterner, Thomas, and Lena Hoglund. 1998. Refundedemissions payments – a hybrid instrument with someattractive properties. Resources for the Future:Washington.
Sunding, David, and Joshua Zivin. 2002. “A compar-ison of policies to reduce pesticide poisoning combin-ing economic and toxicological data.” In Economicsof pesticides, sustainable food production, and organ-ic food markets, edited by Hall, Darwin C. and L.Joe Moffitt. Elsevier: Oxford.
Swezey, Sean L. and Janet C. Broome. 2000. Growthpredicted in biologically integrated and organic farming. California Agriculture. 4:26-35.
University of California Integrated Pest ManagementProgram (UCIPM). 1998. Integrated pest manage-ment for tomatoes. UCIPM: Davis.
US Census of Agriculture. 2002. US Department ofAgriculture: Washington.
US Census of Agriculture. 1997. US Department ofAgriculture: Washington.
US Department of Agriculture (USDA). 2001. Thenew American farmer: profiles of agricultural innovation. USDA: Washington.
Wiebers, Uwe-Carsten, Mark Metcalfe, and DavidZilberman. 2002. “The influence of pest managementadvice on pesticide use in California tomatoes.” InEconomics of pesticides, sustainable food production,and organic food markets, edited by Hall, Darwin C.and L. Joe Moffitt. Elsevier: Oxford.
Wintersteen, Wendy, Robert Hartzler, DianeMayerfield, Richard Pope, Marlin Rice, and JanisImel. 1999. Eight ways to reduce pesticide use: exam-ples from Iowa farms. Iowa State University: Ames,Iowa.
Wolff, Gary. 2000. When will business want environmental taxes? Redefining Progress: Oakland.Available at www.rprogress.org.
Wolff, Gary. 2002. Healthy, fair, and profitable: howhigher pesticide fees can improve our health, environ-ment, and economy. The Pacific Institute: Oakland.
Zalom, Frank. 1997. “IPM practices for reducinginsecticide use in US fruit crops.” In Techniques forreducing pesticide use: economic and environmentalbenefits, edited by David Pimentel. Wiley & Sons:New York.

26 Appendix A
APPENDIX A: ASSESSING THE STATEWIDE POTENTIAL TO REDUCE PESTICIDE USE AND INCREASE PROFITABILITYIN CALIFORNIA AGRICULTURE
THE PHYSICAL QUANTITIES OF ACTIVE INGREDIENTS
(A.I.s) of pesticides used each year on eachcrop in each county in California are available
through the pesticide use reporting system managedby DPR and the County Agricultural Commissioners.These quantities are reported in pounds of A.I.s. One could calculate expenditures for pesticides bycommodity by county and year if one had either: 1)prices of pesticide products each year, by weight orvolume, or 2) implicit prices paid by farmers for eachof the reported A.I.s, by weight. The first data can beconverted to prices paid for A.I.s by weight, usingproduct formulation data that are available. Thiswould give the second type of data. Multiplying theseimplicit prices for A.I.s by the reported quantitieswould yield wholesale expenditures on pesticides byA.I. for each commodity in each county in California.
From the expenditure data, one could assess howactual pest management practices by commodity,county, and year compare with practices recommendedby unbiased, third-party experts in pest management(see below). When actual practices are significantlyworse than these practices, farmers can improve profitability AND reduce pesticide use. A quantitativeestimate of this potential is critical information forpesticide policy-makers in California, and is withinour intellectual reach as described below.
The University of California agricultural extensionservice has routinely prepared cost and return studiesby commodity and county for decades.32 These studies show prospective growers of commodities inthose locales the costs and returns (i.e., gross and net revenue) they are likely to experience if they grow those crops in that setting. The studies are forward-looking in that they estimate costs andreturns for the coming year (to help farmers plan),but the studies are based on actual experience in past years.
One can extract from the cost and return studies the absolute dollars and the share of gross revenuethat are likely to be spent on pesticides for each
commodity, by county and year. These economic data reflect knowledgeable assessments of goodgrowing practices. They may not reflect best practices, because that is not the intention of most of the studies (some cost and return studies focus on specific types of practices; e.g., organic). They alsoprobably do not reflect average actual practices,because the agricultural advisors have not been askedto survey farmers and create averages. Instead, theyare asked to tell farmers what a knowledgeablefarmer’s costs and returns might reasonably be.
Consequently, a comparison of pesticide spending in the cost and return studies with actual pesticidespending, by commodity, county, and year shouldhelp us to quantify a minimum for how much cost-effective reduction in pesticide use is possible.We say “a minimum” because the cost and returnstudies may not represent best practices. Put another way, if the cost and return studies reflectknowledgeable practices, and if actual practice lags behind such practices, as the cited studiesdemonstrate, this method will quantify the size of the lag.
Unfortunately, price data were not available for allthe active ingredients reported as actually used onpesticide-intensive crops in California. The industry is competitive, and pesticide costs are usually bundled by licensed pest control advisors (PCAs)with application and advice costs. Despite numerousphone and e-mail inquiries to private, governmental,academic, and nonprofit sources, the only consistentset of price data found was a summary of prices usedin the agricultural extension cost and return studies(Mullen et. al., 2003). That dataset, however, coveredonly about 60 active ingredients of the 900 or soactive ingredients registered for use in California. Wecouldn’t, therefore, estimate actual pesticide spendingon strawberries, for example, in Monterey County in2001 for comparison with the spending shown in thecost and return study for strawberries in MontereyCounty in 2001, because actual use involved morethan twice as many active ingredients as shown in thecost and return study.
But in principle, the missing price data are availableso long as pesticide prices don’t differ much fromcounty to county. The DPR maintains records of millfee receipts by active ingredient. One can tallyreceipts in any year and divide by the mill fee percent
Investing in Clean Agriculture: How California Can Strengthen Agriculture, Reduce Pollution and Save Money 27
32 The studies do not address every commodity in every county every year.
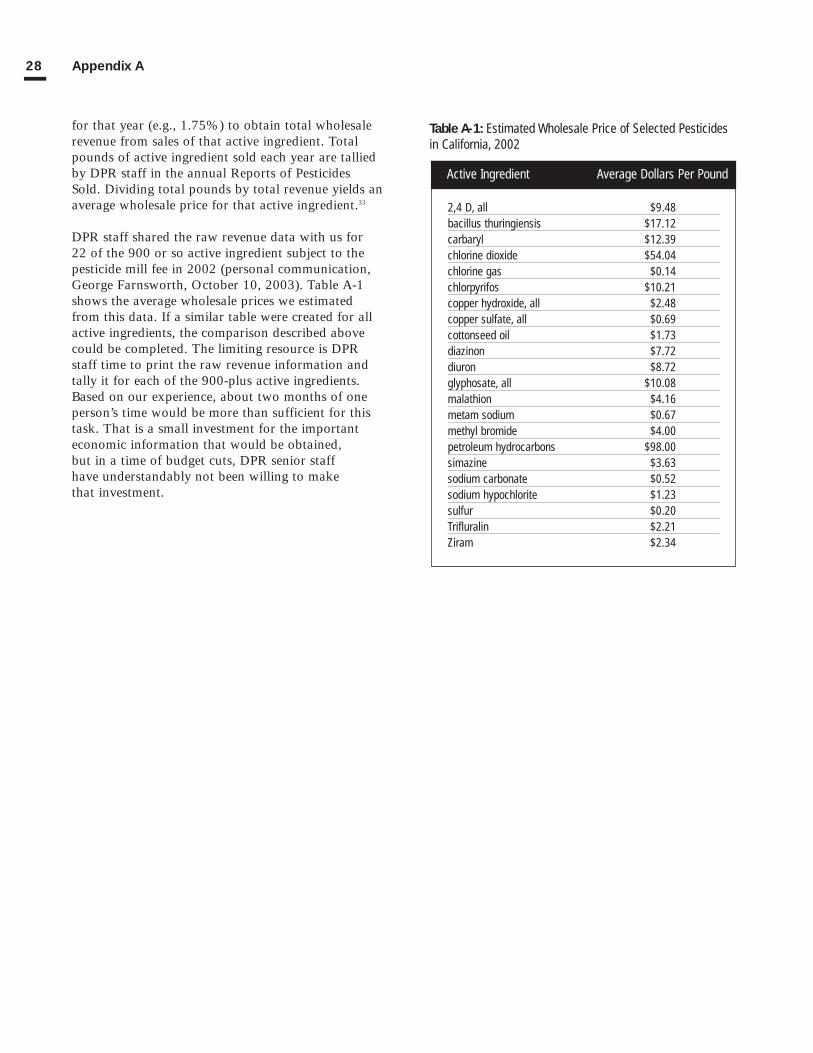
2,4 D, all $9.48bacillus thuringiensis $17.12carbaryl $12.39chlorine dioxide $54.04chlorine gas $0.14chlorpyrifos $10.21copper hydroxide, all $2.48copper sulfate, all $0.69cottonseed oil $1.73diazinon $7.72diuron $8.72glyphosate, all $10.08malathion $4.16metam sodium $0.67methyl bromide $4.00petroleum hydrocarbons $98.00simazine $3.63sodium carbonate $0.52sodium hypochlorite $1.23sulfur $0.20Trifluralin $2.21Ziram $2.34
Active Ingredient Average Dollars Per Pound
Table A-1: Estimated Wholesale Price of Selected Pesticides in California, 2002
28 Appendix A
for that year (e.g., 1.75%) to obtain total wholesalerevenue from sales of that active ingredient. Totalpounds of active ingredient sold each year are talliedby DPR staff in the annual Reports of PesticidesSold. Dividing total pounds by total revenue yields anaverage wholesale price for that active ingredient.33
DPR staff shared the raw revenue data with us for 22 of the 900 or so active ingredient subject to thepesticide mill fee in 2002 (personal communication,George Farnsworth, October 10, 2003). Table A-1shows the average wholesale prices we estimatedfrom this data. If a similar table were created for allactive ingredients, the comparison described abovecould be completed. The limiting resource is DPRstaff time to print the raw revenue information andtally it for each of the 900-plus active ingredients.Based on our experience, about two months of oneperson’s time would be more than sufficient for thistask. That is a small investment for the importanteconomic information that would be obtained, but in a time of budget cuts, DPR senior staff have understandably not been willing to make that investment.

654 13th Street, Preservation Park, Oakland, California 94612telephone 510-251-1600 • telefax 510-251-2203www.pacinst.org