investigations into schumpeterian economic behaviour using swarm craig lynch macquarie university...
TRANSCRIPT
Investigations into Investigations into Schumpeterian Economic Schumpeterian Economic Behaviour using SwarmBehaviour using Swarm
Craig LynchCraig Lynch
Macquarie University (Graduate School of Management)Macquarie University (Graduate School of Management)Sydney, AustraliaSydney, Australia
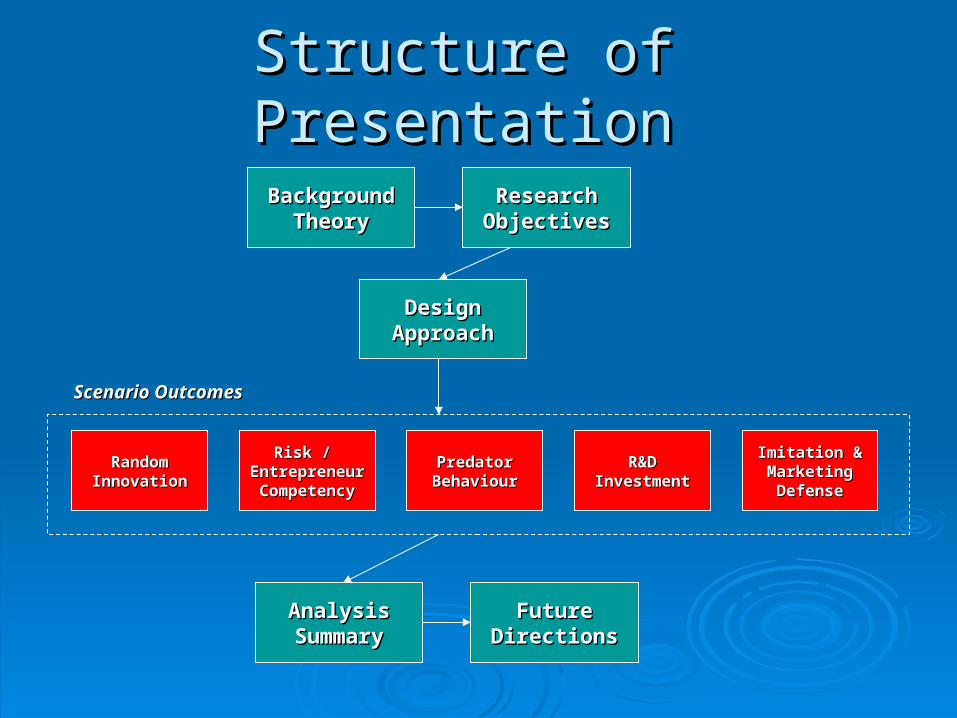
Structure of PresentationStructure of Presentation
BackgroundBackgroundTheoryTheory
ResearchResearchObjectivesObjectives
DesignDesignApproachApproach
RandomRandomInnovationInnovation
Risk / Risk / EntrepreneurEntrepreneurCompetencyCompetency
PredatorPredatorBehaviourBehaviour
R&DR&DInvestmentInvestment
Imitation &Imitation &MarketingMarketingDefenseDefense
Scenario OutcomesScenario Outcomes
AnalysisAnalysisSummarySummary
FutureFutureDirectionsDirections
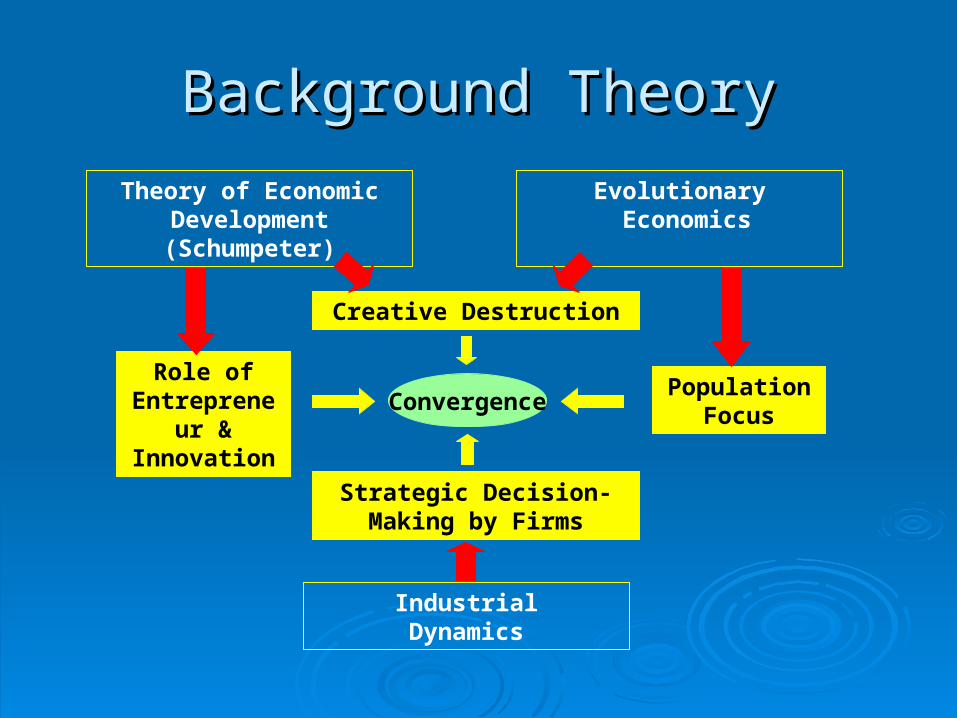
Background TheoryBackground Theory
Theory of Economic Development (Schumpeter)
Evolutionary Economics
IndustrialDynamics
Creative Destruction
Strategic Decision-Making by Firms
Role of Entrepreneur & Innovation
Population Focus
Convergence
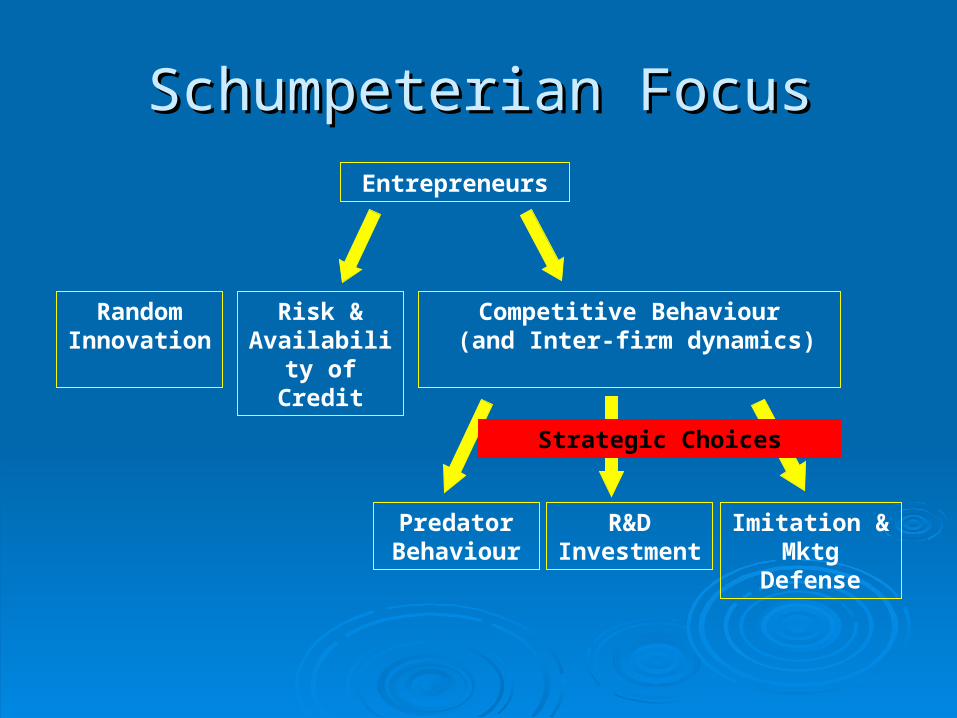
Schumpeterian FocusSchumpeterian FocusEntrepreneurs
Random Innovation
Risk & Availability
of Credit
Competitive Behaviour (and Inter-firm dynamics)
Predator Behaviour
R&D Investment
Imitation & Mktg Defense
Strategic Choices
Research ObjectivesResearch Objectives Explore economic and competitive behavioural concepts (identifying Explore economic and competitive behavioural concepts (identifying
optimum conditions) for:optimum conditions) for:
1.1. Random innovation within firmsRandom innovation within firms
2.2. Availability of credit and differentiation of supply to entrepreneurial Availability of credit and differentiation of supply to entrepreneurial candidatescandidates
3.3. Predator behaviour amongst firmsPredator behaviour amongst firms
4.4. Innovation investment and firm growthInnovation investment and firm growth
5.5. Imitation and marketing defence investments associated with firm Imitation and marketing defence investments associated with firm growth and survivalgrowth and survival
1.1. NOTENOTE: “Optimum conditions” represents maximum GDP at economy : “Optimum conditions” represents maximum GDP at economy level, numbers of firms, profit levels, and persistence of profit (Roberts level, numbers of firms, profit levels, and persistence of profit (Roberts 2001)2001)
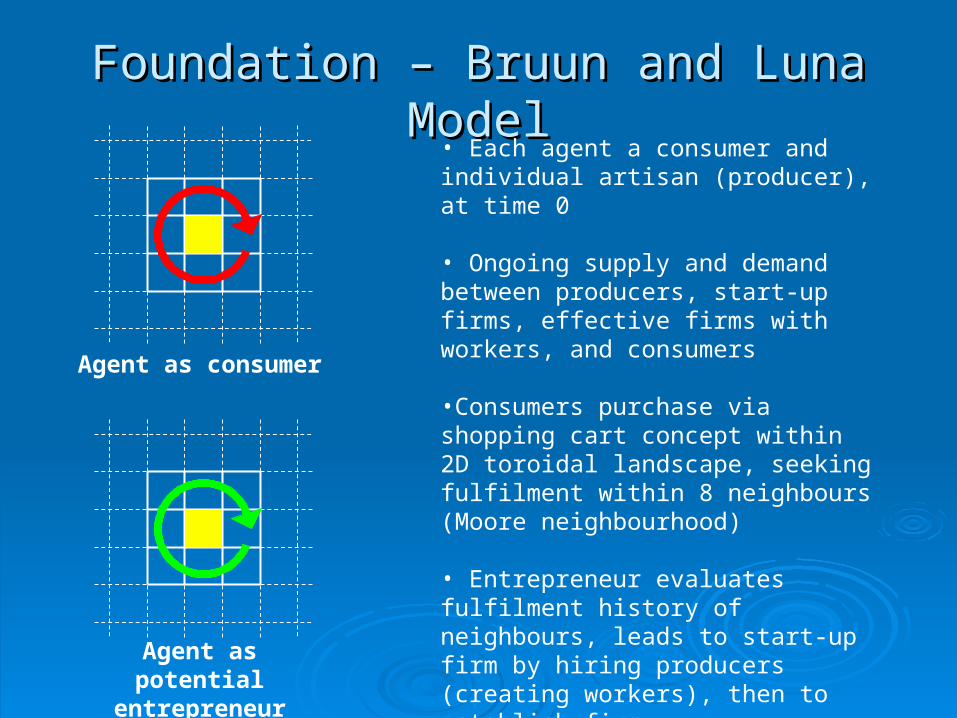
Foundation – Bruun and Luna ModelFoundation – Bruun and Luna Model• Each agent a consumer and individual artisan (producer), at time 0
• Ongoing supply and demand between producers, start-up firms, effective firms with workers, and consumers
•Consumers purchase via shopping cart concept within 2D toroidal landscape, seeking fulfilment within 8 neighbours (Moore neighbourhood)
• Entrepreneur evaluates fulfilment history of neighbours, leads to start-up firm by hiring producers (creating workers), then to establish firm
•Account maintained for all agents, used in bankruptcy business rule
Agent as consumer
Agent as potential entrepreneur
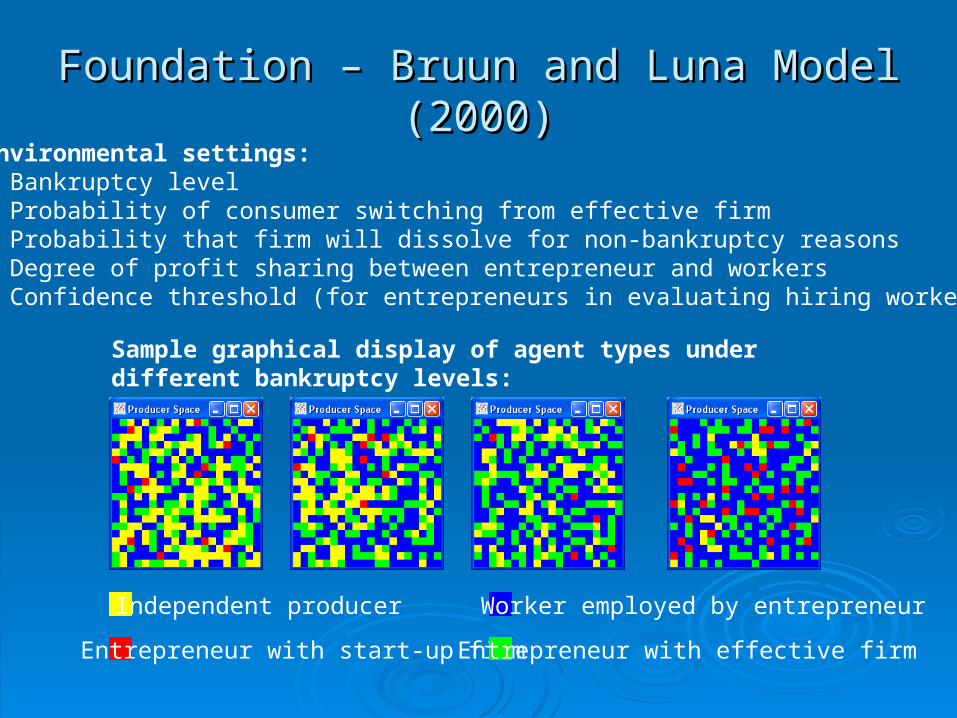
Foundation – Bruun and Luna Model (2000)Foundation – Bruun and Luna Model (2000)Environmental settings:• Bankruptcy level• Probability of consumer switching from effective firm• Probability that firm will dissolve for non-bankruptcy reasons• Degree of profit sharing between entrepreneur and workers• Confidence threshold (for entrepreneurs in evaluating hiring workers)
Sample graphical display of agent types under different bankruptcy levels:
Independent producer
Entrepreneur with start-up firm
Worker employed by entrepreneur
Entrepreneur with effective firm
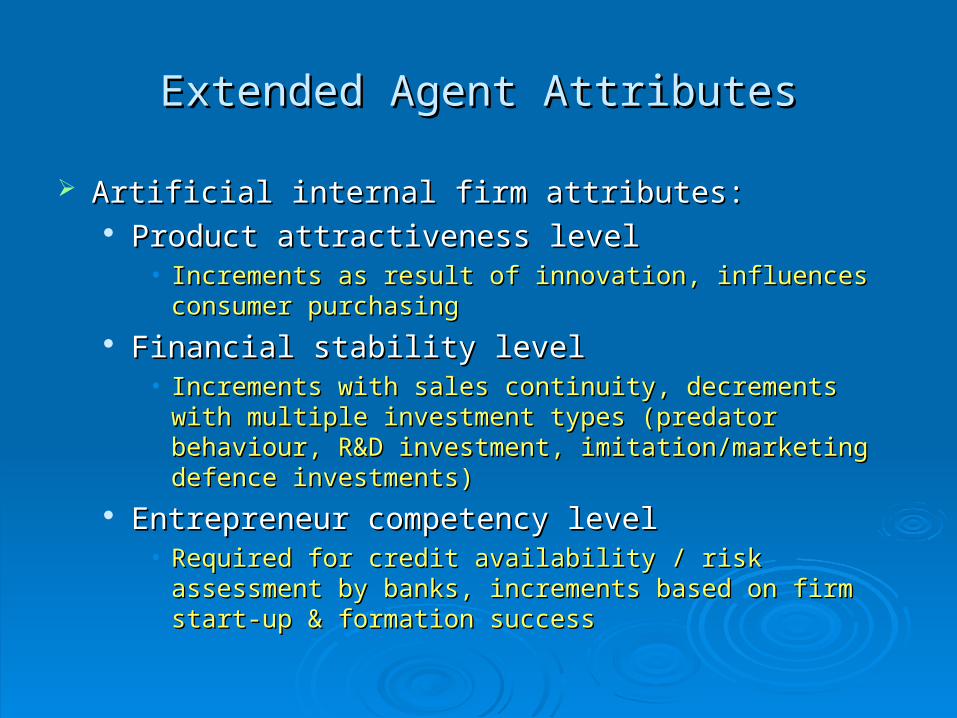
Extended Agent AttributesExtended Agent Attributes
Artificial internal firm attributes:Artificial internal firm attributes: Product attractiveness levelProduct attractiveness level
• Increments as result of innovation, influences consumer Increments as result of innovation, influences consumer purchasingpurchasing
Financial stability levelFinancial stability level• Increments with sales continuity, decrements with multiple Increments with sales continuity, decrements with multiple
investment types (predator behaviour, R&D investment, investment types (predator behaviour, R&D investment, imitation/marketing defence investments)imitation/marketing defence investments)
Entrepreneur competency levelEntrepreneur competency level• Required for credit availability / risk assessment by banks, Required for credit availability / risk assessment by banks,
increments based on firm start-up & formation successincrements based on firm start-up & formation success
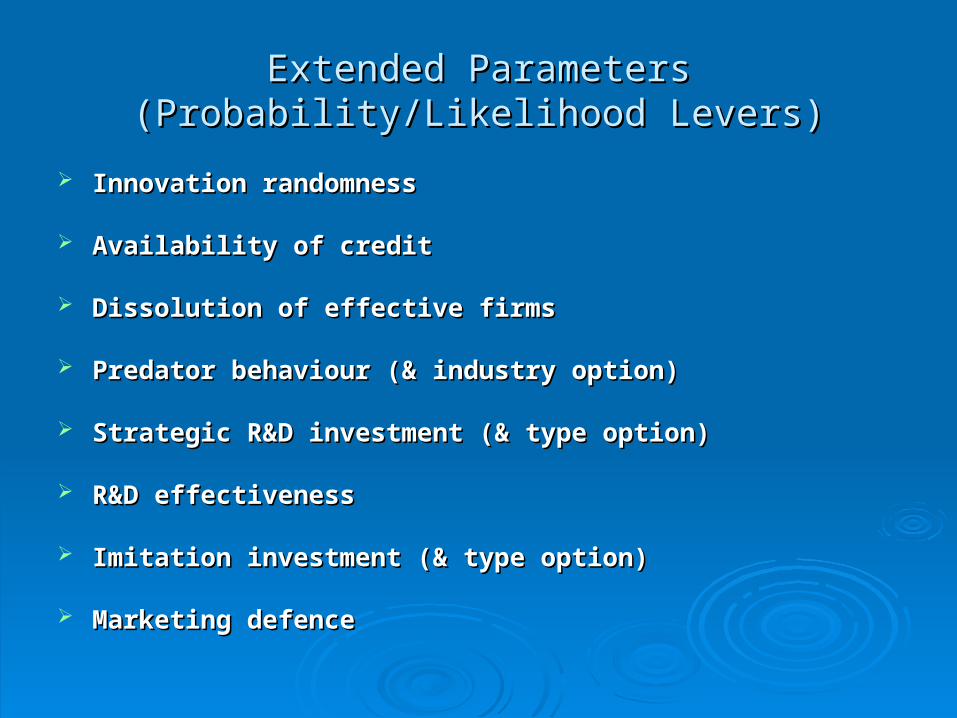
Extended ParametersExtended Parameters(Probability/Likelihood Levers)(Probability/Likelihood Levers)
Innovation randomnessInnovation randomness
Availability of creditAvailability of credit
Dissolution of effective firmsDissolution of effective firms
Predator behaviour (& industry option)Predator behaviour (& industry option)
Strategic R&D investment (& type option)Strategic R&D investment (& type option)
R&D effectivenessR&D effectiveness
Imitation investment (& type option)Imitation investment (& type option)
Marketing defenceMarketing defence
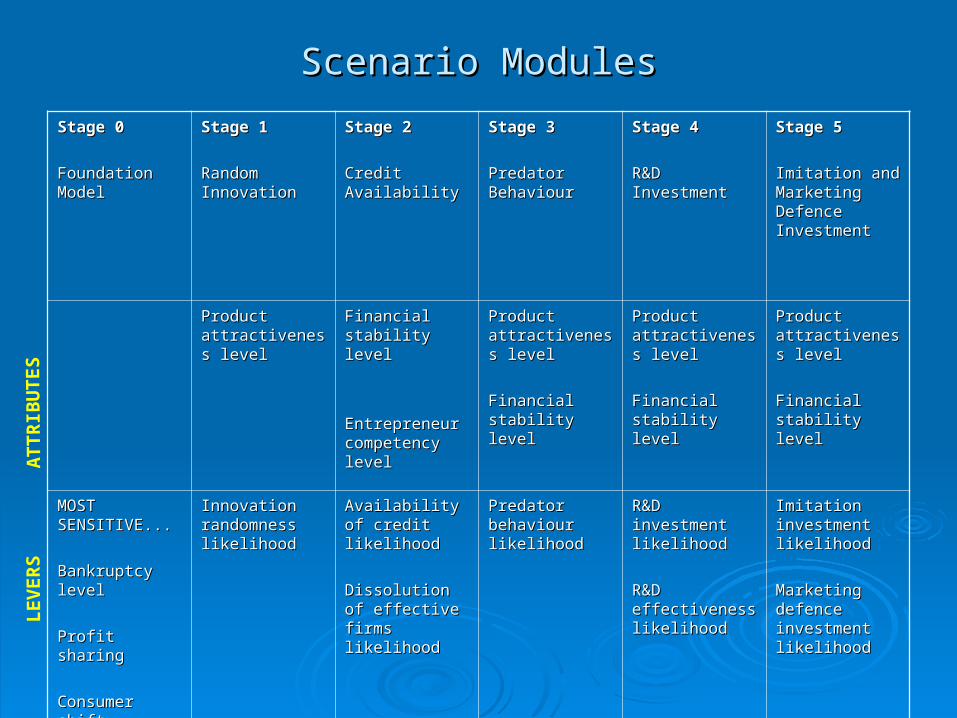
Scenario ModulesScenario Modules
Stage 0Stage 0
Foundation Foundation ModelModel
Stage 1Stage 1
Random Random InnovationInnovation
Stage 2Stage 2
Credit AvailabilityCredit Availability
Stage 3Stage 3
Predator Predator BehaviourBehaviour
Stage 4Stage 4
R&D InvestmentR&D Investment
Stage 5Stage 5
Imitation and Imitation and Marketing Marketing Defence Defence InvestmentInvestment
Product Product attractiveness attractiveness levellevel
Financial stability Financial stability levellevel
Entrepreneur Entrepreneur competency levelcompetency level
Product Product attractiveness attractiveness levellevel
Financial stability Financial stability levellevel
Product Product attractiveness attractiveness levellevel
Financial stability Financial stability levellevel
Product Product attractiveness attractiveness levellevel
Financial stability Financial stability levellevel
MOST MOST SENSITIVE...SENSITIVE...
Bankruptcy levelBankruptcy level
Profit sharingProfit sharing
Consumer shift Consumer shift likelihoodlikelihood
Innovation Innovation randomness randomness likelihoodlikelihood
Availability of Availability of credit likelihoodcredit likelihood
Dissolution of Dissolution of effective firms effective firms likelihoodlikelihood
Predator Predator behaviour behaviour likelihoodlikelihood
R&D investment R&D investment likelihoodlikelihood
R&D R&D effectiveness effectiveness likelihoodlikelihood
Imitation Imitation investment investment likelihoodlikelihood
Marketing Marketing defence defence investment investment likelihoodlikelihood
ATTR
IBU
TES
LEV
ER
S
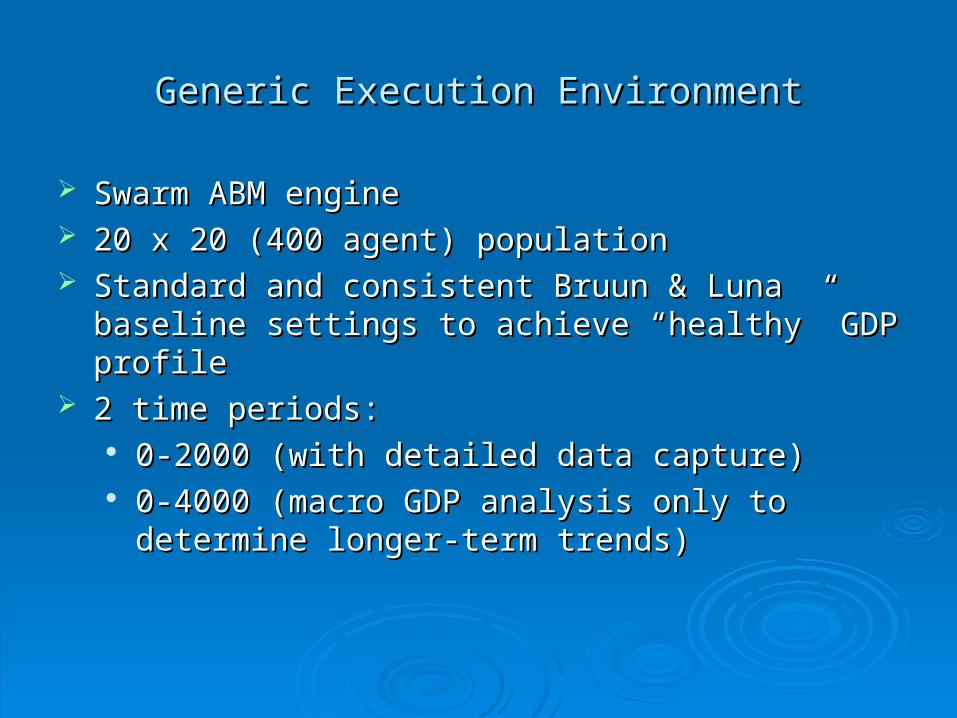
Generic Execution EnvironmentGeneric Execution Environment
Swarm ABM engineSwarm ABM engine 20 x 20 (400 agent) population20 x 20 (400 agent) population Standard and consistent Bruun & Luna baseline settings Standard and consistent Bruun & Luna baseline settings
to achieve “healthy” GDP profileto achieve “healthy” GDP profile 2 time periods:2 time periods:
0-2000 (with detailed data capture)0-2000 (with detailed data capture) 0-4000 (macro GDP analysis only to determine 0-4000 (macro GDP analysis only to determine
longer-term trends)longer-term trends)
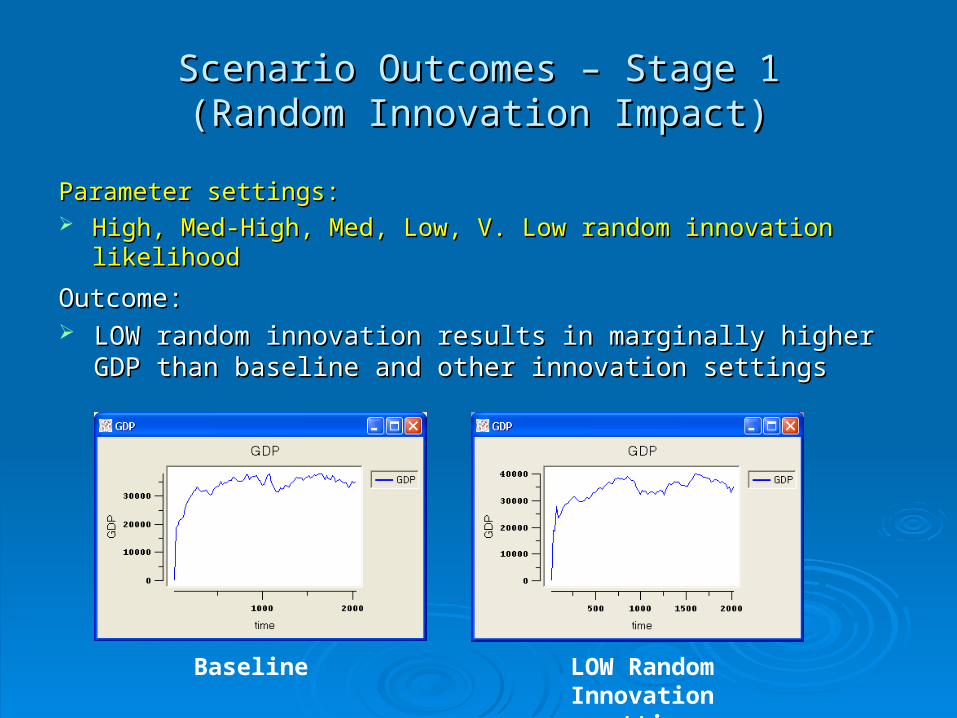
Scenario Outcomes – Stage 1Scenario Outcomes – Stage 1(Random Innovation Impact)(Random Innovation Impact)
Outcome:Outcome: LOW random innovation results in marginally higher GDP than LOW random innovation results in marginally higher GDP than
baseline and other innovation settingsbaseline and other innovation settings
Baseline LOW Random Innovation setting
Parameter settings:Parameter settings: High, Med-High, Med, Low, V. Low random innovation likelihoodHigh, Med-High, Med, Low, V. Low random innovation likelihood
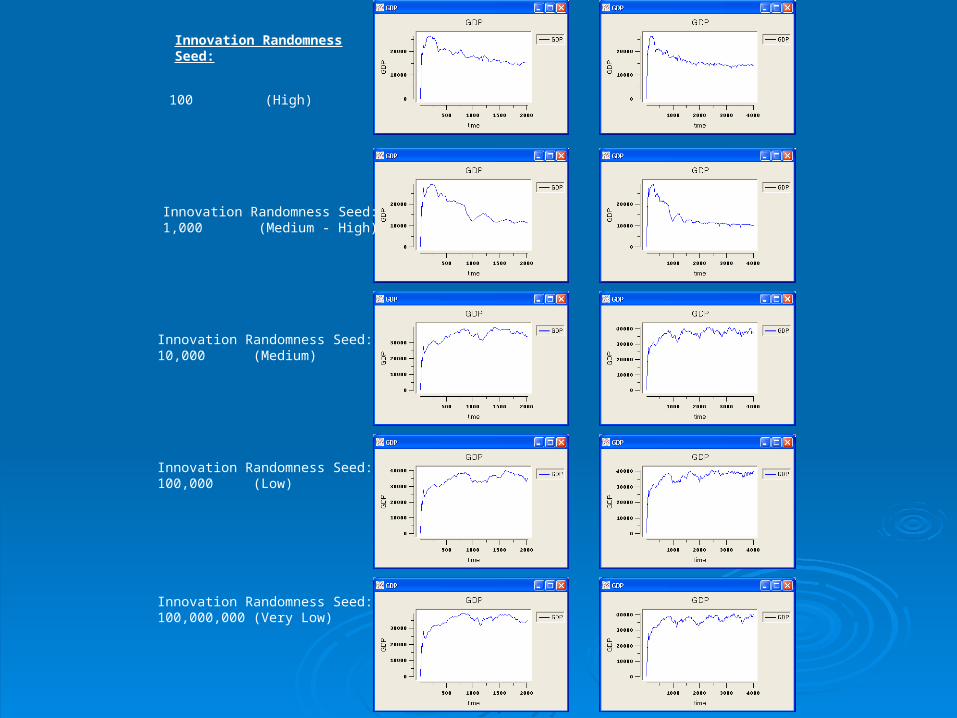
Innovation Randomness Seed:
100 (High)
Innovation Randomness Seed:1,000 (Medium - High)
Innovation Randomness Seed:10,000 (Medium)
Innovation Randomness Seed:100,000 (Low)
Innovation Randomness Seed:100,000,000 (Very Low)
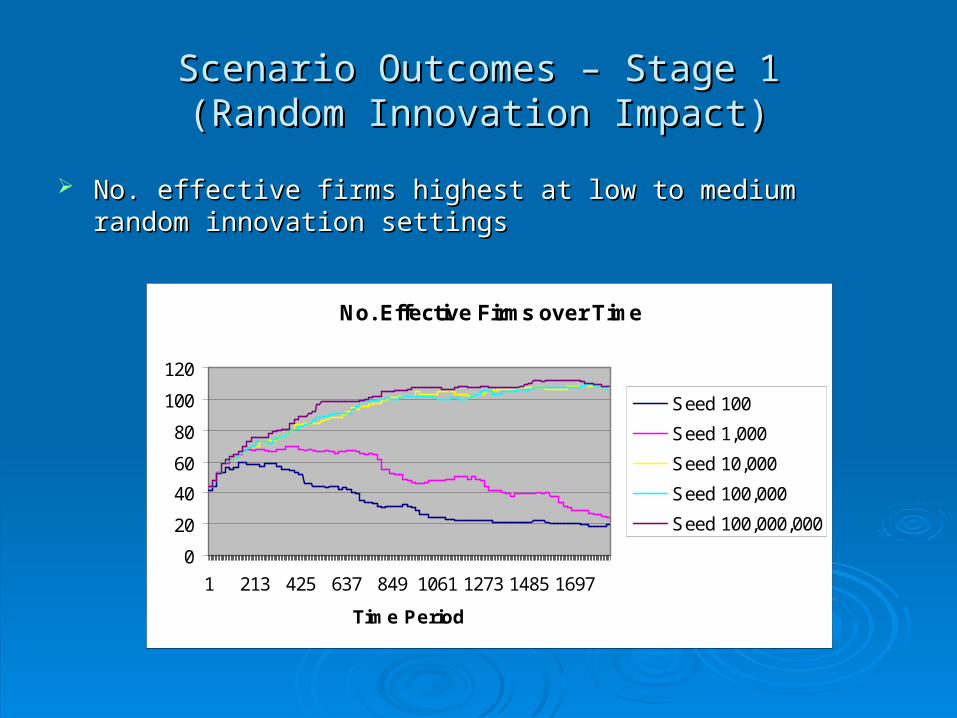
Scenario Outcomes – Stage 1Scenario Outcomes – Stage 1(Random Innovation Impact)(Random Innovation Impact)
No. effective firms highest at low to medium random innovation No. effective firms highest at low to medium random innovation settingssettings
No. Effective Firms over Time
0
20
40
60
80
100
120
1 213 425 637 849 1061 1273 1485 1697
Time Period
Seed 100
Seed 1,000
Seed 10,000
Seed 100,000
Seed 100,000,000
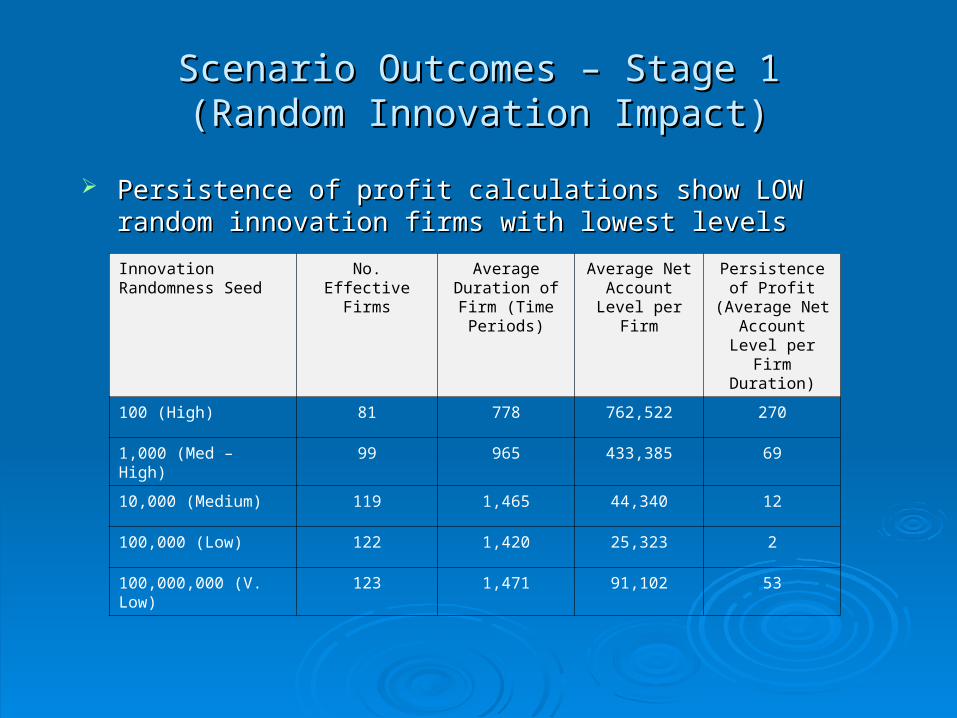
Scenario Outcomes – Stage 1Scenario Outcomes – Stage 1(Random Innovation Impact)(Random Innovation Impact)
Persistence of profit calculations show LOW random innovation Persistence of profit calculations show LOW random innovation firms with lowest levelsfirms with lowest levels
Innovation Randomness Seed
No. Effective Firms
Average Duration of Firm (Time Periods)
Average Net Account Level
per Firm
Persistence of Profit (Average
Net Account Level per Firm
Duration)
100 (High) 81 778 762,522 270
1,000 (Med – High) 99 965 433,385 69
10,000 (Medium) 119 1,465 44,340 12
100,000 (Low) 122 1,420 25,323 2
100,000,000 (V. Low) 123 1,471 91,102 53
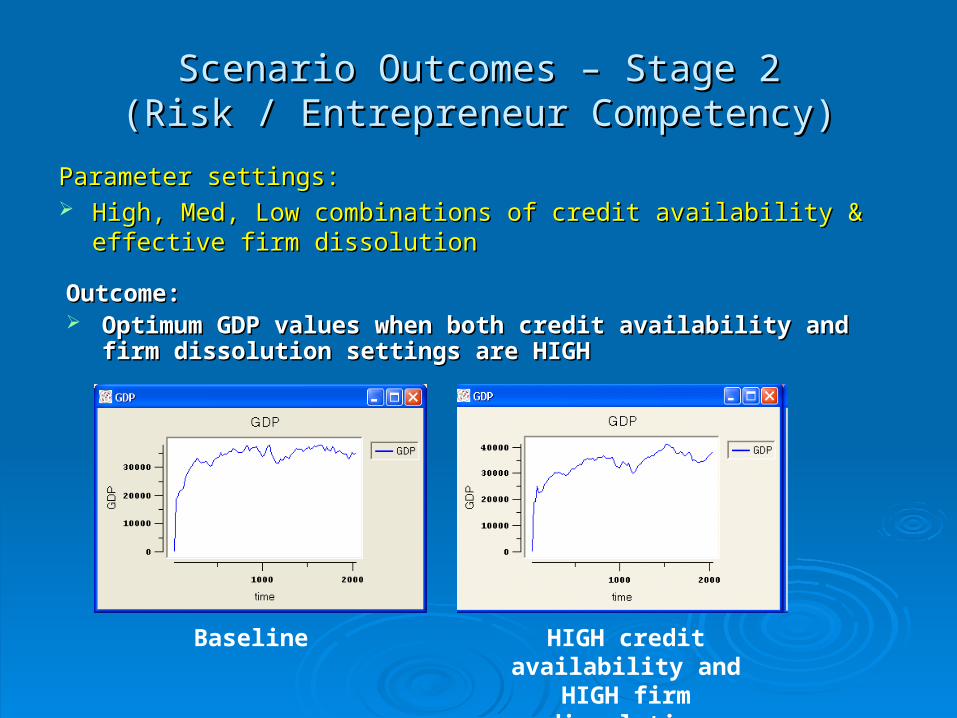
Scenario Outcomes – Stage 2Scenario Outcomes – Stage 2(Risk / Entrepreneur Competency)(Risk / Entrepreneur Competency)
Outcome:Outcome: Optimum GDP values when both credit availability and firm Optimum GDP values when both credit availability and firm
dissolution settings are HIGHdissolution settings are HIGH
Baseline HIGH credit availability and HIGH firm
dissolution likelihood
Parameter settings:Parameter settings: High, Med, Low combinations of credit availability & effective firm High, Med, Low combinations of credit availability & effective firm
dissolutiondissolution
Scenario Outcomes – Stage 2Scenario Outcomes – Stage 2(Risk / Entrepreneur Competency)(Risk / Entrepreneur Competency)
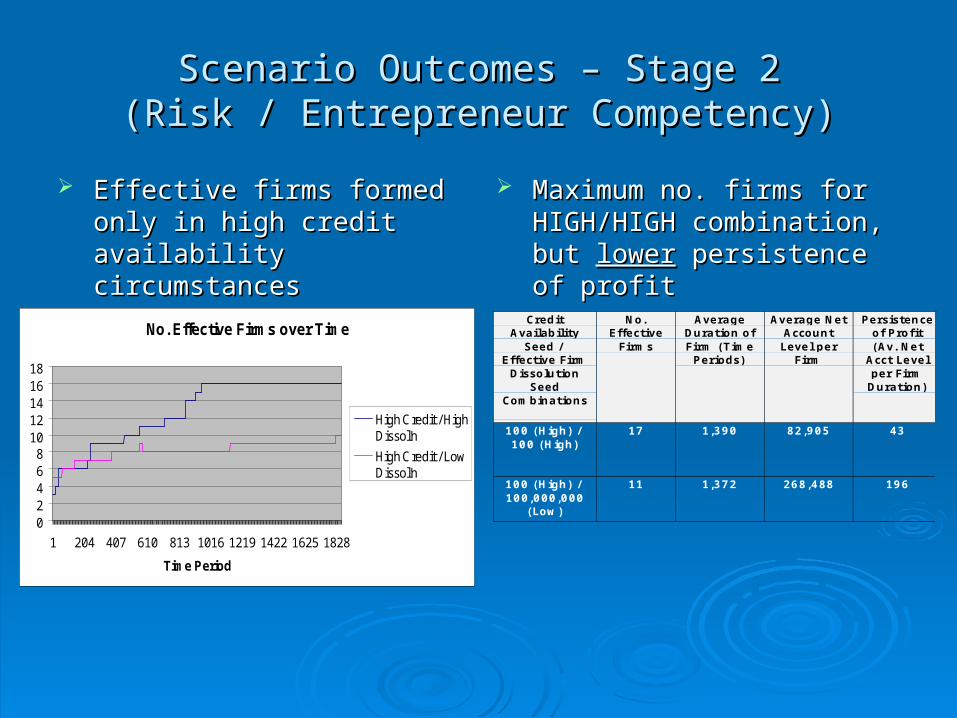
Effective firms formed only in Effective firms formed only in high credit availability high credit availability circumstancescircumstances
Maximum no. firms for Maximum no. firms for HIGH/HIGH combination, but HIGH/HIGH combination, but lowerlower persistence of profit persistence of profit
No. Effective Firms over Time
02468
1012141618
1 204 407 610 813 1016 1219 1422 1625 1828
Time Period
High Credit / HighDissol'n
High Credit / LowDissol'n
CreditAvailability
Seed /Effective Firm
DissolutionSeed
Combinations
No.Effective
Firms
AverageDuration ofFirm (Time
Periods)
Average NetAccountLevel per
Firm
Persistenceof Profit(Av. Net
Acct Levelper FirmDuration)
100 (High) /100 (High)
17 1,390 82,905 43
100 (High) /100,000,000
(Low)
11 1,372 268,488 196
Scenario Outcomes – Stage 3Scenario Outcomes – Stage 3(Predator Behaviour)(Predator Behaviour)
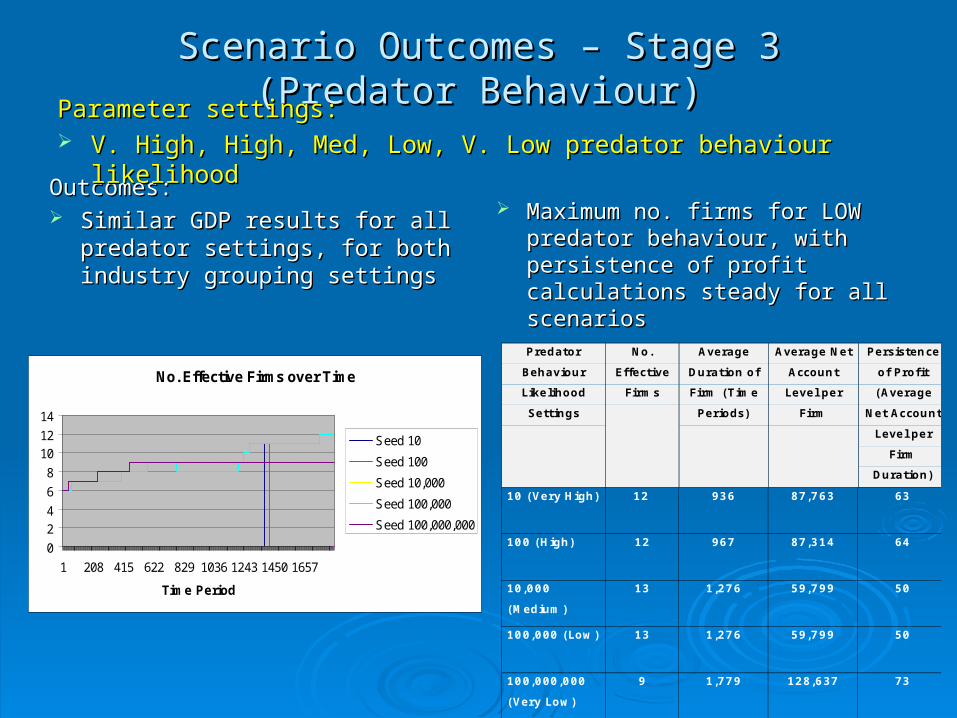
Outcomes:Outcomes: Similar GDP results for all Similar GDP results for all
predator settings, for both predator settings, for both industry grouping settingsindustry grouping settings
Maximum no. firms for LOW Maximum no. firms for LOW predator behaviour, with predator behaviour, with persistence of profit calculations persistence of profit calculations steady for all scenariossteady for all scenarios
No. Effective Firms over Time
0
24
6
8
1012
14
1 208 415 622 829 1036 1243 1450 1657
Time Period
Seed 10
Seed 100
Seed 10,000
Seed 100,000
Seed 100,000,000
Parameter settings:Parameter settings: V. High, High, Med, Low, V. Low predator behaviour likelihoodV. High, High, Med, Low, V. Low predator behaviour likelihood
Predator
Behaviour
Likelihood
Settings
No.
Effective
Firms
Average
Duration of
Firm (Time
Periods)
Average Net
Account
Level per
Firm
Persistence
of Profit
(Average
Net Account
Level per
Firm
Duration)
10 (Very High) 12 936 87,763 63
100 (High) 12 967 87,314 64
10,000
(Medium)
13 1,276 59,799 50
100,000 (Low) 13 1,276 59,799 50
100,000,000
(Very Low)
9 1,779 128,637 73
Scenario Outcomes – Stage 4Scenario Outcomes – Stage 4(R&D Investment Impact)(R&D Investment Impact)
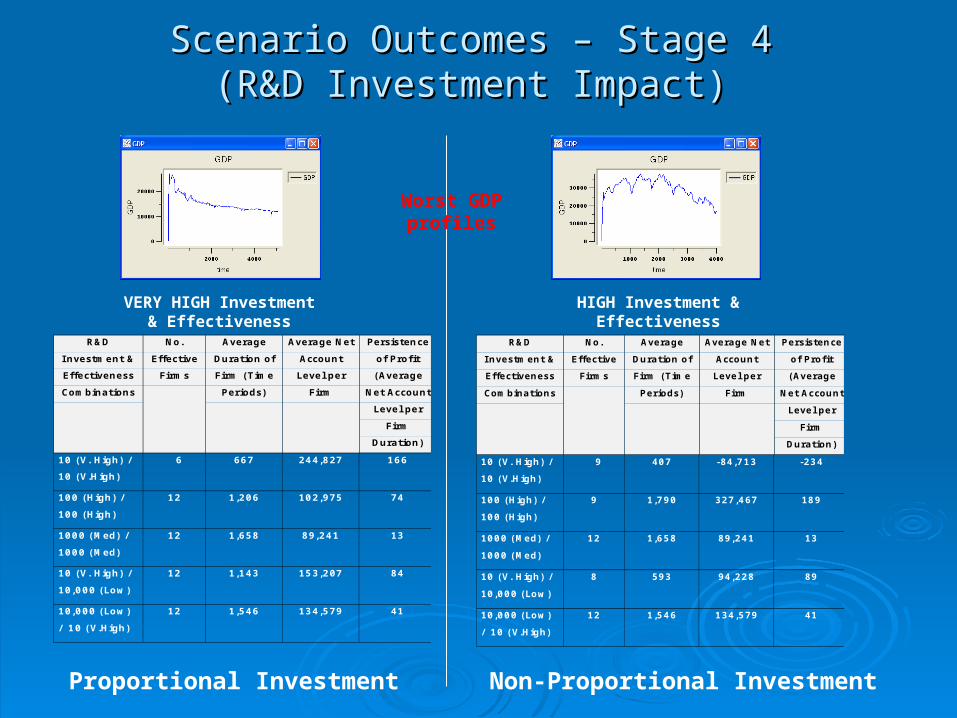
Proportional Investment Non-Proportional Investment
VERY HIGH Investment & Effectiveness
HIGH Investment & Effectiveness
R&D
Investment &
Effectiveness
Combinations
No.
Effective
Firms
Average
Duration of
Firm (Time
Periods)
Average Net
Account
Level per
Firm
Persistence
of Profit
(Average
Net Account
Level per
Firm
Duration)
10 (V. High) /
10 (V.High)
6 667 244,827 166
100 (High) /
100 (High)
12 1,206 102,975 74
1000 (Med) /
1000 (Med)
12 1,658 89,241 13
10 (V. High) /
10,000 (Low)
12 1,143 153,207 84
10,000 (Low)
/ 10 (V.High)
12 1,546 134,579 41
R&D
Investment &
Effectiveness
Combinations
No.
Effective
Firms
Average
Duration of
Firm (Time
Periods)
Average Net
Account
Level per
Firm
Persistence
of Profit
(Average
Net Account
Level per
Firm
Duration)
10 (V. High) /
10 (V.High)
9 407 -84,713 -234
100 (High) /
100 (High)
9 1,790 327,467 189
1000 (Med) /
1000 (Med)
12 1,658 89,241 13
10 (V. High) /
10,000 (Low)
8 593 94,228 89
10,000 (Low)
/ 10 (V.High)
12 1,546 134,579 41
Worst GDP profiles
Scenario Outcomes – Stage 4Scenario Outcomes – Stage 4(R&D Investment Impact)(R&D Investment Impact)
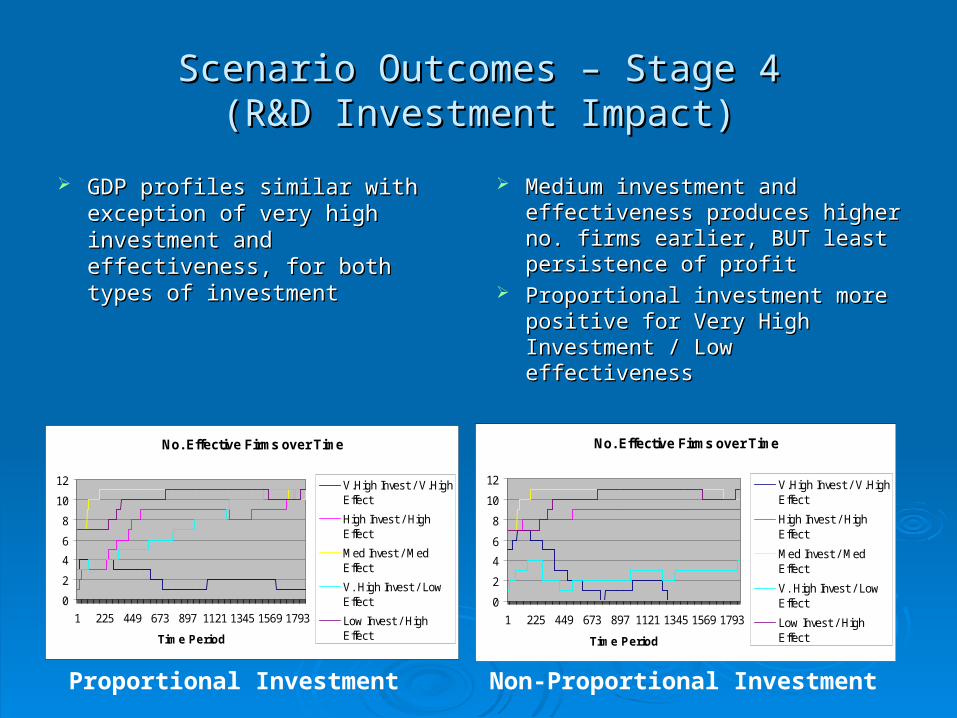
GDP profiles similar with GDP profiles similar with exception of very high exception of very high investment and effectiveness, investment and effectiveness, for both types of investmentfor both types of investment
Medium investment and Medium investment and effectiveness produces higher effectiveness produces higher no. firms earlier, BUT least no. firms earlier, BUT least persistence of profitpersistence of profit
Proportional investment more Proportional investment more positive for Very High positive for Very High Investment / Low effectivenessInvestment / Low effectiveness
No. Effective Firms over Time
0
2
4
6
8
10
12
1 225 449 673 897 1121 1345 1569 1793
Time Period
V.High Invest / V.HighEffect
High Invest / HighEffect
Med Invest / MedEffect
V. High Invest / LowEffect
Low Invest / HighEffect
Proportional Investment
No. Effective Firms over Time
0
2
4
6
8
10
12
1 225 449 673 897 1121 1345 1569 1793
Time Period
V.High Invest / V.HighEffect
High Invest / HighEffect
Med Invest / MedEffect
V. High Invest / LowEffect
Low Invest / HighEffect
Non-Proportional Investment
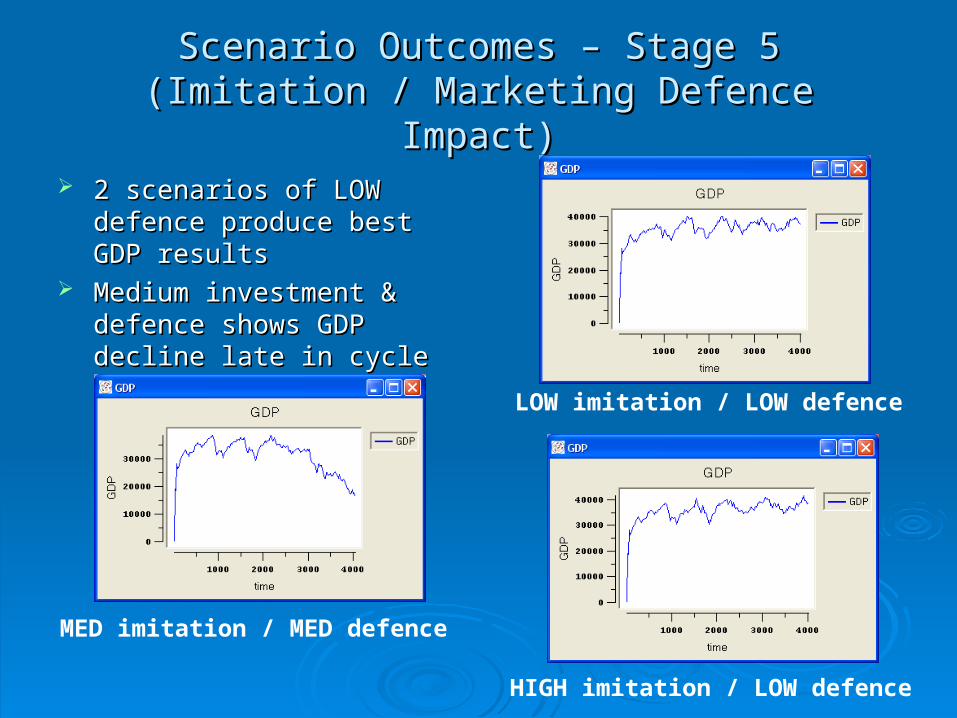
Scenario Outcomes – Stage 5Scenario Outcomes – Stage 5(Imitation / Marketing Defence Impact)(Imitation / Marketing Defence Impact)
2 scenarios of LOW defence 2 scenarios of LOW defence produce best GDP resultsproduce best GDP results
Medium investment & defence Medium investment & defence shows GDP decline late in shows GDP decline late in cycle time periodcycle time period
LOW imitation / LOW defence
HIGH imitation / LOW defence
MED imitation / MED defence
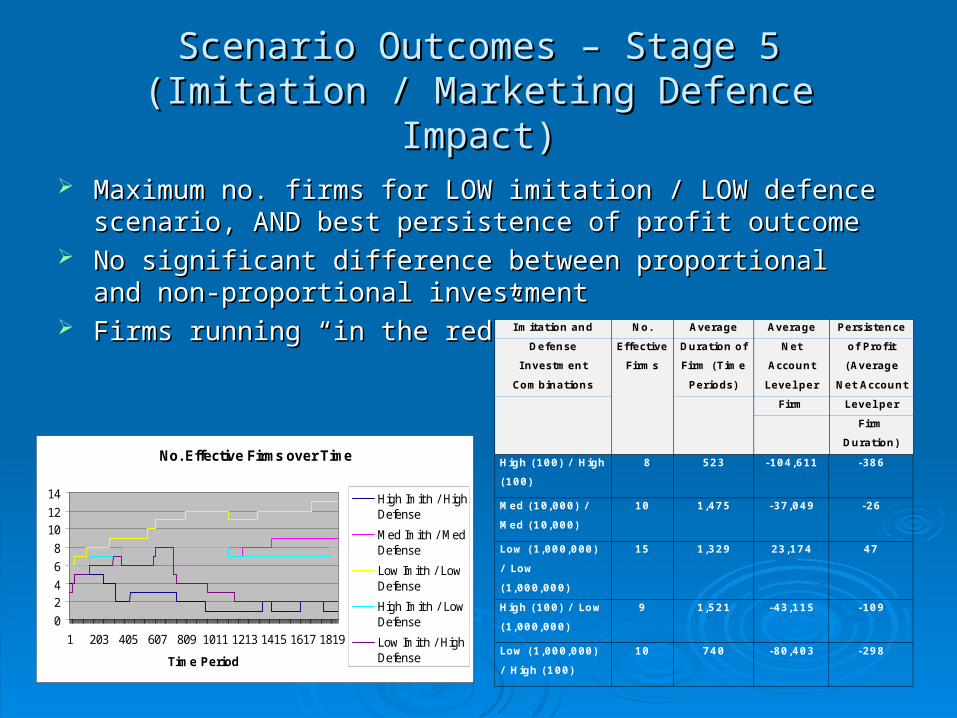
Scenario Outcomes – Stage 5Scenario Outcomes – Stage 5(Imitation / Marketing Defence Impact)(Imitation / Marketing Defence Impact)
Maximum no. firms for LOW imitation / LOW defence scenario, Maximum no. firms for LOW imitation / LOW defence scenario, AND best persistence of profit outcomeAND best persistence of profit outcome
No significant difference between proportional and non-No significant difference between proportional and non-proportional investmentproportional investment
Firms running “in the red”Firms running “in the red”
No. Effective Firms over Time
0
24
6
8
1012
14
1 203 405 607 809 1011 1213 1415 1617 1819
Time Period
High Imit'n / HighDefense
Med Imit'n / MedDefense
Low Imit'n / LowDefense
High Imit'n / LowDefense
Low Imit'n / HighDefense
Imitation and
Defense
Investment
Combinations
No.
Effective
Firms
Average
Duration of
Firm (Time
Periods)
Average
Net
Account
Level per
Firm
Persistence
of Profit
(Average
Net Account
Level per
Firm
Duration)
High (100) / High
(100)
8 523 -104,611 -386
Med (10,000) /
Med (10,000)
10 1,475 -37,049 -26
Low (1,000,000)
/ Low
(1,000,000)
15 1,329 23,174 47
High (100) / Low
(1,000,000)
9 1,521 -43,115 -109
Low (1,000,000)
/ High (100)
10 740 -80,403 -298
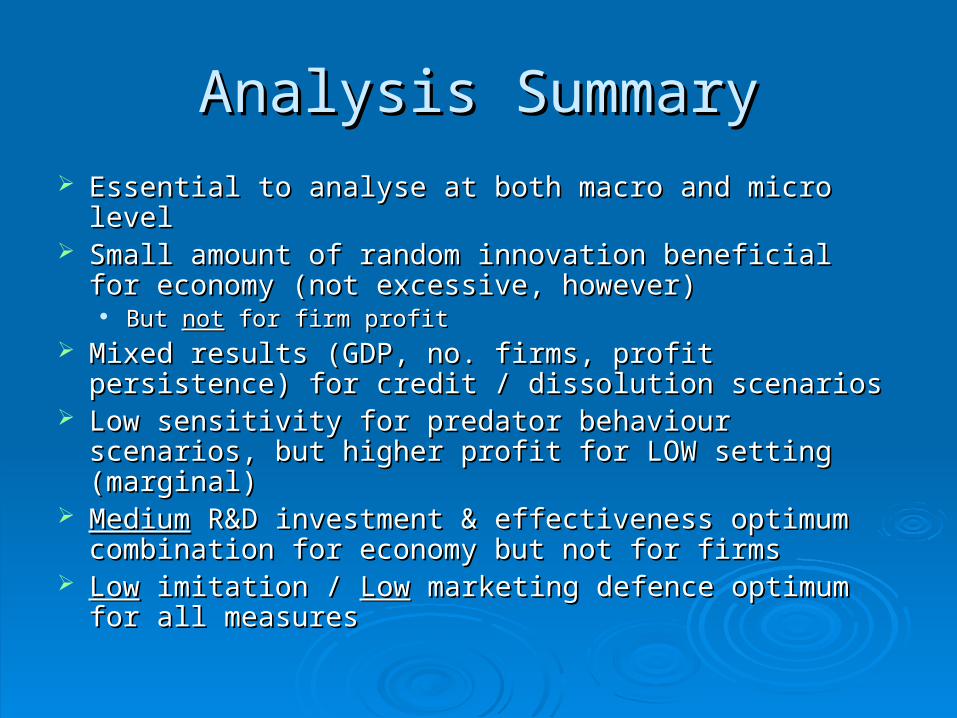
Analysis SummaryAnalysis Summary
Essential to analyse at both macro and micro level Essential to analyse at both macro and micro level Small amount of random innovation beneficial for Small amount of random innovation beneficial for
economy (not excessive, however)economy (not excessive, however) But But notnot for firm profit for firm profit
Mixed results (GDP, no. firms, profit persistence) for Mixed results (GDP, no. firms, profit persistence) for credit / dissolution scenarioscredit / dissolution scenarios
Low sensitivity for predator behaviour scenarios, but Low sensitivity for predator behaviour scenarios, but higher profit for LOW setting (marginal)higher profit for LOW setting (marginal)
MediumMedium R&D investment & effectiveness optimum R&D investment & effectiveness optimum combination for economy but not for firmscombination for economy but not for firms
LowLow imitation / imitation / LowLow marketing defence optimum for all marketing defence optimum for all measuresmeasures
Future DirectionsFuture Directions
Establish credit creation through entrepreneur activity, Establish credit creation through entrepreneur activity, with imitation “swarms”with imitation “swarms”
Establish conditions and logic for business cycles Establish conditions and logic for business cycles (Schumpeter theory)(Schumpeter theory)
Establish production dynamics for firms and tiered Establish production dynamics for firms and tiered industry structures (intermediate firms and product industry structures (intermediate firms and product structures)structures)
Multiple, concurrent competitive strategy execution by Multiple, concurrent competitive strategy execution by firmsfirms
Focus on firm balance sheets and P&LFocus on firm balance sheets and P&L