investigation on attrition strength of coated particles by...
TRANSCRIPT

Investigation on attrition strength of coated parti cles by response surface methodology
G. Perfetti b,c, D.E.C. van der Meer a, G.M.H. Meesters b,c, W. J. Wildeboer b
aFood Technology, School of Agriculture & Technology, INHOLLAND College, Kalfjeslaan 2, NL-2623 AA Delft, The Netherlands bDSM Food Specialties, Alexander Fleminglaan 1, NL-2613 AX Delft, The Netherlands
cParticle Technology Group, Faculty of Applied Sciences, Delft University of Technology, Julianalaan 136, NL-2628 BL Delft, The Netherlands
Abstract
The purpose of the present study is to obtain better understanding of the influence of different variables on the strength of coating, applied onto sodiumbenzoate particles. Through fluid bed coating of 1 mm sized particles, three experimental factors have been studied: the coating quantity related to the particle weight, the glass-transition temperature (Tg), and the fluid bed temperature (TFB). Through repeated impact, the resistance to attrition of the coated particles was tested, which is a measure of the strength of the coating. The experiments have been designed according to the response surface methodology (RSM). From statistical analysis, the coating quantity appears to have a significant effect on the resistance to attrition of the coated particle. This relationship is linear and positive, which means that an increasing quantity leads to more resistance to attrition. No direct effect on coating strength is detected of the fluid bed temperature.
1. Introduction: Reasons for coating
Particles can be coated for several reasons. In general, it is done to alter surface properties, or to add functionality for chemical or physical protection of sensitive ingredients. (Elversson et al., 2006) It is possible to provide an active agent like aspirin with a protective coating, but usually tablets consist of several layers, shown in Fig. 1.
Figure 1. a) Cross-section of a thick-coated particle (Werner, et al., 2007a). b) Schematic diagram of an example of a multi-layered granule. (Arnold, et al., 1994)
1.1 Pharmaceutical and Food applications
In the pharmaceutical industry, the coating of particles with a fluid bed is very suitable for specialised dosage forms, like the dosage of a pharmaceutical protein. (Maa et al., 1996) The coating is required to provide desired release characteristics, depending on time or on environment of the tablet, such as the low pH in a stomach. The most common reasons for coating are (Jones, 1985, Guignon et al., 2002): � taste masking; � enteric drug release; � isolation or barrier films; � improved stability; � facilitate aesthetics and recognisability: texture or colour; � facilitate dosage and mixing: size, shape or surface texture. The benefits of coating in the pharmaceutical industry rather correspond to the reasons for coating in the food-industry. The most common ones are (Dewettinck et al., 1998): � increased shelf-life; � taste masking; � ease of handling; � controlled release; � improved aesthetics, taste and colour.
Improvement of food-quality and shelf-life can be obtained by opposing the diffusion of moisture, fat and aromas within the product or between the product and its reactive environment. Edible films and coatings are capable of preventing moisture migration, so they can improve shelf-life by preservation of flavour and freshness. (Dogan et al., 2007). Furthermore, coatings for food and enzyme granules need to prevent the manufacturers and end-users from exposure to these products. (Meesters, 2002). Not only the coating process in general, but also the fluidised bed by itself knows several applications in food-processing. For example, it can be used for microencapsulation of flavours, micro-organisms and enzymes for the preparation of bread or cheese. Fluid beds could be put into service for puffing, freeze-drying, classification, blanching, spray-drying, granulation and agglomeration, for instance during the production process of milk powder or instant yeast. (Dewettinck et al., 1999a,c). 2. Experimental part 2.1 Materials
As coating agents aqueous-based solutions of the followings materials were used: two grades of Hydroxypropyl MethylCellulose HPMC (Pharmacoat® 603, 615, Syntapharm, Mülheim an der Ruhr, Germany) and one grade of PolyVinyl Alcohol PVA (Mowiol® 4-98, Sigma-Aldrich, UK). A list of studied materials with their characteristics and labelled properties is given in Tab. 1.
Table 1. Labelled Properties of the materials used in this work as delivered from the suppliers Polymer
Methoxy HydroxypropoxylPharmacoat 603 28.0 - 30.0 7.0 - 12.0 13000 2.4 - 3.6Pharmacoat 615 28.0 - 30.0 7.0 - 12.0 65000 12.0 - 18.0
PolyVinyl Alcohol Mowiol 4-98 27000 4 - 5 98 -98.8 ~ 600* 4 % solution in water (20 °C)
Hydroxypropyl Methylcellulose
Viscosity* [mPa·s]
Mol% Hydrolysis
PolymerizationBrand Name GradeDegrees of substitution Number Average
Molecular Weight
As core material granules of sodiumbenzoate (Purox-S®, DSM, Geleen, The Netherlands). The particle size is in the range 850 - 1000 µm and they are rather spherical with several sharp edges. 2.2 Preparation of Solutions
Both HPMC and PVA aqueous solutions were prepared at 3% weight content. No additives compounds were used in this work. The proper amount of HPMC is dispersed into 1/3 of the required amount of demi-water previously heated to more than 80 °C by magnetic heater, while strong stirring with a magnetic stirrer. The polymer gradually disperses to form uniform slurry. The stirring is continued until all particles are thoroughly wetted in the hot water. Later on the remaining water is added as ice water for rapid hydration and the resultant mixture is cooled down in an ice bath while vigorous stirring with a mechanical stirrer at 500 rpm for 30 min. The clear aqueous solution obtained were then allowed to hydrate overnight at 5 °C and allowed to de-foam and equilibrate to room temperature for several hours before use. As a first step PVA is sprinkled into cold water during stirring and heated to 90 - 95 °C in a water b ath or by the use of live steam. The solution is heavily stirred during cooling in order to prevent skin formation. The speed of dissolution increases with increasing temperature and decreases with increasing molecule. The dissolving process is also made more difficult when there is a transition to higher concentrations. Foam production is minimised using suitable low-speed mechanical stirrer. The solutions are equilibrated to room temperature before use. As Polyvinyl alcohol solutions which have been stored for lengthy periods at high concentration and low temperatures may increase in viscosity they are produced and straightaway used for experiments. 2.3 Methods 2.3.1 Fluid Bed Coater
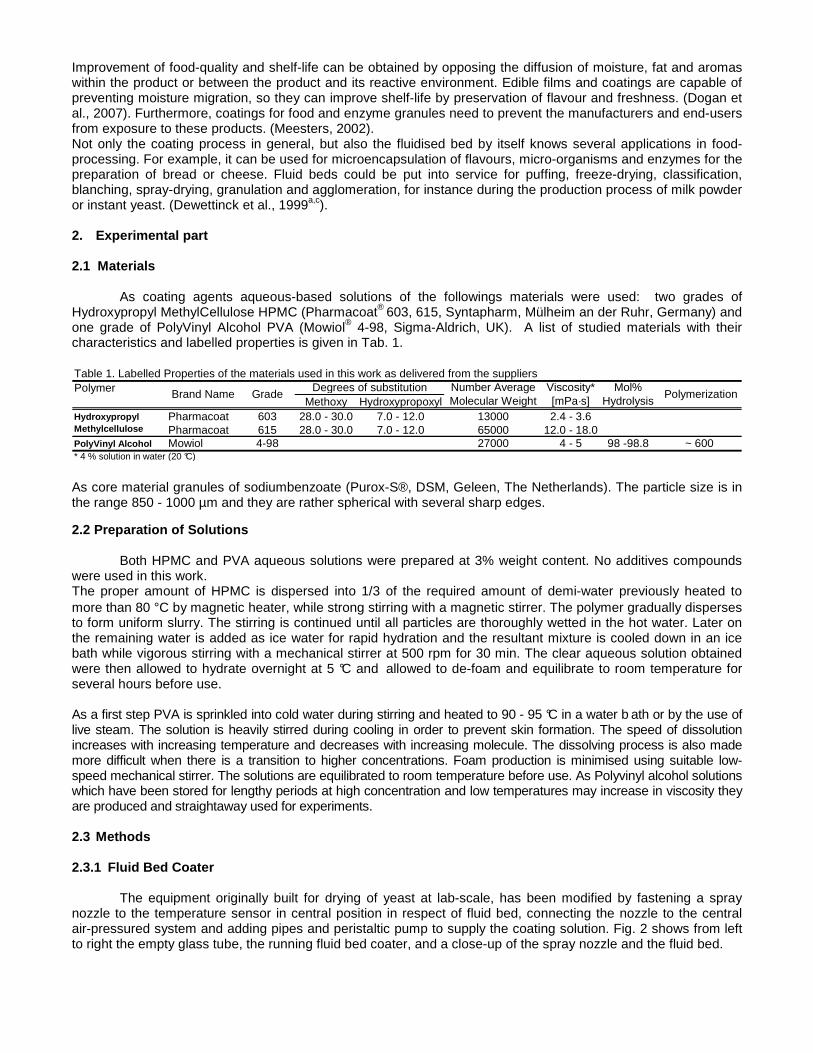
The equipment originally built for drying of yeast at lab-scale, has been modified by fastening a spray nozzle to the temperature sensor in central position in respect of fluid bed, connecting the nozzle to the central air-pressured system and adding pipes and peristaltic pump to supply the coating solution. Fig. 2 shows from left to right the empty glass tube, the running fluid bed coater, and a close-up of the spray nozzle and the fluid bed.
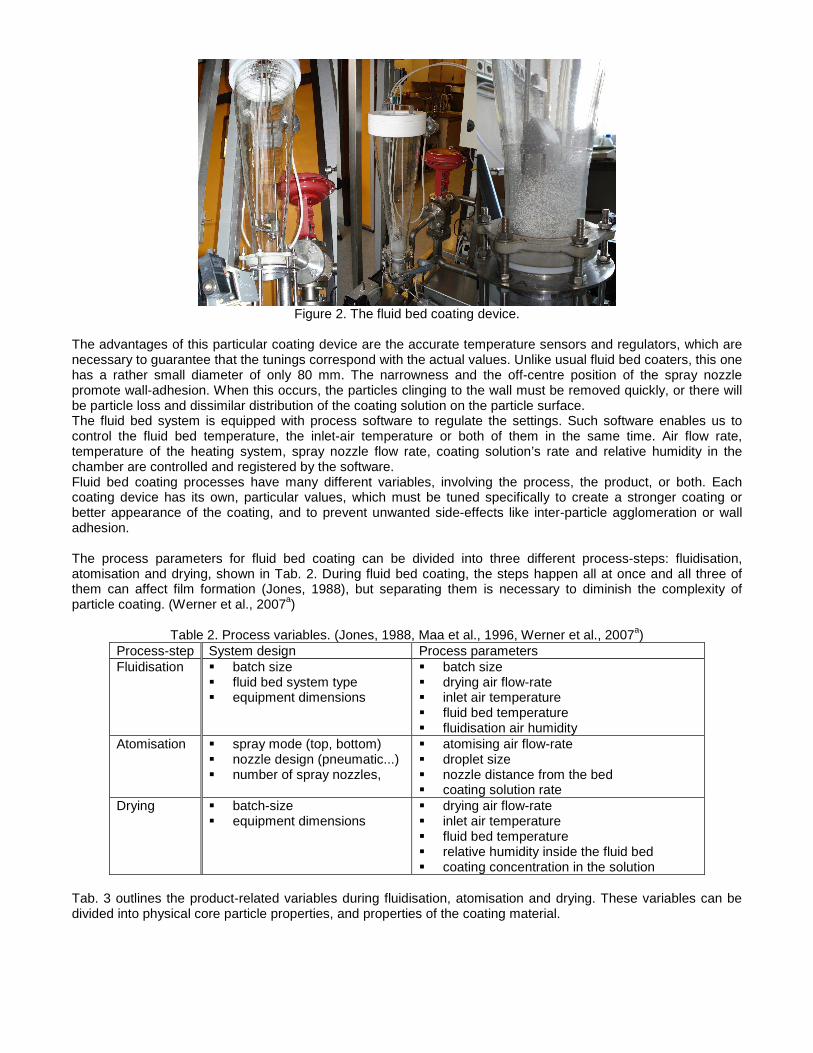
Figure 2. The fluid bed coating device.
The advantages of this particular coating device are the accurate temperature sensors and regulators, which are necessary to guarantee that the tunings correspond with the actual values. Unlike usual fluid bed coaters, this one has a rather small diameter of only 80 mm. The narrowness and the off-centre position of the spray nozzle promote wall-adhesion. When this occurs, the particles clinging to the wall must be removed quickly, or there will be particle loss and dissimilar distribution of the coating solution on the particle surface. The fluid bed system is equipped with process software to regulate the settings. Such software enables us to control the fluid bed temperature, the inlet-air temperature or both of them in the same time. Air flow rate, temperature of the heating system, spray nozzle flow rate, coating solution’s rate and relative humidity in the chamber are controlled and registered by the software. Fluid bed coating processes have many different variables, involving the process, the product, or both. Each coating device has its own, particular values, which must be tuned specifically to create a stronger coating or better appearance of the coating, and to prevent unwanted side-effects like inter-particle agglomeration or wall adhesion. The process parameters for fluid bed coating can be divided into three different process-steps: fluidisation, atomisation and drying, shown in Tab. 2. During fluid bed coating, the steps happen all at once and all three of them can affect film formation (Jones, 1988), but separating them is necessary to diminish the complexity of particle coating. (Werner et al., 2007a)
Table 2. Process variables. (Jones, 1988, Maa et al., 1996, Werner et al., 2007a) Process-step System design Process parameters Fluidisation � batch size
� fluid bed system type � equipment dimensions
� batch size � drying air flow-rate � inlet air temperature � fluid bed temperature � fluidisation air humidity
Atomisation � spray mode (top, bottom) � nozzle design (pneumatic...) � number of spray nozzles,
� atomising air flow-rate � droplet size � nozzle distance from the bed � coating solution rate
Drying � batch-size � equipment dimensions
� drying air flow-rate � inlet air temperature � fluid bed temperature � relative humidity inside the fluid bed � coating concentration in the solution
Tab. 3 outlines the product-related variables during fluidisation, atomisation and drying. These variables can be divided into physical core particle properties, and properties of the coating material.
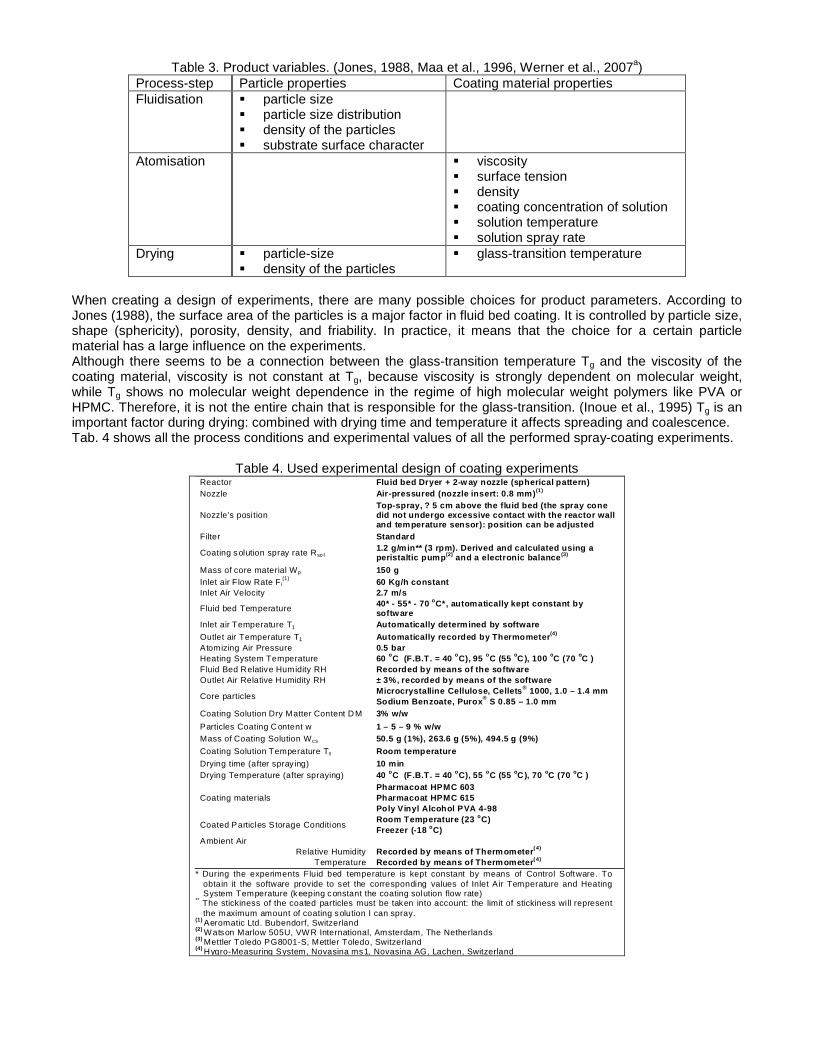
Table 3. Product variables. (Jones, 1988, Maa et al., 1996, Werner et al., 2007a) Process-step Particle properties Coating material properties Fluidisation � particle size
� particle size distribution � density of the particles � substrate surface character
Atomisation � viscosity � surface tension � density � coating concentration of solution � solution temperature � solution spray rate
Drying � particle-size � density of the particles
� glass-transition temperature
When creating a design of experiments, there are many possible choices for product parameters. According to Jones (1988), the surface area of the particles is a major factor in fluid bed coating. It is controlled by particle size, shape (sphericity), porosity, density, and friability. In practice, it means that the choice for a certain particle material has a large influence on the experiments. Although there seems to be a connection between the glass-transition temperature Tg and the viscosity of the coating material, viscosity is not constant at Tg, because viscosity is strongly dependent on molecular weight, while Tg shows no molecular weight dependence in the regime of high molecular weight polymers like PVA or HPMC. Therefore, it is not the entire chain that is responsible for the glass-transition. (Inoue et al., 1995) Tg is an important factor during drying: combined with drying time and temperature it affects spreading and coalescence. Tab. 4 shows all the process conditions and experimental values of all the performed spray-coating experiments.
Table 4. Used experimental design of coating experiments Reactor Fluid bed Dryer + 2-w ay nozzle (spherical pattern) Nozzle Air-pressured (nozzle insert: 0.8 mm) (1)
Nozzle's position Top-spray, ? 5 cm above the fluid bed (the spray co ne did not undergo excessive contact with the reactor wall and temperature sensor): position can be adjusted
Filter Standard
Coating solution spray rate Rso l 1.2 g/min** (3 rpm). Derived and calculated using a peristaltic pump (2) and a electronic balance (3)
Mass of core material Wp 150 g Inlet air Flow Rate F i
(1) 60 Kg/h constant Inlet Air Velocity 2.7 m/s
Fluid bed Temperature 40* - 55* - 70 oC*, automatically kept constant by softw are
Inlet air Temperature T1 Automatically determined by software
Outlet air Temperature T1 Automatically recorded by Thermometer (4) Atomizing Air Pressure 0.5 bar Heating System Temperature 60 oC (F.B.T. = 40 oC), 95 oC (55 oC), 100 oC (70 oC ) Fluid Bed Relative Humidity RH Recorded by means of the softw are Outlet Air Relative Humidity RH ± 3%, recorded by means of the software
Microcrystalline Cellulose, Cellets ® 1000, 1.0 – 1.4 mm Core particles
Sodium Benzoate, Purox ® S 0.85 – 1.0 mm Coating Solution Dry Matter Content DM 3% w/w
Particles Coating Content w 1 – 5 – 9 % w/w Mass of Coating Solution Wcs 50.5 g (1%), 263.6 g (5%), 494.5 g (9%)
Coating Solution Temperature Ts Room temperature
Drying time (after spray ing) 10 min Drying Temperature (after spraying) 40 oC (F.B.T. = 40 oC), 55 oC (55 oC), 70 oC (70 oC )
Pharmacoat HPMC 603 Pharmacoat HPMC 615 Coating materials Poly Vinyl Alcohol PVA 4-98 Room Temperature (23 oC)
Coated Particles Storage Conditions Freezer (-18 oC)
Ambient Air Relative Humidity Recorded by means of Thermometer ( 4)
Temperature Recorded by means of Thermometer ( 4) * During the experiments Fluid bed temperature is kept constant by means of Control Software. To
obtain it the software provide to set the corresponding values of Inlet Air Temperature and Heating System Temperature (keeping constant the coating solution flow rate)
** The stickiness of the coated particles must be taken into account: the limit of stickiness will represent the maximum amount of coating solution I can spray.
(1) Aeromatic Ltd. Bubendorf, Switzerland
(2) Watson Marlow 505U, VWR International, Amsterdam, The Netherlands
(3) Mettler Toledo PG8001-S, Mettler Toledo, Switzerland
(4) Hygro-Measuring System, Novasina ms1, Novasina AG, Lachen, Switzerland
2.3.2 Design of experiments
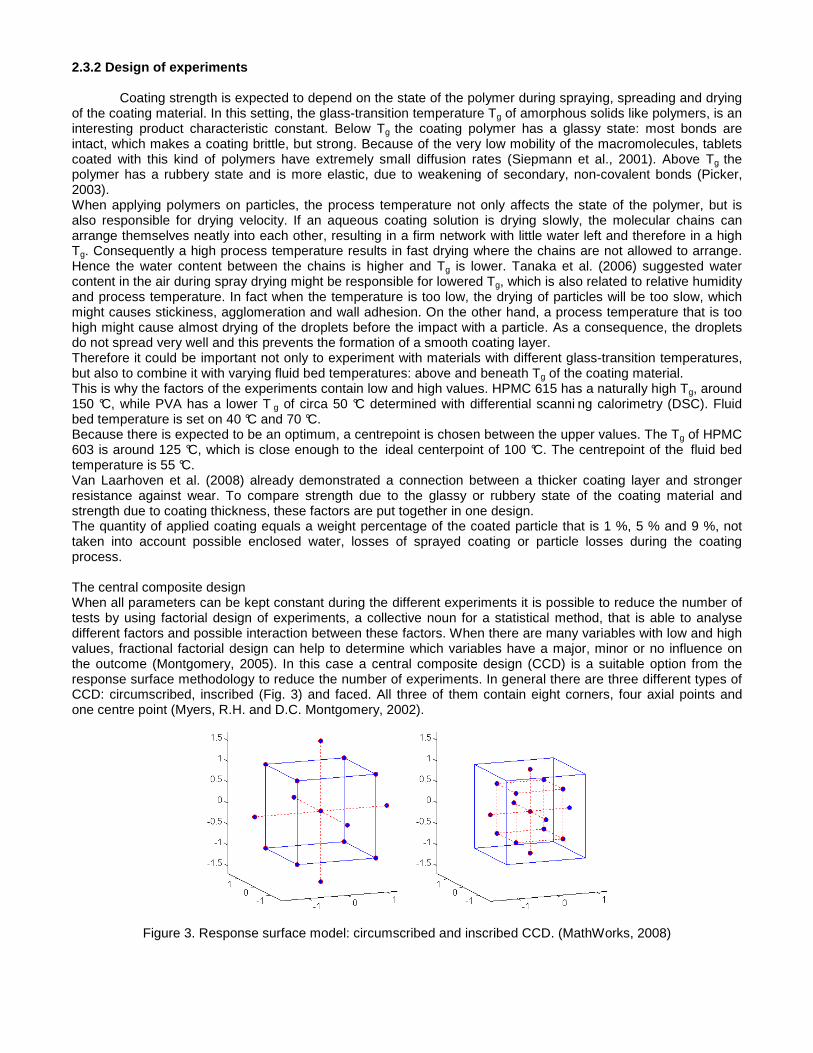
Coating strength is expected to depend on the state of the polymer during spraying, spreading and drying of the coating material. In this setting, the glass-transition temperature Tg of amorphous solids like polymers, is an interesting product characteristic constant. Below Tg the coating polymer has a glassy state: most bonds are intact, which makes a coating brittle, but strong. Because of the very low mobility of the macromolecules, tablets coated with this kind of polymers have extremely small diffusion rates (Siepmann et al., 2001). Above Tg the polymer has a rubbery state and is more elastic, due to weakening of secondary, non-covalent bonds (Picker, 2003). When applying polymers on particles, the process temperature not only affects the state of the polymer, but is also responsible for drying velocity. If an aqueous coating solution is drying slowly, the molecular chains can arrange themselves neatly into each other, resulting in a firm network with little water left and therefore in a high Tg. Consequently a high process temperature results in fast drying where the chains are not allowed to arrange. Hence the water content between the chains is higher and Tg is lower. Tanaka et al. (2006) suggested water content in the air during spray drying might be responsible for lowered Tg, which is also related to relative humidity and process temperature. In fact when the temperature is too low, the drying of particles will be too slow, which might causes stickiness, agglomeration and wall adhesion. On the other hand, a process temperature that is too high might cause almost drying of the droplets before the impact with a particle. As a consequence, the droplets do not spread very well and this prevents the formation of a smooth coating layer. Therefore it could be important not only to experiment with materials with different glass-transition temperatures, but also to combine it with varying fluid bed temperatures: above and beneath Tg of the coating material. This is why the factors of the experiments contain low and high values. HPMC 615 has a naturally high Tg, around 150 °C, while PVA has a lower T g of circa 50 °C determined with differential scanni ng calorimetry (DSC). Fluid bed temperature is set on 40 °C and 70 °C. Because there is expected to be an optimum, a centrepoint is chosen between the upper values. The Tg of HPMC 603 is around 125 °C, which is close enough to the ideal centerpoint of 100 °C. The centrepoint of the fluid bed temperature is 55 °C. Van Laarhoven et al. (2008) already demonstrated a connection between a thicker coating layer and stronger resistance against wear. To compare strength due to the glassy or rubbery state of the coating material and strength due to coating thickness, these factors are put together in one design. The quantity of applied coating equals a weight percentage of the coated particle that is 1 %, 5 % and 9 %, not taken into account possible enclosed water, losses of sprayed coating or particle losses during the coating process. The central composite design When all parameters can be kept constant during the different experiments it is possible to reduce the number of tests by using factorial design of experiments, a collective noun for a statistical method, that is able to analyse different factors and possible interaction between these factors. When there are many variables with low and high values, fractional factorial design can help to determine which variables have a major, minor or no influence on the outcome (Montgomery, 2005). In this case a central composite design (CCD) is a suitable option from the response surface methodology to reduce the number of experiments. In general there are three different types of CCD: circumscribed, inscribed (Fig. 3) and faced. All three of them contain eight corners, four axial points and one centre point (Myers, R.H. and D.C. Montgomery, 2002).
Figure 3. Response surface model: circumscribed and inscribed CCD. (MathWorks, 2008)
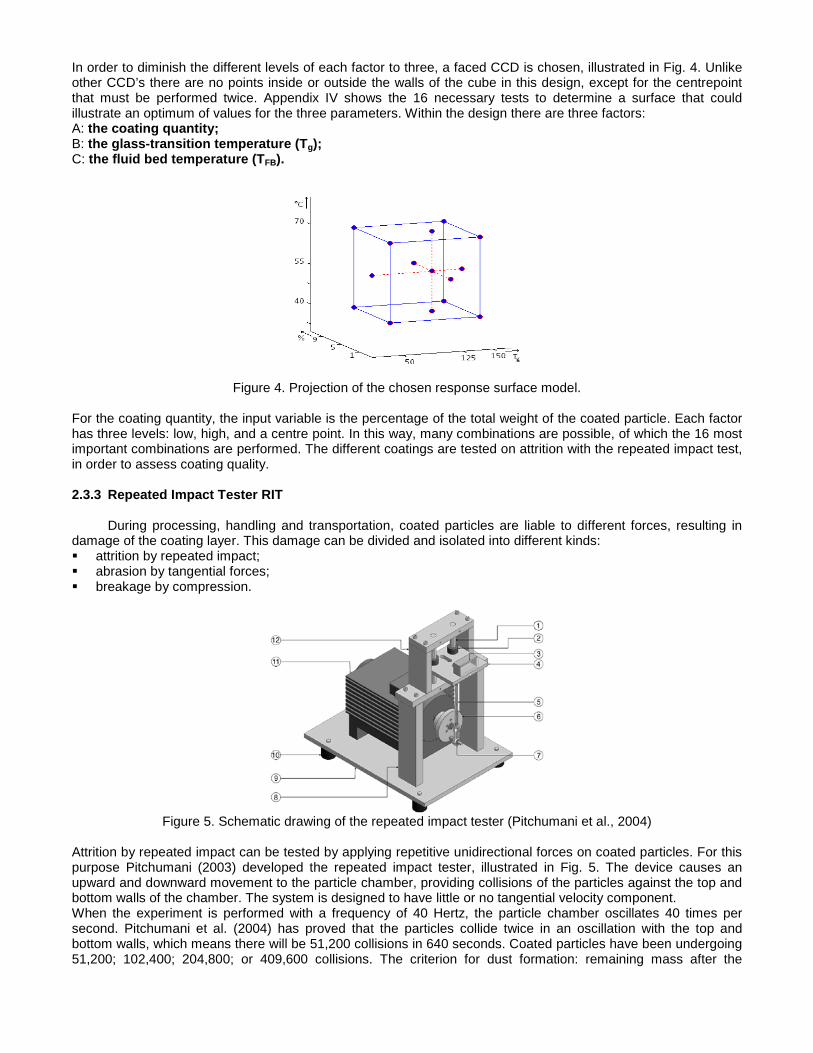
In order to diminish the different levels of each factor to three, a faced CCD is chosen, illustrated in Fig. 4. Unlike other CCD’s there are no points inside or outside the walls of the cube in this design, except for the centrepoint that must be performed twice. Appendix IV shows the 16 necessary tests to determine a surface that could illustrate an optimum of values for the three parameters. Within the design there are three factors: A: the coating quantity; B: the glass-transition temperature (T g); C: the fluid bed temperature (T FB).
Figure 4. Projection of the chosen response surface model. For the coating quantity, the input variable is the percentage of the total weight of the coated particle. Each factor has three levels: low, high, and a centre point. In this way, many combinations are possible, of which the 16 most important combinations are performed. The different coatings are tested on attrition with the repeated impact test, in order to assess coating quality. 2.3.3 Repeated Impact Tester RIT
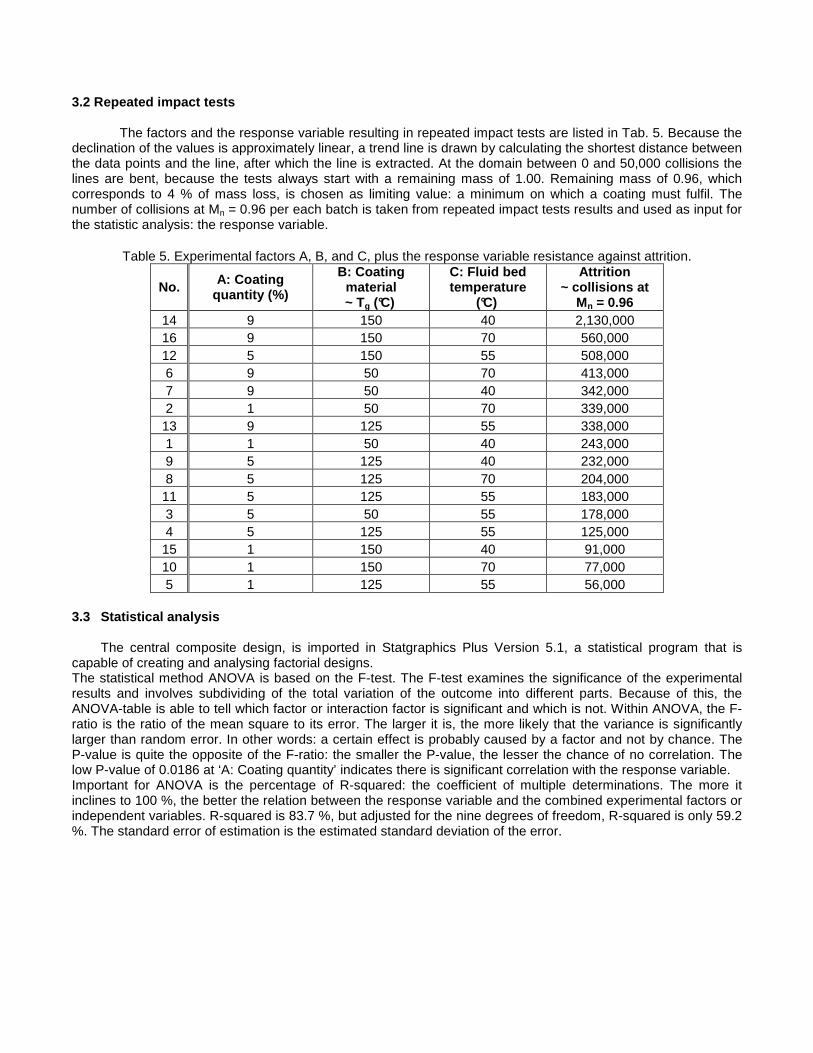
During processing, handling and transportation, coated particles are liable to different forces, resulting in damage of the coating layer. This damage can be divided and isolated into different kinds: � attrition by repeated impact; � abrasion by tangential forces; � breakage by compression.
Figure 5. Schematic drawing of the repeated impact tester (Pitchumani et al., 2004)
Attrition by repeated impact can be tested by applying repetitive unidirectional forces on coated particles. For this purpose Pitchumani (2003) developed the repeated impact tester, illustrated in Fig. 5. The device causes an upward and downward movement to the particle chamber, providing collisions of the particles against the top and bottom walls of the chamber. The system is designed to have little or no tangential velocity component. When the experiment is performed with a frequency of 40 Hertz, the particle chamber oscillates 40 times per second. Pitchumani et al. (2004) has proved that the particles collide twice in an oscillation with the top and bottom walls, which means there will be 51,200 collisions in 640 seconds. Coated particles have been undergoing 51,200; 102,400; 204,800; or 409,600 collisions. The criterion for dust formation: remaining mass after the

experiment (Mn), is calculated by division of the mass (Mi) after testing and sieving with a 450 µm sieve, by the initial particle mass (M0). The ratio of the remaining mass is the measure of the amount of dust formation, which equals the attrition of the coating. The less attrition takes place, the better the coating resists repeated impact. This is an indication for a stronger coating.
3 Results 3.1 Morphology of the coating
The different morphology of the coatings is clearly illustrated from scanning electron micrographs showed in Fig. 6, Fig. 7 and Fig. 8. Cross section of coated particles has been are shown only in the case of 9% coating thickness.
Figure 6: Scanning electron micrograph of Purox particles coated with PVA 4-98, 1% w/w (40 and 70 oC) and 9%
w/w (40 and 70 oC) respectively

Fig. 7: Scanning electron micrograph of Purox particles coated with HPMC 603, 1% w/w (40 and 70 oC) and 9%
w/w (40 and 70 oC) respectively
Fig. 8: Scanning electron micrograph of Purox particles coated with HPMC 615, 1% w/w (40 and 70 oC) and 9%
w/w (40 and 70 oC) respectively
3.2 Repeated impact tests
The factors and the response variable resulting in repeated impact tests are listed in Tab. 5. Because the declination of the values is approximately linear, a trend line is drawn by calculating the shortest distance between the data points and the line, after which the line is extracted. At the domain between 0 and 50,000 collisions the lines are bent, because the tests always start with a remaining mass of 1.00. Remaining mass of 0.96, which corresponds to 4 % of mass loss, is chosen as limiting value: a minimum on which a coating must fulfil. The number of collisions at Mn = 0.96 per each batch is taken from repeated impact tests results and used as input for the statistic analysis: the response variable.
Table 5. Experimental factors A, B, and C, plus the response variable resistance against attrition.
No. A: Coating quantity (%)
B: Coating material ~ Tg (°C)
C: Fluid bed temperature
(°C)
Attrition ~ collisions at
Mn = 0.96 14 9 150 40 2,130,000 16 9 150 70 560,000 12 5 150 55 508,000 6 9 50 70 413,000 7 9 50 40 342,000 2 1 50 70 339,000 13 9 125 55 338,000 1 1 50 40 243,000 9 5 125 40 232,000 8 5 125 70 204,000 11 5 125 55 183,000 3 5 50 55 178,000 4 5 125 55 125,000 15 1 150 40 91,000 10 1 150 70 77,000 5 1 125 55 56,000
3.3 Statistical analysis
The central composite design, is imported in Statgraphics Plus Version 5.1, a statistical program that is capable of creating and analysing factorial designs. The statistical method ANOVA is based on the F-test. The F-test examines the significance of the experimental results and involves subdividing of the total variation of the outcome into different parts. Because of this, the ANOVA-table is able to tell which factor or interaction factor is significant and which is not. Within ANOVA, the F-ratio is the ratio of the mean square to its error. The larger it is, the more likely that the variance is significantly larger than random error. In other words: a certain effect is probably caused by a factor and not by chance. The P-value is quite the opposite of the F-ratio: the smaller the P-value, the lesser the chance of no correlation. The low P-value of 0.0186 at ‘A: Coating quantity’ indicates there is significant correlation with the response variable. Important for ANOVA is the percentage of R-squared: the coefficient of multiple determinations. The more it inclines to 100 %, the better the relation between the response variable and the combined experimental factors or independent variables. R-squared is 83.7 %, but adjusted for the nine degrees of freedom, R-squared is only 59.2 %. The standard error of estimation is the estimated standard deviation of the error.

Figure 9. Pareto chart for resistance against attrition: exceeding of the blue line equals significance. Fig. 9 shows significance of all the variables used in the model. The more the positive (pink-coloured) bars or the negative (red-coloured) bars exceed the vertical blue line of the selected confidence level, the more significance of the effects. Even when the confidence level is lowered to 90 % instead of the default 95 %, taking into account the noise of the experiments, only two effects are significant: A and AB. Effects are observed by changes in average response, caused by factors or interaction factors when they go from their low level to their high level. A-squared (AA or A2), C-squared (CC), and C: the fluid bed temperature TFB, are not at all significant. By removing them, a lot of noise disappears and the degree of freedom rises from 6 to 9 degrees of freedom. With augmented degrees of freedom, estimation is more accurate, because the number of independent comparisons increases. After removal of insignificant effects, the outcome of the repeated impact test results into the standardised Pareto chart shown in Fig. 10, in which all main and side effects are significant at the 90 % confidence level.
Figure 10. Adjusted Pareto chart for resistance against attrition. 3.3.1 Effects on resistance to attrition
In accordance with the Pareto chart of Fig. 10, six effects are significant: 1st order as well as 2nd order effects are now mentioned in order of significance. 1) The design contains three factors, so there can be three main, 1st order effects. The coating quantity has a predominant (Fig. 11), positive effect on the resistance to attrition of coated particles. Because the effect is positive, the response variable increases along at increasing coating quantity. The steepness of the graph is inherent to the measure of effect on resistance to attrition.
Figure 11. Main effects plots: 1st order effects of the only two significant factors.

2) Also some combined factors influence the results significantly. The major effect is caused by interaction AB between the coating quantity and the glass-transition temperature Tg, illustrated in the interaction plot of AB in Fig. 12. When applying coated material with a high value of Tg like 150 °C, the resistance to attrition rises, as at the same time the coating quantity increases. This linear relationship has a large slope, so the effect is also large. On the other hand, when the Tg is low, hardly any effect is determined of the coating quantity on the resistance to attrition.
Figure 12. Interaction plots: 2nd order effects of combined factors. 3) BB is a second order effect of the glass-transition temperature Tg. The relation of Tg to the resistance to attrition appears to be quadratic. At this a minimum is noticeable at a Tg of approximately 90°C, which is outlined in Fig. 12. 4) BC stands for the effect of the fluid bed temperature TFB on the influence of the glass-transition temperature Tg, on the response variable resistance to attrition, illustrated by the interaction plot of BC in Fig. 12. At the relation of the glass-transition temperature to the resistance to attrition, the minimum moves to higher glass-transition temperatures at increasing fluid bed temperatures. 5) The fifth effect in the line of significance is B, the main effect of glass-transition temperature Tg, Fig. 12. Alteration of the Tg has a certain influence on the resistance to attrition. 6) The smallest effect that is still significant at a confidence level of 90% is the effect of the fluid bed temperature TFB on the influence of the coating quantity on the response variable, shown in the interaction plot AC, Fig. 12. Increasing of the resistance to attrition at a rising coating quantity is higher at a low value of the fluid bed temperature. This would imply that it is recommended to choose a high value of the fluid bed temperature, when obtaining a strong coating of 1% to 5% of the coated particle. On the other hand, when the coating quantity is more than 5% of the final particle, it is advisable to keep the fluid bed temperature at a low value (40 °C). 3.3.2 Response surface
The most significant effects described so far are summarised in an estimated response surface, illustrated in Fig. 13. It counts for TFB = 55 °C. The factor fluid bed temperature is not r epresented in one of the axes, because of the low significance of its effect. Under normal conditions, the curvature of the response surface can be used for the prediction of the optimum value of the variables, inside or outside the research area.

Figure 13. Response surface: the compilation of the main effects and interaction plots.
4. Discussion 4.1 The model for design of experiments
Fig. 14 illustrates the contours of the estimated response surface. The contour plot could be useful for determination of the region outside of the investigated area, where the most optimisation concerning strength of coated particles is suspected. The plot shows a descending ridge to the left in the direction of lesser coating quantity, and a slope towards the right corner at the top. The region of the next study can be determined by using the method of the steepest ascent. In brief, this method is found on an arrow into the surrounding space, which travels at right angles to the altitude lines of the contour plot. Nevertheless, by certain circumstances this is not the case. Due to the mixing of process variables with product characteristics as a factor, the steepest ascent method is inaccurate. The response surface methodology only works properly with quantitative factors, which go continuously from level to level.
Figure 14. Contour plot of the response surface; Tg as function of the coating quantity. The legend on the right displays the lines, corresponding to resistance against attrition.

Qualitative values like material characteristics only fit in a screening or mixed-level model. In the screening model, the factors are represented by only two levels instead of three. Fractional factorial design is possible within this model in order to reduce the number of experiments. This is in contrast to the mixed-level model, in which the choice of qualitative values and number of levels is free, but all combinations of factorial levels have to be performed: at a full-factorial design, no experiment is left out. Concerning this study, the result is that the main effects and interactions are meaningful as long as the outcome is significant, but the model is still restricted: more profound analyses have no eloquence. All this, is fortified by the absence of an exact centrepoint, which on its turn fortifies the noise of the model. This flaw in the design is due to the lack of a desirable coating material with the right average glass-transition temperature. 4.2 Influence of fluid bed temperature
It turns out, that no direct effect is observed of the fluid bed temperature TFB on the strength of coated particles (at least with TFB in range of 40 – 70 oC), in contrast to the other two main effects of the coating quantity and the glass-transition temperature on the resistance to attrition. However, there is some influence of the TFB on the effect of Tg, but considerably lesser than suspected. The study is based on the hypothesis that coating with material in the glassy state, as against material in the rubbery state, would lead to different results. On the other hand the effect of the coating quantity on the resistance to attrition is dominant to such an extent, that perhaps consequently the influence of fluid bed temperature is insignificant in this study. More deep studies must be done in order to understand the reason behind it. In particular fluid bed temperature TFB should be related to droplet impacts and spreading on the particle surface which is considered to be the key micro-level process (Werner et al., 2007b). In fact within this process, surface tension of the droplets, viscosity of the coating solution and fluid bed temperature are also expected to be the most important parameters. Despite the lack of influence of fluid bed temperature in the present study, it is still considered to be an important factor at fluid bed coating. For economical reasons it is favourable to use as less coating material as possible. When comparing parameters in a study with coating quantity as a constant factor, there might be other significant effects of the independent variables on attrition strength observed. 4.3 Noise of the experiments
Noise in the experiments due to the performance and conditions of the fluidised bed coating needs also to
be taken into account and discussed. Possible causes of noise are: � wall-adhesion; � inter-particle agglomeration; � electrostatic effects; � interruptions of the coating process; � varying droplet size; � loss of materials; � randomisation. Eventually the noise, together with the non-continuous variables and the reduction of the number of experiments, provides negative values of the estimated response variables (Fig. 15). This is obviously impossible because this variable is the number of collisions necessary to achieve a mass loss of 4 %. Occurrence of this error can be explained by Fig. 4, the projection of the experimental model. The different experiments are represented by corners, axial points and the centrepoint, and when the points are translated to a response surface, there are always data missing. By extending the number of experiments this inaccuracy will be reduced, but can not be prevented. Again, disposition of an exact centrepoint and continuous parameters would also diminish the appearance of negative values in the response surface.
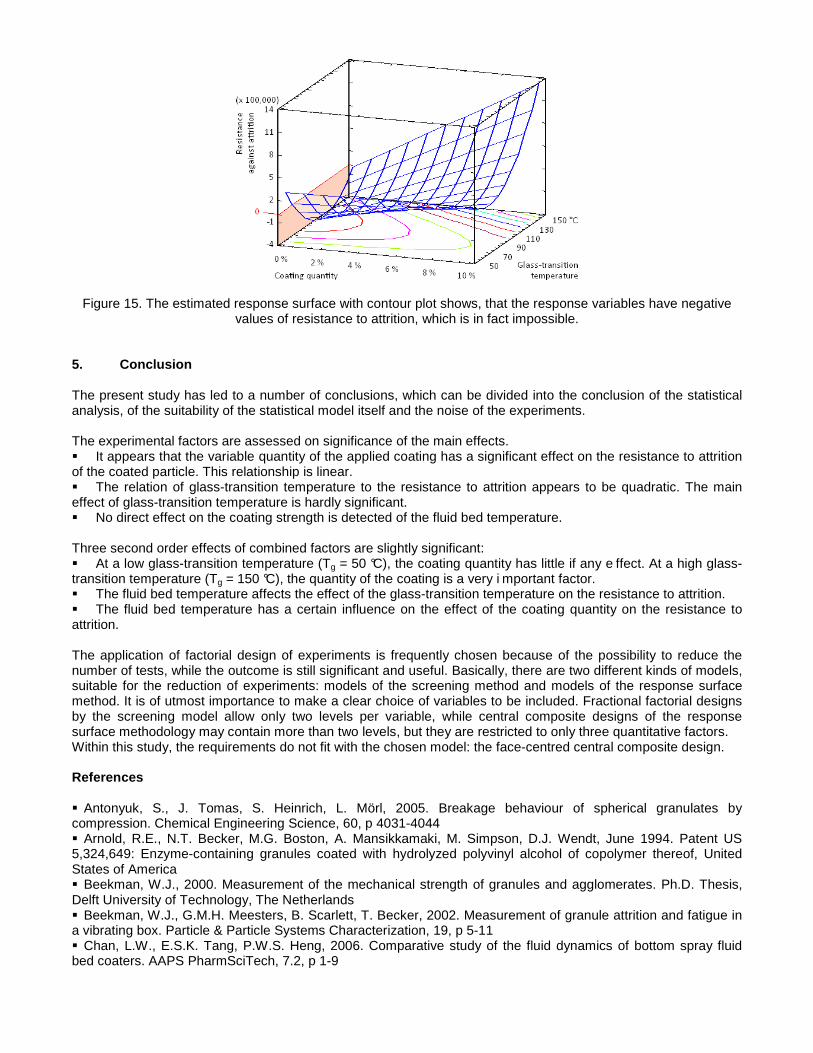
Figure 15. The estimated response surface with contour plot shows, that the response variables have negative values of resistance to attrition, which is in fact impossible.
5. Conclusion The present study has led to a number of conclusions, which can be divided into the conclusion of the statistical analysis, of the suitability of the statistical model itself and the noise of the experiments. The experimental factors are assessed on significance of the main effects. � It appears that the variable quantity of the applied coating has a significant effect on the resistance to attrition of the coated particle. This relationship is linear. � The relation of glass-transition temperature to the resistance to attrition appears to be quadratic. The main effect of glass-transition temperature is hardly significant. � No direct effect on the coating strength is detected of the fluid bed temperature. Three second order effects of combined factors are slightly significant: � At a low glass-transition temperature (Tg = 50 °C), the coating quantity has little if any e ffect. At a high glass-transition temperature (Tg = 150 °C), the quantity of the coating is a very i mportant factor. � The fluid bed temperature affects the effect of the glass-transition temperature on the resistance to attrition. � The fluid bed temperature has a certain influence on the effect of the coating quantity on the resistance to attrition. The application of factorial design of experiments is frequently chosen because of the possibility to reduce the number of tests, while the outcome is still significant and useful. Basically, there are two different kinds of models, suitable for the reduction of experiments: models of the screening method and models of the response surface method. It is of utmost importance to make a clear choice of variables to be included. Fractional factorial designs by the screening model allow only two levels per variable, while central composite designs of the response surface methodology may contain more than two levels, but they are restricted to only three quantitative factors. Within this study, the requirements do not fit with the chosen model: the face-centred central composite design. References � Antonyuk, S., J. Tomas, S. Heinrich, L. Mörl, 2005. Breakage behaviour of spherical granulates by compression. Chemical Engineering Science, 60, p 4031-4044 � Arnold, R.E., N.T. Becker, M.G. Boston, A. Mansikkamaki, M. Simpson, D.J. Wendt, June 1994. Patent US 5,324,649: Enzyme-containing granules coated with hydrolyzed polyvinyl alcohol of copolymer thereof, United States of America � Beekman, W.J., 2000. Measurement of the mechanical strength of granules and agglomerates. Ph.D. Thesis, Delft University of Technology, The Netherlands � Beekman, W.J., G.M.H. Meesters, B. Scarlett, T. Becker, 2002. Measurement of granule attrition and fatigue in a vibrating box. Particle & Particle Systems Characterization, 19, p 5-11 � Chan, L.W., E.S.K. Tang, P.W.S. Heng, 2006. Comparative study of the fluid dynamics of bottom spray fluid bed coaters. AAPS PharmSciTech, 7.2, p 1-9

� Dale, D.A., A.L. Gaertner, G. Park, N.T. Becker, 1999. Patent US 5,879,920: Coated enzyme-containing granule, United States of America � Dewettinck, K. and A. Huyghebaert, 1998. Top-spray fluidized bed coating: effect of process variables on coating efficiency. Lebensmittel-Wissenschaft und-Technologie – Food Science and Technology, 31, p 568-575 � Dewettinck, K., W. Messens, L. Deroo, A. Huyghebaert, 1999a. Agglomeration Tendency during top-spray fluidized bed coating with gums. Lebensmittel-Wissenschaft und-Technologie – Food Science and Technology, 31, p 576-584 � Dewettinck, K., W. Messens, L. Deroo, A. Huyghebaert, 1999b. Agglomeration Tendency during top-spray fluidized bed coating with gelatine and starch hydrolysate. Lebensmittel-Wissenschaft und-Technologie – Food Science and Technology, 32, p 102-106 � Dewettinck, K. and A. Huyghebaert, 1999c. Fluidized bed coating in food technology. Trends in Food Science and Technology, 10, p 163-168 � Dogan, N. and T.H. McHugh, 2007. Effects of microcrystalline cellulose on functional properties of hydroxypropylmethylcellulose microcomposite films. Journal of Food Science, 72.1, p 16-22 � Elversson, J. and A. Millqvist-Fureby, 2006. In situ coating – An approach for particle modification and encapsulation of proteins during spray-drying. International Journal of Pharmaceutics, 323, p 52-63 � Ford, J.L., 1999. Thermal analysis of hydroxypropylmethylcellulose and methylcellulose: powders, gels and matrix tablets. International Journal of Pharmaceutics, 179, p 209-228 � Guignon, B., A. Duquenoy, E.D. Dumoulin, 2002. Fluid bed encapsulation of particles: principles and practice. Drying Technology, 20.2, p 419-447 � Inoue, T., M.T. Cicerone, M.D. Ediger, 1995. Molecular motions and viscoelasticity of amorphous polymers near Tg. Macromolecules, 28, p 3425-3433 � Jones, D.M., 1985. Factors to consider in fluid-bed processing. Pharmaceutical Technology, 9, p 50-62 � Jones, D.M., 1988. Air-suspension coating. In: Swarbrick, J. and J.C. Boylan, Encyclopaedia of Pharmaceutical Technology, vol 1, Marcel Dekker Inc., New York, USA, p 189-216 � Laarhoven, B. van, S.C.A. Wiers, S.H. Schaafsma, G.M.H. Meesters, 2008. Attrition strength of different coated agglomerates. Chemical Engineering Science, 63, p 1361-1369 � Maa, Y.-F., P.A. Nguyen, C.C. Hsu, 1996. Spray-coating of rhDNase on lactose: effect of system design, operational parameters and protein formulation. International Journal of Pharmaceutics, 144, p 47-59 � Meesters, G.M.H., 2002. Powder technology at DSM Food Applications: powders in applications, Proceedings: Powder Research to Promote Competitive Manufacture of Added-Value Food Ingredients, Brussels, Belgium � Meesters, G.M.H., Principle Scientist DSM. Personal note, Delft [February 15, 2008] � Mehta, A.M., M.J. Valazza, S.E. Abele, 1986. Evaluation of fluid-bed processing for enteric coating systems. Pharmaceutical Technology, 10, p 46-56 � Montgomery, D.C. 2005. Design and analysis of experiments, 6th edition, John Wiley & Sons Inc., Hoboken, United States of America, p 405-444 � Myers, R.H. and D.C. Montgomery, 2002. Response surface methodology: process and product optimization using designed experiments, 2nd edition, John Wiley & Sons Inc., New York, United States of America, p 156, 321-342 � Obara, S., J.W. McGinity, 1995. Influence of processing variables on the properties of free films prepared from aqueous polymeric dispersions by a spray technique. International Journal of Pharmaceutics, 126, p 1-10 � Picker, K.M., 2003. The relevance of glass transition temperature for the process of tablet formation. Journal of Thermal Analysis and Calorimetry, 73, p 597-605 � Pitchumani, R., 2003. Breakage characteristics of particles and granules. Ph.D. Thesis, Delft University of Technology, The Netherlands, p 1-37 � Pitchumani, R., S.A. Strien, G.M.H. Meesters, S.H. Schaafsma, B. Scarlett, 2004. Breakage of sodium benzoate granules under repeated impact conditions. Powder Technology, 140, p 240-247 � Schmedlen, R.H., K.S. Masters, J.L. West, 2002. Photocrosslinkable polyvinyl alcohol hydrogels that can be modified with cell adhesion peptides for use in tissue engineering. Biomaterials, 23, p 4325-4332 � Siepmann, J. and N.A. Peppas, 2001. Modeling of drug release from delivery systems based on hydroxypropyl methylcellulose (HPMC). Advanced Drug Delivery Reviews, 48, p 139-157 � Soltani, S. H. Asempour, H. Jamshidi, 2007. Investigation of reaction conditions for preparation of medium molecular weight poly(vinyl alcohol) as emulsifier. Iranian Polymer Journal, 16.7, p 439-447 � Surutzidis, A., B.M. Heist, M.J. LeBlanc, April 2001. Patent US 6,221,826 B1: Laundry additive particle having multiple surface coatings, United States of America � Tanaka, S., C.C. Pin, K. Uematsu, 2006. Effect of organic binder segregation on sintered strength of dry-pressed alumina. Journal of the American Ceramic Society, 89.6, p 1903-1907 � Teunou, E. and D. Poncelet, 2002. Batch and continuous fluid bed coating – review and state of the art. Journal of Food Engineering, 53, p 325-340

� The MathWorks, 2008. Statistics Toolbox, http://www.mathworks.com/access/ helpdesk/help/toolbox/stats/f56635.html [March 11, 2008] � The United States Pharmacopeial Convention, 2008. USP-NF, http://www.usp.org/USPNF/ [February 26, 2008] � Turton, R. and X.X. Cheng, 2005. The scale-up of spray processes for granular solids and tablets. Powder Technology, 150, p 78-85 � Werner, S.R.L., J.R. Jones, A.H.J. Paterson, R.H. Archer, D.L. Pearce, 2007a. Air-suspension particle coating in the food industry: Part I –state of the art. Powder Technology, 171, p 25-33 � Werner, S.R.L., J.R. Jones, A.H.J. Paterson, R.H. Archer, D.L. Pearce, 2007b. Air-suspension particle coating in the food industry: Part II –micro-level process approach. Powder Technology, 171, p 34-45