investigation of two-stage oxygen feeding in a …eccc.uno.edu/pdf/wang-lu - 2012 - pcc...
TRANSCRIPT

1
Investigation of Two-Stage Oxygen Feeding in a Downdraft Entrained-Flow Coal Gasifier
Ting Wang and Xijia Lu [email protected], [email protected]
Energy Conversion& Conservation Center University of New Orleans
New Orleans, LA 70148, USA
Heng-Wen Hsu and Cheng-Hsien Shen [email protected], [email protected]
Green Energy and Environment Research Laboratory Industrial Technology Research Institute
310 Taiwan, R.O.C.
ABSTRACT The traditional practice of employing a two-stage coal-fed gasification process is to feed all of the oxygen to provide a vigorous amount of combustion in the first stage but only feed the coal without oxygen in the second stage to allow the endothermic gasification process to occur downstream of the second stage. One of the merits of this 2-stage practice is to keep the gasifier temperature low downstream from the 2nd stage to extend the life of refractory bricks, decrease gasifier shut-down frequency for scheduled maintenance, and reduce the maintenance costs. In this traditional 2-stage practice, the temperature reduction in the second stage is exchanged for a higher than normal temperature in the first stage. This study investigates a concept totally opposite to the traditional two-stage coal feeding practices in which the injected oxygen is split between the two stages, while all the coal is fed into the first stage. The hypothesis of this two-stage oxygen injection is that a distributed oxygen injection scheme can also distribute the release of heat to a larger gasifier volume and, thus, reduce the peak temperature distribution in the gasifier. The increased life expectancy and reduced maintenance of the refractory bricks can prevail in the entire gasifier and not just downstream from the second stage. In this study, both experiments and computational simulations have been performed to verify the hypothesis. A series of experiments conducted at 2.5-3.0 bars shows that the peak temperature and temperature range in the gasifer do decrease from 600-1550oC with one stage oxygen injection to 950-1230oC with a 60-40 oxygen split-injection. The CFD results conducted at 2.5 bars show that (a) the carbon conversion rates for different oxygen injection schemes are all above 95%, (b) H2 (about 70% vol.) dominates the syngas composition at the exit, (c) the 80-20% case yields the lowest peak temperature and the most uniform temperature distribution along the gasifier, and (d) the 40-60% case produces the syngas with the highest HHV. Both experimental data and CFD predictions verify the hypothesis that it is feasible to reduce the peak temperature and achieve more uniform temperature in the gasifier by adequately controlling a two-stage oxygen injection without changing the quality of the syngas. KEYWORDS Two-stage Oxygen feeding, Entrained-flow coal gasification, Gasification simulation, Syngas composition, Clean coal technology, Multiphase flow simulation
Proceedings of the 29th International Pittsburgh Coal Conference, Pittsburg, PA October 15 - 18
2
1. 0 INTRODUCTION 1.1 Brief Review of Fuel Feeding Scheme of Entrained Coal Gasification
Gasification is an incomplete oxidation process converting various carbon-based feedstocks into
clean synthetic gas (syngas), which is primarily a mixture of hydrogen (H2) and carbon monoxide (CO) with minor amounts of methane (CH4) and inert nitrogen gas (N2). There are four main classes of gasifiers: fixed bed gasifier, fluidized bed gasifier, entrained flow gasifier, and transport gasifier. The fixed bed gasifier and fluidized bed gasifier have low (425-650°C) and moderate (900-1050°C) outlet gas temperatures, respectively. Entrained flow gasifiers have high outlet temperatures (1250-1600°C) and operate in the slagging range (the ash is fully liquid with low viscosity). The main benefits of entrained flow gasifiers can be summarized as the ability to handle practically any coal as feed, syngas is free of oils and tars, high carbon conversion, suitable for synthesis gas products, and high throughput because of high reaction rates at elevated temperature. According to the direction of the main flow inside the gasifiers, the entrained flow gasifiers can be classified as up-flow design such as the Shell SCGP and E-gas processes, and down-flow design such as the GE and Simmens gasifiers. For down-flow coal gasifier (GE gasifier), coal slurry and oxidant are introduced from the top of the gasifier. The hot raw gas produced during the gasification process flows toward the bottom of the gasifier. The ash forming components melt in the gasifier, flow down the walls of the reactor, and finally leave the reactor as a liquid slag. Based on the fuel injection scheme, the entrained flow gasifiers can be categorized as single-stage injection and two-stage injection. The E-Gas process of ConocoPhillips features a two-stage up-flow gasifier design consisting of a horizontal cylindrical vessel as the first stage and a vertical cylindrical vessel as the second stage. Approximately 78% of the coal slurry and 100% of the oxygen are fed in the first stage. Additional coal-water slurry without oxygen is injected into this hot syngas in the second gasifier stage. Endothermic gasification reactions occur between the hot syngas and the second stage coal feed. This lowers the temperature of the syngas and increases the cold gas efficiency of the process. One of the most important advantages of this 2-stage practice is to keep the gasifier temperature low downstream from the 2nd stage and thus extends the life of the refractory bricks, decreases gasifier shut-down frequency for scheduled maintenance, and reduces maintenance costs. 1.2 Motivation, Hypothesis, and Objectives Contrast to the traditional concept of two-stage coal feeding practices of injecting coal slurry into two different stages, it is hypothesized that splitting oxygen between two stages, while feeding all the coal in the first stage, i.e., a distributed oxygen injection scheme, can distribute heat release into a larger gasifier's volume and hence reduces the peak temperature and make temperature distribution more uniform in the gasifier. In this approach, the increased life expectancy and reduced maintenance of the refractory can prevail in the entire gasifier—not just downstream from the second stage as in the traditional two-stage coal slurry fed system. To verify this hypothesis, both experiments and computational simulations are conducted. Since conducting experiments are expensive, time consuming, and usually performed with limited cases, it would be more effective and meaningful to establish a computational model to simulate effects of varying operating conditions to help obtain a preliminary understanding of the fundamental thermal-flow physics inside the gasifier. To obtain a trustful computational model, the experimental data is used to calibrate the computational model. The calibrated computational model is utilized later to perform detailed thermal-flow and chemical reaction

3
simulation for more parametric studies that have not been performed by experiments. To this end, the objectives of this paper are: 1. Conduct experiments to investigate the effect of a controlled two-stage distributed oxygen approach
on a gasifer’s inner wall temperature distribution, gasification performance, and syngas production.
2. Calibrate the CFD model with the baseline experimental data, including syngas temperature, syngas compositions, carbon conversion rate, and gasification efficiency before the water quench section.
3. Use the calibrated CFD model to simulate experimental cases with different oxygen split fed from
100% to 40% under the condition of 2.5 bars and 0.6 stoichiometric O2. 4. Investigate computationally the effect of distributed oxygen fed on gasification performance and
temperature distribution under a higher operating pressure (25 bars) and 0.4 stoichiometric O2. 2.0 EXPERIMENTAL FACILITY Industrial Technology Research Institute (ITRI) has designed a 2 ton/day, two-stage coal slurry fed, down draft entrained-flow gasifer for this study, as shown in Fig.1. This experimental facility is located in the southern Taiwanese city of Kaohsiung. The height of the gasification section above the quench section is 4831 mm, the inner diameter is 270 mm, and the thickness of the refractory is 350 mm. The coal powder is first mixed with water at a mass ratio of approximately 43% (coal)/57% (water). The coal slurry is then transported through the center tube of the injector as shown in Fig. 2. All the oxygen is fed through the outer concentric annular pipe and is mixed with the slurry coal before injection. The total oxygen fed to the gasifier is about 60% of the stochiometric amount needed for complete coal combustion. The injector is water cooled through an annular water jacket wrapping around the fuel and oxygen passages. The blunt injector tip with multiple holes is derived from a previous study which studied the performance and life expectancy of two injector's designs [1]. It was discovered that the injector with a blunt tip geometry and multiple injection holes was able to reduce temperature gradient along the injector and significantly increase the life of the fuel injector more than the injector with the conical tip. The gas temperatures are sampled with thermocouples being placed in cavities recessing one-inch in the wall. The gasification process occurs in a down-drafted mode with the syngas exiting near the bottom of the gasifier and continuously entering the quenching section. The syngas are sampled upstream (before) and downstream (after) the quench section. A detailed discussion about the quench section has been documented in Wang et al. [2]. With the purpose of finding an optimum oxygen feeding ratio between injections from the top and a second location about 1/3 from the top of the gasifer, a series of experiments were conducted. The experiment is first conducted with 100% oxygen injected from the top, but it is discovered that the temperature is too high on the top and too cold in the middle section of the gasifier. Moreover, the carbon conversion rate is poor, at around 72%. To improve the temperature distribution and carbon conversion rate, part of the oxygen up to 60% (Fig. 1), is diverted from the top injector to the side injectors in the middle section. This is done to hopefully provide more effective oxidation and hence more energy for feeding the gasification process in the middle section. The results are encouraging and show that the previous low temperatures in the middle and lower sections of the gasifier increased while the high temperature on the top reduced, resulting in a more uniform temperature distribution along the entire gasifier. More detailed analysis of the experimental results will be presented together with the computational results later.

4
2st stage opposing injectors
Top centre injector
Oxygen Oxygen
Gasifier section
Water quench section
Figure 1 ITRI coal-slurry fed, oxygen blown, downdraft entrained-flow gasifier. The outline of the gasifier is based on the outside diameter of the refractory.

5
Coal Slurry
Oxygen
Cooling Water
1.50m
m
2.0mm
1.5m
m
Figure 2 The internally premixed slurry-coal/oxygen injector with the coal-slurry fed in the center with oxygen fed through the co-centric outer annular pipe.
3.0 COMPUTATIONAL MODEL 3.1 GLOBAL GASIFICATION AND CHEMICAL REACTIONS This study deals with the global chemical reactions of coal gasification [3] that can be generalized in reactions (R1.1) through (R1.10) in Table 1.
Table 1 Summary of reaction rate constants used in this study
Reactions Reaction Type Reaction
heat,ΔH°R (MJ/kmol)
k = ATnexp(-E/RT) (n=0) Reference
A E(J/kmol)
Heterogeneous Reactions
R 1 C(s) + ½ O2 → CO Partial combustion -110.5 0.052 6.1×10⁷
Chen et al.(2000)R 2 C(s) + CO2 → 2CO Gasification, Boudouard reaction +172.0 0.0732 1.125×10⁸
R 3 C(s) + H2O → CO + H2 Gasification +131.4 0.0782 1.15×10⁸ Homogeneous Reactions
R 4 CO + ½ O2 → CO2 Combustion -283.1 2.2×10¹² 1.67×10⁸ Westbrook andDryer (1981)
R 5 CO+H2O(g)↔CO2+H2 Water Gas shift -41.0 2.75×10¹⁰ 8.38×10⁷ Jones and Lindstedt(1998)
R 6 CO + 3H2 ↔ CH4 + H2O Methanation -205.7 kf = 4.4×10¹¹ 1.68×10⁸ kb = 5.12×10⁻¹⁴ 2.73×10⁴ Benyon P.(2002)
R 7 CH2.997O0.3456 → 0.3456CO + 0.1897H2 + 0.6544CH4 (Two-step Volatiles Cracking) +12.088
Eddy dissipation N/A R 8 CH4 + ½O2 → CO+2H2
Volatiles gasification via CH4 -35.71
R 9 C2H2 + O2 → 2CO + H2 Volatiles gasification via C2H2
-447.83
R10 H2 + ½ O2→ H2O Oxidation -242 6.8x10¹⁵ 1.68x10⁸ Jones and Lindstedt (1998)
1) All ΔH°R at 298K and 1 atm. 2) “+” Endothermic (absorbing heat), “-” Exothermic (releasing heat)

6
In this study, the methanation reactions are not considered since the production of methane is negligible under the studied operating conditions. The volatiles are modeled to go through a two-step thermal cracking process (R7) and gasification processes (R8, R9) with CH4 or C2H2 as the intermediate products. The coal used in this study is Chinese Shanxi Pinghsuo coal, and its compositions are given in Table 2. The compositions of volatiles are derived from the coal’s heating value, proximate analysis, and ultimate analysis. For the reaction rate of water-gas shift (WGS) reaction (R5), Lu and Wang [4] tested Jones’ rate by comparing the syngas composition results with the experimental data and decided to slow down the rate constant to A=2.75. Consequently, A=2.75, E=8.38×10⁷ is used for the WGS reaction rate in this report.
Table 2 The proximate and ultimate analyses of Chinese Shanxi Pinghsuo coal
Coal Pingshuo Coal Proximate Analysis, wt % Moisture 4.31
32.6 13.52 49.57
VM Ash Fixed Carbon Heating value (kcal/kg)
6612
3.2 Computational Methology The computational model and submodels (devolatilization, reactions, particle dynamics,
gasification) used in the study are the same as developed by Silaen and Wang (2010) [5], as well as Lu and Wang (2011) [4]. Therefore, the governing and associated equations and detailed modeling intricacies are not repeated here, but they are briefly summarized below. The time-averaged steady-state 3-D Navier-Stokes equations as well as the mass and energy conservation equations are solved. Species transport equations are solved for all gas species involved. Silaen and Wang (2010) applied five turbulence models (standard k-ε, k-ω, RSM, k-ω SST, and k-ε RNG) and reported that the RMS model predicted the best results. However, the standard k-ε turbulence model yields reasonable results without requiring significant computational time when compared to the more elegant RSM model. Therefore, the standard k-ε turbulence model is used in this study to provide closure. Enhanced wall function and variable material property are used. The P1 model is used for computing the radiation effect.
The flow (continuous phase) is solved in Eulerian form as a continuum while the particles
(dispersed phase) are solved in Lagrangian form as a discrete phase. Stochastic tracking scheme is employed to model the effects of turbulence on the particles. The continuous phase and discrete phase are communicated through drag forces, lift forces, heat transfer, mass transfer, and species transfer. The finite-rate combustion model is used for the heterogeneous reactions, but both the finite-rate and eddy-dissipation models are used for the homogeneous reactions, and the smaller of the two is used as
Ultimate Analysis, wt % Moisture 2.04
12.69 70.94 4.78 0.78 0.58 8.19
Ash C H N S O

7
the reaction rate. The finite-rate model calculates the reaction rates based on the kinetics while the eddy-dissipation model calculates based on the turbulent mixing rate of the flow. Gasification or combustion of coal particles undergoes the following global processes: (i) evaporation of moisture, (ii) devolatilization, (iii) gasification to CO and (iv) combustion of volatiles, CO, and char. The Chemical Percolation Devolatilization (CPD) model [6] [7] [8] is chosen as the devolatilization model based on the finding by Silaen and Wang (2010) [5] that the Kobayashi two-competing rates devolatilization model [9] is very slow while the CPD model gives a reasonable result.
For solid particles, the rate of depletion of the solid, due to a surface reaction, is expressed as a
function of kinetic rate, solid species mass fraction on the surface, and particle surface area. The reaction rates are all global net rates, i.e., the backward reaction, calculated by equilibrium constants, are included in the global rate. Therefore, the finite rate employed in this study implicitly applies to the local equilibrium approach. Reaction rate constants used in this study are summarized in Table 1.
For liquid droplets, water evaporates from the particle’s surface when the temperature is higher
than the saturation temperature (based on local water vapor concentration). The evaporation is controlled by the water vapor partial pressure until 100% relative humidity is achieved. When the boiling temperature (determined by the air-water mixture pressure) is reached, water continues to evaporate even though the relative humidity reaches 100%. After the moisture is evaporated, due to either high temperature or low moisture partial pressure, the vapor diffuses into the main flow and is transported away. Please refer to Silaen and Wang [5] for details. 3.3 Computational Domains
The computational domain and elements on the gasifier wall are shown in Figure 3. The computational domain contains roughly 1.1 million elements. FLUENT 12.0.16 from ANSYS, Inc. is used as the CFD solver. The simulation is steady-state and uses the segregated solver, which employs an implicit pressure-correction scheme and decouples the momentum and energy equations. The SIMPLE algorithm is used to couple the pressure and velocity. Second order upwind scheme is selected for spatial discretization of the convective terms and species. For the finite rate model where the Eulerian-Lagrangian approach is used, the iterations are conducted alternatively between the continuous and the dispersed phases. Initially, two iterations in the continuous phase are conducted followed by one iteration in the discrete phase to avoid the flame from dying out. Once the flame is stably established, five iterations are performed in the continuous phase followed by one iteration in the dispersed phase. The drag, particle surface reaction, and mass transfer between the dispersed and the continuous phases are calculated. Based on the dispersed phase calculation results, the continuous phase is updated in the next iteration, and the process is repeated. Converged results are obtained when the residuals satisfy mass residual of 10-3, energy residual of 10-5, and momentum and turbulence kinetic energy residuals of 10-4. These residuals are the summation of the imbalance in each cell, scaled by a representative for the flow rate.
8
2st stage opposing injectors
Top centre injector
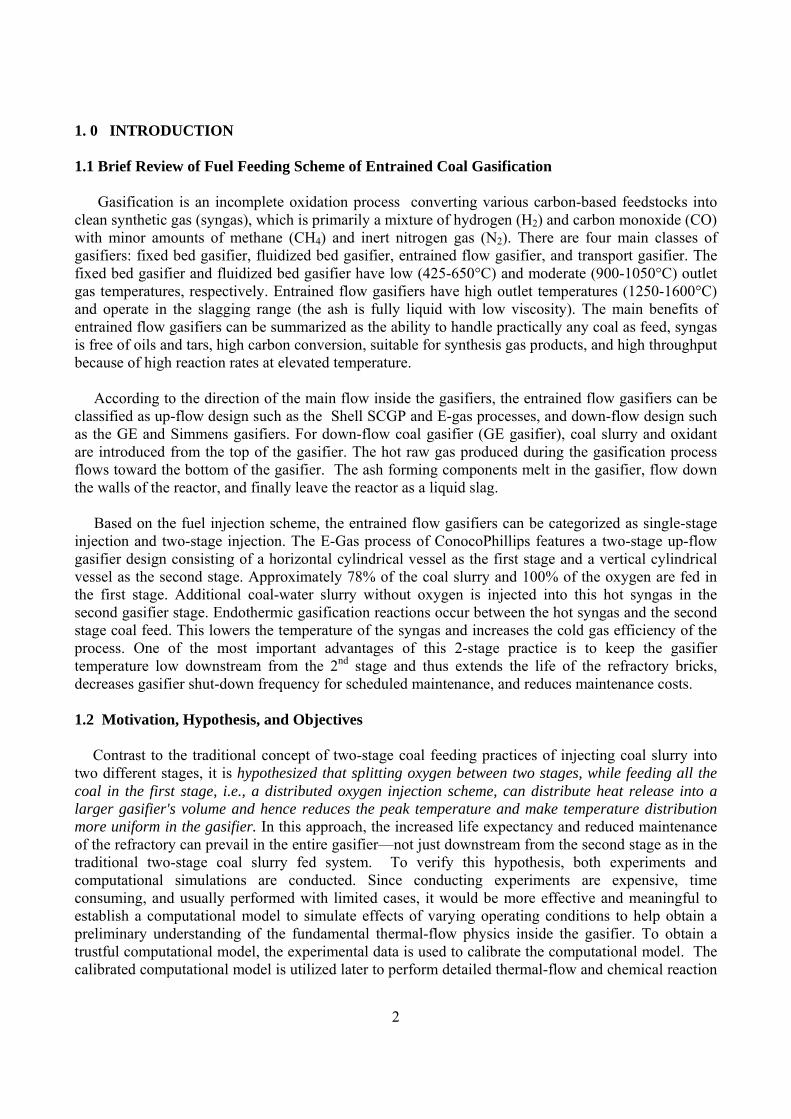
• Pressure: 2.5- 3 atm • No slip condition at wall • Adiabatic walls • Inlet turbulence intensity 10% • Injection nozzle: 5 mm in diameter
Oxygen Oxygen
Coal&Oxygen
4831mm
Raw Syngas 270mm
2421.2mm
Figure 3 Meshed computational domain of the two-stage entrained-flow gasifier
3.4 Boundary and Inlet Conditions
The summary of the studied cases is listed in Table 3. In Case 1, a two-stage configuration is used with oxygen distribution of 100%-0% between the top and the second stages. The coal is fed as slurry. The total mass flow rate of the coal slurry is 92 kg/hr (0.026 kg/s), and the total volume flow rate of oxidant is 36.8 Nm3/s (0.0146 kg/s). The top and the second injection nozzles are both 5 mm in diameter. To match the experimental conditions, the operating pressure is set as 3 bars for Case 1. From Case 2 to Case 8, the oxygen distribution is 100%-0%, 90%-10%, 80%-20%, 70%-30%, 60%-40%, 50%-50%, 40%-60% between the top and the second injection stages respectively. Total mass flow rate of the coal slurry is 85 kg/hr (0.024 kg/s), and the total volume flow rate of oxidant is 38.6 Nm3/s (0.0153 kg/s). The operating pressure is 2.5 bars for Cases 2 to 8.
The above eight cases from 1-8 are set up with the same operating conditions as the experiments. The following five cases from Cases 9-12 increase the operating pressure to 25 bars at which no experiments have been conducted in the current facility. From Case 9 to Case 12, the oxygen distribution between the top and the second injection stages is 100%-0%, 80%-20%, 60%-40%, 40%-60% respectively. Total mass flow rate of the coal slurry is 85 kg/hr (0.024 kg/s), and the total volume flow rate of the oxidant is 17.4 Nm3/s (0.006912 kg/s), which is 30% of the stoichiometric amount for complete combustion. The experimental Case 1 serves as the baseline case, which is used to calibrate

9
the computational Case 1. The calibration is performed by tuning the stochastic time constant and the water-gas shift reaction rate.
Table 3 Parameters and operating conditions of the studied cases
Case 1 Cases 2 - 8 Cases 9 - 12 O2 distribution (top-second) 100%-0% (100%-0%)-(40%-60%) (100%-0%)-(40%-60%) Coal slurry injection (kg/s) 0.026 0.024 0.024
O2 injection (kg/s) 0.0146 0.0153 0.009216 Operating pressure (bars) 3.0 2.5 25
The oxidant is considered to be a continuous flow, and the coal particles are considered to be the discrete phase. The discrete phase includes the fixed carbon and liquid water droplets from both the inherent moisture content of coal (4.31% wt) and the injected water content form the coal slurry (57.1% wt). Other components of the coal, such as N, H, S, O, and ash, are injected as gas together with the oxidant in the continuous flow to keep the mass flow the same as in the experiments. N is treated as N2, H as H2, and O as O2. S and ash are not modeled, and their masses are lumped into N2. Since studying the effect of coal particle sizes on gasification performance is not in the objectives of this study, the coal slurry size is uniformly given as 50 μm for the purpose of conveniently tracking the change of particle sizes. The effect of coal particle size on gasification process has been discussed in [5].
The walls are assigned as adiabatic with internal emissivity of 0.8. The boundary condition of the discrete phase at walls is assigned as “reflect”, which means the discrete phase elastically rebound off once reaching the wall. At the outlet, the discrete phase simply escapes/exits the computational domain. An area near the coal injection locations is initially patched with temperature of 1500K to simulate the ignition process of a real operation. The limit of the highest temperature is assigned as 5000K, and the limit of the lowest temperature is assigned as 400K. This will remove potential runaway conditions caused by erratic, unreasonably high, or low temperatures during the iteration process.
4.0 RESULTS AND DISCUSSIONS
4.1 Comparison between CFD results and experimental data
The computational cases 1-8 are conducted with the conditions matching those in the experiments. Among these eight cases, the detailed temperature and species distributions of Case 1 and Case 6 are exhibited to gain fundamental understanding of the thermal-flow behavior inside the gasifer. The conditions of these two cases are listed below.
• Case 1: Oxygen distribution (100%-0%), coal slurry (92 kg/hr), oxidant (36.8 Nm3/s or 0.0146 kg/s), ad operating pressure (3 bars).
• Case 6: Oxygen distribution (60%-40%), coal slurry (85 kg/hr), oxidant (38.6 Nm3/s or0.0153 kg/s), and operating pressure (2.5 bars).
4.1.1 Case 1 (100%-0% for Oxygen distribution) Case 1 is the two-stage oxygen-blown operation with the oxygen distribution being 100%-0% between the top and the second stages. Gas temperature and species mole fraction distribution on the horizontal and selected center vertical planes in the gasifier are shown in Fig. 4. Since all the fuel is injected from the top, the gas temperature is higher in the top injection region than at the second stage
10
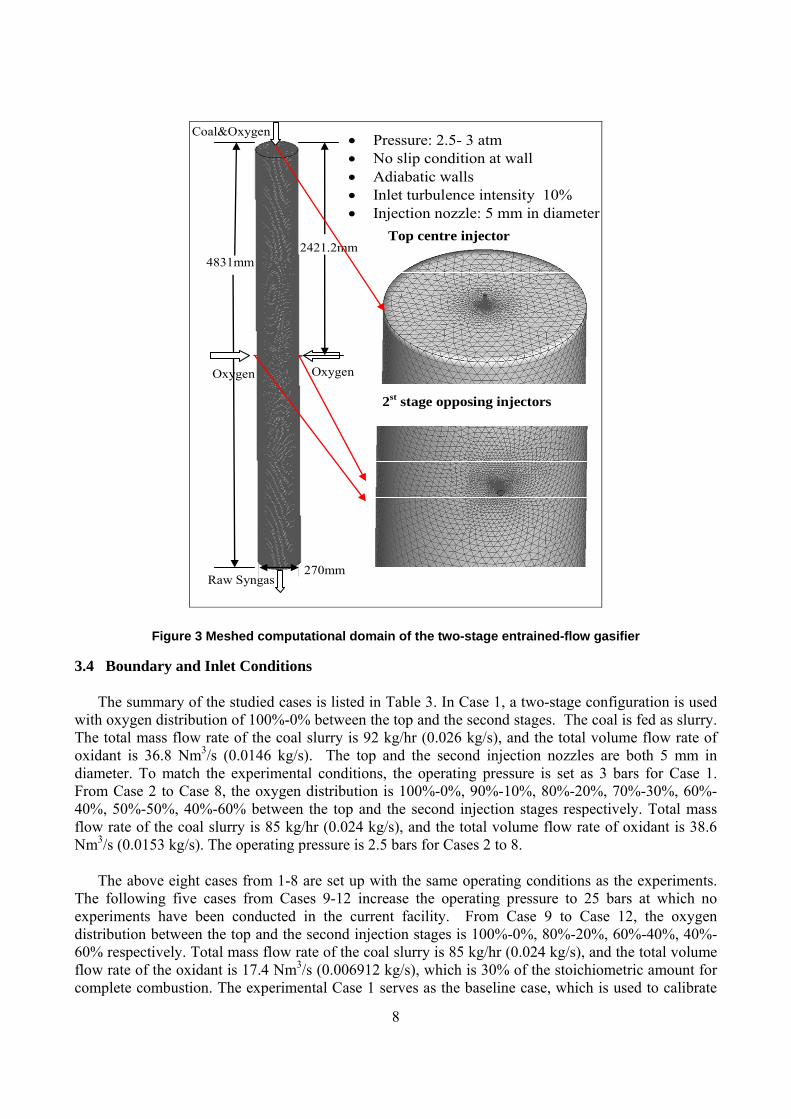
location. Maximum gas temperature in the top injection stage reaches 2300K. The dominant reaction in the top injection stage is the intense char combustion (C + ½ O2 → CO and CO + ½ O2 → CO2) in the first stage and gasification reactions (mainly C + ½ CO2 → CO, C + H2O → CO + H2) in the second stage. Due to the exothermic property of combustion process and endothermic property of the gasification reactions, the temperature drops gradually from top injection to the exit of the gasifier. Oxygen is completely depleted through the char combustion in the top injection region.
Table 4 shows the temperature and syngas composition at exit for both CFD results and the experimental data of Case 1. Since measurement of steam under exit condition (3bar, 1000K) is very uncertain, the data of syngas volume fractions at the exit in Table 4 have been normalized without including the steam as CO+CO2+H2+CH4=1. From Table 4, it can be clearly observed that the syngas composition predicated by the CFD results deviates appreciably from the experimental data. The mass-weighted exit temperature is about 60K higher than the measured data. This higher CFD-predicted exit temperature could be attributed to the assumption that the wall is adiabatic. Table 4 Comparison of the CFD results with the experimental data at exit for Case 1. The syngas composition is normalized without water.
Normalized composition Exp. data CFD results
CO (Vol) 41% 31% CO2 (Vol) 25% 37% H2 (Vol) 33% 26%
CH4 (Vol) 1% 6% Temperature (K) 954 1044
Figure 4 Gas temperature and species mole fraction distributions for Case 1 (100%-0% for oxygen distribution)

11
4.1.2 Case 6 (60%-40% for Oxygen distribution) Case 6 is the two-stage oxygen-blown operation with oxygen distribution of 60%-40% between the first and the second stages. Gas temperature and species mole fraction distribution on the horizontal and center vertical planes in the gasifier are shown in Fig. 5. The gas temperature is higher at the second stage injection region than at the top injection region. Maximum gas temperature reaches 2600K at the second stage injection location and 1900K at the top injection stage. The dominant reaction near the top injection location is the intense char combustion (C + ½ O2 → CO and CO + ½ O2 → CO2); then the endothermic gasification reactions occur in the region between the first and second stage injection locations as can be seen by increased CO and H2 but reduced temperature. WGS also occurs, evident by reduced H2O. At the second stage injection location, unburned char, CO and H2 quickly react with injected oxygen from two sides and release the second wave of combustion/oxidation heat (C + ½ O2 → CO, CO + ½ O2 → CO2 and H2 + ½ O2→ H2O). The gasification reactions dominate the process after the oxygen is completely consumed in the region between the second stage injection location and the gasifier's exit.
Figure 5 Gas temperature and species mole fraction distributions for Case 6 (60%-40% for oxygen distribution) Table 5 shows the temperature and syngas composition at exit for both CFD results and the experimental data of Case 6. The data of syngas volume fractions at exit have been normalized by CO+CO2+H2+CH4=1. Similar to the previous conclusion of section 4.1.1, the syngas composition predicated by the CFD results still deviates appreciably from the experimental data, especially for the mass fraction of steam content and temperature at exit of the gasifier. The calculated temperature is shown in Table 5 by two values. The first value (1550K) is the mass flow weighted average temperature over the cross-section on the exit plane, and the second value (1496K) is the mass flow weighted average temperature in the near-wall region (5 mm to the wall). The near-wall temperature is more comparable to the experimental data (1150K) because the

12
thermocouples were placed in cavities recessing in the wall, and the measured data reflects the hot gases temperature near the wall. Figure 6 shows the temperature contour on the cross-section of the exit plane. It clearly shows that the temperature changes significantly from the center at around 2000K to around 1200K in the near-wall region. Table 5 Comparison between the CFD result and the experimental data at exit for Case 6 (60%-40% oxygen distribution).The syngas composition is normalized without water.
Case 6 Exp. Data CFD results CO (Vol) 41% 31% CO2 (Vol) 29% 39% H2 (Vol) 30% 24%
CH4 (Vol) 0% 6% Temperature (K) 1150 1550 (cross-section average)
1496 (near-wall average)
Radial direction (m)
Tem
pera
ture
(K)
r O
Figure 6 Gas temperature distribution at exit cross-sectional plane of the gasifier for Case 6 (60% - 40% oxygen distribution) 4.2 Effect of Oxygen injection distribution under the experimental condition (Operating pressure: 2.5 bars, O2: 0.6 of stoichiometric amount)
To investigate the effect of different oxygen-distribution feeding schemes on the gasification performance under the low operating pressure condition, seven computational simulations cases corresponding to the experimental conditions (operating pressure: 2.5 bars, O2: 0.6 of stoichiometric amount for complete combustion) are conducted with the oxygen fed from top at 100%, 90%, 80%, 70%, 60%, 50%, and 40% respectively. These cases are numbered from Case 2 to Case 8 as shown in Table 3. The CFD results of these 7 cases are compared with the experimental data in Table 6, including the syngas composition at exit, the syngas temperature at four locations (Texit = TE-300-4,

13
T2 =TE-300-8, T3=TE-300-12, T4 = TE-300-13), carbon conversion rate (CCR), and the higher heating value (HHV). The comparisons are shown graphically in Figs. 6 and 7. Table 6 CFD results of syngas compositions, syngas temperatures at different locations, carbon conversion rate, and HHV for Cases 2 to 8
O2 distribution
Case 2 100%-0%
Case 3 90%-10%
Case 4 80%-20%
Case 5 70%-30%
Case 6 60%-40%
Case 7 50%-50%
Case 8 40%-60%
CO2 (Vol) 0.256 0.252 0.245 0.233 0.222 0.238 0.240 CO (Vol) 0.113 0.117 0.140 0.160 0.170 0.154 0.125 H2O (Vol) 0.520 0.516 0.475 0.455 0.430 0.460 0.515 H2 (Vol) 0.082 0.090 0.115 0.130 0.158 0.130 0.107 CH4 (Vol) 0.029 0.025 0.025 0.022 0.020 0.018 0.013 T4(K) 1892 1689 1627 1530 1450 1325 1174 T3(K) 1439 1301 1228 1186 1164 1154 1071 T2(K) 1237 1329 1590 1769 1934 2267 2484 Texit (K) 1052 1101 1242 1314 1577 1647 1859 CCR 72.90% 74.62% 85.86% 93.02 98.88% 99.22% 99.94% HHV(kJ/kmol) 73,180 78,455 97,559 110,776 127,713 109,078 89,284
Figures 7 and 8 show that both the experimental data and the CFD results yield the same trend of change for temperature and syngas composition at the exit as the oxygen feeding distribution changes between two stages. When the percentage of oxygen injected from top reduces from 100% to 40%, the temperature decreases at the first stage (T4 and T3) and increases at the second stage (T2 and Texit). This is because if less oxygen is injected from the top then less char will go through the exothermic combustion process and less combustion heat is released. At the first glance, the variation trends appear to reverse around 60%-50%. Therefore, the analysis and explanations are separated into two parts based on the oxygen distribution on the top: 100%-60% vs. 60%-40%. 100%-60% top O2 injection – Mole fractions of CO and H2 at the exit increase when the top injected oxygen reduces from 100% to 60% for CFD results (100% to 50% for experimental data), but they reduce when the top injected oxygen decreases from 60% to 40% for CFD results (50% to 40% for the experimental data). The mole fraction of CO2 has the opposite changing trend. 60%-40% top O2 injection – If the mass fraction of top injected oxygen continues to reduce below 60%, there is more unburned char going though the gasification process (mainly C + ½ CO2 → CO, C + H2O → CO + H2), resulting in more production of CO and H2 at the first stage. At the second injection stage, some of the injected oxygen reacts with CH4 to produce CO and H2. Therefore, the total amount of CO and H2 increases, and CO2 decreases at the exit of gasifier. However, if more than 40%-50% of the total oxygen is injected from the second injection location, more CO and H2, which were produced through the gasification process at the first stage, react with the oxygen through the combustion process at the second stage and result in more CO2 and H2O. Therefore, as indicated in Figs. 7 and 8, CO and H2 decrease and CO2 and H2O increase at the exit of the gasifier when the portion of oxygen injected from the top is reduced from 60% to 40% based on the CFD results (or 50% to 40% based on experimental data). Meanwhile, the carbon conversion rate increases, and the exit mole fraction of CH4 reduces when the percentage of oxygen injected from the top reduces from 100% to 40%. The reason for this trend is

14
that the unburned char and CH4 react with oxygen through C + ½ O2 → CO and CH4 + ½ O2 → CO + 2H2 at the second injection stage. When oxygen injected from the second stage increases beyond 40%, the carbon conversion rate reaches 99%. One of the advantages of employing the two-stage oxygen control is to reduce the wall temperature gradient, and hence, reduction of thermal stress along the gasifier. The experimental results in Fig. 7a show that the overall near-wall temperature difference in the gasifier is reduced to a narrower range of 900 – 1200oC with a 60%-40% two-stage oxygen injection split from a wider range of 600-1500oC with 100% top injection. In contrast, the CFD result in Fig. 6b shows that the case of 80%-20% yields the most uniform syngas temperature ranging from 955oC to 1354oC, and the case of 60%-40% in Table 6 yields the highest syngas HHV (127,713 kJ/kmole). The near-wall temperature prediction in Fig. 7c shows lower values than those in Fig. 7b. The case of 80%-20% yields the lowest peak temperature and most uniform syngas temperature ranging from 850oC to 1100oC.
(a) Experimental data (in wall cavities)
Texit T2
T3
T4
Texit T2 T3 T4
(b) (c)
Figure 7 The effect of two-stage oxygen injection distribution on the gasifier wall temperature (a) experimental data (in wall cavities) (b) CFD results of mass-weighted syngas temperaturee for Cases 2 to 8 (c) CFD results for near-wall temperature (5mm to the wall) (Note: Texit , T2, T3, and T4 in this figure correspond to TE-300-4, 8, 12, and 13 in Fig. 1.)

15
(a) Experimental data (b) CFD results Figure 8 The effect of two-stage oxygen injection distribution on the syngas compostion for (a) experimental data and (b) CFD results (Cases 2 to 8)
4.3 Effect of Oxygen Injection Distribution under High Operating Pressure Condition (operating pressure: 25 bars, O2: 0.4 of stoichiometric amount)
Since most of the gasifiers are operated under the condition with high pressures above 25 bars and low sub-stochiometric oxygen feeding below 40%, the rest of the analysis will be focused on presenting the CFD simulation at a high pressure (25 bars) and low oxygen ratio (0.4 of the stoichiometric amount for complete combustion). In total, four cases (Cases 9 to 12 as listed in Table 3) have been conducted.
Similar to the discussion in section 4.2, the syngas composition and temperature at different locations, CCR and HHV for Cases 9- 12 are provided in Table 7 and Figs. 9. The results are summarized below.
1) Compared to the results of the low operating pressure cases, the carbon conversion rates for
different oxygen injection distribution are all above 95% in high operating pressure cases. The longer particle residence time is the major reason for achieving a higher carbon conversion rate. The average residence time is about 6-7 seconds for the high pressure cases while it is 3-4 seconds for the low-pressure cases.
2) Both the high operating pressure and low pressure cases yield the same trend of change for exit
average temperature as the oxygen feeding distribution changes between two stages. 3) Consistent with the low pressure cases, the changing trend of syngas composition reverses the
direction at the 60%-40% case, and the 80%-20% case produces the lowest peak temperature and most uniform temperature in the gasifer.
4) As more oxygen is injected at the second stage, CO and CO2 have the same trend of change as in
the low pressure condition; however, H2O and H2 changes in the opposite direction.
16
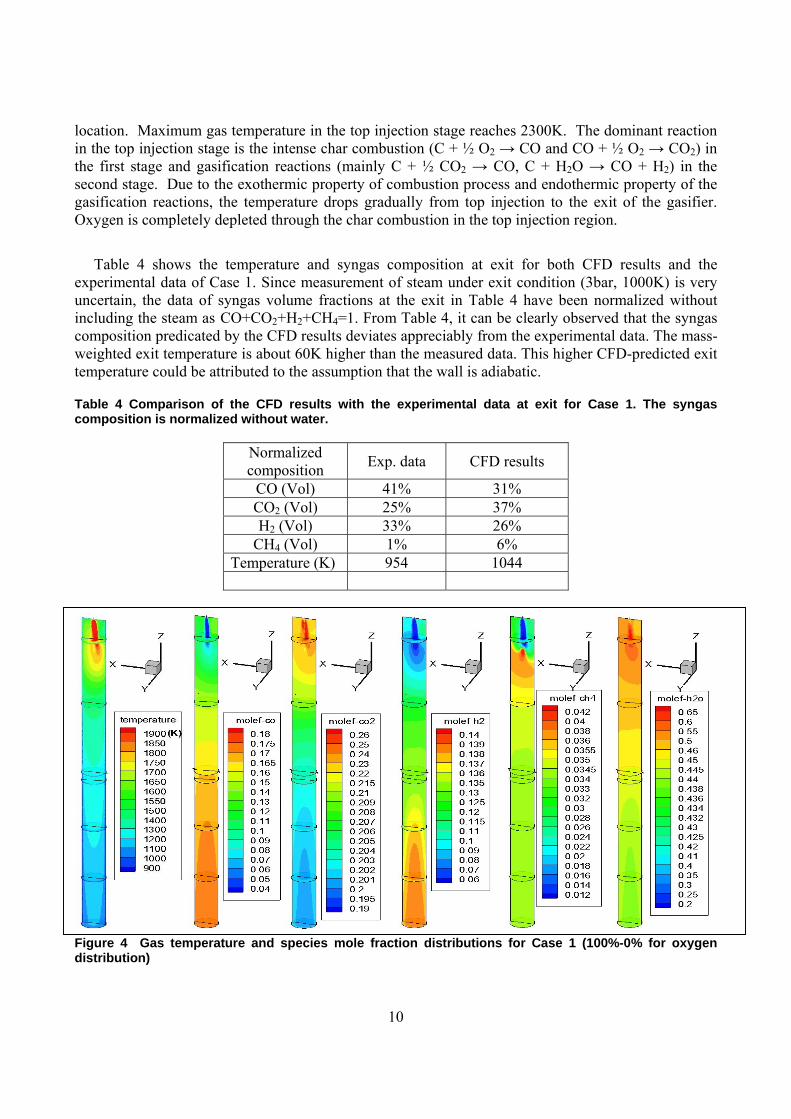
5) The major differences between the high and the low pressure cases are: (a) the average
temperature is much lower at each corresponding location in the 25 bars condition; (b) H2 dominates the syngas composition (about 70% vol.) at 25 bars case. This phenomenon is caused by less oxygen injection and longer coal particle residence time. More coal particles have enough time to go through the gasification process, and the endothermic gasification reactions result in lower syngas temperature.
6) The 40%-60% case produces the syngas with the highest HHV in the 25 bar case vs. 60%-40%
case in the 2.5 bars cases.
Table 7 CFD predicted syngas conditions at 25 bars for Cases 9 to 12
O2 distribution Case 9 100%-0%
Case 10 80%-20%
Case 11 60%-40%
Case 12 40%-60%
CO2 Vol(Mass) 0.056(0.285) 0.057(0.275) 0.059(0.263) 0.053(0.268) CO Vol(Mass) 0.103(0.328) 0.115(0.343) 0.131(0.359) 0.105(0.332) H2O Vol(Mass) 0.067(0.123) 0.078(0.126) 0.097(0.155) 0.078(0.140) H2 Vol(Mass) 0.734(0.186) 0.712(0.180) 0.674(0.153) 0.726(0.182) CH4 Vol(Mass) 0.037(0.072) 0.037(0.069) 0.036(0.063) 0.035(0.068) T4(K) 1395 1162 1067 1014 T3(K) 1383 1247 1169 1116 T2(K) 1129 1220 1472 1506 Texit (K) 838 915 986 1033 CCR 99.99% 95.34% 98.88% 99.97% HHV(kJ/kmol) 392,295 391,271 376,653 395,495
Texit T2 T3 T4
Syng
as m
ass
fract
ion
(%)
Percentage of Oxygen from burner (%) Figure 9 The effect of two-stage oxygen injection distribution on the syngas temperature and syngas composition (Mass fraction) for Cases 9 to 12 (Note: The temperature locations T1, 2,3,4 in this figure correspond to TE-300-4, 8, 12, and 13 in Fig. 1. )

17
5.0 CONCLUSION 1. In the top-injection base case, the CFD predicts that the exit temperature is satisfactorily within
90oC (or 9%) from the experimental data. However, the CFD predicts relatively lower H2 and CO composition but higher CO2 at the exit.
2. The experiments at 2.5 bars show the 60%-40% oxygen distribution yields the most uniform wall
temperature along the gaisifer. 3. In cases of split two-stage oxygen injections from 100% to 40% with 0.6 stoichiometric oxygen at
2.5 bars, the CFD predicts (a) the similar trend of changing temperature and syngas compositions in the experimental data, but lower H2 and CO mole fractions than the experimental data, (b) the 80-20% case yields the lowest peak temperature and the most uniform gas temperature distribution along the gasifier, and (c) the 60%-40 case produces the syngas with the highest HHV.
4. The CFD's prediction of the effect of oxygen distribution under 25 bars operating pressure case
shows that (a) the carbon conversion rates for different oxygen injection schemes are all above 95%, (b) H2 (about 70% vol.) dominates the syngas composition at exit, (c) same as in the 2.5 bar cases, the 80-20% case yields the lowest peak temperature and most uniform gas temperature distribution along the gasifier, and (d) the 40-60% case produces the syngas with the highest HHV.
Both experimental data and CFD predictions verify the hypothesis that it is feasible to reduce the peak temperature and achieve more uniform temperature in the gasifier by adequately controlling two-stage oxygen injection without changing the quality of the product syngas. 6.0 ACKNOWLEDGMENT This study was partially supported by the Louisiana Governor’s Energy Initiative via the Clean Power and Energy Research Consortium (CPERC) administered by the Louisiana Board of Regents. The ITRI gasifier was funded by the Taiwan Bureau of Energy. 7.0 REFERENCES
[1] Wang, T., Silaen, A., Hsu, H. W., and Shen, C. H., 2010, "Investigation of Heat Transfer and Gasification of Two Different Fuel Injectors in an Entrained-Flow Gasifier," ASME Journal of Thermal Science and Engineering Applications, Vol.2, pp. 011001/1-10, March
[2] Wang, T., Lu, X., Hsu, H. W., and Shen, C. H., 2011 " Investigation of the Performance of
Syngas Quench Cooling Design in a Downdraft Entrained Flow Gasifier," Paper 45-2, Proceedings of the 28th International Pittsburgh Coal Conference, Pittsburgh, Pennsylvania, Sept. 12-15, 2011
[3] Smoot, D.L., and Smith, P.J., Coal Combustion and Gasification, Plenum Press, 1985. [4] Lu, X., and Wang, T., 2011, “Water-Gas Shift Modeling in Coal Gasification in an Entrained-Flow
Gasifier,” Paper 45-1, presented at the 28rd International Pittsburgh Coal-Gen Conference, Pittsburgh, Pennsylvania, Sept. 15-18, 2011.

18
[5] Silaen, A. and Wang, T., 2010,“Effect of Turbulence and Devolatilization Models on Gasification Simulation”, International Journal of Heat and Mass Transfer, Vo. 53, pp. 2074-2091, 2010.
[6] Fletcher, T.H., Kerstein, A.R., Pugmire, R.J., and Grant, D.M., 1990, “Chemical Percolation Model
for Devolatilization: 2. Temperature and Heating Rate Effects on Product Yields”, Energy and Fuels, Vol. 4, pp. 54-60, 1990.
[7] Fletcher, T.H., and Kerstein, A.R., “Chemical Percolation Model for Devolatilization: 3. Direct
Use of 13C NMR Date to Predict Effects of Coal Type”, 1992, Energy and Fuels, Vol. 6, pp. 414-431, 1992.
[8] Grant, D.M., Pugmire, R.J., Fletcher, T.H., and Kerstein, A.R., 1989, “Chemical Percolation of
Coal Devolatilization Using Percolation Lattice Statistics,” Energy and Fuels, Vol. 3 pp. 175-186. [9] Kobayashi, H., Howard, J.B., and Sarofim, A.F., 1976, “Coal Devolatilization at High
Temperatures”, 16th Symposium (International) on Combustion, 411-425.