investigation of thermal spread during electrosurgical coagulation in
TRANSCRIPT

INVESTIGATION OF THERMAL SPREAD DURING
ELECTROSURGICAL COAGULATION IN
NEUROSURGERY
by
Kuen-Ren Chen
A dissertation submitted in partial fulfillment
of the requirements for the degree of
Doctor of Philosophy
(Mechanical Engineering)
in The University of Michigan
2013
Doctoral Committee:
Professor Albert J. Shih, Chair
Assistant Professor Kira L. Barton
Associate Professor Joseph L. Bull
Professor Katsuo Kurabayashi
Assistant Professor Chia-Ying Lin

© Kuen-Ren Chen 2013
All Rights Reserved

ii
ACKNOWLEDGEMENTS
I truly appreciate the countless support and help provided by many people in the
way to my degree.
First, I would like to thank my advisor, Professor Albert Shih for giving me this
opportunity to come to University of Michigan. He is always there for his students,
providing help and guidance for not only research but also career development. His
enthusiasm in research and teaching are the key to the finish of my degree. He is very
patient with me revising manuscripts and my dissertation. I greatly appreciate his vision
that prepares me as a junior researcher in many aspects. Last, I would like thank him for
his understanding of my frequent travelling between Ann Arbor and Madison.
I would also like to thank all my committee members, Professors Kira Barton,
Joesph Bull, Katsuo Kurabayashi, and Chia-Ying Lin for their guidance and critiquing of
my thesis as it progressed. I appreciate their support and advice throughout this entire
process. Special thanks to Professor Joesph Bull. Joining his Biotransport lab has inspired
me in many ways.
I would like to thank all my fellow lab mates in WuMRC and Biotransport lab.
Among them, I must give my deepest thanks to Drs. Robert Dodde and Matthew
Chastagner. Without their pioneer work in the field of electrosurgery, I would not have
done my study today. In the early years of my Ph.D life, they have been extremely
helpful to all my experimental and modeling work. Drs. Bruce Tai and Yancheng Wang
are always there when I have all sorts of questions. Dr. Carl McGill, Jorge Sanz-Guerrero,
Barry Belmont, and Jeff Plott all provided me numerous supports.
This thesis would also not have been possible without the help of many people
from across the University. Drs. Paul Park, Khoi Than, and Anthony Wang of
iii
Neurosurgery Department and Gail Rising from ASOR did a lot of help in all the animal
experiments. Many special thanks go to Dr. Roscoe Warner of Pathology Department for
the early exploring experiments on mice. Toby Donajkowski has always been a great
consultant in terms of machining and mechatronics.
Last but not least, I owe my greatest thank you to my family, especially my lovely
wife, Ruby for their support and encouragement. It has not been easy to be apart for Ruby
and me throughout these years. We are finally a step forward to be together. Without her
patience and understanding, I would not have been able to accomplish this. I love you.
iv
TABLE OF CONTENTS
ACKNOWLEDGEMENTS ................................................................................................ ii
LIST OF FIGURES .......................................................................................................... vii
LIST OF TABLES .............................................................................................................ix
CHAPTER 1 INTRODUCTION ...................................................................................... 1
1.1 Motivation ............................................................................................................ 1
1.2 Research Objectives and Tasks ............................................................................ 3
1.3 Organization of the Dissertation .......................................................................... 3
CHAPTER 2 COMPARISON OF THERMAL COAGULATION PROFILES FOR
BIPOLAR FORCEPS WITH DIFFERENT COOLING MECHANISMS IN A PORCINE
MODEL OF SPINAL SURGERY...................................................................................... 7
2.1 Introduction .......................................................................................................... 8
2.2 Materials and Methods ....................................................................................... 10
2.3 Results ................................................................................................................ 13
2.4 Discussion .......................................................................................................... 16
2.5 Conclusions ........................................................................................................ 18
CHAPTER 3 ELECTROSURGICAL VESSEL SEALING TISSUE TEMPERATURE:
EXPERIMENTAL MEASUREMENT AND FINITE ELEMENT MODELING ........... 22
3.1 Introduction ........................................................................................................ 23
3.2 Experimental Setup ............................................................................................ 25

v
3.3 Finite Element Modeling .................................................................................... 26
3.3.1 Thermo-Electrical FEM Formulation ......................................................... 26
3.3.2 Electrode and Blood Material Properties and Tissue Thermal Conductivity
.....................................................................................................................27
3.3.3 FEM Mesh, Boundary Conditions, and Solver .......................................... 28
3.3.4 Three FEM Techniques to Model: Evaporation, Water Loss, and Tissue
Fusion .....................................................................................................................32
3.4 Experimental Results and Validation of FEM ................................................... 36
3.4.1 Experimental Results .................................................................................. 36
3.4.2 Validation of FEM ...................................................................................... 37
3.5 Investigation of the Effects of FEM Techniques ............................................... 39
3.5.1 Effect of Specific Heat (Technique 1) ........................................................ 39
3.5.2 Effect of Water Loss on Electrical Conductivity (Technique 2) ................ 40
3.5.3 Effect of Tissue Fusion and CR (Technique 3) .......................................... 40
3.6 Conclusions ........................................................................................................ 41
CHAPTER 4 THERMO-ELECTRICAL MODELING OF BIPOLAR COAGULATION
ON POSTERIOR SPINAL ARTERY IN A PORCINE SPINAL SURGERY MODEL . 45
4.1 Introduction ........................................................................................................ 46
4.2 Finite Element Modeling .................................................................................... 49
4.2.1 Electrical Field Formulation ....................................................................... 49
4.2.2 Thermal Field Formulation ........................................................................ 50
4.2.3 Material Properties ..................................................................................... 51
4.2.4 Model Configuration, Mesh, Boundary Conditions, and Computational
Solver .....................................................................................................................52
4.3 Results ................................................................................................................ 55
4.3.1 Validation of FEM with Experimental Measurements ............................... 55
4.3.2 Spatial and Temporal Temperature Distributions and Thermal Dose ........ 55
4.3.3 Effect of Non-Isothermal Flow .................................................................. 58
4.4 Discussion and Conclusions ............................................................................... 59

vi
CHAPTER 5 MULTI-MODALITY GELLAN GUM-BASED TISSUE-MIMICKING
PHANTOM WITH TARGETED MECHANICAL, ELECTRICAL, AND THERMAL
PROPERTIES ....................................................................................................................64
5.1 Introduction ........................................................................................................ 65
5.2 Material and methods ......................................................................................... 69
5.2.1 Components of the TM phantom ................................................................ 69
5.2.2 Design of experiment ................................................................................. 70
5.2.3 Procedure of phantom manufacturing ........................................................ 72
5.2.4 Measurement of material properties and electrosurgery experiment ......... 72
5.3 Results ................................................................................................................ 75
5.3.1 Measured TM phantom material properties ............................................... 75
5.3.2 Regression models ...................................................................................... 77
5.3.3 Formulation of targeted tissue properties ................................................... 78
5.3.4 Validation of temperature response by TM phantom with targeted tissue
properties................................................................................................................... 79
5.4 Conclusions ........................................................................................................ 80
CHAPTER 6 CONCLUSIONS AND FUTURE WORK ............................................... 87
6.1 Conclusions ........................................................................................................ 87
6.2 Future Work ....................................................................................................... 89

vii
LIST OF FIGURES
Figure 2.1 Tips of forceps used in this study. A: regular stainless steel, B: titanium, C:
AHT, D: SILVERGlide .................................................................................. 10
Figure 2.2 Photographs of bipolar forceps showing fixture for thermistors (A) and tip
spacing fixture (B). ......................................................................................... 11
Figure 2.3 Schematic illustration of temperature measurement points............................. 12
Figure 2.4 Photograph showing process of coagulating a vessel on the spinal cord of a
porcine model.................................................................................................. 13
Figure 2.5 Line graphs illustrating temporal temperature profiles at the three measuring
positions: A, midpoint; B, 1 mm; and C, 2 mm away from midpoint along the
center line ........................................................................................................ 14
Figure 2.6 Temperature increase at the 5th second for the three measurement positions 15
Figure 2.7 Temperature changes after 5 seconds activation ............................................. 17
Figure 3.1 The bipolar electrosurgical device used in this study and (b) a close-up view of
electrode tip and temperature measurement setup .......................................... 25
Figure 3.2 (a) Configuration of modeled vessel sealing process and (b) simplified
configuration by the symmetry planes A and B and boundary conditions in the
......................................................................................................................... 29
Figure 3.3 Cross-sectional view and geometry of the model on (a) symmetry Plane A and
(b) symmetry Plane B ..................................................................................... 30
Figure 3.4 Measured voltage and voltage input for the FEM ........................................... 31
Figure 3.5 Water loss function (Yang et al., 2007b) and effective specific heat with
temperature ..................................................................................................... 33
Figure 3.6 Schematic of current path in each phase (vessel tissue between the electrode
and Plane B is not shown) ............................................................................... 35

viii
Figure 3.7 Comparison of Experimental, 3D FEM temperature profiles (the error bars
show the temperature change within the time constant of the thermistor ± the
tolerance of the thermistor) ............................................................................. 38
Figure 3.8 Effects of Techniques 1 and 2 showing temperature profiles at 0.8 mm away
from the edge of electrode .............................................................................. 39
Figure 3.9 Spatial temperature profile along the thermistor positions at 4.3 s ................. 40
Figure 4.1 The bipolar forceps used in this study (a) overview, (b) close-up view of
forceps tips, and (c) forceps tip with temperature measurement setup ........... 48
Figure 4.2 (a) Spinal cord with dura mater opened and (b) coagulation of the posterior
spinal artery on spinal cord ............................................................................. 49
Figure 4.3 (a) Configuration of modeled bipolar coagulation on a spinal artery and (b)
detailed geometry on the cross section across the forceps tips ....................... 53
Figure 4.4 Comparison of the temperature profiles of experimental and FEM results at the
three measurement points ............................................................................... 55
Figure 4.5 Cross-sectional view of temperature distribution. The black lines mark the
boundary of 50°C ............................................................................................ 56
Figure 4.6 Simulated temperature profiles at points A: tip of the forceps, B: 0.5 mm
below point A, C: 1.0 mm below point A, and D: center of the spinal artery 57
Figure 4.7 Comparison of temperature profiles between models with both heat transfer in
solids and non-isothermal flow (Solid & Flow) and model with heat transfer in
solids only (Solid). .......................................................................................... 58
Figure 5.1 Visualization of the experimental design ........................................................ 71
Figure 5.2 Experimental setup for measuring (a) elastic modulus, (b) thermal
conductivity, and (c) electrical conductivity and close up views of (d) indenter
of durometer, (e) thermal conductivity probe, and (f) electrical conductivity
probe ............................................................................................................... 73
Figure 5.3 (a) Bipolar forceps with temperature measurement setup used to coagulate TM
phantom and (b) coagulating on TM phantom ............................................... 75
Figure 5.4 Temperature profiles of coagulation on porcine spinal cord (Tissue) and TM
phantom (Phantom) ......................................................................................... 80

ix
LIST OF TABLES
Table 3.1 Material properties used in the FEM ................................................................ 28
Table 4.1 Material Properties Used in the FEM ............................................................... 52
Table 5.1 Manipulated material properties in TM phantom ............................................. 66
Table 5.2 Components of the TM phantom materials and their purposes ........................ 69
Table 5.3 Concentrations of each factor at the three different levels ............................... 70
Table 5.4 Components of the TM phantom materials and their purposes ........................ 71
Table 5.5 Measurement results of phantom material properties ....................................... 76
Table 5.6 ANONA results of the effect of factors on the three material properties ......... 77
Table 5.7 Comparison of material properties between the formulated spinal cord phantom
and real tissue ................................................................................................... 79
1
CHAPTER 1
INTRODUCTION
1.1 Motivation
Electrosurgical coagulation is one of the most important procedures in
neurosurgery to control bleeding (Dujovny et al., 1998; Vaellfors and Erlandson, 1980).
Bipolar forceps have been developed and applied in neurosurgery clinical practice since
1940s and are the most commonly used device for electrosurgical coagulation (Bulsara et
al., 2006). The heat generated in the coagulation process could transfer to the
surrounding tissue to cause inadvertent thermal injury, which leads to unfavorable
outcomes. As neural tissues are especially vulnerable to heat, having a low threshold
temperature of around 43°C and a small amount of required thermal dose for thermal
injury (Dewhirst et al., 2003), a better understanding of thermal spread in neurosurgical
coagulation procedures is critical and helps to ensure good surgical results. There is a
clinical need to understand how to safely use energy-based surgical devices.
Different surgical thermal management techniques, such as control of energy
delivery (Sugita and Tsugane, 1974), heat pipe inside the electrode (Arakawa, 2005), and
high thermal conductivity coating (Mikami et al., 2007) have been developed to
minimize the thermal damage. However, thermal spread of these devices can still exceed
3 mm from the electrode (Sutton et al., 2010; Campbell et al., 2003). The tissue thermal
damage can lead to major postoperative issues and is detrimental to a patient's long-term
recovery. Such thermal injury to the nerve has been reported clinically (Wallwiener et al.,
2010) as well as in animal models (Elliott-Lewis et al., 2010). Given the currently
available temperature measurement techniques, tissue temperature during electrosurgery
is only available in the surface. The subsurface temperature or thermal injury

2
information relies on histological analysis. The goal of this study is to gain a better
understanding of thermal spread and reduce the thermal injury during the electrosurgical
procedure in neurosurgery.
Modeling of the surgical operations is a key to understand the thermal spread. An
accurate model not only can provide spatial and temporal temperature distribution but
also allows for the calculation of thermal dose to determine the level of thermal injury.
Past studies of electrosurgical modeling has focused primarily on tumor ablation within:
liver, uterus and heart. In the ablation process, the input voltage is relatively low (<50 V)
and the heating times are often on the order of 480 to 720 s (Campbell et al., 2003). The
modeling of electrosurgical vessel sealing is much different from the ablation process. It
requires more delicate modeling techniques as the vessel sealing process utilizes a high
voltage at 100 V in a short time (about 10 s) to occlude the vessel. A model to accurately
predict the tissue temperature for bipolar electrosurgery is lacking. The data of tissue
thermal and electrical properties, which vary depending on the level of water content,
damage, and compression during vessel sealing, is critical for accurate modeling of
electrosurgery. The tissue water content is known to be temperature- (Bhattacharya and
Mahajan, 2003) and compression-dependent (Dodde et al., 2012). The tissue temperature
increases quickly from the resistive heating and the elevated temperature causes
irreversible thermal damage. Incorporation of the damage effect into the modeling
process has been attempted by altering the specific heat of the tissue (Yang et al., 2007),
changing the electrical conductivity of the tissue (Dodde et al., 2008), or by simulating
the diffusion of water vapor within the tissue (Abraham and Sparrow, 2007). All these
phenomena are important to develop a comprehensive and accurate thermal model.
The knowledge gained from the experiment and model is the foundation to build a
clinical simulator for neurosurgeons to practice and understand quantitatively the thermal
spread in surgical operations. Most current practices and training programs use
supervision of procedures performed on a patient for teaching the neurosurgical
procedures. Although there is close supervision of the trainee by a faculty, there is still
room for error and it is difficult for a resident or trainee to gain the experience needed. It
would be in everyone’s best interest if the trainee were able to practice on a clinical
simulator to meet an experience threshold before performing procedures on live patients.

3
One of the barriers for neurosurgical clinical simulator is the phantom with electrical and
thermal conductivities of the tissue during electrosurgical coagulation procedures. This
will be a key research area in this study.
1.2 Research Objectives and Tasks
The ultimate goal of this study is to achieve effective coagulation with minimal
thermal damage. Two objectives are proposed to approach this goal. First is to obtain a
comprehensive understanding of thermal spread during coagulation and second is to
develop a tissue-mimicking phantom that is able to reproduce temperature response to
electrosurgical tools as the biological tissue and can be used to build a clinical simulator.
The specific tasks include:
(1) To investigate the thermal profiles during bipolar coagulation using
commercially available bipolar forceps with and without cooling techniques.
The heating and cooling effects of each forceps will be compared.
(2) To develop a thermo-electrical model that can accurately predict the
temperature distribution during electrosurgery. This model needs to account
for evaporation, effects of water loss on tissue properties, and tissue fusion. A
fluid phase also needs to be considered as the coagulation is usually
performed with the existence of cerebrospinal fluid.
(3) To develop a multi-modality tissue mimicking phantom material for building
a clinical simulator for electrosurgery. This phantom material needs to have
close mechanical, thermal, and electrical properties as biological tissue.
1.3 Organization of the Dissertation
This dissertation is presented in a multiple manuscript format. Chapters 2, 3, 4,
and 5 are written as individual research papers, including the abstract, the main body and
the references.
Chapter 2 investigates the thermal profiles of bipolar coagulation on posterior
spinal artery in a porcine model with bipolar forceps that incorporate different cooling
techniques.
4
Chapter 3 presents a finite element model (FEM) with the development of thee
FEM techniques for modeling of evaporation, water loss, and tissue fusion, to accurately
predict tissue temperature during electrosurgical vessel sealing.
Chapter 4 develops a thermo-electrical model, with both solid and liquid phases to
calculate tissue temperature during bipolar coagulation of a posterior spinal artery. This
model also incorporates the FEM techniques developed in Chapter 3.
Chapter 5 develops a new gellan gum-based multi-modality tissue-mimicking
phantom material for electrosurgery. A regression model is developed to allow for the
formulation of tissue-mimicking phantom for any targeted soft tissue.
Chapter 6 draws the conclusions and summarizes the original contributions of the
dissertation. Several topics and directions are also proposed for future research.

5
References
Abraham J P and Sparrow E M 2007 A thermal-ablation bioheat model including liquid-
to-vapor phase change, pressure-and necrosis-dependent perfusion, and moisture-
dependent properties Int. J. Heat Mass Transfer 50 2537-44
Arakawa Y 2005 Application of the bipolar forceps with heat pipe technology (IsoCool)
in neurosurgery Jpn J Neurosurg 14 698-705
Bhattacharya A and Mahajan R 2003 Temperature dependence of thermal conductivity of
biological tissues Physiol. Meas. 24 769-83
Bulsara K R, Sukhla S and Nimjee S M 2006 History of bipolar coagulation Neurosurg.
Rev. 29 93-6
Campbell P A, Cresswell A B, Frank T G and Cuschieri A 2003 Real-time thermography
during energized vessel sealing and dissection Surg. Endosc. 17 1640-5
Dewhirst M, Viglianti B, Lora-Michiels M, Hanson M and Hoopes P 2003 Basic
principles of thermal dosimetry and thermal thresholds for tissue damage from
hyperthermia Int. J. Hyperthermia 19 267-94
Dodde R, Miller S, Geiger J and Shih A 2008 Thermal-electric finite element analysis
and experimental validation of bipolar electrosurgical cautery J. Manuf. Sci. Eng.
130 021015-1-8
Dodde R E, Bull J L and Shih A J 2012 Bioimpedance of soft tissue under compression
Physiol. Meas. 3 1095-109
Dujovny M, Dujovny N, Gundamraj N R and Misra M 1998 Bipolar coagulation in
neurosurgery Surg. Neurol. 49 328-32
Elliott-Lewis E W, Jolette J, Ramos J and Benzel E C 2010 Thermal damage assessment
of novel bipolar forceps in a sheep model of spinal surgery Neurosurgery 67 166-
72
Mikami T, Minamida Y, Koyanagi I and Houkin K 2007 Novel bipolar forceps with
protein repellence using gold-polytetrafluoroethylene composite film
Neurosurgery 60 157
Sugita K and Tsugane R 1974 Bipolar coagulator with automatic thermocontrol J.
Neurosurg. 41 777-84

6
Sutton P, Awad S, Perkins A and Lobo D 2010 Comparison of lateral thermal spread
using monopolar and bipolar diathermy, the Harmonic Scalpel and the Ligasure
Br. J. Surg. 97 428-33
Vaellfors B and Erlandson B E 1980 Damage to nervous tissue from monopolar and
bipolar electrocoagulation J. Surg. Res. 29 371-7
Wallwiener C W, Rajab T K, Kramer B, Isaacson K B, Brucker S and Wallwiener M
2010 Quantifying electrosurgery-induced thermal effects and damage to human
tissue: An exploratory study with the fallopian tube as a novel in-vivo in-situ
model J Minim Invasive Gynecol 17 70-7
Yang D, Converse M C, Mahvi D M and Webster J G 2007 Expanding the bioheat
equation to include tissue internal water evaporation during heating IEEE Trans.
Biomed. Eng. 54 1382-8

7
CHAPTER 2
COMPARISON OF THERMAL COAGULATION PROFILES FOR
BIPOLAR FORCEPS WITH DIFFERENT COOLING
MECHANISMS IN A PORCINE MODEL OF SPINAL SURGERY
ABSTRACT
Objective: Coagulation accomplished using bipolar forceps is common in
neurosurgery. Control of thermal spread from the forceps tips into surrounding neural
tissues is a persistent concern, as neural tissues are especially vulnerable to heat injury.
The purpose of our investigation was to compare the efficacy of cooling mechanisms for
four different bipolar forceps and to understand thermal spread when coagulating vessels
on the spinal cord.
Methods: Immediately following euthanasia, the dura mater of an ex-vivo porcine
model was opened to expose vessels on the spinal cord for coagulation. Temperature
profiles were measured at generator power of 25 W and at fixed 5-second activation
times. Four bipolar forceps were used in this study, including regular stainless steel,
titanium, heat-pipe embedded, and SILVERGlide forceps. The temperature was
measured by micro-thermistor at the midpoint between the bipolar tips, and 1 mm and 2
mm away from the midpoint along the center line. Statistical analysis was performed to
evaluate the temperature increasing rate.
Results: Temperature profiles indicated that the heat-pipe embedded forceps
created the least amount of temperature increase and the highest normalized temperature
decreasing slope after activation. The decreasing slope of SILVERGlide forceps is
slightly higher than that of regular stainless steel forceps.
Contents of this chapter have been submitted to Neurosurgery as Roland K. Chen, Khoi D. Than,
Anthony C. Wang, Paul Park, and Albert J. Shih, "Comparison of Thermal Coagulation Profiles
for Bipolar Forceps with Different Cooling Mechanisms in a Porcine Model of Spinal Surgery."

8
Conclusions: Bipolar forceps incorporating either heat-pipe embedded technology
or SILVERGlide coating can effectively limit excessive thermal spread, thus decreasing
potential injury to adjacent tissues when compared to standard stainless steel and titanium
bipolar forceps. Of the two, heat-pipe embedded technology appeared safest as it had
better cooling efficiency at higher temperatures.
2.1 Introduction
In neurosurgery, coagulation is an important technique (Vallfors et al., 1980) and
is often accomplished using bipolar forceps (Bulsara et al., 2006). However, thermal
spread from bipolar tips to adjacent tissue may result in inadvertent thermal injury,
leading to unfavorable outcomes in a given operation. As neural tissues are especially
vulnerable to heat (Dewhirst et al., 2003), a better understanding of thermal spread in
neurosurgical procedures is critical and helps to ensure good surgical results.
The first electrosurgical system developed by Bovie and Cushing in 1926 was
monopolar in design. Electrosurgical systems apply high-frequency electrical current to
tissues to achieve desired clinical effects, including cutting and coagulating, depending
on the applied waveform (Massarweh et al., 2006). A monopolar system requires a
returning electrode, which is usually a metal pad placed on the patient’s back, to allow
for completion of the electrical circuit. The spread of current caused by the returning
electrode results in undesired thermal damage to surrounding tissues, which can be
especially detrimental in neurosurgery. The concept of bipolar forceps was first
presented by Greenwood in 1940 (Greenwood, 1942) and remains the standard
configuration to this day. Malis (Malis, 1967) developed the first commercial bipolar
coagulation system in the 1960s. This bipolar manner of delivering electrical current to
tissue successfully restrains electrical energy and joule heating in a smaller volume of
tissue.
This technique is still far from perfect, however, and other existing problems
include adherence of tissue to the tips of coagulation forceps, the creation of an electric
spark between forceps tips, and the difficulties of removing carbonized clots and tissue
from the tips. Most of these complications are due to overheating of the forceps tips
(Elliott-Lewis et al., 2009). Numerous attempts have been made to address these

9
problems. To avoid the adherence of tissue, King and Worpole (King and Worpole, 1972)
used continuous saline drip to irrigate the forceps; this irrigation system was later
automated by Dujovny et al. (Dujovny et al., 1975). A suction channel added to the
irrigation system was modified by Scarff (Scarff, 1974) to moderate bleeding prior to
cauterization. Different algorithms to control energy delivery have been developed by
different groups (Bergdahl and Vallfors, 1991; Casotto et al., 1988; Sugita and Tsugane,
1974). A variety of coating materials on the tips of bipolar forceps including silver
(Jacques et al., 1976), gold (Mikami et al., 2007), nickel (Samii and Dujovny, 1996), and
titanium have been tested. Mikami (Mikami et al., 2004) compared forceps made of
three different materials (gold, stainless steel, and titanium) and concluded that gold-
plated forceps have the least amount of adhered coagulum. Another technique, active
heat transfer (AHT), uses fluid-filled heat pipes to continuously transfer heat away from
the bipolar tips and has been shown to reduce excessive heat buildup and minimize
thermal spread (Arakawa, 2005).
While overheating is an important issue that leads to other problems such as
adherence and thermal damage, there has been a paucity of research examining thermal
spread. Elliot-Lewis et al. (Elliott-Lewis and Benzel, 2010; Elliott-Lewis et al., 2009)
compared resultant temperatures for IsoCool bipolar forceps that incorporate AHT (by
Codman & Shurtleff, Warsaw, IN) and conventional anti-stick bipolar forceps.
Temperature was measured by thermocouple with a 1 Hz sampling rate and estimated by
infrared thermal imaging. The experiment was performed in ex-vivo bovine liver and in-
vivo rat brain. Another study compared thermal damage between devices in sheep spines
and showed that AHT forceps caused significantly less thermal-damaged area; however,
the temperature was not measured (Elliott-Lewis et al., 2010).
Thermal profiling on a spinal model with higher temporal resolution is still
needed to assess thermal spread more accurately. Our study was designed to compare
thermal profiling using bipolar forceps with different cooling mechanisms, including
AHT, SILVERGlide coating, as well as traditional stainless steel and titanium forceps.

10
2.2 Materials and Methods
The experiment was conducted in an animal surgery operating room at the
University of Michigan Medical School. The procedure was compliant with the protocol
approved by the University Committee on Use and Care of Animals (UCUCA). Two
euthanized pigs (50% Duroc, 25% Yorkshire, and 25% Landrace) weighing 50 kg were
used in this study.
Four different bipolar forceps were compared: (1) regular stainless steel bipolar
forceps (DePuy Codman & Shurtleff, Warsaw, IN); (2) titanium bipolar forceps
(Covidien, Boulder, CO), (3) AHT: IsoCool bipolar forceps (DePuy Codman & Shurtleff);
and (4) SILVERGlide bipolar forceps (Stryker, Kalamazoo, MI). The tips of these four
forceps are shown in Figure 2.1.
Figure 2.1 Tips of forceps used in this study. A: regular stainless steel, B: titanium,
C: AHT, D: SILVERGlide
The titanium bipolar forceps are lighter in weight so that it is more comfortable
for neurosurgeons to operate and also allows for a better control of motion. However,
titanium has a lower thermal conductivity than stainless steel and thus cannot conduct the
heat away as efficiently. The IsoCool bipolar forceps have embedded heat pipes within
the shafts of the bipolar forceps to actively transfer heat away from its tips. The heat
pipes contain a two-phase working fluid. The fluid is evaporated in the distal end and
diffuses to the proximal end with cooler temperatures. The vapor then condenses to liquid
and flows back to the distal end. This phase-exchanging cycle is effective for heat
transfer. The SILVERGlide bipolar forceps are made of stainless steel with tips coated in
a silver alloy. The high thermal conductivity of the silver alloy conducts heat away faster
than regular uncoated stainless steel forceps. The chemical inertia of the silver alloy also
prevents tissue adherence or charring; thus, the SILVERGlide forceps are also known as

11
anti-stick forceps. All four forceps were powered by the same electrosurgical generator,
Valleylab Force FX (Covidien). The power was set to 25 W for all trials.
A real-time subsurface temperature measurement technique developed by Dodde
et al. (Dodde et al., 2009) was used in our study. We used micro-thermistors (Model
#56A1002-C8; Alpha Technics, Irvine, CA) that have an outside diameter of 0.46 mm.
The measurement tolerance is ± 0.1°C at 25°C with a time constant of 250 ms. Voltage
differences across thermistors were recorded using a Wheatstone bridge circuit, and the
signals were transmitted and converted to temperatures using LabVIEW System Design
Software (National Instruments, Austin, TX) via a data acquisition system (PXI-1033;
National Instruments). The sampling rate was 100 Hz. A low-pass resistance-
capacitance (RC) filter with cutoff frequency of 3.38 Hz at 25°C (R: 10 kΩ and C: 4.7 µF)
was connected to each Wheatstone bridge to eliminate high-frequency noise induced by
the electrosurgical generator and the 60 Hz alternating current noise. Polycarbonate
fixtures were created for each of the forceps tested to ensure temperature measurements
were recorded at precise locations (Figure 2.2, A). As illustrated in Figure 2.3, all three
measuring positions were along the center line between the tips of the forceps and were
either midpoint (thermistor #1), 1 mm (thermistor #2), or 2 mm (thermistor #3) away
from the midpoint along the center line of the forceps tips. The forceps tips were fixed
with 2 mm spacing by use of another fixture, as shown in Figure 2.2, B.
Figure 2.2 Photographs of bipolar forceps showing fixture for thermistors (A) and
tip spacing fixture (B).

12
Figure 2.3 Schematic illustration of temperature measurement points
The experiment was carried out immediately after euthanizing the pig. This ex-
vivo experimental setup for biopolar coagulation was consistent for all tests. The goal
was to compare the thermal profiles of four forceps under the same condition. In this
regard, the ex-vivo porcine spinal cord configuration was adequate to achieve this goal.
A neurosurgeon opened the dura mater to expose vessels on the spinal cord, as shown in
Figure 2.4. Vessels with a diameter between 0.3 to 0.5 mm were chosen to be coagulated.
Prior to each bipolar coagulation, the spinal cord was irrigated with water to maintain
proper moisture on the spinal cord surface. The power of the generator was set at 25
Malis™ units (which corresponds to a root mean square of 61 V). Activation time of the
generator was fixed at 5 seconds to simulate a moderate coagulating situation (Arakawa,
2005). The order of coagulation was randomized to neutralize any experimental
uncertainty.
The number of coagulation attempts was determined based on a preliminary study;
a total sample size of n = 24 (six trials per forceps) was required to achieve statistical
power 95% (Faul et al., 2009). In this study, 36 trials were conducted (9 per forceps).
Three one-way ANOVA analyses were carried out to examine whether the temperature at
5 seconds among the four forceps varied, for three measurement points each. Differences
indicated by the ANOVA analyses were tested using the Tukey-HSD test for post hoc
multiple comparisons. Statistical significance was set at p < 0.05. All analyses were
performed with SPSS for Windows, version 20 (IBM Corp, 2011).

13
Figure 2.4 Photograph showing process of coagulating a vessel on the spinal cord of
a porcine model
2.3 Results
Figure 2.5 shows temporal temperature at the three thermistor locations using the
four bipolar forceps during coagulation of vessels on the spinal cord. Each temperature
curve is the average result of the two coagulations. The starting internal temperature of
the porcine spinal vessel was 25°C. For thermistor #1, the temperature increased about
34°C, 30°C, 15°C, and 8°C for the regular, titanium, AHT, and SILVERGlide forceps,
respectively, at the end of each 5-second activation cycle. The temperature then dropped
after activation. Temperature of the regular forceps decreased most rapidly, as it had the
greatest temperature gradient to the ambient environment. For thermistor #2, the
temperature increased by about 24°C, 21°C, 10°C, and 6°C for regular, titanium, AHT,
and SILVERGlide forceps, respectively, at the end of the activation. Temperature of all
these four devices then kept increasing slowly for about another 1 second demonstrating
that heat was still being conducted from the midpoint. For thermistor #3, temperature of
the regular and SILVERGlide devices increased over the whole 10-second recording
period, while temperature of the AHT device remained at roughly the same level after
activation.

14
Figure 2.5 Line graphs illustrating temporal temperature profiles at the three
measuring positions: A, midpoint; B, 1 mm; and C, 2 mm away from midpoint
along the center line

15
Figure 2.6 Temperature increase at the 5th second for the three measurement
positions
Figure 2.6 compares the averaged heating rate (°C/s) for all three measurement
points among the four forceps. The three one-way ANOVA analyses showed that the
temperature increasing rate significantly varied among forceps for all three measurement
points (midpoint: F(3, 32) = 37.1, p < 0.001, 1 mm: F(3, 32) = 14.7, p < 0.001 , and 2 mm: F(3,
32) = 10.7, p < 0.001). Post hoc multiple comparison tests were then carried out to
compare the difference of temperature-increasing rate between any pair of forceps. The
regular stainless steel forceps had significantly higher temperature-increasing rate than
both AHT forceps and SILVERGlide forceps for all three measurement points (Tukey’s
HSD, midpoint: p < 0.001 and p < 0.001, 1 mm: p < 0.001 and p < 0.001, 2 mm: p <
0.001 and p = 0.001, respectively). The titanium forceps also had significantly higher
temperature-increasing rate than AHT forceps and SILVERGlide forceps for all three
measurement points (Tukey’s HSD, midpoint: p < 0.001 and p < 0.001, 1 mm: p = 0.003
and p = 0.001, 2 mm: p = 0.007 and p = 0.024, respectively). There was no difference
between the regular stainless steel forceps and the titanium forceps for all three
measurement points. There was also no difference between the AHT forceps and the
SILVERGlide forceps for all three measurement points.

16
2.4 Discussion
In this study, we compared temperature profiles when coagulating vessels on
porcine spinal cord using bipolar forceps with different cooling mechanisms. The results
provide a clear comparison among the four devices studied. The regular stainless steel
forceps produced the highest temperatures at all three thermistor locations. The AHT
forceps had the least temperature increases at all three locations. The temperature
resulting from titanium forceps is slightly lower than the regular stainless steel forceps.
The SILVERGlide forceps showed slightly higher temperature increases than the AHT
forceps. The AHT forceps, which uses heat pipes, effectively conduct heat away from
the tips.
As indicated by the ANOVA analyses, the AHT and SILVERGlide forceps have
significantly slower temperature increasing rate compared to the regular stainless steel
and titanium forceps. This slow temperature increase may be contributed to two factors,
the efficiency of the forceps to convert electrical energy to thermal energy and the effect
of cooling mechanisms. These two factors will be discussed in the following paragraphs.
The slow temperature-increasing rate means a better control of coagulation and less
tendency of overheating tissue.
Electrical energy converts into thermal energy following Joule's First Law. In the
case of bipolar forceps, Joule heating occurs mostly in the region between the bipolar tips.
Although the power setting for each forceps was the same, the resulting temperatures had
large differences. The major difference may be contributed to the efficacy of Joule
heating for each forceps but not the efficiency of cooling. According to Joule’s first law
and Ohm’s law, P=V2/R, where P is the energy converted from electrical energy to
thermal energy, V is the supplied voltage, and R is the electrical resistance between the
bipolar forceps. Given the same voltage supply V (power setting), the larger the R is, the
less electrical energy is converted to thermal energy. As R is related to the contact area
between the forceps tips and the tissue being coagulated, a larger contact area leads to
smaller R and is more capable to generate heat. While the AHT forceps have the smallest
tips (as shown in Figure 2.1), it can be expected that the least amount of heat and lowest
temperature will be generated by the AHT forceps.

17
After the activation stops, the generated heat then transfers away from the
coagulation region via three pathways. First, heat can be conducted into adjacent tissue.
Second, it can be absorbed by the forceps itself. Third, the heat can be diffused into the
ambient surroundings. Figure 2.7 shows the temperature changes after the 5 seconds
activation. The slope of each curve is the temperature-descending rate via these three
pathways. The slopes of regular stainless steel and titanium forceps are steeper because
these two forceps have higher temperature gradients (i.e. the temperature difference
between the midpoint and 1 mm). It is known that the rate of heat conduction is
proportional to the temperature gradient (Incropera and DeWitt, 2002). The slope of
regular stainless steel forceps is slightly higher than that of titanium forceps because
stainless steel has higher thermal conductivity than titanium and can conduct heat more
efficiently. The AHT and SILVERGlide forceps have lower slope due to the smaller
temperature gradient. On the other hand, the temperature of AHT and SILVERGlide
forceps continued increasing for about 0.5 second after the activation stopped. This is
because the heat transferring from the tissue around the tips to the midpoint between the
tips is larger than that of the heat conducting to the tissue that is far from the tips.
Figure 2.7 Temperature changes after 5 seconds activation
The AHT forceps work by the two-phase working fluid vacuum-sealed in the heat
pipes that are embedded in the forceps shafts (Elliott-Lewis and Benzel, 2010; Elliott-

18
Lewis et al., 2009). The fluid has a working temperature range which varies by the type
of fluid and the level of vacuum (Zohuri, 2011). The working fluid also needs time to
accumulate enough energy to overcome the latent heat to evaporate the working fluid.
Before the temperature reaches the working range, the fluid inside the heat pipe cannot be
evaporated and thus the AHT forceps do not show a superior performance below this
working temperature range. As shown in Figure 2.5A, for the first three seconds, the
temperature of AHT forceps was higher than that of SILVERGlide forceps. This is
because the silver coating on the surface of SILVERGlide forceps has a higher thermal
conductivity than that of the AHT forceps. Before the heat pipe of the AHT forceps
reaches the working temperature, the SILVERGlide forceps have a better performance to
conduct the heat away. Once the temperature reaches the working range, the AHT
forceps can then conduct heat more efficiently.
Results of our study performed on porcine spinal cord are consistent with the
results obtained in a previous study on coagulation in ex vivo calf liver (Elliott-Lewis et
al., 2009). In spinal surgery, neurosurgeons tend to use a lower power setting to prevent
thermal damage. We used 25 Malis units for our study, while previous studies (Elliott-
Lewis and Benzel, 2010; Elliott-Lewis et al., 2009) used much higher power at 35 and 50
Malis units. It can be expected that with a higher power, a larger temperature difference
among devices can be seen. However, using a low power setting, we still found
noticeable differences.
The major limitation of this study is that the experiment was not conducted with
live animals. Thus, the efficacy of coagulation could not be studied. However, the main
purpose of this study was to compare the temperature profiles and the effect of cooling
mechanisms. For the AHT device, the low temperatures generated may not coagulate the
vessel effectively, thereby requiring a longer activation time. This may be a concern for
neurosurgeons and requires further study.
2.5 Conclusions
Based on this porcine spinal cord study, the AHT and SILVERGlide forceps
produced a less amount of thermal spread compared to regular stainless steel and titanium
forceps. The AHT and SILVERGlide forceps also show a slower temperature-increasing
rate which allows a better control of temperature increase, but may require longer

19
coagulation time. The stainless steel and titanium forceps have a higher temperature-
increasing rate and are better in the case of heavy bleeding. The AHT forceps have best
cooling efficiency among the four compared forceps at higher temperature. Therefore, it
would appear to be safer to use AHT forceps when hemostasis needs to be performed
adjacent to vital neural tissues. Future study may incorporate external cooling device to
stainless steel or titanium forceps to maintain the ability to coagulate vessel quickly and
minimize thermal damage to the adjacent tissue.

20
References
Arakawa Y 2005 Application of the bipolar forceps with heat pipe technology (IsoCool)
in neurosurgery Jpn J Neurosurg 14 698-705
Bergdahl B and Vallfors B 1991 Studies on coagulation and the development of an
automatic computerized bipolar coagulator. Technical note J Neurosurg 75 148-
51
Bulsara K R, Sukhla S and Nimjee S M 2006 History of bipolar coagulation Neurosurg
Rev 29 93-6
Casotto A, Castrioto C and Orvieto P 1988 An advanced system for electrocoagulation in
neurosurgery J Neurosurg Sci 32 61-3
Dewhirst M W, Viglianti B L, Lora-Michiels M, Hanson M and Hoopes P J 2003 Basic
principles of thermal dosimetry and thermal thresholds for tissue damage from
hyperthermia Int J Hyperthermia 19 267-94
Dodde R, Shih A and Advincula A P 2009 A novel technique for demonstrating the real-
time subsurface tissue thermal profile of two energized surgical instruments J
Minim Invasive Gynecol 16 599-603
Dujovny M, Vas R, Osgood C P, Maroon J C and Janetta P J 1975 Automatically
irrigated bipolar forceps. Technical note J Neurosurg 43 502-3
Elliott-Lewis E W and Benzel E C 2010 Thermal comparison of novel bipolar forceps in
bovine liver Neurosurgery 67 160-5
Elliott-Lewis E W, Jolette J, Ramos J and Benzel E C 2010 Thermal damage assessment
of novel bipolar forceps in a sheep model of spinal surgery Neurosurgery 67 166-
72
Elliott-Lewis E W, Mason A M and Barrow D L 2009 Evaluation of a new bipolar
coagulation forceps in a thermal damage assessment Neurosurgery 65 1182-7
Faul F, Erdfelder E, Buchner A, and Lang A G 2009 Statistical power analyses using
G*Power 3.1: Tests for correlation and regression analyses. Behav Res. Methods,
41, 1149-1160.
Greenwood J, Jr. 1942 Two point coagulation: a follow-up report of a new technic and
instrument for electrocoagulation in neurosurgery Arch Phys Ther 23 552-4

21
IBM Corp. Released 2011. IBM SPSS Statistics for Windows, Version 20.0. Armonk,
NY: IBM Corp
Incropera F P and DeWitt D P 2002 Fundamentals of Heat and Mass Transfer, (New
York: Wiley)
Jacques S, Bullara L A and Pudenz R H 1976 Microvascular bipolar coagulator.
Technical note J Neurosurg 44 523-4
King T T and Worpole R 1972 Self-irrigating bipolar diathermy forceps. Technical note J
Neurosurg 37 246-7
Malis L I 1967 Micro-Vascular Surgery: Report of First Conference, October 6-7, 1966,
Mary Fletcher Hospital, Burlington, Vermont, ed R M Donaghy Peardon and M
G Yasargil (St. Louis: C. V. Mosby Co.) pp 126-30
Massarweh N N, Cosgriff N and Slakey D P 2006 Electrosurgery: history, principles, and
current and future uses J Am Coll Surg 202 520-30
Mikami T, Minamida Y, Koyanagi I and Houkin K 2007 Novel bipolar forceps with
protein repellence using gold-polytetrafluoroethylene composite film
Neurosurgery 60 ONS157-61
Mikami T, Takahashi A, Hashi K, Gasa S and Houkin K 2004 Performance of bipolar
forceps during coagulation and its dependence on the tip material: a quantitative
experimental assay. Technical note J Neurosurg 100 133-8
Samii A and Dujovny M 1996 Kirwan "non-stick" bipolar forceps Surg Neurol 45 297-8
Scarff T B 1974 A new bipolar suction-cautery forceps for micro-neurosurgical use Surg
Neurol 2 213
Sugita K and Tsugane R 1974 Bipolar coagulator with automatic thermocontrol.
Technical note J Neurosurg 41 777-9
Vallfors B, Erlandson B E, Wieck B O, Hansson H A and Svensson J 1980 Coagulation
in neurosurgery Acta Neurochir (Wien) 55 29-34
Zohuri B 2011 Heat Pipe Design and Technology: a Practical Approach (Boca Raton:
CRC Press)

22
CHAPTER 3
ELECTROSURGICAL VESSEL SEALING TISSUE TEMPERATURE:
EXPERIMENTAL MEASUREMENT AND FINITE ELEMENT
MODELING
ABSTRACT
The temporal and spatial tissue temperature profile in electrosurgical vessel
sealing was experimentally measured and modeled using finite element modeling (FEM).
Vessel sealing procedures are often performed near the neurovascular bundle and may
cause collateral neural thermal damage. Therefore, the heat generated during
electrosurgical vessel sealing is of concern among surgeons. Tissue temperature in an in-
vivo porcine femoral artery sealed using a bipolar electrosurgical device was studied.
Three FEM techniques were incorporated to model the tissue evaporation, water loss, and
fusion by manipulating the specific heat, electrical conductivity, and electrical contact
resistance, respectively. These three techniques enable the FEM to accurately predict the
vessel sealing tissue temperature profile. The averaged discrepancy between the
experimentally measured temperature and the FEM predicted temperature at three
thermistor locations is less than 7%. The maximum error is 23.9%. Effects of the three
FEM techniques are also quantified.
Contents of this chapter have been accepted by IEEE Transaction on Biomedical
Engineering as Roland K. Chen, Matthew W. Chastagner, Robert E. Dodde, and Albert J.
Shih, "Electrosurgical Vessel Sealing Tissue Temperature: Experimental Measurement
and Finite Element Modeling."

23
3.1 Introduction
Electrosurgery was developed to ablate tumors (Goldberg, 2001), cauterize tissue
(Pearce and Thomsen, 1992), and to seal vessels (Newcomb et al., 2009) by delivering
electrical current (frequency ranges from 300 to 550 kHz) to tissue. The electrosurgical
devices used for vessel sealing work by clamping down on the vessel while applying an
electrical current through the tissue. The resistive heating generated by the applied
current increases the tissue temperature. This elevated temperature causes the proteins
within the tissue to denature and hence form a seal (Wright and Humphrey, 2002).
Electrosurgical devices have been proven to safely and effectively seal vessels
(Campagnacci et al., 2007; Ponsky et al., 2009). The advantages of using electrosurgical
devices over conventional vessel ligation include less operative time (Heniford et al.,
2001; Shen et al., 2005) and shorter postoperative hospital stay (Campagnacci et al.,
2007).
Despite these advantages, potential thermal damage to adjacent nerves
surrounding the sealing site is of concern for surgeons, particularly in procedures such as
prostatectomy, spinal surgery, and brain surgery. In prostatectomy, bipolar forceps are
usually only used to control heavy bleeding due to the potential of thermal damages to
the neurovascular bundle. In neurosurgery, bipolar forceps are used to coagulate vessels
right on the spinal cord or cerebral cortex, which have a low temperature threshold before
thermal damage occurs, around 43°C (Dewhirst et al., 2003). Since the tissue must be
heated to seal the vessel, the adjacent tissue is at risk of thermal damage because of the
thermal spread from the sealing site.
Most of the current electrosurgical devices attempt to reduce thermal spread
through the use of generators that implement control algorithms for the energy output
(Kennedy et al., 1998). In addition, other techniques used to minimize thermal spread
include "smart electrodes" that turn on and off depending on the local tissue temperature
(Smaldone et al., 2008) and a heat pipe embedded within the electrode for cooling
(Vellimana et al., 2009). However, even with these advanced techniques, the thermal
damage from these devices often exceeds 3 mm from the edge of electrode (Campbell et
al., 2003). The thermal damage to the neural tissue can lead to major postoperative issues
and can be detrimental to a patient's long-term recovery.

24
To prevent thermal damage and improve patient safety, a better understanding of
the thermal spread in electrosurgical vessel sealing is needed. Modeling the sealing
process is key to this because it provides more insight into the thermal spread. Previous
studies on electrosurgical modeling focused primarily on tumor ablation within the liver
(Haemmerich et al., 2003), uterus (Martin and Angelone, 2009), and heart
(Tungjitkusolmun et al., 2000). However, modeling electrosurgical vessel sealing is
different from modeling the ablation process. In the ablation process, the energy power
level being delivered is relatively low (<50 V) and the heating times are often on the
order of 480 to 720 s. In contrast, the vessel sealing process utilizes a relatively high
voltage (about 100 V) in a shorter time (about 10 s) to occlude the vessel. Dodde et al.
(Dodde et al., 2008) has developed a model to predict the thermal spread in cauterizing
spleen tissue from a bipolar electrosurgical device that uses similar voltage and activation
time in the vessel sealing process. This model needs to be further modified to predict the
thermal spread in the vessel sealing process because of three major challenges: 1) the
phase change via evaporation and the associated energy of latent heat, 2) the change of
tissue electrical conductivity due to water loss, and 3) the contact resistance (CR) in the
interfacial surface of the vessel. These challenges can be overcome by manipulating the
material properties used in the finite element modeling (FEM) to account for those
phenomena of evaporation, water loss, and tissue fusion.
Accurate thermal and electrical properties are critical for modeling electrosurgical
vessel sealing. The tissue’s thermal and electrical properties vary with factors including
temperature (Golombeck et al., 1999; Berjano, 2006), water content (Yang et al., 2007a),
thermal damage (Haemmerich et al., 2003), phase change, and compression (Dodde et al.,
2012). To our knowledge, such a comprehensive model which incorporates temperature,
water content, thermal damage, phase change, and compression is yet to be developed.
The present study, therefore, aims to develop an experimentally validated model
to predict the spatial and temporal distributions of tissue temperature during the
electrosurgical vessel sealing process. A bipolar electrosurgical device is used to perform
the vessel sealing while thermistors are used to measure the tissue temperature during the
process. A FEM incorporating the changes in material properties in a vessel during

25
electrosurgical sealing is developed. The model is then validated by the experimental
results and the effects of the manipulated material properties are investigated.
3.2 Experimental Setup
An in-vivo porcine model (Figure 3.1(a)) was used for measuring the temperature
profile during a vessel sealing process. In this experiment, a 3 mm diameter femoral
artery was sealed by a 5 mm bipolar electrosurgical device, as shown in Figure 3.1(b).
The temperature profile was measured by micro thermistors. The electrical input from the
electrosurgical device to the sealing site was also measured.
Figure 3.1 The bipolar electrosurgical device used in this study and (b) a close-up
view of electrode tip and temperature measurement setup
A porcine (50% Duroc, 25% Yorkshire, and 25% Landrace) model weighing 45
kg was used in this experiment. The experiment was conducted at the University of
Michigan Medical School under an approved animal protocol. Anesthesia was induced in
the animal with an intramuscular injection of Telazol® (6 mg/kg) mixed with Xylazine
(2.2 mg/kg). The animal was intubated and placed under general anesthesia using
Isoflurane (2 to 2.5%). The animal was then placed on a ventilator (10 ml/kg) at 12 bpm.
Oxygen saturation, pulse rate, and respiratory rate were monitored with pulse oximetry at
regular intervals.
A 5 mm bipolar cutting forceps (Gyrus ACMI, Olympus #3005PK) was used to
seal the vessel. The device was powered by a generator (Gyrus ACMI, Olympus,
SuperPulse Generator #744000), which was set to the VP1 setting with a power level of
30 W. Generator activation was stopped once the audible tone from the generator was
(a) (b)
ThermistorsFixture
ArteryElectrode

26
heard. The leads of the device were attached to a digital oscilloscope (Agilent #54833A)
in peak detect mode with a 100:1 high voltage probe (Agilent 10076A) and a current
probe (Agilent 1147A). The voltage data was collected at 10 kHz.
Tissue temperature was measured using a series of micro thermistors (Alpha
Technics Model #56A1002-C8) set into a polycarbonate fixture, as shown in Figure
3.1(b). The polycarbonate fixture, epoxied to the top of the electrodes, held the
thermistors in positions relative to the edge of the electrode. Three thermistors were
epoxied into the fixture with the tip exposed to a depth of 0.75 mm. In the fixture, the
distances between the edge of the electrode and the thermistors were 1.0, 2.0, and 3.0 mm.
The thermistors used in this study have an outside diameter of 0.46 mm, a time constant
of 250 ms, and an accuracy of ±0.1°C at 25°C. It is assumed that the thermistors would
not interfere the electrical current as its size is small. A data acquisition system sampling
at 40 Hz was utilized to record temperature data. A 3 Hz low pass filter and a moving
average with a 15 data point window size were applied to the experimental data to
remove the electrical noise.
3.3 Finite Element Modeling
A FEM for bipolar electrosurgical vessel sealing based on temperature and electrical
fields was developed. Material properties, FEM mesh, boundary conditions and solver
will also be introduced in the following sections. Three FEM techniques were developed
to model the three phenomena; evaporation, water loss, and tissue fusion, which occur
during the sealing process.
3.3.1 Thermo-Electrical FEM Formulation
The two physics fields; temperature and electrical fields, are governed by a bio-
heat transfer equation and a Laplace equation, respectively. The bio-heat transfer
equation for tissue was developed in the late 1940s by Pennes (Pennes, 1948). In this
study, the blood perfusion and metabolic heat sources are assumed to be negligible and
the bio-heat transfer equation reduces to:
2g
Tc k T q
t
(3.1)

27
where ρ is the tissue density (kg/m3), c is the tissue heat capacity (J/kg·K), t is the time
(s), k is the tissue thermal conductivity (W/m·K), T is the local tissue temperature (K),
and qg is the heat generation (W) due to the externally induced electro-surgical heating of
the tissue.
The electrical field in the tissue and electrode was obtained by solving the Laplace
equation (Tungjitkusolmun et al., 2002):
( ) 0V (3.2)
where σ is the temperature-dependent electrical conductivity (S/m) and V is the voltage
(V). At the frequency range of electrosurgery, capacitive coupling in tissue is negligible
and only the resistive dissipation of the electrical energy needs to be considered [23].
These two governing equations, Eqs. (3.1) and (3.2), are coupled by the heat generation
term qg. This heat generation term is defined as:
qg = J·E (3.3)
where J is the current density (A/m2) and E is the electric field intensity (V/m). The · in
Eq. (3.3) is a scalar product operator. COMSOL Multiphysics 4.2 (Burlington, MA) is
used as the platform to solve the FEM.
3.3.2 Electrode and Blood Material Properties and Tissue Thermal Conductivity
Using proper material properties is crucial to an accurate FEM. In this thermo-electrical
FEM, the required material properties for each domain are density, specific heat, thermal
conductivity, and electrical conductivity. Material properties for the stainless steel
electrode are considered constant throughout the sealing process and are listed in Table
3.1. Due to the fluidic nature of blood and its ability to flow through and dissipate heat
inside the vessel rapidly, blood material properties were assumed constant (Table 3.1).
For vessel tissue, only density was assumed constant, 1050 kg/m3. The thermal
conductivity (k) of vessel tissue is assumed to be temperature-dependent and can be
expressed as (Golombeck et al., 1999):

28
0.0013( )ref refk k T T (3.4)
where kref (0.45 W/m·K) is the baseline tissue thermal conductivity at Tref (25°C) (Duck,
1990). As the vessel tissue between the two electrodes is compressed, the water content
and thermal conductivity of the tissue decrease. Therefore, a 10% reduction in the
thermal conductivity was used for the tissue between the electrodes (Chastagner, 2010).
The specific heat and electrical conductivity of vessel tissue change dramatically during
the vessel sealing process and will be discussed in Section D along with the three FEM
techniques.
Table 3.1 Material properties used in the FEM
Domain ρ [kg/m3] c [J/kg·K] k [W/m·K] σ [S/m]
Vessel Tissue 1050* Eq. (3.6) Eq. (3.4) Eq. (3.7)
Blood 1060** 3890** 0.53* 0.67***
Electrode 8000 500 16.2 1.39∙106
*Duck (Duck, 1990), **Golombeck et al. (Golombeck et al., 1999) and
***Tungjitkusolmun et al. (Tungjitkusolmun et al., 2002)
3.3.3 FEM Mesh, Boundary Conditions, and Solver
The configuration of the model, as shown in Figure 3.2(a), depicts the sealing of a
3 mm diameter femoral artery with a 0.4 mm wall thickness using the 5 mm Gyrus ACMI
bipolar forceps from the experiment (Figure 3.1(b)). Prior research has shown that the flat
contact surface accurately represents the jagged contact surface of the electrode to model
the tissue temperature in electrosurgical cauterizing (Dodde et al., 2008). Two planes,
marked as Planes A and B, define the region to be analyzed by FEM. Plane A is across
the center axis of the vessel while Plane B is the middle plane bisecting the looped
electrode. On the right of Plane B, the vessel is circular with blood inside. On the left of
Plane B, the vessel expands to 4.5 mm width due to the compression thermistor and
fixture. It is assumed that the effect of heat transfer across Plane B is minimal and the
FEM model can be simplified to the region highlighted in Figure 3.2(a). A detailed view

29
of the vessel and electrodes in this region is illustrated in Figure 3.2(b). The three
thermistors indicate the temperature measurement points.
The cross-sectional view and detail geometry on Planes A and B are shown in
Figure 3.3(a) and (b), respectively. In Figure 3.3(a), the three measurement points are
shown to be 1.0, 2.0, and 3.0 mm away from the edge of the electrode. Due to the
compression of the thermistors and test fixture, it was assumed that no blood was present
in the first 3.0 mm from the electrode and the height of vessel tissue was 0.8 mm. For
distances of 3.0 to 8.0 mm away from the electrode, without the compression of the
thermistors, blood was present within the vessel, but the height of vessel remained at 0.8
mm, twice of the vessel wall thickness, due to restraint by the fixture. The wall thickness
was reduced to 0.25 mm
Figure 3.2 (a) Configuration of modeled vessel sealing process and (b) simplified
configuration by the symmetry planes A and B and boundary conditions in the
ASymmetry plane
(a)
Vessel
Blood
Contact resistance
layer
(b)
Active electrode (70 V)
Passive electrode (0 V)
Free convection
(h = 25 W/m2·K)
Fixed temperature
(36.5°C)
5.0
3.0
Unit: mm
Active electrode
Passive electrode
B
Thermistors
4.5
0.4
Middle plane

30
because the present of blood flow. The vessel tissue between the electrode and Plane B
had a width of 0.75 mm and a height of 0.8 mm. The height of vessel tissue between the
electrodes was 0.4 mm due to the compression of the electrode. The CR layer, which will
be introduced in the next section, has a thickness of 0.02 mm and extends from Plane B
to 3 mm away from the electrode. As shown in Figure 3.3(b), the width of the CR layer is
1.7 mm, while one half of the compressed vessel has a width of 2.25 mm. The side of the
vessel has a round fillet with 0.4 mm radius. The height of the electrode is 1.0 mm.
Figure 3.3 Cross-sectional view and geometry of the model on (a) symmetry Plane A
and (b) symmetry Plane B
The automatic meshing generator within COMSOL was used to generate the
finite element mesh. The mesh was refined until the maximum temperature at a location 1
mm from the edge of electrode differed by less than 0.2°C when compared with a finer
mesh. The final mesh consisted of 30,022 linear tetrahedral elements.
1.7
Unit: mm
(a)
(b)
Plane B
Plane A
r=0.4
2.25
0.8
1.153.05.0
0.4
0.0
2
0.2
5
Temperature measurement points
1.0
3.0
2.0
1.0
0.75
Pla
ne
B
Pla
ne
A
0.8

31
For the electrical boundary conditions, an electrical insulating boundary condition
was applied to all outer surfaces of the model, assuming that no electrical current flow
through air and there is no electrical potential difference across Planes A and B. The
experimentally measured electrical AC voltage of each pulse was first converted to a DC
source voltage by calculating its root-mean-square value (Berjano, 2006) and then
applied to the end surface of the active electrode. This quasi-static approximation allows
for a faster time stepping and shorter computational time. Figure 3.4 shows the measured
voltage and voltage input on the active electrode for FEM during the first 6 s. During the
first three pulses, the FEM input voltage was 55, 65, 65 V, respectively as the voltage had
not yet reached a steady level. However, after the third pulse, all subsequent pulses had a
voltage input of 70 V. Each pulse has a 0.25 s on-time and 0.5 s off-time. The electrical
pulses were applied for 15 s. On the passive electrode, a ground, 0 V, was applied to the
end surface of the electrode. Electrical continuity was applied to all of the internal
surfaces between the tissue, the blood, and the electrodes.
Figure 3.4 Measured voltage and voltage input for the FEM
For the thermal boundary conditions, Planes A and B were modeled as insulation
surfaces with no heat flux, assuming the temperature across these planes is equal. The
distal end of the blood vessel was set at 36.5°C, the body temperature of the porcine
model. All the outer surfaces, except for the end of the vessel and the two symmetry
planes, were subject to free convection with ambient temperature and convective heat
transfer coefficient set to 25 W/m2·K , respectively. Thermal continuity was applied to all
32
of the internal surfaces between the tissue, blood, and electrodes. The heat source (qg in
Eq. (3.3)) of total power generation from the electrical field was applied to all domains as
the thermal input. The COMSOL PARDISO solver, using a stationary time iterative
stepping process to solve Eqs. (3.1) and (3.2) simultaneously, was used in this study
(Shenk and Gärtner, 2004). A personal computer with six cores (3.2 GHz) was used to
perform the computational work. The computational time took 10 to 12 hours.
3.3.4 Three FEM Techniques to Model: Evaporation, Water Loss, and Tissue
Fusion
The three physical phenomena of evaporation, water loss, and tissue fusion were
modeled by the following FEM techniques. These techniques are key to accurately model
the vessel sealing process and their effects will be discussed in Section V.
1) Technique 1 – Evaporation and Specific Heat:
During vessel sealing, the temperature near the electrodes is above the
evaporation temperature of water. Tissue consists of about 70% water and 30% fiber
(Duck, 1990). The latent heat of water, which is the energy required to evaporate from
liquid to gas phase, is more than five times of the energy needed to increase the
temperature from the room temperature to the evaporation temperature. The
accumulation of latent heat acts as a heat sink when the tissue reaches the evaporation
temperature. It is important to model the effect of latent heat due to evaporation or phase
change.
The evaporation is taken into account in the FEM by varying the specific heat of
tissue. The effective specific heat, ceff, which varies with temperature and involves the
effect of evaporation, is expressed as:
weff f lc c c c (3.5)
where cf is the specific heat of tissue fiber, cw is the specific heat of water based on the
water content at the corresponding temperature, and cl is due to the latent heat of the
corresponding water loss. At 25°C, ceff is 3314.2 J/kg·K (Duck, 1990), cw is 2926.9
J/kg·K (4181.3·70%), and cl is 0, and thus cf can be obtained to be 387.3 J/kg·K. In this

33
study, cf is set as a constant. Due to the short time scales seen during vessel sealing
procedures, it is assumed that all the water loss is due to evaporation and requires the
accumulation of latent heat. It has been shown that the tissue water content varies with
temperature (Yang et al., 2007b); so that cw and cl can be calculated accordingly. Based
on the water content at a specific temperature, the water loss as a function of temperature
can be obtained.
For temperatures equal to or lower than 103°C, the equation given by Yang et al.
(Yang et al., 2007a) is used to calculate the percentage of water content in tissue. For
temperatures higher than 103°C, the water content of temperature (W) is assumed to
continue decreasing to 0.1%. W can be expressed as:
0.417( 103)
1.16670% 0.1%
1 TW
e
(3.6)
Eq. (3.6) maintains the continuity of W at 103°C. cw is calculated by multiplying W with
the specific heat of water (4.18 J/g·K). Thus, the loss of water has an effect of reducing
the specific heat. To calculate cl, the water content with temperature is converted to a
water loss function, as shown in Figure 3.5. cl is the gradient of water loss times the latent
heat of water (2260 kJ/g). By combing cf, cw, and cl, ceff can be calculated. The ceff vs.
temperature used in this study is also shown in Figure 3.5.
Figure 3.5 Water loss function (Yang et al., 2007b) and effective specific heat with
temperature
0.1
1
10
100
1000
0%
20%
40%
60%
80%
25 50 75 100 125 150
Acc
um
ula
ted
Wat
er L
oss
Temperature ( C)
Water Loss %: ≤103°C Water Loss %: >103°C
c(T): ≤103°C c(T): >103°C
0.1
1
10
100
1000
0%
20%
40%
60%
80%
25 50 75 100 125 150
Acc
um
ula
ted
Wat
er L
oss
Temperature ( C)
Water Loss: ≤103°C Water Loss: >103°C
c(T): ≤103°C c(T): >103°C
Effective
Spe
cific He
at, c(T)eff , (kJ/g·K
)
c(T)eff: ≤103°C
c(T)eff: >103°C
0.1
1
10
100
1000
0%
20%
40%
60%
80%
25 50 75 100 125 150
Acc
um
ula
ted
Wat
er L
oss
Temperature ( C)
Water Loss %: ≤103°C Water Loss %: >103°C
c(T): ≤103°C c(T): >103°C
0.1
1
10
100
1000
0%
20%
40%
60%
80%
25 50 75 100 125 150
Acc
um
ula
ted
Wat
er L
oss
Temperature ( C)
Water Loss %: ≤103°C Water Loss %: >103°C
c(T): ≤103°C c(T): >103°C
0.1
1
10
100
1000
0%
20%
40%
60%
80%
25 50 75 100 125 150
Acc
um
ula
ted
Wat
er L
oss
Temperature ( C)
Water Loss %: ≤103°C Water Loss %: >103°C
c(T): ≤103°C c(T): >103°C

34
2) Technique 2 − Water Loss and Electrical Conductivity:
During bipolar electrosurgery, the elevated tissue temperature causes evaporation
that reduces the tissue water content and thus the thermally damaged tissue becomes less
electrically conductive. Haemmerich et al. (Haemmerich et al., 2003) used a drastic
reduction in the tissue electrical conductivity (σ) of 10,000 times to define the effect of
thermal damage on σ. This reduction in σ is caused by the loss of water in the tissue as
water is the primary carrier medium for the electrical current in the tissue. Thus, the
water loss causes the σ of the tissue to fall. In this study, when T<103°C, the σ was
assumed to increase at a rate of 2%/°C (Berjano, 2006) and can be expressed as:
1 0.02( )ref refT T
(3.7)
where σref is the reference electrical conductivity of the tissue (0.55 S/m (Duck, 1990))
and Tref is the reference temperature (25°C).
Once the tissue accumulated enough energy for the phase changing process,
meaning the loss of water, the σ was set at a low, constant value, designated as σd. In this
study σd = 0.01 S/m. The σ with thermal damage is denoted as σ'. The transition between
σ and σd is smoothed to be continuous with their first derivative by COMSOL.
3) Technique 3 − Tissue Fusion and Electrical CR:
Electrical CR exists at the interface of two conductive surfaces and is well studied
for industrial spot welding processes (Li, 2005). In vessel sealing, the electrical CR also
exists between the contact surfaces inside the vessel and is important for accurate
prediction of temperature.
At 25°C, the CR for an area of 50 mm was experimentally determined to have
resistance ranging from 123 to 243 with the bioimpedance measurement system
developed by Dodde et al. (Dodde et al., 2012). In vessel sealing, the vessel is
compressed by the electrode, forcing the contact of vessel wall inner surface. Once the
tissue is heated, the proteins in tissue unwind and realign to form a fused region, which
seals the vessel (Wright and Humphrey, 2002). The fusion process starts at 70−80°C (Wu
et al., 2000). Once the vessel wall is fused together, the CR is removed.

35
In this study, to simulate the process of tissue fusion, a thin (0.02 mm) CR layer
was initially added to the interface where the vessel walls were compressed and touched
each other. The electrical conductivity of the CR layer (σCR) is equal to 0.005 S/m for
temperatures below 80°C. For temperatures above 90°C, meaning the fusion process has
completed, the CR layer is removed by changing σCR to the same value as the vessel
tissue (σ') at the corresponding temperature. For 80−90°C, σCR linearly transitions from
0.005 S/m to σ'.
Based on the change in electrical conductivity due to water loss and the removal
of the CR layer, the sealing process can be divided into three phases, as shown in Figure
3.6. In Phase 1, the pathway with the least electrical resistance is passing along the vessel
wall between two electrodes but not going through the CR layer. The current flow causes
resistive heating to concentrate in this region and the local thermal damage can be seen
quickly. This thermally damaged region has a reduced electrical conductivity; therefore,
the current stops passing through this region and spreads out to the tissue away from the
edge of electrodes. This phenomenon causes the resistive heating to spread to a wider
area. When all the tissue adjacent to the edge of electrode is thermally damaged and has
reduced electrical conductivity, it once again creates a barrier to prevent current from
spreading out. This is the start of Phase 3. At this time, the temperature of CR layer
between the electrodes has exceeded 90°C and the electrical conductivity is changed to σ'.
In Phase 3, the current is constrained only in the region between the two electrodes and
has a minimal resistive heating effect for tissue away from the electrode.
Figure 3.6 Schematic of current path in each phase (vessel tissue between the
electrode and Plane B is not shown)
Phase 1
Phase 2
Phase 3

36
3.4 Experimental Results and Validation of FEM
3.4.1 Experimental Results
Figure 3.7 shows the comparison of experimentally measured tissue temperature
with the FEM predictions during electrosurgical vessel sealing. The temperatures at the
three points, 1.0, 2.0, and 3.0 mm away from the bipolar electrode (Figure 3.4(a)) are
presented. The result of each phase is described separately as follows.
1) Phase 1 − Pre-fusion:
The temperature at 1.0 mm increased slowly during the first 1.5 s. The
temperature at 2.0 and 3.0 mm did not increase much in this phase. Since most of the
electrical current went laterally along the vessel wall, the local tissue in this region was
thermally damaged and the effect of tissue fusion was limited.
2) Phase 2 − Fusion:
Both the temperatures at 1.0 and 2.0 mm increased rapidly during Phase 2
(1.5−4.3 s). The CR forces more electrical current to spread out and causes the resistive
heating of tissue at 1.0 and 2.0 mm adjacent to the electrode. The rapid temperature
increase at 1.0 and 2.0 mm indicates the existence of resistive heating. The wider current
distribution due to the CR layer also forces some electrical current to pass through this
layer. The current passing through the CR layer heats up the interface of vessel wall to
achieve the effect of tissue fusion. Thus, most of the tissue fusion which forms the vessel
seal happens during Phase 2. If the electrical energy stops before Phase 2 is finished, the
seal may not have enough strength because only a limited area is fused. This inference
agrees with what Dilley et al. (Dilley et al., 1995) have suggested that a sufficient sealing
time is required to form a strong seal. Phase 2 ends at 4.3 s in this study which is also
close to the sealing time (2.06−4.5 s) used by Newcomb et al. (Newcomb et al., 2009). At
the end of Phase 2, the temperature at 1.0 mm reached a maximum value of 80.8°C. The
temperature at 3.0 mm started increasing gradually from Phase 2. The gradual increase
indicates that the temperature change can be attributed to heat conduction.
3) Phase 3 − Post-fusion:
In this phase (4.3-15 s), temperatures between the two electrodes exceeded the
tissue denature temperature (90°C), the tissue had fused, and the CR layer was removed.

37
Thus, the electrical current was restrained between the two electrodes thereafter. There is
no resistive heating away from the electrode. This explains why the temperature
remained at the same level after 4.3 s even with continuing generator activation. As a
result, the temperature at 1.0 mm decreased slowly to 74°C, even as electrical pulses
were continued. At 2.0 mm, the temperature remained relatively steady and only
increased by 4°C during this phase. At 3.0 mm, the temperature continued increasing
through the entire phase by 16°C.
3.4.2 Validation of FEM
As shown in Figure 3.7, the FEM accurately predicts general trends for thermal
profiles during the electrosurgical vessel sealing compared to the experimental
measurements. The average error is 6.9% and the standard deviation of error is 4.2%. The
overall maximum error is 23.9%. At 1.0 mm, the temperature increases during the first
two pulses is slightly higher than that in the experiment. The model reaches the
maximum temperature at the same time (4.3 s) as in the experiment and the predicted
value is 0.8°C higher. The average errors in Phases 1 and 2 are 11.3% and 7.2%,
respectively. The maximum error (23.9%) happens at around 1.5 s, which is at the end of
Phase 1. Two reasons may contribute to the higher error rate in Phase 1. First, a delay of
the temperature measurement is caused by the time constant of the thermistor (250 ms).
Second, the early temperature increase in the model might be the result of not modeling
the tissue fluid movement due to compression. Tissue compression expels the water from
the tissue being compressed to the adjacent tissue. In the experiment, the electrical
current would concentrate in the tissue with more water, and therefore a higher electrical
conductivity. On the other hand, the model shows a higher saturated temperature in the
Phase 3. A possible reason is that the thermistor fixture was not modeled in the FEM.
This fixture may absorb some thermal energy and lower the tissue temperature.

38
Figure 3.7 Comparison of Experimental, 3D FEM temperature profiles (the error
bars show the temperature change within the time constant of the thermistor ± the
tolerance of the thermistor)
At 2.0 mm, the temperature generally matches the experimental results. The
average errors for Phases 1, 2, and 3 are 1.9%, 8.1%, and 4.9%, respectively. The
maximum error (13.5%) occurs in Phase 2. The predicted temperature increases slightly
slower than in the experiment, which causes the larger error. This is attributed to the mass
transfer that occurs due to the water vaporization as it carries the heat away from the
heating region (Ward et al., 2007). This mass transfer effect is not included in this study
because the model has predicted the temperature reasonably well without considering the
mass transfer. It is expected that the heated water vapor moves from the high tissue
temperature regions to surrounding low temperature regions. The vapor carries heat away
and condensates in the lower temperature regions.
At 3.0 mm, the FEM result underestimates temperature. The temperature increase
at this position is mostly due to heat conduction. Since the temperature predicted at 2.0
mm is lower than the experiment (at the beginning of Phase 3), it is expected that the
temperature at 3.0 mm will also be lower. The average errors for Phases 1, 2, and 3 are
1.0%, 2.2%, and 11.0%, respectively. The maximum error 12.4% is found in Phase 3.
30
40
50
60
70
80
90
0 5 10 15
Te
mp
era
ture
( C
)
Time (sec)
Exp-1 mm
FEM-1 mm
Exp-2 mm
FEM-2 mm
Exp-3 mm
FEM-3 mm
30
40
50
60
70
80
90
0 5 10 15
Te
mp
era
ture
( C
)
Time (sec)
Exp-1 mm
FEM-1 mm
Exp-2 mm
FEM-2 mm
Exp-3 mm
FEM-3 mm
Series2
Series3
Phase 1Phase 2 Phase 3

39
3.5 Investigation of the Effects of FEM Techniques
In this section, the effects of the three FEM techniques on the temperature profiles
are presented and discussed.
3.5.1 Effect of Specific Heat (Technique 1)
The temperature profiles of a model without Techniques 1 (ceff) and 2 (σ') is
compared to a model with Techniques 1 and 2, and another model with Technique 1 only
in Figure 3.8. The temperature at 0.8 mm away from the electrode is presented for
illustration purposes because the FEM techniques are more pronounced at this point. In
the model without both Techniques 1 and 2 (shown in solid-dot line), the temperature
keeps increasing. As Technique 1 is incorporated (dashed line), the rate of temperature
increase is slowed as the temperature approaches the evaporation point. The slower
increasing rate indicates the accumulation of latent heat as water is vaporized. This effect
can also be seen in Figure 3.9 (dashed line, 0.2-0.4 mm). Once most of the water is
evaporated (at 11 s), there is only tissue fiber left and ceff drops close to cf. Thus, the
temperature increases rapidly. It also shows a larger temperature oscillation with the on
and off of the electrical pulses input because of the low specific heat. The temperature
then continues increasing to over 200°C till the end of the measurement.
Figure 3.8 . Effects of Techniques 1 and 2 showing temperature profiles at 0.8 mm
away from the edge of electrode
With Techniques 1, 2 & 3
With Techniques 1 & 2,
Without Technique 3
Without Techniques
1, 2 & 3
With Technique 1,
Without Techniques 2 & 3
0
50
100
150
200
250
300
350
0 5 10 15
Tem
pera
ture
( C
)
Time (sec)
Const c and
σ
c(T) and
Const σ
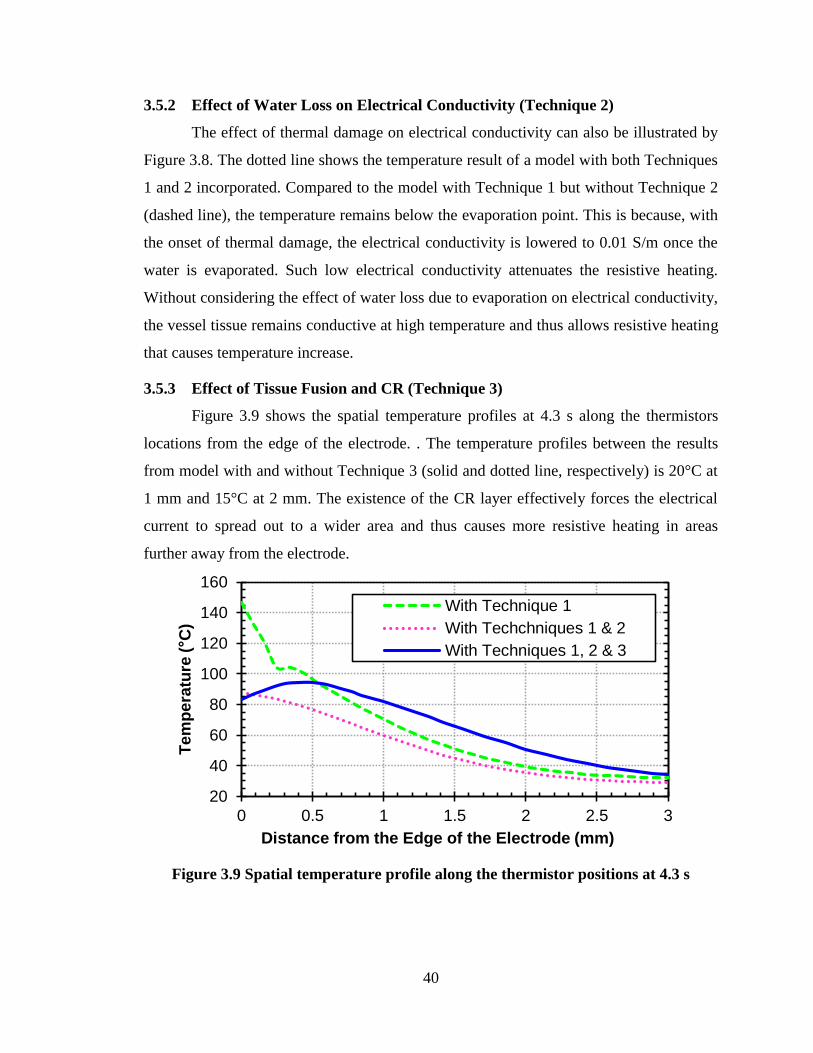
40
3.5.2 Effect of Water Loss on Electrical Conductivity (Technique 2)
The effect of thermal damage on electrical conductivity can also be illustrated by
Figure 3.8. The dotted line shows the temperature result of a model with both Techniques
1 and 2 incorporated. Compared to the model with Technique 1 but without Technique 2
(dashed line), the temperature remains below the evaporation point. This is because, with
the onset of thermal damage, the electrical conductivity is lowered to 0.01 S/m once the
water is evaporated. Such low electrical conductivity attenuates the resistive heating.
Without considering the effect of water loss due to evaporation on electrical conductivity,
the vessel tissue remains conductive at high temperature and thus allows resistive heating
that causes temperature increase.
3.5.3 Effect of Tissue Fusion and CR (Technique 3)
Figure 3.9 shows the spatial temperature profiles at 4.3 s along the thermistors
locations from the edge of the electrode. . The temperature profiles between the results
from model with and without Technique 3 (solid and dotted line, respectively) is 20°C at
1 mm and 15°C at 2 mm. The existence of the CR layer effectively forces the electrical
current to spread out to a wider area and thus causes more resistive heating in areas
further away from the electrode.
Figure 3.9 Spatial temperature profile along the thermistor positions at 4.3 s
20
40
60
80
100
120
140
160
0 0.5 1 1.5 2 2.5 3
Tem
pera
ture
( C
)
Distance from the Edge of the Electrode (mm)
With Technique 1
With Techchniques 1 & 2
With Techniques 1, 2 & 3

41
3.6 Conclusions
This study presented an advanced bio-heat transfer FEM with three techniques
that were critical to enable the accurate prediction of the temporal and spatial
distributions of tissue temperature during electrosurgical vessel sealing. This FEM has
been experimentally validated by an in-vivo porcine femoral artery model. With the FEM
techniques developed in this study, the accuracy of FEM for electrosurgical vessel
sealing has been improved significantly and demonstrated the importance of
incorporating the effective specific heat accounting for latent heat, the effect of water loss
on electrical conductivity, and the CR for tissue fusion.
Two future research directions have been identified. One is a more comprehensive
study on CR and tissue fusion in electrosurgical vessel sealing. An estimated conductivity
(0.005 S/m) of the CR layer was used and the regions of progressive change of CR were
designated. The other is the effect of mass transfer, particularly the water in the tissue.
The movement of tissue fluid due to compression and vaporization needs to be further
studied. The water content of tissue has significant effects on tissue thermal and electrical
conductivity. The coupled effect of mass and bio-heat transfer will be studied to further
improve the accuracy of the FEM prediction.

42
References
Berjano E J 2006 Theoretical modeling for radiofrequency ablation: state-of-the-art and
challenges for the future Biomedical Engineering Online 5 24
Campagnacci R, de Sanctis A, Baldarelli M, Rimini M, Lezoche G and Guerrieri M 2007
Electrothermal bipolar vessel sealing device vs. ultrasonic coagulating shears in
laparoscopic colectomies: a comparative study Surg. Endosc. 21 1526-31
Campbell P A, Cresswell A B, Frank T G and Cuschieri A 2003 Real-time thermography
during energized vessel sealing and dissection Surg. Endosc. 17 1640-5
Chastagner M W 2010 Invesitgation of eletrosurgical tissue joining. In: Mech. Eng., (Ann
Arbor: University of Michigan-Ann Arbor)
Dewhirst M, Viglianti B, Lora-Michiels M, Hanson M and Hoopes P 2003 Basic
principles of thermal dosimetry and thermal thresholds for tissue damage from
hyperthermia Int. J. Hyperthermia 19 267-94
Dilley A V, Mary-Anne G F and David L M 1995 An experimental study of optimal
parameters for bipolar electrocoagulation Gastrointest. Endosc. 42 27-30
Dodde R E, Bull J L and Shih A J 2012 Bioimpedance of soft tissue under compression
Physiol. Meas. 3 1095-109
Dodde R E, Miller S F, Geiger J D and Shih A J 2008 Thermal-electric finite element
analysis and experimental validation of bipolar electrosurgical cautery Journal of
Manufacturing Science and Engineering 130 021015-1-8
Duck F A 1990 Physical properties of tissue: a comprehensive reference (London:
Academic Press)
Goldberg S N 2001 Radiofrequency tumor ablation: principles and techniques Eur. J.
Ultrasound 13 129-47
Golombeck M A, Dossel O, Saubert A and Tonnier V M 1999 Magnetic resonance
imaging with implanted neurostimulators: a first numerical approach using finite
integration theory. In: International Symposium on Electromagnetic
Compatibility, (Magdeburg, Germany
Haemmerich D, Chachati L, Wright A S, Mahvi D M, Lee F T, Jr. and Webster J G 2003
Hepatic radiofrequency ablation with internally cooled probes: effect of coolant
temperature on lesion size IEEE Trans. Biomed. Eng. 50 493-500

43
Heniford B, Matthews B, Sing R, Backus C, Pratt B and Greene F 2001 Initial results
with an electrothermal bipolar vessel sealer Surg. Endosc. 15 799-801
Kennedy J S, Stranahan P L, Taylor K D and Chandler J G 1998 High-burst-strength,
feedback-controlled bipolar vessel sealing Surg. Endosc. 12 876-8
Li W 2005 Modeling and on-line estimation of electrode wear in resistance spot welding
J. Manuf. Sci. Eng. 127 709-17
Martin G T and Angelone L 2009 Multiphysics model of the NovaSure endometrial
ablation procedure. In: The COMSOL Conference, (Boston, MA
Newcomb W, Hope W, Schmelzer T, Heath J, Norton H, Lincourt A, Heniford B and
Iannitti D 2009 Comparison of blood vessel sealing among new electrosurgical
and ultrasonic devices Surg. Endosc. 23 90-6
Pearce J A and Thomsen S L 1992 Kinetic models of tissue fusion processes. In: Proc. of
SPIE 1643, pp 251-5
Pennes H H 1948 Analysis of tissue and arterial blood temperatures in the resting human
forearm J. Appl. Physiol. 1 93-122
Ponsky T A, Khosla A and Rothenberg S S 2009 Experience with a new energy source
for tissue fusion in pediatric patients J. Laparoendosc. Adv. Surg. Tech. 19 1-3
Shen W T, Baumbusch M A, Kebebew E and Duh Q Y 2005 Use of the electrothermal
vessel sealing system versus standard vessel ligation in thyroidectomy Asian J.
Surg. 28 86-9
Smaldone M C, Gibbons E P and Jackman S V 2008 Laparoscopic nephrectomy using
the EnSeal tissue sealing and hemostasis system: successful therapeutic
application of nanotechnology JSLS 12 213-6
Tungjitkusolmun S, Staelin S T, Haemmerich D, Tsai J Z, Cao H, Webster J G, Lee Jr F
T, Mahvi D M and Vorperian V R 2002 Three-dimensional finite-element
analyses for radio-frequency hepatic tumor ablation IEEE Trans. Biomed. Eng. 49
3-9
Tungjitkusolmun S, Woo E J, Cao H, Tsai J Z, Vorperian V R and Webster J G 2000
Thermal-electrical finite element modelling for radio frequency cardiac ablation:
effects of changes in myocardial properties Med Biol Eng Comput 38 562-8

44
Vellimana A K, Sciubba D M, Noggle J C and Jallo G I 2009 Current technological
advances of bipolar coagulation Neurosurgery 64 11-9
Ward A K, Ladtkow C M and Collins G J 2007 Material removal mechanisms in
monopolar electrosurgery. In: 29th Annual International Conference of the IEEE
(Lyon, France pp 1180-3
Wright N T and Humphrey J D 2002 Denaturation of collagen via heating: an irreversible
rate process Annu Rev Biomed Eng 4 109-28
Wu M P, Ou C S, Chen S L, Yen E Y and Rowbotham R 2000 Complications and
recommended practices for electrosurgery in laparoscopy Am. J. Surg. 179 67-73
Yang D, Converse M C, Mahvi D M and Webster J G 2007a Expanding the bioheat
equation to include tissue internal water evaporation during heating IEEE Trans.
Biomed. Eng. 54 1382-8
Yang D, Converse M C, Mahvi D M and Webster J G 2007b Measurement and analysis
of tissue temperature during microwave liver ablation IEEE Trans. Biomed. Eng. 54
150-5

45
CHAPTER 4
THERMO-ELECTRICAL MODELING OF BIPOLAR
COAGULATION ON POSTERIOR SPINAL ARTERY IN A
PORCINE SPINAL SURGERY MODEL
ABSTRACT
A thermo-electrical model, with both solid and liquid phases to calculate tissue
temperature during bipolar coagulation of a posterior spinal artery on the spinal cord is
developed. Control of thermal spread caused by coagulation is a concern in spinal surgery
as neural tissues are vulnerable to thermal injury. When the electrical energy is applied,
the spinal fluid on top of spinal cord flows due to electrical field and thermal convection.
The flow of the spinal fluid affects the temperature distribution because the heat may be
carried away by the fluid flow. The model developed in this study incorporates the flow
effect to accurately predict the temperature profiles. The model is validated by ex-vivo
temperature measurements on a porcine spinal cord model. The maximum error on tissue
temperature of this model is 12.6% and the overall average error is 4.2%. The lesion
region (>50ºC) is identified and thermal dose, cumulative equivalent minutes at 43°C
(CEM43), is also calculated with this model.
Contents of this chapter will be submitted to IEEE Transaction on Biomedical
Engineering as Roland K. Chen, Khoi D. Than, Paul Park, and Albert J. Shih, "Thermo-
Electrical Modeling of Bipolar Coagulation on Posterior Spinal Artery in a Porcine
Spinal Surgery Model."

46
4.1 Introduction
Bipolar coagulation is an important procedure to control bleeding in neurosurgery.
This procedure involves the use of electrical energy to generate heat in both spinal cord
or brain (solid phase) and cerebrospinal fluid (liquid phase). The concept of bipolar
forceps was first presented by Greenwood in 1940 (Greenwood Jr, 1940) and remains a
standard configuration to this day. The first commercial bipolar coagulation system was
developed by Malis (Malis, 1967) in the 1960s. This bipolar approach of delivering
electrical current to tissue successfully restrains the electrical energy and joule heating in
a smaller volume of tissue, comparing to that of the monopolar manner (Chehrazi and
Collins Jr, 1981). The thermal spread due to the coagulation may introduce thermal injury
to the surrounding neural tissue and lead to undesirable surgical outcomes.
In neurosurgery, bipolar forceps with sharp tips (0.25 mm to 2 mm wide) are used
in delicate surgical procedures (often performed under microscopic visualization) to
coagulate vessels right on the surface of the spinal cord or cerebral cortex, which have a
low temperature threshold for thermal injury (around 43°C) (Dewhirst et al., 2003).
Different coatings on the tip, such as silver and gold, have been used to help dissipate
heat and prevent tissue sticking (Mikami et al., 2004). Heat pipe has also been
incorporated into the bipolar forceps (Elliott-Lewis et al., 2010; Elliott-Lewis et al., 2009;
Arakawa, 2005) and shown to reduce thermal damage compared to conventional forceps.
Since the tissue must be heated to seal the vessel, the adjacent tissue is at risk of thermal
damage because of the thermal spread from the sealing site.
A better understanding of the thermal spread can help to prevent and reduce the
thermal injury in neurosurgery. The temperature distribution in the tissue is difficult to
quantify. Even with an infrared thermal camera, only the surface temperature can be
measured. The subsurface thermal injury information relies on histological analysis
which cannot determine the tissue temperature (Elliott-Lewis et al., 2010). An accurate
thermo-electrical finite element modeling (FEM) provides insightful information for
thermal spread temporally and spatially.
Previous studies on electrosurgical modeling, combining Joule heating and bio-
heat transfer, focused primarily on tumor ablation in different organs (Haemmerich et al.,
2003; Martin and Angelone, 2009; Tungjitkusolmun et al., 2000) or vessel sealing (Chen

47
et al., 2012). However, all these studies only modeled the solid phase heat conduction.
While in the case of vessel coagulation in neurosurgery, the cerebrospinal fluid (or its
mixture with saline due to irrigation) on the surface plays an important role, not only on
current dissipation but also on heat distribution.
Electrothermally induced fluid flow has been studied intensively to manipulate
and separate bioparticles (Green et al., 2001; Ramos et al., 1999b; Green et al., 2000).
When electrical current is applied to a conductive fluid (for example, the NaCl solution),
the electrical field will generate the electrical force not only on the particles but also on
the fluid (Ramos et al., 1999a). In these studies, the gravity force, which varies with
fluid density and is related to temperature, is neglected because the overall temperature
rise is less than 20ºC. However, during the coagulation, the temperature can increase
more than 70ºC and the gravity force may not be negligible.
In this study, we aim to develop a two-phase (solid-liquid) thermo-electrical FEM
to predict the temporal and spatial distributions of tissue temperature during bipolar
coagulation of a posterior spinal artery on the surface of spinal cord. The stainless steel
bipolar forceps (0.5 mm tip radius) without any special coating are used to perform
coagulation and the experiment results are used to validate the FEM. With this model,
the tissue coagulation region is identified
An ex-vivo porcine animal model was used for the experiment. All the procedures
were done in the animal surgery operating room at the University of Michigan Medical
School compliant to the protocol approved by the University Committee on Use and Care
of Animals. A stainless steel bipolar forceps (DePuy Codman & Shurtleff, Warsaw, IN)
was used to perform coagulation (Figure 4.1(a)).
Tissue temperature was measured by micro-thermistors (Model: 56A1002-C8;
Alpha Technics, Irvine, CA). This type of thermistor was chosen because of its small
dimension (0.46 mm outside diameter) and relative immunity to electromagnetic
interference (Dodde et al., 2009). The thermistor has a measurement tolerance of ± 0.1°C
and 250 ms thermal response time. The temperature reading was acquired by a data
acquisition system (PXI-1033; National Instruments, Austin, TX) with 100 Hz sampling
rate. The tissue temperature was measured at three positions: midpoint between forceps
tips (thermistor #1), 1.0 mm (thermistor #2), and 2.0 mm (thermistor #3) away from the

48
midpoint along the centerline, as shown in Figure 4.1(a) and later in Fig. 3(a). An acrylic
fixture was created to ensure temperature measurements were recorded at precise
locations (Figure 4.1(c)). The spacing between the forceps tips were fixed at 2.0 mm by
use of another fixture, as shown in Figure 4.1(a). The voltage and current input to the
bipolar forceps were measured by a voltage probe (Model: 10076A, Agilent, Santa Clara,
CA) and a current probe (Model: 1147A, Agilent), respectively. These electrical data
were collected at 4 MHz.
Figure 4.1 The bipolar forceps used in this study (a) overview, (b) close-up view of
forceps tips, and (c) forceps tip with temperature measurement setup
The experiment was carried out immediately after the pig was euthanized. The
dura mater of the porcine spine was opened by a neurosurgeon to expose a posterior
spinal artery on the spinal cord, as shown in Figure 4.2(a). Two arteries with diameter of
0.4 to 0.5 mm were chosen to be coagulated. The forceps were powered by an
electrosurgical generator, Valleylab Force FX (Covidien, Boulder, CO) with 25 Malis
units. Activation time of the generator was fixed at 5 seconds.

49
Figure 4.2 (a) Spinal cord with dura mater opened and (b) coagulation of the
posterior spinal artery on spinal cord
4.2 Finite Element Modeling
The two-phase (solid-liquid) thermo-electrical FEM consists of two physics fields:
thermal and electrical fields. The electrical field was governed by Laplace equation and
coupled to the thermal field by a Joule heat generation term. In the thermal field, the solid
and fluid phases were modeled by heat conduction in solids and non-isothermal flow,
respectively. There are four dependent variables solved in the model: voltage,
temperature, velocity, and pressure. The formulations for electrical field, heat conduction
in solids and non-isothermal flow are introduced in the following sections.
4.2.1 Electrical Field Formulation
The electrical potential (V) in the tissue and electrode has been described in a previous
study by solving the Laplace equation (Chen et al., 2012). The electrical field, E (V/m))
can be obtained by calculating the gradient of electrical potential.
V E (4.1)
The current density, J (A/m2) is then calculated by
J E (4.2)
where σ is the temperature-dependent electrical conductivity (S/m). The Joule heat
generation term, qg can be calculated by multiplying the electrical field with the current
density and used to couple the electrical field to thermal field.

50
4.2.2 Thermal Field Formulation
Heat Conduction in Solid:
The general bio-heat equation for conduction in solids developed by Pennes
(Pennes, 1948) can be expressed as:
2 ( ) m gb b b b
Tc k T c w T T q q
t
(4.3)
where ρ is the tissue density (kg/m3), c is the tissue heat capacity (J/kg·K), t is the time
(s), k is the tissue thermal conductivity (W/m·K), T is the local tissue temperature (K), ρb
is the blood density (kg/m3), cb is the blood heat capacity (J/kg·K), wb is the effective
blood perfusion parameter (1/s), Tb is the blood temperature (K), qm is the metabolic heat
generation rate (W/m3), and qg is the heat generation (W/m
3) due to the externally
induced electrosurgical heating of the tissue. In the ex-vivo case, it is assumed that the
metabolic heat generation and blood perfusion were zero (qm = 0 and wb = 0).
Non-isothermal Flow:
Given that metabolic heat generation and blood perfusion were zero, the heat
transfer equation for a non-isothermal flow can be simplified as (Kraus et al., 2012):
2g
Tc c T k T q
t
u (4.4)
where u is the velocity field of the fluid (m/s). The velocity for a Newtonian
incompressible fluid is governed by Navier-Stoke’s equation (Gonzalez et al., 2000):
2e gp
t
uu u u F F (4.5)
and the continuity equation:
( ) 0t
u (4.6)

51
where p is the pressure (N/m2), µ is the viscosity of spinal fluid (kg/m·s), Fe is the
electric force density (N/m3) and Fg is the volume force caused by gravity (N/m
3). The
electrical force density is estimated by (Green et al., 2001):
21
2e q E F E (4.7)
where ρq is the charge density, and E is the magnitude of the electrostatic field, and ε is
the permittivity (Gabriel et al., 1999). The gravity force is:
g gF (4.8)
where g is the gravity, 9.8 m/s2.
4.2.3 Material Properties
Materials modeled in this two-phase thermo-electrical FEM include the spinal
cord, artery wall, spinal fluid, blood, and stainless steel (for bipolar forceps) and
thermistor. Table 4.1 lists the density (ρ), specific heat (c), thermal conductivity (k),
electrical conductivity (σ), and viscosity (μ).
The density of spinal fluid is considered as temperature-dependent and is given by
Arps (Arps, 1953). The change of density with temperature is a nature of fluid which
causes the heat convection. Specific heat of tissue has been modified to account for the
accumulation of latent heat (Yang et al., 2007). In this study, the effective specific heat
which is based on the water loss with temperature is used for both spinal cord and artery
wall.
The thermal conductivities of spinal cord and artery wall are assumed to be
temperature-dependent and can be expressed as (Golombeck et al., 1999):
0.0013( )ref refk k T T (4.9)
where kref is the reference thermal conductivity at Tref (25°C). The kref for spinal cord and
artery wall are listed in Table 4.1. The electrical conductivities of spinal cord and artery

52
wall are also assumed to be temperature dependent, increasing at a rate of 2%/°C
(Berjano, 2006), and can be expressed as:
1 0.02( )ref refT T
(4.10)
where σref is the reference electrical conductivity at Tref (25°C). The reference electrical
conductivities for spinal cord and artery wall can be found in Table 4.1. This increasing
rate is only applied for T<103°C. For T≥103°C, the tissue is considered to be thermally
damaged and will have a low electrical conductivity of 0.01 S/m (Chen et al., 2012).
Table 4.1 Material Properties Used in the FEM
Domain ρ [kg/m3] c [J/kg·K] k [W/m·K] σ [S/m] μ [Pa S]
Spinal cord 1038 a 3600
a 0.503*
, a 0.60**
, a -
Artery wall 1050 a 3314
a 0.450*
, a 0.33**
, d -
Spinal fluid ρ(T) b 3900
a 0.570
a 1.53
a 7.15∙10
-4 f
Blood 1060 c 3890
c 0.531
a 0.67
e -
*Used as kref in Eq. (4.9), **used as σref in Eq. (4.10)
a: Duck (Duck, 1990), b: Arps (Arps, 1953), c: Golombeck et al. (Golombeck et al.,
1999), d: Edgerton (Edgerton, 1975), e: Tungjitkusolmun et al. (Tungjitkusolmun et al.,
2002), and f: Brydon et al. (Brydon et al., 1995)
4.2.4 Model Configuration, Mesh, Boundary Conditions, and Computational
Solver
The configuration of the model is shown in Figure 4.3 with the tips of bipolar
forceps across a posterior spinal artery near the surface of the spinal cord. The spinal cord
is covered by a thin (0.15 mm) layer of spinal fluid. The thermistors used to measure
temperature are also included in the model because the size of the thermistor is in a
similar scale to other features and thus the effect of thermistor needs to be considered.
The spinal cord tissue is modeled as a block with 20.0 mm long, 15.0 mm wide, and 10.0
mm thick. The first thermistor locates in the midpoint of the two tips, as shown in Figure
4.3(a). The second and third thermistors are 1.0 and 2.0 mm away from the first
thermistor along the centerline, respectively. Figure 4.3(b) shows the close-up view of the

53
cross-sectional plane across the forceps tips and details of the geometry of the FEM. The
spacing of the tips is 2.0 mm. The thermistor has a diameter of 0.46 mm and 3.0 mm long.
The spinal fluid layer has a thickness of 0.15 mm. The artery is assumed to be straight
throughout the block of spinal cord. The artery wall has an outside diameter of 0.5 mm
and 0.4 mm inside diameter. The center of the artery is 0.3 mm below the surface of the
spinal cord.
Figure 4.3 (a) Configuration of modeled bipolar coagulation on a spinal artery and
(b) detailed geometry on the cross section across the forceps tips
10.0
15.0
20.0
0.5
0.4
0.1
5
0.46
2.0
3.0
0.3
(a)
(b)
2.0
1.0
Forceps Tip
Spinal Tissue
Spinal FluidThermistors
Artery
1.0
1.25
0.5 A
B
C
D
Active Forceps Tip (61 V)
Ground Forceps Tip (0 V) Units: mm
Free Convection
h = 25 (W/m·K2)
Thermal and
Electrical Insulation

54
The FEM mesh is generated based on each domain. For the spinal fluid layer, the
maximum element size is 0.05 mm, so that there are at least three elements across the
thickness of the fluid layer. The maximum element growth rate is 1.2 for remesh. The
mesh is refined until the maximum temperature at the midpoint between forceps tips
differed by less than 0.1°C compared to a finer mesh. The final mesh consisted of
353,991 tetrahedral elements and a total of 1,359,631 degree of freedoms. The velocity
components were discretized by second order elements and all other dependent variables
(pressure, temperature, and voltage) were by linear elements.
For the electrical boundary conditions, the experimentally measured electrical AC
voltage was first converted to a DC source voltage by calculating its root-mean-square
(RMS) value (Berjano, 2006) and then applied to the end surface of the active forceps
tips, as shown in Figure 4.3(a). During the 5 s coagulation time, the RMS voltage
remained as a constant of 61 V. The end surface of the ground forceps tip was set as 0 V.
Electrical continuity was applied to all the inner surfaces. All other outside surfaces were
set as electrical insulating, assuming no electrical current can go through these surfaces.
For the thermal boundary conditions of heat transfer in solids and non-isothermal flow,
the heat source (qg in Eqs. (4.3) and (4.4)) of total power generation from the electrical
field was applied to all domains as the thermal input. The top surface of the spinal fluid
and all the outer surfaces of both forceps tips and thermistors were subject to free
convection ambient temperature and convective heat transfer coefficient set to 25
W/m2·K. For other surfaces on the side and bottom, thermal insulation was applied,
assuming that there was no heat exchange across these surfaces.
For the non-isothermal flow, which was only applied to the spinal fluid layer, the
top surface of the spinal fluid is set as slip wall, assuming there were no viscous effects at
the boundary and the bottom and side surfaces (the surface contacting with the spinal
cord) were set to non-slip wall, which means the flow velocity on the wall is zero (u=0).
The model was solved by COMSOL Multiphysics 4.2 (Burlington, MA) with
direct PARDISO solver (Shenk and Gärtner, 2004). A personal computer with six cores
(3.2 GHz) and 24 GB random-access memory (RAM) was used to perform the
computational work. The computational time for the model with final mesh was about 48
hours.

55
4.3 Results
4.3.1 Validation of FEM with Experimental Measurements
Figure 4.4 shows the comparison of experimentally measured tissue temperature
with the FEM predictions during the bipolar coagulation. The temperatures at the three
measurement points, midpoint, 1.0, and 2.0 away from the forceps tips (Figure 4.3(a)) are
presented. The overall average error is 4.2%. The maximum error for midpoint, 1.0, and
2.0 mm are 6.9%, 3.5%, and 12.6%, respectively.
Figure 4.4 Comparison of the temperature profiles of experimental and FEM results
at the three measurement points
4.3.2 Spatial and Temporal Temperature Distributions and Thermal Dose
Figure 4.5 shows the spatial and temporal temperature distribution of the cross-
sectional plane. The maximum temperature occurs at the tissue and spinal fluid right next
to the forceps tips, because there has the highest current density and strongest effect of
Joule heating.
The lesion region can be defined as where tissue temperature is over 50°C
(Tungjitkusolmun et al., 2002) and is marked by the black line. The lesion region reaches
the maximum width at 5 s. At this moment, the region has a 5 mm width and is 1.0 mm
deep. At 6 s (1 s after power shut off), the region of tissue with temperature over 50°C
25
30
35
40
45
50
55
60
65
0 2 4 6 8 10
Tem
peratu
re ( C
)
Time (s)
253035404550556065
0 1 2 3 4 5 6 7 8 9 10
Te
mp
era
ture
(de
gC
)
Time (sec)
Exp-Midpoint Exp-1 mm Exp-2 mm
FEM-Midpoint FEM-1 mm FEM-2 mm
253035404550556065
0 1 2 3 4 5 6 7 8 9 10
Te
mp
era
ture
(de
gC
)
Time (sec)
Exp-Midpoint Exp-1 mm Exp-2 mm
FEM-Midpoint FEM-1 mm FEM-2 mm
Power Activation
253035404550556065
0 1 2 3 4 5 6 7 8 9 10
Te
mp
era
ture
(de
gC
)
Time (sec)
Exp-Midpoint Exp-1 mm Exp-2 mm
FEM-Midpoint FEM-1 mm FEM-2 mm
Midpoint
1 mm
2 mm
Midpoint
1 mm
2 mm

56
remains 4.8 mm wide and propagates deeper to 1.1 mm. At 10 s, all the tissue
temperature falls below 50°C.
Figure 4.5 Cross-sectional view of temperature distribution. The black lines mark
the boundary of 50°C
Figure 4.6 shows the simulated temperature profiles at the four points as marked
as A, B, C, and D in Figure 4.3(b). Point A is at the tip of the bipolar forceps. Points B
and C are 0.5 mm and 1.0 mm below Point A, respectively. Point D is at the center of the
spinal artery. For point A, the temperature increases rapidly to 90°C in about only 0.5 s.
The temperature rise then slows down because the latent heat is being accumulated.
When the temperature exceeds 105°C, the electrical conductivity of spinal tissue
decreases to 0.01 (S/m) due to the water loss (Chen et al., 2012). This decrease on the
electrical conductivity weakens the effect of Joule heating, so that the temperature rise
remains slow throughout the rest of the power activation time. The temperature drops
quickly immediately after the activation stops, but then slows down because the tissue is
releasing the latent heat. Once all the latent heat is released (at 7 s), the temperature
descending rate becomes proportional to the temperature gradient to the surrounding
tissue.
(a) 1 s (b) 3 s (c) 5 s
(d) 6 s (e) 8 s (f) 10 s
1 mm
5.0 mm
1.0
mm
4.8 mm
1.1
mm
(°C)

57
Figure 4.6 Simulated temperature profiles at points A: tip of the forceps, B: 0.5 mm
below point A, C: 1.0 mm below point A, and D: center of the spinal artery
The temperature profiles at Points B and C follow the trend of Point A during the
power activation time, but in a smaller scale. After the activation, the temperature
continues increasing for about 1 s due to the heat conducted from Point A. The
temperature of Point B decays slower than that of Point A because Point A contacts with
the bipolar forceps (stainless steel) which has higher thermal conductivity than that of
spinal cord and conducts heat away more efficiently. As a result, the temperature of Point
B remains above 50°C for 8 s (from 0.5 ‒ 8.5 s). The temperature at the center of the
spinal artery (Point D) rises slowly and reaches 59°C at the end of power activation.
Considering the coagulation temperature of 50°C (Sapareto and Dewey, 1984), the
temperature at center of the artery increases to this level in 2.2 s.
Cumulative equivalent minutes at 43°C (CEM43) is the most common thermal
dose model to evaluate thermal damage in a variety of tissues (Dewhirst et al., 2003).
Thermal dose, CEM43 as a function of both temperature and time can be calculated as:
(43 )
043
t finalT
t
CEM t R
(4.11)
20
30
40
50
60
70
80
90
100
110
120
0 2 4 6 8 10
Tem
peratu
re ( C
)
Time (s)
A B
C D
Power Activation

58
where Δt is the time interval, R is a constant equal to 0.25 when T<43°C and 0.5 when
T>43°C, and T is the average temperature during the time interval Δt (Dewhirst et al.,
2003). The thermal dose for points A, B, C, and D were calculated. For points A, B, and
C, the CEM43 values are higher than 1000 at the end of activation (t = 5 s) which are
higher than the threshold value (>240) to cause gross appearance thermal damage
(Yarmolenko et al., 2011). For point C, the CEM43 is 0.71 when t = 5 s and reaches 9.33
when t = 10 s, which is in the range (0-20) of causing thermal damage that can be
examined by histopathology (Yarmolenko et al., 2011).
4.3.3 Effect of Non-Isothermal Flow
The effect of the non-isothermal flow can be seen by Figure 4.7. Compared to the
model with both heat transfer in solids (denoted as Solid) and non-isothermal flow
(denoted as Solid & Flow), the Solid model shows higher temperature at the midpoint.
For the temperature at 1 mm, the Solid model shows close temperature as the Solid &
Flow model during the first 5 s activation. After the activation stops, the temperature of
Solid & Flow model decreases faster than the Solid model, as the heat can be carried
away by the non-isothermal flow. For the temperature at 2 mm, the Solid model shows a
slower temperature increase in the beginning but eventually reaches the same level as that
of the Solid & Flow model because the Solid Model has a higher temperature at 2 mm
after 6 s.
Figure 4.7 Comparison of temperature profiles between models with both heat
transfer in solids and non-isothermal flow (Solid & Flow) and model with heat
transfer in solids only (Solid).
25
30
35
40
45
50
55
60
65
0 2 4 6 8 10
Tem
pera
ture
( C
)
Time (s)
25
30
35
40
45
50
55
60
65
0 2 4 6 8 10
Tem
pera
ture
( C
)
Time (s)
Solid & Flow-Midpoint
Solid-Midpoint
Solid & Flow-1 mm
Solid-1 mm
Solid & Flow-2 mm
Solid-2 mm
Midpoint
Midpoint
1 mm
1 mm
2 mm
2 mm
Power Activation

59
4.4 Discussion and Conclusions
Three uncertain parameters in the FEM are: (i) thickness of the spinal fluid layer,
(ii) wall thickness of the artery, and (iii) depth of the artery. For the thickness of the
spinal fluid layer, it is estimated by calculating the electrical resistance value between the
two forceps tips. Both the voltage and current consumption were recorded during the
experiment that allows the calculation of the electrical resistance between the two tips. In
the FEM, the thickness of the spinal fluid was adjusted to match the electrical resistance
between the two tips. The electrical resistance value in the FEM was calculated by
integrating the current density over the surfaces of forceps tips that contact with either the
spinal fluid or the spinal cord to get the total current value. The electrical resistance can
be obtained by dividing the input voltage over the total current.
A sensitivity analysis was performed to evaluate effect of the other two uncertain
factors, the wall thickness and the depth of the artery. The wall thickness was varied from
0.01 to 0.1 mm (0.05 mm was used in this model) and resulting temperature profiles did
not differ more than 1°C in all three thermistor positions. For the depth of the artery, a
range between 0.26 to 0.5 mm was tested (0.3 mm was used in this model). Given the
radius of the artery is 0.25 mm (0.5 mm diameter), the depths of 0.26 mm and 0.50 mm
correspond to the distances between the top of the artery to the spinal cord surface of 0.01
and 0.25 mm, respectively. For depth that is smaller than 0.35 mm, the variation of
temperature among different depths at all three points is less than 1°C. When the depth is
increased to 0.5 mm, the temperature at 2.0 mm at the end of 5 s is 2.6°C lower than that
of 0.3 mm depth. The reason is that the artery wall has a lower electrical conductivity
than that of spinal cord tissue. When the artery is very close to the spinal cord surface, the
artery wall forms a barrier for electrical current and thus forces the current to spread out
further. Since the spinal artery is visible, a shallow depth is expected.
This study demonstrated that a thermo-electrical FEM with the combination of
heat conduction in solids and non-isothermal flow could accurately predict the spatial and
temporal temperature distribution during bipolar coagulation on spinal artery. As
predicted in the model (Figure 4.5), the highest temperature occurs at the surrounding of
the forceps tips. Therefore, it would be recommended that when performing coagulation,
the forceps tips should be placed as close as possible to best use the generated heat and

60
minimize the thermal damaged region. The lesion region and size were identified with the
FEM. While the coagulation is usually done with the existence of cerebrospinal fluid or
irrigation, the effect of the fluid flow needs to be considered when modeling this
procedure. This model can be further applied to study the thermal dose of tissue under
coagulation and different waveforms to deliver electrical energy to minimize the lesion
region.

61
References
Arakawa Y 2005 Application of the bipolar forceps with heat pipe technology (IsoCool)
in neurosurgery Japanese Journal of Neurosurgery 14 698-705
Arps J 1953 The effect of temperature on the density and electrical resistivity of sodium
chloride solutions Journal of Petroleum Technology 5 17-20
Berjano E J 2006 Theoretical modeling for radiofrequency ablation: state-of-the-art and
challenges for the future Biomed Eng Online 5 24
Brydon H, Hayward R, Harkness W and Bayston R 1995 Physical properties of
cerebrospinal fluid of relevance to shunt function. 1: The effect of protein upon
CSF viscosity Br. J. Neurosurg. 9 639-44
Chehrazi B and Collins Jr W F 1981 A comparison of effects of bipolar and monopolar
electrocoagulation in brain J. Neurosurg. 54 197-203
Chen R, Chastagner M, Dodde R and Shih A 2012 Electrosurgical vessel sealing tissue
temperature: experimental measurement and finite element modeling Accepted by
IEEE Trans on Biomed Eng
Dewhirst M, Viglianti B, Lora-Michiels M, Hanson M and Hoopes P 2003 Basic
principles of thermal dosimetry and thermal thresholds for tissue damage from
hyperthermia Int. J. Hyperthermia 19 267-94
Dodde R, Shih A and Advincula A P 2009 A novel technique for demonstrating the real-
time subsurface tissue thermal profile of two energized surgical instruments J.
Minim. Invasive Gynecol. 16 599-603
Duck F A 1990 Physical properties of tissue: a comprehensive reference (London:
Academic Press)
Edgerton R H 1975 Radial conductivity of arterial walls Med. Biol. Eng. Comput. 13 531-
4
Elliott-Lewis E W, Jolette J, Ramos J and Benzel E C 2010 Thermal damage assessment
of novel bipolar forceps in a sheep model of spinal surgery Neurosurgery 67 166-
72
Elliott-Lewis E W, Mason A M and Barrow D L 2009 Evaluation of a new bipolar
coagulation forceps in a thermal damage assessment Neurosurgery 65 1182-7

62
Gabriel C, Gabriel S and Corthout E 1999 The dielectric properties of biological tissues:
I. Literature survey Phys. Med. Biol. 41 2231
Golombeck M A, Dossel O, Saubert A and Tonnier V M 1999 Magnetic resonance
imaging with implanted neurostimulators: a first numerical approach using finite
integration theory. In: International Symposium on Electromagnetic
Compatibility, (Magdeburg, Germany
Gonzalez A, Ramos A, Green N, Castellanos A and Morgan H 2000 Fluid flow induced
by nonuniform ac electric fields in electrolytes on microelectrodes. II. A linear
double-layer analysis Physical Review E 61 4019
Green N, Ramos A, Gonzalez A, Morgan H and Castellanos A 2000 Fluid flow induced
by nonuniform ac electric fields in electrolytes on microelectrodes. I.
Experimental measurements Physical Review E 61 4011
Green N G, Ramos A, Gonzalez A, Castellanos A and Morgan H 2001 Electrothermally
induced fluid flow on microelectrodes J. Electrostatics 53 71-87
Greenwood Jr J 1940 Two point coagulation: a new principle and instrument for applying
coagulation current in neurosurgery Am. J. Surg. 50 267-70
Haemmerich D, Chachati L, Wright A S, Mahvi D M, Lee F T, Jr. and Webster J G 2003
Hepatic radiofrequency ablation with internally cooled probes: effect of coolant
temperature on lesion size IEEE Trans. Biomed. Eng. 50 493-500
Kraus A D, Welty J R and Aziz A S 2012 Introduction to thermal and fluid engineering
(Boca Raton: CRC/Taylor & Francis)
Malis L I 1967 ed R M P Donaghy and M G Yasargil (Saint Louis: C. V. Mosby Co) pp
126-30
Martin G T and Angelone L 2009 Multiphysics model of the NovaSure endometrial
ablation procedure. In: The COMSOL Conference, (Boston, MA
Mikami T, Takahashi A, Hashi K, Gasa S and Houkin K 2004 Performance of bipolar
forceps during coagulation and its dependence on the tip material: a quantitative
experimental assay. Technical note J. Neurosurg. 100 133-8
Pennes H H 1948 Analysis of tissue and arterial blood temperatures in the resting human
forearm J. Appl. Physiol. 1 93-122

63
Ramos A, Morgan H, Green N and Castellanos A 1999a AC electrokinetics: a review of
forces in microelectrode structures Journal of Physics D: Applied Physics 31
2338
Ramos A, Morgan H, Green N G and Castellanos A 1999b AC electric-field-induced
fluid flow in microelectrodes J. Colloid Interface Sci. 217 420-2
Sapareto S A and Dewey W C 1984 Thermal dose determination in cancer therapy Int. J.
Radiat. Oncol. Biol. Phys. 10 787-800
Tungjitkusolmun S, Staelin S T, Haemmerich D, Tsai J Z, Cao H, Webster J G, Lee Jr F
T, Mahvi D M and Vorperian V R 2002 Three-dimensional finite-element
analyses for radio-frequency hepatic tumor ablation IEEE Trans. Biomed. Eng. 49
3-9
Tungjitkusolmun S, Woo E J, Cao H, Tsai J Z, Vorperian V R and Webster J G 2000
Thermal-electrical finite element modelling for radio frequency cardiac ablation:
effects of changes in myocardial properties Med Biol Eng Comput 38 562-8
Yang D, Converse M C, Mahvi D M and Webster J G 2007 Expanding the bioheat
equation to include tissue internal water evaporation during heating IEEE Trans.
Biomed. Eng. 54 1382-8
Yarmolenko P S, Moon E J, Landon C, Manzoor A, Hochman D W, Viglianti B L and
Dewhirst M W 2011 Thresholds for thermal damage to normal tissues: An update
Int. J. Hyperthermia 27 320-43
64
CHAPTER 5
MULTI-MODALITY GELLAN GUM-BASED TISSUE-MIMICKING
PHANTOM WITH TARGETED MECHANICAL, ELECTRICAL,
AND THERMAL PROPERTIES
ABSTRACT
Presented in this study is a new class of gellan gum-based tissue-mimicking (TM)
phantom material and a model to predict and control the elastic modulus, thermal
conductivity, and electrical conductivity by adjusting the mass fractions of gellan gum,
propylene glycol, and sodium chloride, respectively. Gellan gum is advantageous for its
gelling efficiency to achieve outstanding mechanical properties (elastic modulus and
toughness). A regression model for quantitative predictions of three material properties
(elastic modulus, thermal conductivity, and electrical conductivity) was found based on
the composition. A spinal cord gellan gum TM phantom formulated based on these
regression models was made to closely match the mechanical, thermal, and electrical
properties of porcine spinal cord. To validate the model and approach, this phantom was
tested under bipolar electrosurgical coagulation and has been demonstrated that the
phantom can produce similar temperature response as the spinal cord tissue.
Contents of this chapter will be submitted to Physics in Medicine and Biology as Roland
K. Chen and Albert J. Shih, "Multi-Modality Gellan Gum-Based Tissue-Mimicking
Phantom with Targeted Mechanical, Electrical, and Thermal Properties."

65
5.1 Introduction
Tissue-mimicking (TM) phantoms are widely used as a surrogate of tissue to study the
performance of medical devices and treatment methods. Gellan gum, an extracellular
anionic polysaccharide, was first discovered in 1978 (Giavasis et al., 2000) as an
alternate to gelatin and agar in food, pharmaceutical industries, gel electrophoresis, and
cell culture (Bajaj et al., 2007). The key advantages of gellan gum are the high gelling
efficiency and ability to produce a wide spectrum of mechanical properties (Sworn, 2009).
Gellan gum requires a third to a half the of gelatin and agar to achieve similar levels of
mechanical strength (Morris et al., 2012). Gellan gum also has good thermal stability
(Lorenzo et al., 2013) and flexibility of properties necessary to mimic soft tissues. Until
recently the research of gellan gum has been limited to food industry (Evageliou et al.,
2010b). With this study we propose to use gellan gum as the gelling agent for TM
phantom with specific mechanical, electrical, and thermal properties. This TM phantom
can be used for electrosurgery and radiofrequency ablation.
Having equivalent properties to tissue is the most important requirement for a TM
phantom. Material properties of TM phantom that have been manipulated in previous
studies are summarized in Table 5.1. Modifiers to tailor different material properties are
also listed in Table 5.1. TM phantoms are usually made of either chemically synthesized
polymer (CSP) (e.g. silicone and polyvinyl chloride (PVC)) or biopolymer (e.g. gellan
gum, gelatin, and agar). CSPs have a wider variety of mechanical properties and have
good long-term stability over biopolymers because they do not contain water. CSPs are
generally good electrical insulators; although addition polymerization with radicals or
ions can make them electrically conductive (Guimard et al., 2007). However, CSPs have
much lower thermal conductivities and specific heats than those of soft tissue. Thus,
CSPs are ideal for mechanically oriented TM phantom, but not for thermally or
electrically related purposes. On the other hand, biopolymers, which usually consist of
two basic components, gelling agent and water, is more tissue-like in many aspects as
both biopolymer and soft tissue share high mass fraction of water (over 80%).

66
Table 5.1 Manipulated material properties in TM phantom
Category Property Modifier Reference
Mechanical Elastic
modulus
Gelling agent (Clark and Ross-Murphy, 1985)
Strength Salt, sugar (Tang et al., 1996; Evageliou et
al., 2010b)
Fracture
toughness
Gelling agent, salt,
sugar
(Tang et al., 1996; Evageliou et
al., 2010a)
Thermal Conductivity Oil, propylene glycol (Craciunescu et al., 1999;
McDonald et al., 2004)
Specific heat Aluminum powder (Leonard et al., 1984)
Melting point Formaldehyde (Lazebnik et al., 2005)
Electrical Conductivity Metal powder,
sodium chloride,
carbon
(Guy, 1971; Huang, 2002)
Permittivity Oil, Polyethylene (Stuchly, 1980)
Acoustic Scattering Glass bead (Madsen et al., 1982)
Impedance n-propanol (King et al., 2007)
Optical Absorption Absorbing dye (Iizuka et al., 1999)
Scattering Albumen, serum (Wagnieres et al., 1999)
Relaxation T1 Gadopentetic acid (Mazzara et al., 1996)
T2 Agarose (Ohno et al., 2008)
Radiation Attenuation Resin (White et al., 1977)
Gellan gum is one such biopolymer. Biopolymers can be categorized into two
types, proteinaceous and polysaccharide gels (Clark and Ross-Murphy, 1987). Gelatin is
a proteinaceous gel material which is derived from natural collagen, such as porcine skin
(Veis, 1964). Gelatin phantoms provide good elastic property but tend to have low
melting temperatures, usually ranging from 27 to 30°C (Eldridge and Ferry, 1954).
There are a wide variety of polysaccharide gelling agents, including agar, starch, and
gellan gum (Clark and Ross-Murphy, 1987). Among these polysaccharide gels, agar is
the most common one in applications such as bacterial culture support, food gelling, and
many other uses in medicine and pharmacy. Agar provides stability over temperature up
to 90°C and is thermo-reversible. However, agar phantoms are rather brittle and do not
have tissue-like textures. Gellan gum is more elastic and can be tailored to different
elastic moduli. The melting point of gellan gum can be up to 120°C. Therefore, gellan

67
gum was selected as the gelling agent in this study because it provides a basic platform to
adjust to most of the soft tissue material properties and is compatible with most of the
modifiers (see Table 5.1). In this study, we focus on the formulation of gellan gum TM
phantom to achieve the targeted mechanical, electrical, and thermal properties. This
gellan gum-based TM phantom gives a similar tactile feeling as soft tissues and can
reproduce the thermal properties, making it ideal for a clinical simulator to train
clinicians for electrosurgical procedures.
Mechanical properties have been studied for different types of phantom, including
gelatin (Miller et al., 1951; Bot et al., 1996), agar (Clark et al., 1983; Ross and Scanlon,
1999), and gellan gum (Lelievre et al., 1992; Tang et al., 1994). The elastic modulus – a
measure of the structural stiffness of a phantom – generally increases with the
concentration of the gelling agent (Clark and Ross-Murphy, 1985). Adding ions or sugar
has been shown to increase elastic modulus and tensile/compression strengths (Tang et
al., 1996; Papageorgiou and Kasapis, 1995). Gelatin provides a variety of stiffnesses,
depending on the concentration, and good fracture strength. Agar gel is usually stiffer
but at the expense of being more brittle which does not reproduce soft tissue-like texture.
However, gellan gum can be tailored made from stiff and brittle to soft and elastic, with
an elastic modulus range from 0.3 to 200 kPa (Valli and Clark, 2010).
The electrical properties of TM phantom have been studied since the early 1980s
(Stuchly, 1980). Since most of the mass fraction of TM phantom is water, ions can
transport easily within the phantom and have comparable electrical conductivity to that of
soft tissue. Sodium chloride (NaCl) is the most common agent to manipulate the
electrical conductivity of biopolymer TM phantoms. Guy et al. (1971) first presented a
phantom model for electrical conductivity. Solazzo et al. (2005) provided tabulated
results of electrical conductivity versus the concentration of NaCl for agar phantom (in
the range of about 0.1 to 10 wt%). Formulas for the fabrication of TM phantoms with
accurate electrical conductivities exist for muscle (Chou et al., 1985), liver (Stauffer et
al., 2003), hand (Gabriel, 2007), kidney (Lopresto et al., 2011), and fat tissue (Yuan et al.,
2012). Lazebnik et al. developed an oil-in-gelatin phantom for a wideband use of
microwave applications (Lazebnik et al., 2005). Following the precedent of others, this

68
study selects NaCl as the modifier to control the electrical conductivity of the gellan gum
material.
There are relatively few studies to investigate the thermal properties – the thermal
conductivity and specific heat – of TM phantom. Leonard et al. perform the first study
investigating the thermal conductivity and specific heat of TM phantom (Leonard et al.,
1984). Craciunescu et al. used an empirical equation provided by Perry and Green (Perry
and Green, 1984) to formulate fat- and muscle-like tissue but showed a substantial
difference between the measured and estimated thermal conductivity (Craciunescu et al.,
1999). Zhang et al. measured the thermal conductivity of agar at different concentrations
and found that the thermal conductivity decreases as the concentration of agar increases
(Zhang et al., 2010). However, with the maximum concentration (10 wt%) of agar tested,
which is close to the maximum solubility of agar in water, the thermal conductivity of
agar phantom is still higher than most biological tissues (Duck, 1990), making it
impossible to match tissue thermal conductivity by purely increasing the concentration of
agar. The addition of propylene glycol (PPG) or oil has been shown to be able to reduce
the thermal conductivity (Yuan et al., 2012). PPG is selected as the modifier of thermal
conductivity in the gellan gum based TM material in this study.
There is a paucity of study on TM phantom that considers both electrical and
thermal properties. Yuan et al. modified the oil-in-gelatin phantom developed by
Lazebnik et al. (2005) for tumor, muscle, and fat tissue with controlled thermal and
electrical properties (Yuan et al., 2012). With different combinations of water and
vegetable oil, the thermal conductivity and specific heat is variable. The electrical
properties agree with the soft tissue well while the thermal conductivity still shows a
discrepancy up to 10%. The addition of oil to the phantom is based on the fact that tissue
partially consists of oil. This is especially true of fat tissue. Oil has a lower specific heat
(1.67 J/g·K) and thermal conductivity (0.17 W/m·K) than that of water (4.18 J/g·K and
0.60 W/m·K) so that adding oil can effectively decrease these two properties of a
phantom.
This study develops a model to formulate gellan-gum based TM phantom
materials to match the elastic modulus, electrical conductivity, and thermal conductivity
of biological tissue for simulation of electrosurgery and radiofrequency ablation

69
procedures. A design of experiment method is used to evaluate the effects of gellan gum,
PPG and NaCl concentration on three material properties (elastic modulus, electrical
conductivity, and thermal conductivity). Regression model for each material property
will then be developed. The procedure to formulate a desired TM phantom (in this case,
spinal cord) based on regression models and experimental verification will be illustrated.
5.2 Material and methods
5.2.1 Components of the TM phantom
Table 5.2 lists five components that were used to make the TM phantom. Gellan
gum is the gelling agent of the TM phantom. There are two forms of gellan gum, high-
acyl and low-acyl forms. The high-acyl gellan gum provides soft and elastic texture
while the low-acyl gellan gum gives firm and brittle texture (Valli and Clark, 2010). The
high-acyl gellan gum was used in this study, as most of biological organs are soft tissues.
Varying the concentration of high-acyl gellan gum can produce phantom tissues with
different hardnesses but which remain elastic.
Table 5.2 Components of the TM phantom materials and their purposes
Component Purpose
Gellan gum Gelling agent, control of elastic modulus
Propylene glycol (PPG) Control of thermal conductivity
NaCl Control of electrical conductivity
Distilled water Hydrate with gelling agent
Sodium propionate Preservative, preventing grow of bacteria
The thermal conductivity of the gellan gum TM phantom is controlled by adding
PPG. PPG has a lower thermal conductivity (0.17 W/m·K) than that of water (0.60
W/m·K). The thermal conductivity of most biological tissues ranges from 0.40 to 0.50
W/m·K (Duck, 1990). As water is the dominant mass fraction, adding PPG can
effectively lower the thermal conductivity of the gellan gum-based TM phantom.
The electrical conductivity of the aqueous-based phantom can be adjusted by adding
NaCl, as the disassociated ions can freely transport within water (Guy, 1971). Tabulated
electrical conductivity vs. concentration of NaCl has been provided by Field and Hand
(Field and Hand, 1990). However, the disassociation of NaCl will be affected with the

70
presence of PPG (Cheluget et al., 1994). The more PPG is added in the solution, the less
NaCl can be disassociated to conduct electrical current and the lower the electrical
conductivity of the phantom will be. The relationship between the concentration of PPG
and the electrical conductivity is expected to be nonlinear. This phenomenon has not
been studied in the literature and was a key area of exploration in this study.
The rest of the compositions of the phantom are distilled water and sodium
propionate. A very low concentration of sodium propionate (0.25 wt%) is added to
inhibit the bacteria growth and help to preserve the phantom for long-term use. Such low
concentrations were not expected to change the TM material properties.
5.2.2 Design of experiment
A single replicate 23 factorial design of experiment was first established
(Montgomery, 2008). The three factors are the concentrations of gellan gum (A), PPG,
(B), and NaCl (C). Each factor has two levels of concentration (high and low), as listed
in Table 5.3. As shown in Table 5.4, this 23 design has eight possible combinations,
marked as Phantoms #1 to #8. Phantom samples of all these eight combinations were
made and the results were used to test the significance of each factor on each material
property by ANOVA (p<0.05). An additional eight points at middle levels of three
factors were then employed to investigate the nonlinear effect on three material properties.
These samples are labeled as Phantoms #9 to #16. The aforementioned combinations can
be visualized in Figure 5.1. For each phantom, the elastic modulus, thermal conductivity,
and electrical conductivity were measured. To test the reproducibility of the phantom, a
duplicate combination was made (Phantoms # 12 and 16). The experimental order, listed
in Table 5.4, was randomly assigned to reduce any potential influence from the
environment.
Table 5.3 Concentrations of each factor at the three different levels
Level
Factor High (+) Middle (o) Low (−)
Gellan Gum 4% 2.5% 1%
PPG 40% 20% 0%
NaCl 0.2% 0.125% 0.05%

71
Table 5.4 Levels of TM phantom components and experimental order
Factor
Phantom # Gellan Gum PPG NaCl Experimental order
1 − − − 5
2 + − − 6
3 − + − 2
4 + + − 1
5 − − + 8
6 + − + 4
7 − + + 3
8 + + + 7
9 − + o 12
10 + − o 14
11 o − o 10
12 o o o 9
13 o + o 13
14 o o + 16
15 o o − 11
16 o o o 15
+: High level, −: low level, and o: central level
Figure 5.1 Visualization of the experimental design

72
5.2.3 Procedure of phantom manufacturing
Each phantom was made to have a total weight of 50 g. The weight of each
component for a specific phantom can be calculated based on Table 5.3 and Table 5.4.
Because the mass fraction is small, a premade 0.9% NaCl solution was used to add a
precise amount of NaCl. The preservative, sodium propionate (Pronto Food Co., Chicago,
IL, USA) had a fixed amount of 0.25 wt% for all phantom samples. The remaining mass
fraction was filled by distilled water (Aqua solutions, Deer Park, TX, USA). The high-
acyl gellan gum (Kelcogel® LT100, Modernist Pantry, York, ME, USA), sodium
propionate, PPG (PTI Process Chemicals, Ringwood, IL, USA), distilled water, and 0.9%
NaCl solution were added into a beaker sequentially. The solution was manually stirred
until the gellan gum powder was dissolved. The solution was covered with aluminum
foil and sat for 15 minutes before heating. A convective heating oven (Model 31197,
Hamilton Beach, Richmond, VA, USA), set at 110°C, was used to heat the phantom
solution for 40 minutes. During the heating process, the phantom solution was stirred
every 10 minutes. The gelled phantom was cooled down at room temperature for three
hours before any further testing.
5.2.4 Measurement of material properties and electrosurgery experiment
Elastic modulus
As shown in Figure 5.2(a), the elastic modulus was measured by indentation test
with a Type 000-S durometer (Instron, Norwood, MA, USA), which is designed to
measure the hardness of soft material using a sphere surface indenter. The sphere radius
of this indenter (Figure 5.2(d)) has a radius of 10.67 mm. The durometer was attached to
a linear stage (Model 200cri, Siskiyou instruments, Grants Pass, OR, USA) to control the
contact between the indenter and the phantom under testing. The durometer reading was
converted to elastic modulus (E) based on the equation (Briscoe et al., 1999):
2
3/ 2
(1 )
4
FE
R h
(5.1)
where υ is Poisson's ratio, F is the spring force of the durometer, R is the radius of the
sphere indenter, and h is the indentation depth. The Poisson's ratio was assumed to have
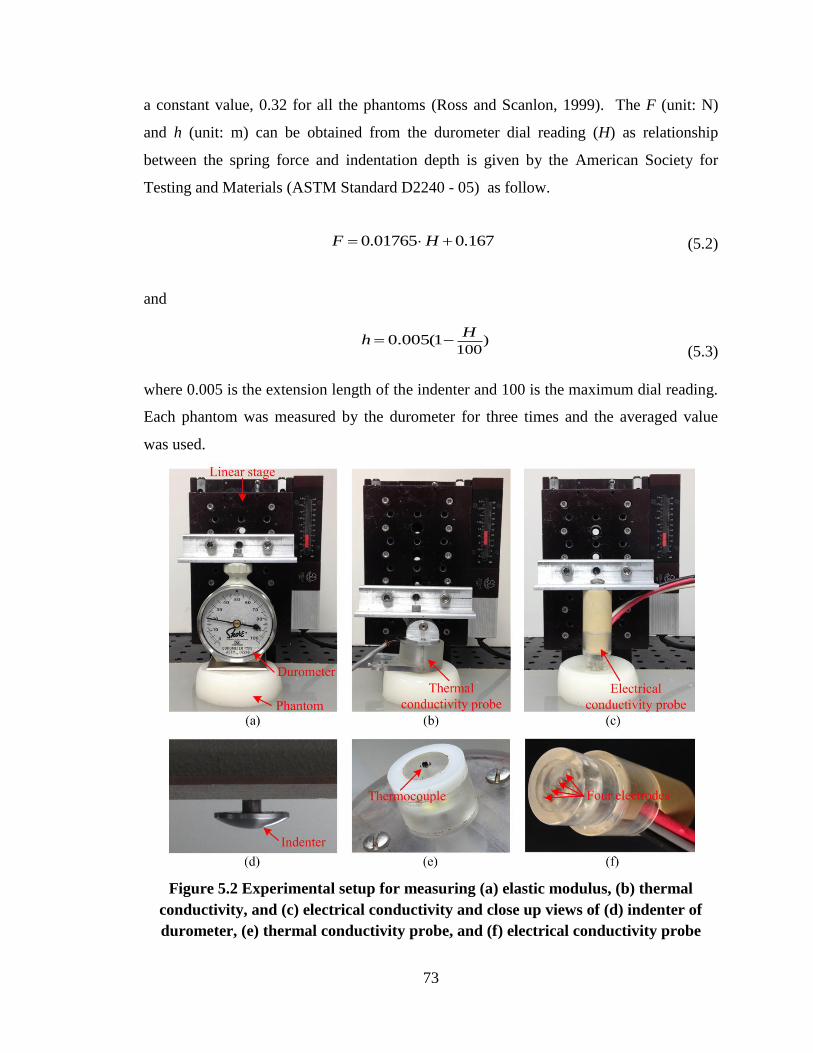
73
a constant value, 0.32 for all the phantoms (Ross and Scanlon, 1999). The F (unit: N)
and h (unit: m) can be obtained from the durometer dial reading (H) as relationship
between the spring force and indentation depth is given by the American Society for
Testing and Materials (ASTM Standard D2240 - 05) as follow.
0.01765 0.167F H (5.2)
and
)
1000.005(1
Hh
(5.3)
where 0.005 is the extension length of the indenter and 100 is the maximum dial reading.
Each phantom was measured by the durometer for three times and the averaged value
was used.
Figure 5.2 Experimental setup for measuring (a) elastic modulus, (b) thermal
conductivity, and (c) electrical conductivity and close up views of (d) indenter of
durometer, (e) thermal conductivity probe, and (f) electrical conductivity probe
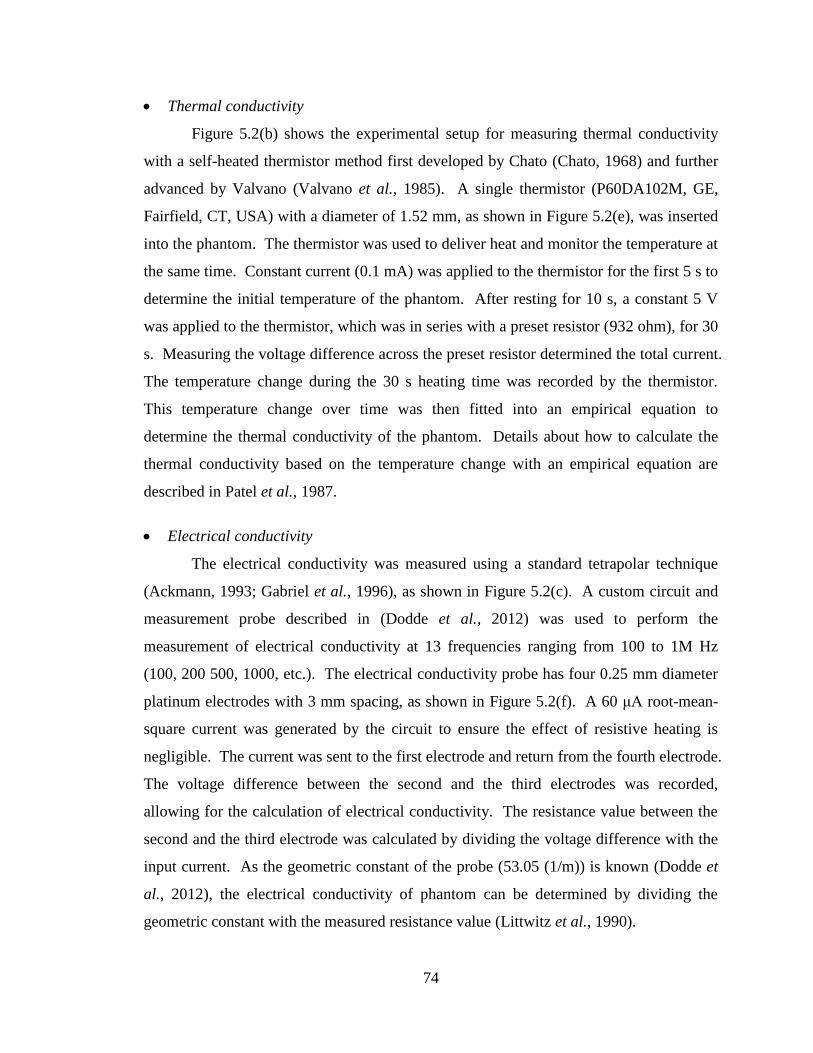
74
Thermal conductivity
Figure 5.2(b) shows the experimental setup for measuring thermal conductivity
with a self-heated thermistor method first developed by Chato (Chato, 1968) and further
advanced by Valvano (Valvano et al., 1985). A single thermistor (P60DA102M, GE,
Fairfield, CT, USA) with a diameter of 1.52 mm, as shown in Figure 5.2(e), was inserted
into the phantom. The thermistor was used to deliver heat and monitor the temperature at
the same time. Constant current (0.1 mA) was applied to the thermistor for the first 5 s to
determine the initial temperature of the phantom. After resting for 10 s, a constant 5 V
was applied to the thermistor, which was in series with a preset resistor (932 ohm), for 30
s. Measuring the voltage difference across the preset resistor determined the total current.
The temperature change during the 30 s heating time was recorded by the thermistor.
This temperature change over time was then fitted into an empirical equation to
determine the thermal conductivity of the phantom. Details about how to calculate the
thermal conductivity based on the temperature change with an empirical equation are
described in Patel et al., 1987.
Electrical conductivity
The electrical conductivity was measured using a standard tetrapolar technique
(Ackmann, 1993; Gabriel et al., 1996), as shown in Figure 5.2(c). A custom circuit and
measurement probe described in (Dodde et al., 2012) was used to perform the
measurement of electrical conductivity at 13 frequencies ranging from 100 to 1M Hz
(100, 200 500, 1000, etc.). The electrical conductivity probe has four 0.25 mm diameter
platinum electrodes with 3 mm spacing, as shown in Figure 5.2(f). A 60 μA root-mean-
square current was generated by the circuit to ensure the effect of resistive heating is
negligible. The current was sent to the first electrode and return from the fourth electrode.
The voltage difference between the second and the third electrodes was recorded,
allowing for the calculation of electrical conductivity. The resistance value between the
second and the third electrode was calculated by dividing the voltage difference with the
input current. As the geometric constant of the probe (53.05 (1/m)) is known (Dodde et
al., 2012), the electrical conductivity of phantom can be determined by dividing the
geometric constant with the measured resistance value (Littwitz et al., 1990).

75
Electrosurgery experiment
To validate the ability of the TM phantom with targeted material properties to
reproduce the temperature response to electrosurgical device, bipolar forceps (DePuy
Codman & Shurtleff, Warsaw, IN, USA) were used to perform coagulation on the TM
phantom, as shown in Figure 5.3(a). The temperature was measured at three points,
midpoint between the forceps tips, 1 and 2 mm away from the midpoint along the
centerline, as illustrated in Figure 5.3(b). The resulting temperature profiles were
compared to the experimental results done in a porcine spinal cord presented in another
study by the authors (Chen et al., Submitted). The TM phantom used in this experiment
has the targeted material properties close to those of soft tissue, which will be illustrated
in Section 3.3. The bipolar forceps were powered by an electrosurgical generator,
Valleylab Force FX (Covidien, Boulder, CO, USA) with 25 Malis units. The coagulation
time was fixed at 5 seconds. Five coagulations were performed on the same TM phantom
at different locations.
Figure 5.3 (a) Bipolar forceps with temperature measurement setup used to
coagulate TM phantom and (b) coagulating on TM phantom
5.3 Results
5.3.1 Measured TM phantom material properties
The hardness, thermal conductivity, and electrical conductivity for all 16
phantoms were measured and are summarized in Table 5.5. The hardness of the tested
phantoms ranges from 21 to 49, which corresponds to elastic moduli from 9.12 to 23.30
kPa. For thermal conductivity, the value varies from 0.400 to 0.574 W/m·K. The
electrical conductivity has a wide range, from 0.091 to 0.612 S/m. The electrical
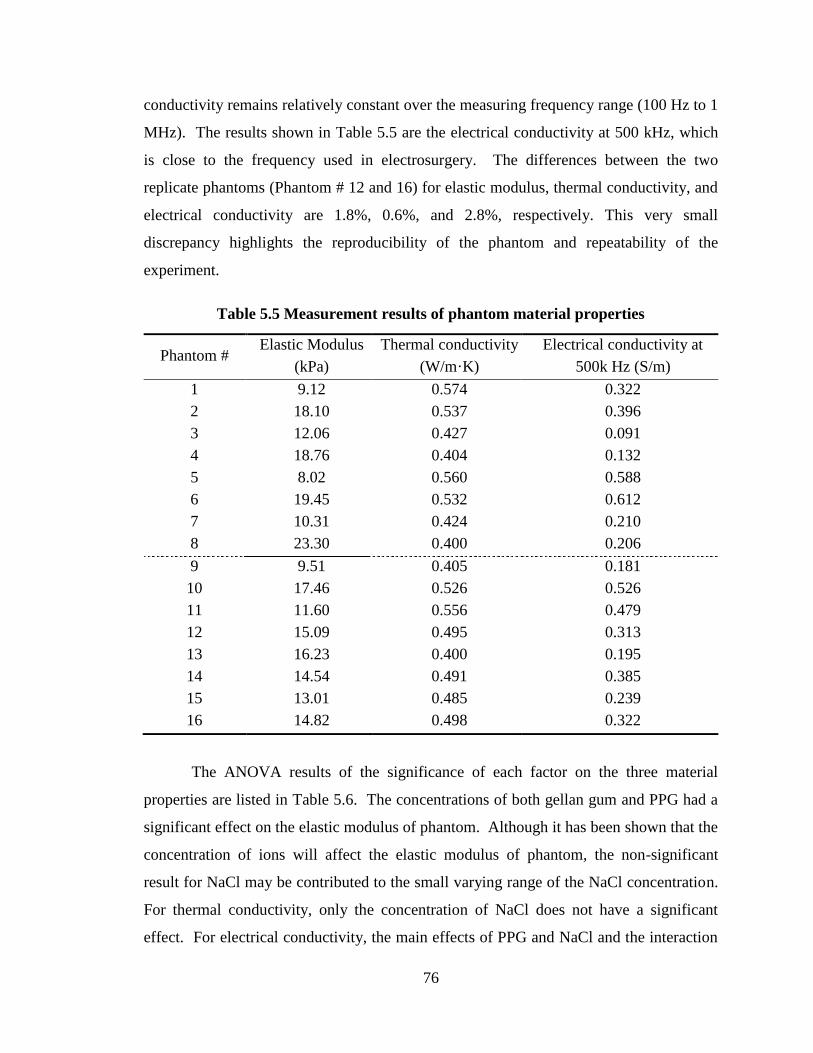
76
conductivity remains relatively constant over the measuring frequency range (100 Hz to 1
MHz). The results shown in Table 5.5 are the electrical conductivity at 500 kHz, which
is close to the frequency used in electrosurgery. The differences between the two
replicate phantoms (Phantom # 12 and 16) for elastic modulus, thermal conductivity, and
electrical conductivity are 1.8%, 0.6%, and 2.8%, respectively. This very small
discrepancy highlights the reproducibility of the phantom and repeatability of the
experiment.
Table 5.5 Measurement results of phantom material properties
Phantom # Elastic Modulus
(kPa)
Thermal conductivity
(W/m·K)
Electrical conductivity at
500k Hz (S/m)
1 9.12 0.574 0.322
2 18.10 0.537 0.396
3 12.06 0.427 0.091
4 18.76 0.404 0.132
5 8.02 0.560 0.588
6 19.45 0.532 0.612
7 10.31 0.424 0.210
8 23.30 0.400 0.206
9 9.51 0.405 0.181
10 17.46 0.526 0.526
11 11.60 0.556 0.479
12 15.09 0.495 0.313
13 16.23 0.400 0.195
14 14.54 0.491 0.385
15 13.01 0.485 0.239
16 14.82 0.498 0.322
The ANOVA results of the significance of each factor on the three material
properties are listed in Table 5.6. The concentrations of both gellan gum and PPG had a
significant effect on the elastic modulus of phantom. Although it has been shown that the
concentration of ions will affect the elastic modulus of phantom, the non-significant
result for NaCl may be contributed to the small varying range of the NaCl concentration.
For thermal conductivity, only the concentration of NaCl does not have a significant
effect. For electrical conductivity, the main effects of PPG and NaCl and the interaction

77
between PPG and NaCl are significant. The concentration of PPG has significant effect
on all three material properties. Extra care must be taken when formulating phantom
with PPG, regardless which material property is of interested.
Table 5.6 ANONA results of the effect of factors on the three material properties
p value
Factor Elastic Modulus Thermal conductivity Electrical conductivity
Gellan Gum 0.014* 0.0018* 0.73
PPG <0.001* <0.001* <0.001*
NaCl 0.15 0.22 <0.001*
Interaction - - 0.01*
*Statistically significant
5.3.2 Regression models
The factors that were shown to be significant were included in the regression
model. The regression model for each of the three material properties were developed
with the method of least squares which included all the 16 phantoms. The coefficient of
determination (R2) was calculated to evaluate the predicting ability of the regression for
each material property.
For elastic modulus, the relationship between elastic modulus and durometer dial
reading is derived by substituting F and h in Eq. (5.1) by Eqs. (5.2) and (5.3),
respectively and can be expressed as:
2
3/ 2
707.1 (1 ) (0.01765 0.167)
(100 )
HE
R H
(5.4)
From Eq. (5.4), the durometer reading, H, which corresponds to the desired elastic
modulus, can be found. The regression model for the targeting H is:
H = 16.46 + 651.458 mA + 13.29 mB (5.5)
where mA, mB, and mC are mass fraction of gellan gum, PPG, and 0.9% NaCl solution,
respectively.

78
The regression model for thermal conductivity (k) is:
k = 0.576 – 0.986 mA – 0.36 mB (5.6)
and the regression model for electrical conductivity () is:
= 0.260 – 0.399 mB + 1.355 mC – 2.166 mB mC, (5.7)
The R2 for elastic modulus, thermal conductivity, and electrical conductivity are
0.92, 0.97 and 0.95, respectively. These high R2 values indicate that the regression model
can explain more than 90% of the variance in each of the three material properties and
can accurately predict the material property with different phantom compositions.
5.3.3 Formulation of targeted tissue properties
Given desired tissue properties, a phantom formula can be calculated based on the
regression models. This research uses spinal cord as an example. Table 5.7 lists the key
material properties of the spinal cord tissue. To match the 11.68 kPa elastic modulus of
the spinal cord, from Eq. (5.4), the corresponding reading in 000-S hardness reading
should be 30.2. The mass fractions of gellan gum (ma) and PPG (mb) can be solved
simultaneously using Eqs. (5.5) and (5.6), given H and k equal to 24.4 and 0.503,
respectively. Once ma and mb are found, the only one unknown, the mass fraction of
0.9% NaCl solution (mc), can be solved by Eq. (5.7). The ma, mb, and mc for spinal cord
TM phantom are 1.8%, 15.4%, and 10.9%, respectively.
A gellan gum TM phantom based on this formula was made and the material
properties (elastic modulus, thermal conductivity, electrical conductivity, density, and
specific heat) were measured. The thermal diffusivity was calculated based on the
thermal conductivity, density, and specific heat. The error percentage for each material
property is summarized in Table 5.7. The errors of all these measured properties are all
<3%. The density and specific heat are not controlled in the formula but only have 0.4%
and 1.6% error, respectively. The components with major mass fractions (distilled water,
PPG, and 0.9% NaCl solution) all have density that is close to the spinal cord tissue, so it

79
is expected that the resulting density of the spinal cord phantom will also be close. For
specific heat, because the phantom and tissue both have a high mass fraction of water,
which has high specific heat (4.18 kJ/kg·K), the specific heat was expected to be in a
similar range.
Table 5.7 Comparison of material properties between the formulated spinal cord
phantom and real tissue
Comparison
Properties Real tissue Phantom Error
Elastic modulus (kPa) 11.68
a 12.02 2.9%
Thermal conductivity (W/m·K) 0.503
b 0.505 1.0%
Electrical conductivity c (S/m) 0.31
c 0.316 1.9%
Density (kg/m
3) 1035
d 1031 0.4%
Specific heat (kJ/kg·K) 3.72
d 3.66 1.6%
Thermal diffusivity (m2/s) 1.31 1.34 2.3%
a(Van Dommelen et al., 2010),
b(Bowman et al., 1975),
c(Gabriel et al., 1996), and
d(Duck, 1990)
5.3.4 Validation of temperature response by TM phantom with targeted tissue
properties
Experimental validation, as described in Section 5.2.4, was performed to examine
the spinal cord phantom's ability to reproduce the temperature response found in porcine
spinal cord tissue. The spinal cord TM phantom formulated in Section 5.3.3 was used for
this validation. Figure 5.4 shows the temperature results of coagulation on both porcine
spinal cord tissue as in the experiment conducted by the authors (Chen et al., Submitted)
and the spinal cord TM phantom. The error bars indicate the maximum and minimum
temperature results among the five coagulation tests on the spinal cord phantom. The
averaged temperature profiles of TM phantom at all the three measuring points match
well with those of porcine spinal cord tissue and demonstrated the capability of the gellan
gum-based TM phantom for electrosurgery simulator.

80
Figure 5.4 Temperature profiles of coagulation on porcine spinal cord (Tissue) and
TM phantom (Phantom)
5.4 Conclusions
This study presented a systematic, model-based approach to find the composition
of gellan gum-based TM phantom to achieve the desired elastic modulus, thermal
conductivity, and electrical conductivity of soft tissue. The use of high-acyl gellan gum
as a gelling agent successfully reproduced the tissue-like mechanical properties. The
prediction models were verified by making a spinal cord TM phantom based on the
gellan gum formula predicted by the model. This spinal cord TM phantom not only has
close material properties (elastic modulus, thermal conductivity, electrical conductivity,
density, specific heat, and thermal diffusivity) as the targeted tissue but also yielded a
similar temperature response as the real spinal cord tissue in a bipolar electrosurgery
experiment. These predictive models can be also used to formulate TM phantoms for
other soft tissues.
A few limitations exist in this study. First, the electrical conductivity was
measured only up to 1 MHz, which does not reach the level of radiofrequency. With the
extensive work that has been done on the wideband measurement of electrical
conductivity, it is expected that the electrical conductivity at radiofrequency range can be
correlated to that found at 1 MHz (Dadd et al., 1996). Second, the range of elastic

81
modulus covered by the experiment data is approximately 9-23 kPa, which may be
further expanded to include stiffer soft tissue, such as muscle. Third, the fracture
toughness of the TM phantom was not measured or quantified. However, it has been
shown that the fracture toughness of high-acyl gellan gum phantom can be over 70%
strain rate (Valli and Clark, 2010) which is much higher than that of agar phantom
(generally lower than 40%) (McEvoy et al., 1985). With addition of cations, the
toughness of gellan gum phantom can be increased to 110% strain rate (Tang et al., 1996).
This study demonstrated the feasibility of using gellan gum for a new class of TM
phantoms, providing a basic platform for further material property, such as acoustic
scattering and radiation attenuation. It is possible to formulate a TM phantom with gellan
gum for ultrasonic devices, fluoroscopy, or hyperthermia therapies. Gellan gum has the
potential to replace agar and gelatin in making TM phantom for various clinical simulator
applications.

82
References
Ackmann J J 1993 Complex bioelectric impedance measurement system for the
frequency range from 5 Hz to 1 MHz Annals of biomedical engineering 21 135-
46
ASTM Standard D2240-05 2010 Standard Test Method for Rubber Property—Durometer
Hardness (West Conshohocken: ASTM International ) DOI: 10.1520/D2240-
05R10
Bajaj I B, Survase S A, Saudagar P S and Singhal R S 2007 Gellan gum: fermentative
production, downstream processing and applications Food Technology and
Biotechnology 45 341-54
Bot A, van Amerongen I A, Groot R D, Hoekstra N L and Agterof W G M 1996 Large
deformation rheology of gelatin gels Polymer Gels and Networks 4 189-227
Bowman H F, Cravalho E G and Woods M 1975 Theory, measurement, and application
of thermal properties of biomaterials Annual Review of Biophysics and
Bioengineering 4 43-80
Briscoe B, Sebastian K and Adams M 1999 The effect of indenter geometry on the elastic
response to indentation Journal of Physics D: Applied Physics 27 1156
Chato J 1968 A method for the measurement of the thermal properties of biological
materials (New York: American Society of Mechanical Engineers)
Cheluget E L, Gelinas S, Vera J H and Weber M E 1994 Liquid-liquid equilibrium of
aqueous mixtures of poly (propylene glycol) with sodium chloride Journal of
Chemical and Engineering Data 39 127-30
Chen R, Than K, Park P and Shih A Submitted Comparison of thermal coagulation
profiles for bipolar forceps with different cooling mechanisms in a porcine model
of spinal surgery Neurosurgery
Chou C K, Chen G W, Guy A W and Luk K H 1985 Formulas for preparing phantom
muscle tissue at various radiofrequencies Bioelectromagnetics 5 435-41
Clark A, Richardson R, Ross-Murphy S and Stubbs J 1983 Structural and mechanical
properties of agar/gelatin co-gels. small-deformation studies Macromolecules 16
1367-74

83
Clark A and Ross-Murphy S B 1987 Biopolymers, ed K Dusek (London: Springer) pp 57-
192
Clark A H and Ross-Murphy S B 1985 The concentration dependence of biopolymer gel
modulus British Polymer Journal 17 164-8
Craciunescu O I, Howle L E and Clegg S T 1999 Experimental evaluation of the thermal
properties of two tissue equivalent phantom materials International Journal of
Hyperthermia 15 509-18
Dadd J, Ryan T and Platt R 1996 Tissue impedance as a function of temperature and time
Biomedical Sciences Instrumentation 32 205-14
Dodde R, Bull J and Shih A 2012 Bioimpedance of soft tissue under compression
Physiological measurement 33 1095-109
Duck F A 1990 Physical properties of tissue: a comprehensive reference book (London:
Academic)
Eldridge J E and Ferry J D 1954 Studies of the cross-linking process in gelatin gels. III.
Dependence of melting point on concentration and molecular weight The Journal
of Physical Chemistry 58 992-5
Evageliou V, Karantoni M, Mandala I and Komaitis M 2010a Compression of gellan gels.
part I: effect of salts International Journal of Food Science & Technology 45
1076-80
Evageliou V, Mazioti M, Mandala I and Komaitis M 2010b Compression of gellan gels.
Part II: effect of sugars Food Hydrocolloids 24 392-7
Field S B and Hand J W 1990 An introduction to the practical aspects of clinical
hyperthermia (London ; New York: Taylor & Francis)
Gabriel C 2007 Tissue equivalent material for hand phantoms Physics in Medicine and
Biology 52 4205-10
Gabriel C, Gabriel S and Corthout E 1996 The dielectric properties of biological tissues: I.
Literature survey Physics in Medicine and Biology 41 2231-49
Giavasis I, Harvey L M and McNeil B 2000 Gellan gum Critical Reviews in
Biotechnology 20 177-211
Guimard N K, Gomez N and Schmidt C E 2007 Conducting polymers in biomedical
engineering Progress in Polymer Science 32 876-921

84
Guy A W 1971 Analyses of electromagnetic fields induced in biological tissues by
thermographic studies on equivalent phantom models IEEE Transactions on
Microwave Theory and Techniques MTT-19 205-14
Huang J C 2002 Carbon black filled conducting polymers and polymer blends Advances
in Polymer Technology 21 299-313
Iizuka M N, Sherar M D and Vitkin I A 1999 Optical phantom materials for near infrared
laser photocoagulation studies Lasers in Surgery and Medicine 25 159-69
King R L, Herman B A, Maruvada S, Wear K A and Harris G R 2007 Development of a
HIFU phantom. In: 6th International Symposium on Therapeutic Ultrasound, pp
351-6
Lazebnik M, Madsen E L, Frank G R and Hagness S C 2005 Tissue-mimicking phantom
materials for narrowband and ultrawideband microwave applications Physics in
Medicine and Biology 50 4245-58
Lelievre J, Mirza I and Tung M 1992 Failure testing of gellan gels Journal of food
engineering 16 25-37
Leonard J B, Foster K R and Athley T 1984 Thermal properties of tissue equivalent
phantom materials IEEE Transactions on Biomedical Engineering 533-6
Littwitz C, Ragheb T and Geddes L 1990 Cell constant of the tetrapolar conductivity cell
Medical and Biological Engineering and Computing 28 587-90
Lopresto V, Pinto R, Lodato R, Lovisolo G and Cavagnaro M 2011 Design and
realisation of tissue-equivalent dielectric simulators for dosimetric studies on
microwave antennas for interstitial ablation Physica Medica 28 245-53
Lorenzo L, Zaritzky N and Califano A 2013 Rheological analysis of emulsion-filled gels
based on high acyl gellan gum Food Hydrocolloids 30 672-80
Madsen E L, Zagzebski J A and Frank G R 1982 Oil-in-gelatin dispersions for use as
ultrasonically tissue-mimicking materials Ultrasound in medicine & biology 8
277-87
Mazzara G, Briggs R W, Wu Z and Steinbach B G 1996 Use of a modified
polysaccharide gel in developing a realistic breast phantom for MRI Magnetic
Resonance Imaging 14 639-48
85
McDonald M, Lochhead S, Chopra R and Bronskill M J 2004 Multi-modality tissue-
mimicking phantom for thermal therapy Physics in Medicine and Biology 49 2767
McEvoy H, Ross-Murphy S and Clark A 1985 Large deformation and ultimate properties
of biopolymer gels: 1. Single biopolymer component systems Polymer 26 1483-
92
Miller M, Ferry J D, Schremp F W and Eldridge J E 1951 Studies of the cross-linking
process in gelatin gels. II. static rigidity and stress relaxation The Journal of
Physical Chemistry 55 1387-400
Montgomery D C 2008 Design and analysis of experiments (New York: John Wiley &
Sons)
Morris E R, Nishinari K and Rinaudo M 2012 Gelation of gellan-a review Food
Hydrocolloids 28 373-411
Ohno S, Kato H, Harimoto T, Ikemoto Y, Yoshitomi K, Kadohisa S, Kuroda M and
Kanazawa S 2008 Production of a human-tissue-equivalent MRI phantom:
optimization of material heating Magnetic Resonance in Medical Sciences 7 131-
40
Papageorgiou M and Kasapis S 1995 The effect of added sucrose and corn syrup on the
physical properties of gellan-gelatin mixed gels Food Hydrocolloids 9 211-20
Patel P, Valvano J, Pearce J, Prahl S and Denham C 1987 A self-heated thermistor
technique to measure effective thermal properties from the tissue surface Journal
of Biomechanical Engineering 109 330-5
Perry R H and Green D W 1984 Perry's chemical engineers' handbook (New York:
McGraw-Hill )
Ross K and Scanlon M 1999 Analysis of the elastic modulus of agar gel by indentation
Journal of Texture Studies 30 17-27
Stauffer P, Rossetto F, Prakash M, Neuman D and Lee T 2003 Phantom and animal
tissues for modelling the electrical properties of human liver International
Journal of Hyperthermia 19 89-101
Stuchly M 1980 Dielectric properties of biological substances- tabulated Journal of
Microwave Power 15 19-26

86
Sworn G 2009 Handbook of hydrocolloids, ed G O Phillips and P A Williams
(Cambridge, UK: Woodhead Publishing)
Tang J, Lelievre J, Tung M A and Zeng Y 1994 Polymer and ion concentration effects on
gellan gel strength and strain Journal of Food Science 59 216-20
Tang J, Tung M A and Zeng Y 1996 Compression strength and deformation of gellan
gels formed with mono-and divalent cations Carbohydrate polymers 29 11-6
Valli R and Clark R 2010 Food Stabilisers, Thickeners and Gelling Agents, ed A Imeson
(New York: John Wiley & Sons)
Valvano J, Cochran J and Diller K 1985 Thermal conductivity and diffusivity of
biomaterials measured with self-heated thermistors International Journal of
Thermophysics 6 301-11
Van Dommelen J, Van der Sande T, Hrapko M and Peters G 2010 Mechanical properties
of brain tissue by indentation: Interregional variation Journal of the Mechanical
Behavior of Biomedical Materials 3 158-66
Veis A 1964 The macromolecular chemistry of gelatin (New York: Academic Press)
Wagnieres G, Cheng S, Zellweger M, Utke N, Braichotte D, Ballini J P and van den
Bergh H 1999 An optical phantom with tissue-like properties in the visible for use
in PDT and fluorescence spectroscopy Physics in Medicine and Biology 42 1415-
26
White D, Martin R and Darlison R 1977 Epoxy resin based tissue substitutes British
Journal of Radiology 50 814-21
Yuan Y, Wyatt C, Maccarini P, Stauffer P, Craciunescu O, MacFall J, Dewhirst M and
Das S K 2012 A heterogeneous human tissue mimicking phantom for RF heating
and MRI thermal monitoring verification Physics in Medicine and Biology 57
2021-37
Zhang M, Che Z, Chen J, Zhao H, Yang L, Zhong Z and Lu J 2010 Experimental
determination of thermal conductivity of water-agar gel at different
concentrations and temperatures Journal of Chemical & Engineering Data 56
859-64
87
CHAPTER 6
CONCLUSIONS AND FUTURE WORK
6.1 Conclusions
This dissertation studied the thermal spread during electrosurgical coagulation and
developed a tissue-mimicking phantom for electrosurgery. Both experimental and
modeling work was conducted to quantify the thermal spread. The results from this study
enhance the understanding of both temperature distribution and thermal damage caused
by coagulation. The developed tissue-mimicking phantom can be used to study the
performance of electrosurgical devices and also as a training tool for surgeons.
The major achievements of this dissertation are:
A multi-physics two-phase model for bipolar coagulation on spinal cord with
cerebrospinal fluid:
A comprehensive numerical analysis model with multi-physics, thermal and
electrical fields, and two phases, liquid and solid, was developed to predict tissue
temperature during bipolar coagulation. When coagulation was performed with the
existence of cerebrospinal fluid, this fluid layer not only changed the electrical
current dissipation but also affected the temperature distribution. These two fields
and two phases were coupled in the COMSOL finite element model to allow for the
accurate prediction of temperature. Modeling techniques were also developed to
account for the water evaporation, change of material properties due to water loss,
and tissue fusion. With this model, spatial and temporal temperature distributions
can be obtained. Thermal dose of the spinal cord tissue at any given point can also
be calculated to understand the level of thermal damage caused by coagulation.

88
A methodology to formulate gellan-gum based tissue-mimicking phantom with
targeted material properties based on the design of experiment method:
A systematic approach was developed to formulate gellan-gum based tissue-
mimicking phantom material with targeted mechanical, thermal, and electrical
properties. Using the design of experiment method, the significant factors on each
targeting material properties were identified. A regression model was then
developed and used to calculate the formula for phantom of any desired soft tissue.
This approach has been validated by making a spinal cord tissue-mimicking
phantom. This phantom has close material properties to spinal cord tissue and can
reproduce the temperature response to bipolar coagulation as the spinal cord tissue.
The original contributions of this dissertation are as follows:
(1) An experimental setup to measure the temperature profiles during bipolar
coagulation.
(2) A comparison of temperature profiles induced by four different bipolar forceps,
including regular stainless steel, titanium, active heat transfer, and SILVERGlide
forceps. The heating effect and cooling effect of all these four forceps were
analyzed. Different cooling techniques have different working range and reaction
time.
(3) A finite element model accounting for evaporation, effect of water loss, and tissue
fusion by manipulating material properties to predict tissue temperature during
electrosurgical vessel sealing.
(4) A two-phase (solid and liquid) thermo-electrical model for bipolar coagulation
with the existence of cerebrospinal fluid.
(5) Use of gellan-gum modified by glycol and NaCl as tissue-mimicking phantom
material
(6) A regression model to formulate tissue-mimicking phantom with specific elastic
modulus, thermal conductivity, and electrical conductivity.

89
6.2 Future Work
The experimental and modeling results of electrosurgical coagulation and the tissue-
mimicking phantom can be further improved and expanded through the following
directions:
(1) Investigation of thermal spread when performing electrosurgical coagulation in a
moving situation. During the neurosurgery, the coagulation is often performed
with the forceps tips dragging along a vessel. In this situation, the thermal spread
may be different from that of the fixed situation.
(2) Development of an external cooling mechanism that can be incorporated with the
current bipolar forceps to minimize the thermal spread. The existing bipolar
forceps with cooling technique can only be used to control little amount of
bleeding. In the case of heavy bleeding, extensive coagulation is needed and
forceps without any cooling technique are used. This is when the cooling
mechanism is mostly desired.
(3) Quantification of the cooling effects of the active heat transfer and SILVERGlide
forceps. The model developed in this dissertation can be furthered applied to
quantify the cooling effect of the two forceps with cooling techniques.
(4) Expansion of the finite element model to account for the generation of steam and
the effect of steam diffusion on tissue temperature and incorporate compression
dependent material properties.
(5) Design and manufacturing of a clinical simulator using the tissue-mimicking
phantom with embedded thermistors to provide temperature feedback.
(6) Development of the tissue-mimicking phantom material that allows for the control
of coagulation temperature and specific heat.