investigation of roundness tester’s · pdf file2-6 the relationship between measurement...
TRANSCRIPT

INVESTIGATION OF ROUNDNESS TESTER’S ACCURACY
AND COMPENSATION ALGORITHM
MISS NITIMA NULONG
A THESIS SUBMITTED IN PARTIAL FULFILLMENT OF THE REQUIREMENTS
FOR THE DEGREE OF MASTER OF SCIENCE
IN PRODUCTION ENGINEERING
SIRINDHORN INTERNATIONAL THAI-GERMAN GRADUATE SCHOOL OF ENGINEERING
(TGGS)
GRADUATE COLLEGE
KING MONGKUT'S INSTITUTE OF TECHNOLOGY NORTH BANGKOK
ACADEMIC YEAR 2007
COPYRIGHT OF KING MONGKUT'S INSTITUTE OF TECHNOLOGY NORTH BANGKOK


ACKNOWLEDGEMENTS
This thesis was supported by Mahr GmbH and Sirindhorn International Thai-
German Graduate School of Engineering, King Mongkut’s institute of Technology
North Bangkok. I would like to thank Dr.Robert Buchmann, Associate Professor
Banleng Sornil and Professor Dr.-Ing. Rolf H. Jansen for their responsibility in the
co-operation program. I would like to thank Mr.Ralf Terbruggen, my internship
Industry Mentor, for giving me the opportunity to pursue my thesis at Mahr Company
and for supporting my work. I would like to thank Associate Professor Dr.Jaramporn
Hassamontr for his have supported and advised since the beginning of my thesis. I am
grateful to Mr.Markus Diedrich and Mr.Burkhard Soehne, my thesis Industry Mentor,
for their supporting and for invaluable suggestions and discussions. I would like to
thank Dr.Wilde Michael and Mr.Dirk Meier for many valuable suggestion and
discussion. I would like to thank Mr.Mike Schmidt, Mr.Markus Sladkowski, and my
colleagues at MMQ400 development section for their supporting during my practice
and task. I am very thankful to Mr.Hoffmann Malte and Mr.Sellmann Manuel for
their encouragement and valuable advice. A special thank you goes to Mrs.Sabine
Schluer and Mrs.Arch Kristiane for many valuable suggestions supported and
facilitated all detail with social and culture. I would like to thank my master
classmates, Mr.Prasert Prachprayoon and Mr.Nopparat Seemuang, for their
encouragement and kindness in representative myself during I stayed in Germany. I
am very thankful to Dr.Poramate Manoonpong and Mr.Sunpeth Cumnuantip for being
such faithful proofreaders. I would like to thank my friends at Goettingen for their
friendship. Moreover, I would like to thank my parents and my family for being my
power and for taking care of me all times. Finally, I am very much grateful to all the
people who have contributed the many useful materials to complete my thesis and
who also offered many useful ideas and suggestion.
Nitima Nulong
v

TABLE OF CONTENTS
Page
Abstract (in English) ii
Abstract (in Thai) iv
Acknowledgements v
List of Tables viii
List of Figures ix
List of Abbreviations and Symbols xiii
Chapter 1 Introduction 1
Chapter 2 Literature review 5
2.1 Uncertainty of measurement 5
2.2 Dimensioning and Tolerancing 11
2.3 Form Measuring Machine 14
2.4 Capability study 21
2.5 International standards related to form measurement
and uncertainty measurement 25
Chapter 3 Measurement Process 27
3.1 Measurement machine (MMQ400) and software 27
3.2 Reference measurement machine (MFU100) 29
3.3 Temperature measurement device 30
3.4 Workpiece and clampling device 32
3.5 Measurement program 33
Chapter 4 Measurement results and discussions 39
4.1 The effect of air-conditioning room 41
4.2 The effect of machine compensation in temperature-controlled room 45
4.3 The effect of machine compensation in normal room temperature 50
4.4 The effect of machine handling (center re-positioning) in
temperature-controlled room 52
4.5 The effect of machine handling (center re-positioning) in
normal room temperature 57
4.6 The effect of probe zeroize strategies 60
4.7 Summary 63
vi

TABLE OF CONTENTS (CONTINUED)
Page
Chapter 5 Measurement system analysis 65
5.1 The percentage of the average increment 65
5.2 The uncertainty of measurement 68
5.3 Capability index 77
Chapter 6 Conclusions 85
References 89
Appendix A 91
Definition of Terms 92
Appendix B 107
Screening Experimental 108
Biography 127
vii

LIST OF TABLES
Table Page
2-1 Form and Location Tolerance 12
2-2 The causes for form deviations according to the VDI 2601 13
2-3 Comparison of the feature-based metrology and the profile metrology 16
2-4 Relationship between the machine uncertainty component and
specific measured features 18
3-1 The technical data of probe type according to the Testo information 30
3-2 Comparison of sensors 31
3-3 The conditions of the measurement program 33
4-1 The temperature information when are measured at the different
controlled air conditioning room 40
5-1 The average of mean value 66
5-2 The percentage of the average increment 66
5-3 The relative between the machine component errors and the measured
features 73
5-4 The summary table of the significant approval of bias, the capability
index calculations and the permissible range of the measured value 80
A-1 Symbol and definition of feature tolerance 103
A-2 The evaluation methods 104
viii

LIST OF FIGURES
Figure Page
2-1 The procedure of the measuring 6
2-2 Cause and effect diagram of production metrology 7
2-3 Types of measurement errors 8
2-4 Accuracy definition 9
2-5 The different between accuracy and precision 10
2-6 The relationship between measurement uncertainty and workpiece
tolerance 11
2-7 Polar and Linear filter 15
2-8 Geometrical characteristics of surface measurement 16
2-9 The characteristic of measuring machine 20
2-10 The concept of capability index 23
2-11 The comparison between the combined standard uncertainty (Upm)
and the capability indices type-1 study (Cg, Cgk) 24
3-1 MMQ400 the precision measuring machine 27
3-2 The structure level of MarWin software module 29
3-3 The cylindrical standard workpiece information 32
3-4 The specification information of the cylindrical standard workpiece 35
4-1 Roundness and cylindricity deviations when the machine’s
compensation is activated off 42
4-2 Roundness deviation including flick and runout deviations with the
z axis as datum when the machine’s compensation is activated off 43
4-3 Straightness deviations when the machine’s compensation is off 44
4-4 Parallelism and conicity deviations when the machine’s compensation
is activated off 44
4-5 Compensation’s algorithm 45
4-6 Machine structures of form measuring machine 46
4-7 The measurement results determined from polar profiles between the
machine’s compensation is activated off (Left) and on (Right) when
measured in the room with air condition 47
ix

LIST OF FIGURES (CONTINUED)
Figure Page
4-8 The measurement results determined from linear profiles between
the machine’s compensation is activated off (Left) and on (Right)
when measured in the room with air condition 49
4-9 The measurement results determined from polar profiles between
the machine’s compensation is activated off (Left) and on (Right)
when measured in the room without air condition 50
4-10 The measurement results determined from linear profiles between
the machine’s compensation is activated off (Left) and on (Right)
when measured in the room without air condition 51
4-11 Alignment concept 52
4-12 The measurement results determined from polar profiles between
with (Left) and without (Right) workpiece’s handling when measured
in the room with air condition 54
4-13 Radial runout deviation with z axis as datum (Left) and Permissible
eccentricity value (Right) when measured in the room with
air conditioning under condition on-compensation and with handling 55
4-14 The measurement results determined from linear profiles between
with (Left) and without (Right) workpiece’s handling when measured
in the room with air condition 56
4-15 Measurement strategies of Straightness and Parallelism 57
4-16 The measurement results determined from polar profiles between
with (Left) and without (Right) workpiece’s handling when measured
in the room without air condition 58
4-17 The measurement results determined from linear profiles between
with (Left) and without (Right) workpiece’s handling when measured
in the room without air condition 59
4-18 The measurement results determined from polar profiles between
the probe zeroize every measured profiles (Left) and the probe zeroize
only one time at pre-position height (Right) 61
x

LIST OF FIGURES (CONTINUED)
Figure Page
4-19 The measurement results determined from linear profiles between
the probe zeroize every measured profiles (Left) and the probe
zeroize only one time at pre-position height (Right) 62
B-1 Input, Output and Measurement conditions of screening experimental 109
B-2 The center point of three circle substitute elements in x and y axis
of the machine coordinate system 110
B-3 The center point of three circle substitute elements in z axis of the
machine coordinate system 110
B-4 The roundness deviation (Left) The roundness deviation of each circle
substitute element when the evaluation criterion is MZC. (Right)
The roundness deviation of the second circle substitute element (C2)
when the evaluation criteria are MZC and LSC 111
B-5 The radial runout deviation. (Left) the four radial runout deviation
with the difference reference datum when the evaluation criteria is
MZC.(Right) the comparison between the roundness and the radial
runout deviation of the same profile (C2) when the evaluation criteria
are MZC 112
B-6 The cylindricity deviation when evaluation criteria are MZC.
(Left) The probe zeroizes every circle. (Right) The probe zeroize
only one time at pre-position height 114
B-7 The roundness deviation when evaluation criteria are MZC.
(Left) The probe zeroizes every circle. (Right) The probe zeroize
only one time at pre-position height 115
B-8 The radial runout deviation when evaluation criteria are MZC.
(Left) The probe zeroizes every circle. (Right) The probe zeroize
only one time at pre-position height 116
B-9 The center point of three circle substitute elements in x and y axis
of machine coordinate system. (Left) The probe zeroizes every circle.
(Right) The probe zeroize only one time at pre-position height 116
xi

LIST OF FIGURES (CONTINUED)
Figure Page
B-10 The center point of three circle substitute elements in z axis
of machine coordinate system. (Left) The probe zeroizes every circle.
(Right) The probe zeroize only one time at pre-position height 118
B-11 The screening experimental measurement result; Element information
results in x, y and z-coordinate of the position vector 119
B-12 The screening experimental measurement results; form and
location tolerance 120
B-13 The protocol of the screening experimental with the zeroing probes
every circle 121
B-14 The protocol of the screening experimental with the zeroing probe
only one time at pre-position height 122
B-15 The example of the cylindricity profile in the protocol 123
xii

LIST OF ABBREVIATIONS AND SYMBOLS
ISO International Organisation of Standardisation
GUM Guide to the Expression of Uncertainty in Measurement
VIM International Vocabulary of Basic and General Terms in Metrology
Cg capability index
Cgk capability index
upr undulations per revolution
MZC Minimum Zone Circles
LSS Least Square Straight line
pt100 Resistance sensor
NTC Thermistors
xiii

CHAPTER 1
INTRODUCTION
In recent years, the trend of technology and products is moving towards smaller
sizes and higher quality. The dimensional unit of production part changes from
“decimal of millimeter” to “decimal of micrometer or nanometer.” According to the
unique understanding for workpiece acceptance criteria in controlling and monitoring
process, workpiece shape and its characteristic are defined by dimensioning and
tolerancing. The inspection gages and measuring machines are very important to
control quality and process. The measuring machine accuracy must be significantly
higher than that of the production machine and must be also higher than the
workpiece specification tolerance. Therefore, the high accuracy of the measuring
machine is important not only in producing and controlling but also in limiting
unnecessary measuring equipment investments.
The accuracy of the measuring machine expressed as measured value with
respect to the estimated true value, can be characterized by the uncertainty of
measurement. The uncertainty of measurement and the measurement errors are
related. When the errors are clearly identified, the uncertainty of measurement can be
estimated. By correcting or controlling errors, the measurement uncertainty is
improved. And vice verse, the accuracy of measuring process is improved by reducing
and controlling the uncertainty of measurement.
The error compensation is applied to the measuring machine in order to get
more accurate measurement results. Thereby complete and sufficient compensation on
the formtester is important. The measuring machine can correct some sources of
errors at machine design and production stage. As a result of correcting known
systematic errors, the measurement result is excluded from residual errors. These
errors could be the deformation of machine structures due to temperature and their
weight, the parallelism between the line of scale (machine) and the line of
measurement (workpiece), etc. However, some sources of errors can not be fixed such
as the error caused by random distribution error, scale error (resolution), deformation
of workpiece and probe deformation due to contact. Therefore, every measurement

2
result has uncertainty due to these errors. The complete measurement result is
presented by the estimated true value and its measurement uncertainty.
The combined uncertainty is calculated according to the ISO Guide to the
Expression of Uncertainty in Measurement (GUM) [1]. This study uses a form
measuring machine, MMQ400, to measure a cylindrical standard workpiece.
MMQ400 is a precision measuring equipment, a new machine within the series of
MarForm Desktop Formtester of the Mahr Company. This cylinder workpiece has the
same characteristics as a universal cylinder used for calibrating the signal
transmission and testing the straightness and parallelism of the axes. A temperature
device, TESTCO950 with a resistance temperature sensor probe pt100, is used to
collect temperature data during the measurement. The measurement procedure is
created following the Bosch book10 standard on Capability of Measurement and Test
Processes [2].
For the purpose of this study, the measurement process has three main setting
conditions: the error compensation algorithm, the workpiece handling and the
temperature. First, the error compensation is referred to the correction of the errors in
the z and c axes. The compensation algorithm in the machine can be either activated
or de-activated. Secondly, the handling condition is defined as resetting the workpiece
position by rotary table. During the measurement, the workpiece should be removed
and put back in between subsequent measurements. In the handling condition, the
measurement program automatically resetting workpiece position by moving the
rotary table away from the measurement position. This motion gives the effect as
automatically taking the workpiece off and applying new clamping before starting
each measurement in order to test the alignment of centering and tilting table. This
condition seems to be the normal situation of measurement without operator’s effects.
In without handling condition, the measurement is repeated fifty times after the first
alignment under the permissible eccentricity value 2.0 µm. The without handling
condition is created in order to observe drifts in machine’s column during the
measurement. This condition can be used as a reference condition for comparing its
measurement result with other conditions. The third setting condition is temperature.
The measurement is made in two rooms which are different in the presence of air
conditioning in order to observe the effect of temperature. Temperature is one
influencing factor on form measurement result. The temperature has an effect on the

3
material expansion. Therefore the effects of temperature on form measuring machine
are interesting. The room is controlled to 20±1°C by air conditioning unit.
The workpiece of this study is made of steel with a height of 100 mm and a
diameter of 20 mm. This cylinder workpiece have two flat areas at a specific height of
the workpiece. This flat area is called flick area. The testing of the capability of the
cylinder standard workpiece is performed by the software measurement program of
the regularly calibrated form measuring machine. The cylindrical standard workpiece
is used for calibrating the sensitivity of the signal transmission chain by two flicks
sections of the standard and for testing the straightness and parallelism of the linear
measuring axes of the machine. The measured profiles are evaluated by seven form
and location tolerances: the roundness, the roundness including flick, the straightness,
the parallelism, the conicity, the radial runout and the cylindricity deviations.
Additionally, the radial runout with the machine datum deviation is added in the
measurement program in order to observe the changes of the measuring machine axis.
Furthermore the cylindricity deviation that is evaluated from the circular profiles at
three different heights is added into the measurement program as it can be directly
calculated from roundness measurement. This study is performed under the
assumption that dimensional error is randomly distributed.
In order to represent performance of the measuring machine, capability index is
calculated according to the Bosch book10 standard on Capability of Measurement and
Test Processes [2]. The capability indices are calculated from the percentages of
process variance and measurement system variation. Finally, the measurement results
and their uncertainty are explained together with their capability index. The capability
indices and measurement results can be used to estimate the combined uncertainty.
On the other hand, the standard deviation of repeated measurement results relative to
the capability index and the uncertainty of measurement are used to calculate the
minimum tolerance. The minimum tolerance of each measuring feature is used as the
permissible tolerance value of this measuring machine.
Chapter 2 describes related theory and literature review. The measurement
process consists of measuring machine, reference measuring machine, temperature
measuring device, workpiece and measurement program described in chapter 3.
Chapter 4 shows measurement results measured under three conditions in two
difference rooms of air conditioning unit. The measurement results are discussed in

4
term of their accuracy and causes of errors. The measurement results of each
condition are compared together in order to observe the effect of the compensation,
the handling and temperature. Furthermore, this chapter describes the correlation
between form and location tolerances that are used to prove the correction of the
measurement results due to their correlated definitions. Additionally, different results
after program modification due to software compensation (the calibration) and the
probe zeroize method are explained and discussed in this chapter also.
Chapter 5 explains the uncertainty calculation relative to the measurement
results. Each influencing factor is set as individual uncertainty components: the
repeated measurement, the calibration, the measurement method, the temperature and
the workpiece. On the other hand, the capability indexes are explained relative to their
measurement result. The capability indexes of the reference condition are described to
perform the characteristic of the measuring machine in this study. The differences of
the capability indexes resulting from different conditions are described in order to see
whether capability index result agree with their measurement result. Additionally, the
percentage of the average increment of each measured features are calculated in this
chapter. Finally, chapter 6 obtains the conclusions related to the capability index and
the uncertainty relative to the measurement results.
CHAPTER 2
LITERATURE REVIEW
2.1 Uncertainty of Measurement
The definition of uncertainty of measurement according to the International
Vocabulary of Basic and General Terms in Metrology (VIM) 3.9 [3] is “parameter,
associated with the result of a measurement, that characterizes the dispersion of the
values that could reasonably be attributed to the measurand”. This is a formal
definition also used in the ISO Guide to the Expression of Uncertainty in
Measurement (GUM). The concept of uncertainty of measurement according to the
GUM focuses on the measurement result and its evaluated uncertainty.
According to the VIM 3.1 [3], result of a measurement is “value attributed to a
measurand, obtained by measurement”. Additionally from the notes of the
VIM 3.1 [3], “a complete statement of the result of a measurement includes
information about the uncertainty of measurement”. Even though the value obtained
from the measurement is indicated in terms of single value without measurement
uncertainty, the true result is the combined value between an estimate of true value
and the uncertainty of measurement. According to VIM 1.19 [3], true value is “a
value that would be obtained by a perfect measurement”. In general, the perfect
measurement is an ideal situation. Then the true value is the ideal value or the ideal
concept value. This definition agrees with the error propagation law that the true value
will never be known.
The GUM defines the uncertainty of the result of measurement as a standard
deviation and divides the uncertainties into two types; type-A and type-B standard
uncertainties. A type-A standard uncertainty evaluates input quantity from repeated
observations by calculating standard deviations of the mean value. On the other hand,
a type-B standard uncertainty evaluates input quantity from a single observation or
judgment based on experience by calculating the estimated value lies within the
boundaries with percentage of a confidence level. The individual uncertainties that are
independent from one another are combined together he combined standard
uncertainty is determined through the addition of the squares of the uncertainty

6
components. Finally, the result is multiplied by an appropriate coverage factor to yield
an expanded uncertainty.
Determining the thickness of a given sheet of material 20 deg C
Value of the measurand due to incomplete
Value of the measurand (non-realisable true value)
Unadjusted arithmetic mean of the observed values
Measurement the thickness the sheet at 25 deg C with a micrometer and measuring the applied pressure
Defining the measurand (specifying the quantity to be measured, depending on the required measurement uncertainty)
Measuring the realized
Complete measurement result
Measurement result (best estimate)
Correcting all know systematic influences
Determining the measurement
Unadjusted observed values
Correcting the influences of temperature and pressure
Taking into account the uncertainly of the micrometer and the correction
Residual error
FIGURE 2-1 The procedure of the measuring
Figure 2-1 shows an example of the procedure for determining the measurement
uncertainty modified from Tilo Pfeifer [4]. First, the measurand is described in terms
of specific quantity with the measurement uncertainty. Next, the measurand is
measured in accordance with the definition of the measurand. In this stage, the
measurand is corrected on the basis of information regarding recognized influences
such as probe diameter, the parallelism between the line of measurement and the line
of scale, etc. The arithmetic mean of the measurement results is the unadjusted
observed value. After all known systematic influences are corrected, the measurement
result is estimated along with residual error. The complete measurement result is
7
reported as combined value between the best estimated measurement result and its
measurement uncertainty.
2.1.1 Measurement Uncertainty and Measurement Error
The definition of error (of measurement) is the result of measured value minus
true value of the measurand according to the VIM 3.10 [3]. The measurement errors
occur in measurement process due to several influences and the nature of the
measurement process. Every measurement result is related to the measurement error
in the same way as the measurement uncertainty. The measurement uncertainty is
determined by considering several measurement error components.
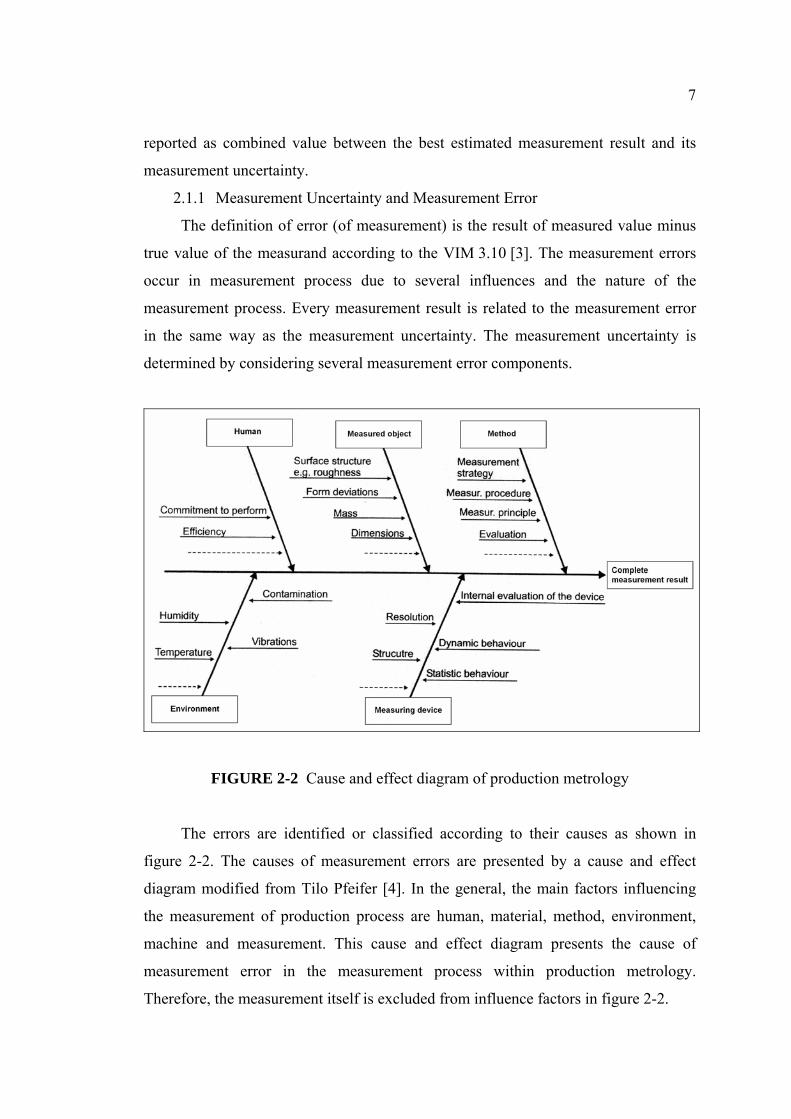
FIGURE 2-2 Cause and effect diagram of production metrology
The errors are identified or classified according to their causes as shown in
figure 2-2. The causes of measurement errors are presented by a cause and effect
diagram modified from Tilo Pfeifer [4]. In the general, the main factors influencing
the measurement of production process are human, material, method, environment,
machine and measurement. This cause and effect diagram presents the cause of
measurement error in the measurement process within production metrology.
Therefore, the measurement itself is excluded from influence factors in figure 2-2.

8
Figure 2-3 modified from Tilo Pfeifer [4] shows the classification of errors
according to their type. The sources of errors are divided into two groups; a
systematic and coincidental measurement errors. The systematic errors always occur
in the measurement because the measurement is not perfect as having many sources
of error. According to the VIM 3.14 [3], “the systematic error is result from an infinite
number of measurements of the same measurand carried out under repeatability
conditions minus a true value of the measurand”. With regard to characteristic of the
measuring instrument, the systematic error is a bias of the measuring instrument. “The
bias of a measuring instrument is normally estimated by averaging the error of
indication over an appropriate number of repeated measurements” according to the
VIM 5.25 [3].
Some sources of the systematic errors are known and corrected into the
measurement result. Some sources of errors are known but can not be corrected.
These errors, called residual errors, are included in the uncertainty of measurement.
Similar to residual errors, unknown systematic errors are calculated and included in
the uncertainty of measurement also. Because of these reasons, the systematic errors
and their causes can not be completely known. On the other hand, the coincidental
measurement error is the result from random nature of the measurement.
FIGURE 2-3 Types of measurement errors

9
Even though these errors can not be eliminated, they can be reduced by the
controlling and monitoring the measurement process. For example, the influence of
the coincidental errors can be reduced by measurement repetitions.
In consequence, the measurement result is the corrected value as some known
sources of error are corrected into the measurement result. The measurement
uncertainty is calculated from the residual errors, the unknown systematic errors and
the coincidental measurement errors.
2.1.2 Measurement Uncertainty and Accuracy of Measurement
Standard deviation of the measurement value is used to express measurement
uncertainty according to the GUM. In statistics, standard deviation represents the
dispersion of measurement results relative to its mean value. The closeness of the
agreement between the mean of measurement results and a true value of the
measurand is defined as an accuracy of measurement according to the VIM 3.5.
FIGURE 2-4 Accuracy definition
Additionally the accuracy of the measurement has the same meaning as the error
of the measurement. Both words express the difference between the result of a
measurement and the true value. The definition of the accuracy of measurement is
shown in figure 2-4.
In contrast, the accuracy is not the same as precision. According to the notes of
the VIM 3.5, “the term precision should not be used for accuracy”. However, both
words are frequently used in explaining the characteristics of the measuring machine.
Consequently the understanding of these two words is important.

10
FIGURE 2-5 The different between accuracy and precision
The difference between these two words can be explained by an example of
shooting scores in figure 2-5. The score comes from sufficient number of shooting.
While the patterns of shooting result of gun A and gun B are similar, the shooting
score of gun A is less than that of B. However, the three patterns, B, C and D, get the
same score even though the different pattern of shooting results. The shooting result
of gun B spread around the target. The shooting result of gun C spread only one side
of the target, while the shooting result of gun D is spread around the target as the gun
B but the area of the shooting result of gun D is closer to the middle point than that of
the gun B. Then gun C and D are more precise than gun B.
Additionally the accuracy of measurement is more important than the precision
in controlling process and measurement system. Even the patterns of shooting are the
same as the previous example; the shooting scores of three patterns, A, B and C are
changing immediately when the position of target is changed or the shooting area is
decreased. However, the pattern D gets the same score even though the position of
target is changed or the shooting area is decreased. Changing target position by
moving target point to the right side of picture approximately the distance between
two circles is the same as moving the arithmetic mean of the measurement results by
the influencing effects. The shooting area is the same as specific tolerance of
measurement. The shooting area is decreased from circles rounds to two circles of
target as the specification area is narrowed by measurement uncertainty or customer’s
specification. In accordance with these examples, the closeness of measurement
results to the actual value is more important than the dispersion of measurement
results.
11
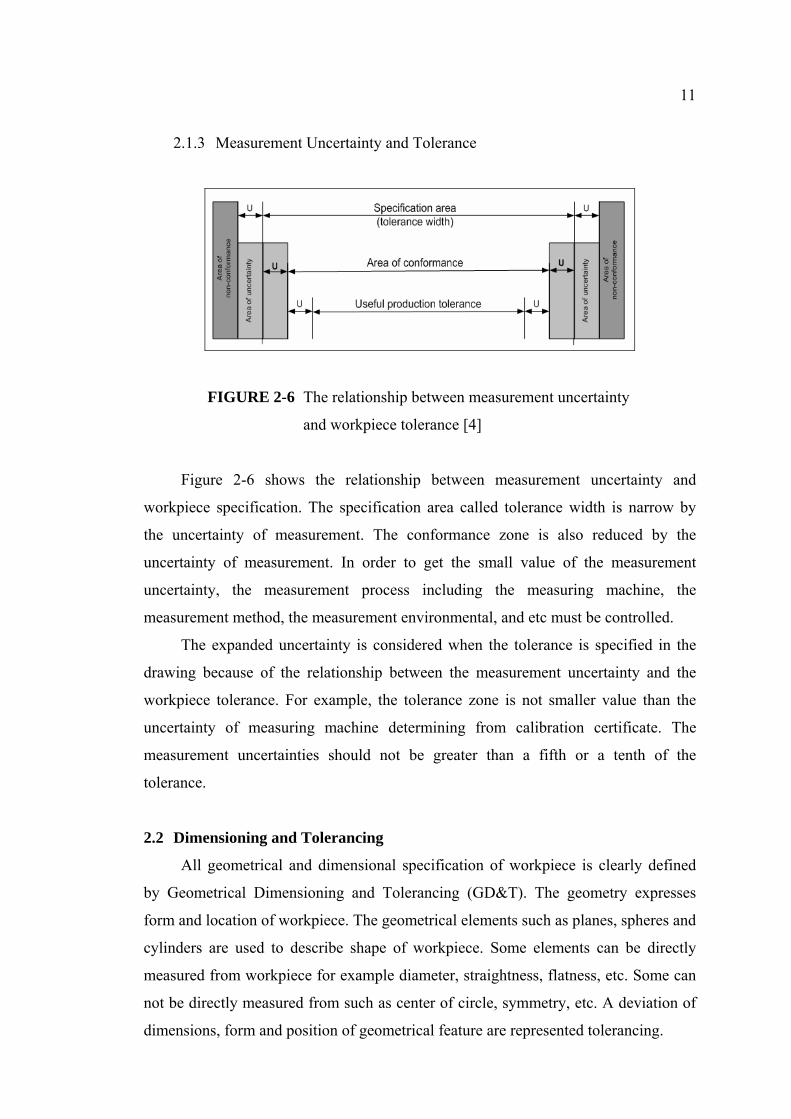
2.1.3 Measurement Uncertainty and Tolerance
FIGURE 2-6 The relationship between measurement uncertainty
and workpiece tolerance [4]
Figure 2-6 shows the relationship between measurement uncertainty and
workpiece specification. The specification area called tolerance width is narrow by
the uncertainty of measurement. The conformance zone is also reduced by the
uncertainty of measurement. In order to get the small value of the measurement
uncertainty, the measurement process including the measuring machine, the
measurement method, the measurement environmental, and etc must be controlled.
The expanded uncertainty is considered when the tolerance is specified in the
drawing because of the relationship between the measurement uncertainty and the
workpiece tolerance. For example, the tolerance zone is not smaller value than the
uncertainty of measuring machine determining from calibration certificate. The
measurement uncertainties should not be greater than a fifth or a tenth of the
tolerance.
2.2 Dimensioning and Tolerancing
All geometrical and dimensional specification of workpiece is clearly defined
by Geometrical Dimensioning and Tolerancing (GD&T). The geometry expresses
form and location of workpiece. The geometrical elements such as planes, spheres and
cylinders are used to describe shape of workpiece. Some elements can be directly
measured from workpiece for example diameter, straightness, flatness, etc. Some can
not be directly measured from such as center of circle, symmetry, etc. A deviation of
dimensions, form and position of geometrical feature are represented tolerancing.
12
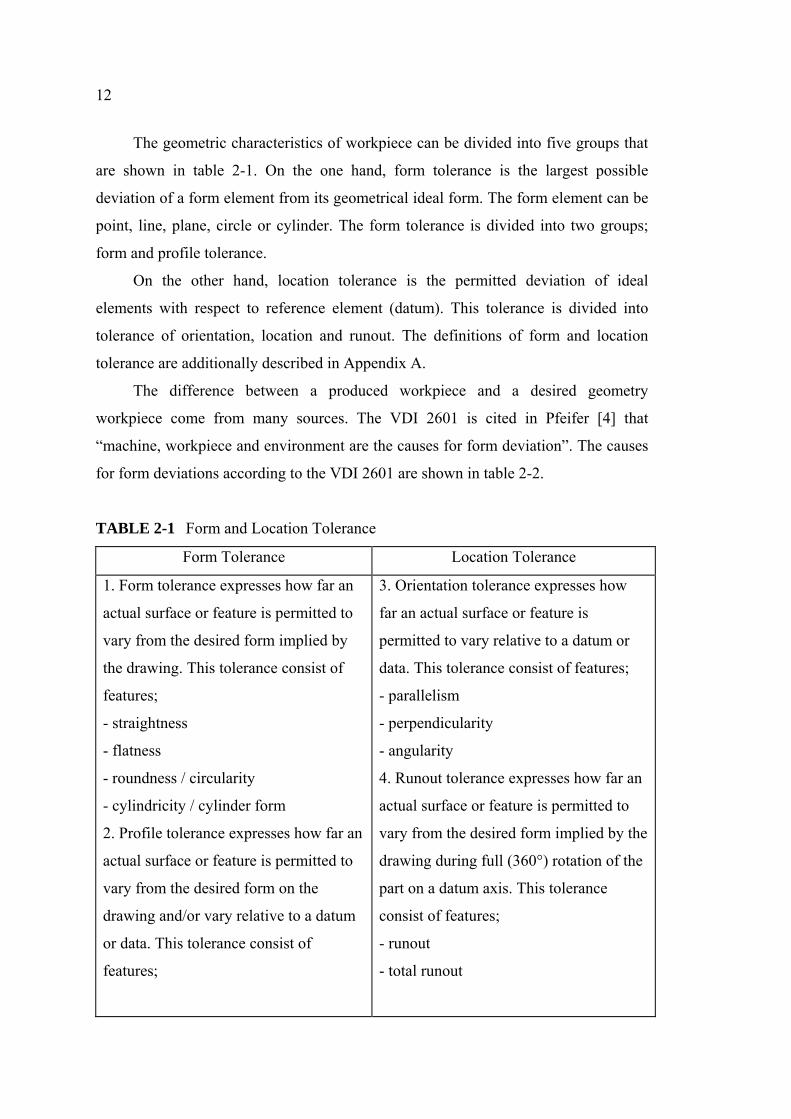
The geometric characteristics of workpiece can be divided into five groups that
are shown in table 2-1. On the one hand, form tolerance is the largest possible
deviation of a form element from its geometrical ideal form. The form element can be
point, line, plane, circle or cylinder. The form tolerance is divided into two groups;
form and profile tolerance.
On the other hand, location tolerance is the permitted deviation of ideal
elements with respect to reference element (datum). This tolerance is divided into
tolerance of orientation, location and runout. The definitions of form and location
tolerance are additionally described in Appendix A.
The difference between a produced workpiece and a desired geometry
workpiece come from many sources. The VDI 2601 is cited in Pfeifer [4] that
“machine, workpiece and environment are the causes for form deviation”. The causes
for form deviations according to the VDI 2601 are shown in table 2-2.
TABLE 2-1 Form and Location Tolerance
Form Tolerance Location Tolerance
1. Form tolerance expresses how far an
actual surface or feature is permitted to
vary from the desired form implied by
the drawing. This tolerance consist of
features;
- straightness
- flatness
- roundness / circularity
- cylindricity / cylinder form
2. Profile tolerance expresses how far an
actual surface or feature is permitted to
vary from the desired form on the
drawing and/or vary relative to a datum
or data. This tolerance consist of
features;
3. Orientation tolerance expresses how
far an actual surface or feature is
permitted to vary relative to a datum or
data. This tolerance consist of features;
- parallelism
- perpendicularity
- angularity
4. Runout tolerance expresses how far an
actual surface or feature is permitted to
vary from the desired form implied by the
drawing during full (360°) rotation of the
part on a datum axis. This tolerance
consist of features;
- runout
- total runout

13
TABLE 2-1 (CONTINUED)
Form Tolerance Location Tolerance
- line profile
- surface profile
5. Location tolerance expresses how far
an actual size feature is permitted to vary
from the perfect location implied by the
drawing as related to a datum or data, or
other feature. This tolerance consist of
features;
- position
- concentricity, coaxiality
- symmetry
TABLE 2-2 The causes for form deviations according to the VDI 2601[4]
Every workpiece, no matter how precisely it has been manufactured, displays
deviations from the geometrically ideal form.
Machine-
dependent cause
Workpiece-
Dependent cause
Environmentally-
dependent cause
- Static and dynamic
deviation of form due to
guile rails and bearing of
mobile machine
components.
- Positioning deviations of
these mobile
components.
- Elastic deformations of
the machine, the guide
rails or the tool
- Tool wear
- Bearing play
- Vibration between tool
and the machine
- Material inhomogeneities
- Deformation of the
workpiece during
processing
- Differing local
temperature distribution
during the production
process
- Subsequent shrinkage
after processing
- Releasing of inner stress
after processing
- Deformation due to
hardening
- Local temperature
fluctuations
- Temporal temperature
fluctuations
- Vibrations transferred to
the machine from the
surrounding via the
foundation

14
2.3 Form Measuring Machine
The Military Standard, Gage Inspection, MIL-STD-120 classifies gages and
equipments involved in metrology into eight groups [5];
2.3.1 Length Standards: Standards of length and angle from which all
measurements of gages are desired.
2.3.2 Master Gages: Master gages are used for checking and setting inspection
of manufacturer’s gages.
2.3.3 Inspection Gages: Inspection gages are used to inspect products for
acceptance. These gages are made in accordance with established design
requirements. Tolerances of inspection gages are prescribed by specified drawing
limits.
2.3.4 Manufacturer’s Gages: Manufacturers’ gages are used for inspection of
parts during production.
2.3.5 Noprecision Measuring Equipment: Simple tools are used to measure by
means of line graduation.
2.3.6 Precision Measuring Equipment: Tools are used to measure in thousandths
of an inch or finer.
2.3.7 Comparators: Comparators are precision measuring equipment used for
comparative measurements between the work and a contact standard such as gage or
gage blocks.
2.3.8 Optical Comparators and Gages: Optical comparators and gages are those
which apply optical methods of magnification exclusively.
The word gage and gauge are frequently used interchangeably in writing
however they refer to different thing in terms of metrology. These words are defined
in the 1983 interim standard for coordinate measuring machines.
Gage: A mechanical artifact of high precision used either for checking a part
of for checking the accuracy of a machine
Gauge: A measuring device with a proportional range and some form of
indicator, either analog or digital.
The function of form testing technology is “the metrological acquisition of form
deviations on a workpiece and making a predication about the quality of
manufactured components by comparing the determined from parameters with the
tolerated dimensions” [4].

15
The form measuring machine measures workpiece either by moving machine
axes while workpiece is fixed position or by turning workpiece when machine axes
are fixed. The measuring points on workpiece are collected and saved in term of
measured profile. The recorded data are corrected by errors such as stylus tip radius,
contacting force, alignment between line of measurement and line of machine scale,
etc. The filter is used to create the measured profile within the specification range of
measurement. The substitute elements such as point, line, plane, circle, cylinder taper
sphere and parabola are calculated from measured profiles. The form deviation is
calculated by placing the substitute element into a smallest tolerance zone by an
evaluation method. The tolerance zone expresses as the distance between two form
elements that the substitute element lies within. The evaluation method is described in
Appendix A.
The low-pass filter is used to reduce the signal fluctuation and cut-off the
measured profile waves to range of form deviations. The height of wave is reduced to
a pre-specified percentage of the original wave’s height when passing through the
filter. The filter can be explained by their characteristic or type. The filter is divided
into two types; polar and linear filtering as shown in figure 2-7.
FIGURE 2-7 Polar and Linear filter
With polar profile, the unit of polar filter is the number of undulations per
revolution (upr). The value of profile filter means the number of peak or valley on one
polar measured profile.

16
On the other hand, the unit of linear filter is millimeter (mm). The linear filter
cutoff wavelength number means the length of one wavelength or the distance from
peak to next peak or from valley to next one.
Geometrical characteristics of surface measurement can be divided into two
structural deviations; microstructure and macrostructure as shown in figure 2-8. Form
and location tolerance are macrostructure.
The data processing flow of form measuring machine is different from
Coordinate Measuring Machine (CMM). The data processing flow of CMM called
Feature-based metrology, disagree with the data processing method in profile
metrology and length metrology [6]. The Profile metrology is data processing method
of form measuring machine. The difference between the data processing of CMM and
form measuring machine are shown in table 2-3.
FIGURE 2-8 Geometrical characteristics of surface measurement [4]
TABLE 2-3 Comparison of the feature-based metrology and the profile metrology [6]
Feature-based metrology Profile metrology
Number of measured
points
Small
(10–20 in 3D)
Many
(1000–10,000 in 3D)
Uncertainty of measured
points
Large Small

17
TABLE 2-3 (CONTINUED)
Feature-based metrology Profile metrology
Density of measured
points
Low
(discrete sampling)
High
(continuous sampling)
Data processing Extrapolate,
least squares method
Filtering
Objects of measurement Parameters of feature Profile
Model of feature Yes No
As a result in table 2-3, the uncertainty of measured points of form measuring
machine based on profile metrology is small. However previous study is mostly focus
on the effects of the CMM [7], the measurement uncertainty in Coordinate
Measurement [8], the uncertainty analysis in geometric best fit [9] or the uncertainty
analysis of vectorial tolerance [10]. In this study, the study related CMM are reviewed
in order to get ideas.
Regarding to the previous studies, the sources of uncertainty or the source of
errors are one part of discussion. The uncertainty of measurement comes from many
sources and relates with the accuracy of machine. Therefore the accuracy expressed as
the dispersion of measurement results is improved by reducing the measurement
uncertainty. The uncertainties are classified into many schemes.
Qing Lin, et al. [7] divides the source of error into four types; measurement
machine component and probe, data acquisition or sampling strategy, data processing
and measurement environment. Wilhelm [8] classifies coordinate measurement
systems uncertainties into five main categories: hardware, workpiece, sampling
strategy, fitting and evaluation algorithms, and extrinsic factors. Each category
consists of many error components. For example, the hardware uncertainty occurs in
the stage of designing machine such as machine scales, machine geometry, probing
system, etc. The workpiece uncertainty category relates to the error from the
properties of the workpiece and the measurement interaction with the workpiece: part
form deviation, clamping effects, contact mechanics, surface finish and elastic
deformation.
However, Wilhelm [8] cited Trapet, et al. [11] that the uncertainties are
classified to similar errors and divided them into two categories. One is generally

18
accessed by measurements, and the others are normally estimated. The first category
of uncertainty include systematic errors of the probing process, random probing
errors, probe changing and probe articulation uncertainties, and systematic and
stochastic errors of the CMM geometry. The other category includes the uncertainties
in assessments of systematic errors, long-term changes of the individual systematic
errors, temperature influences on these errors, model imperfections, and drift effects.
Additionally, Wilhelm [8] cited to Salsbury [12] that a categorization scheme divides
the uncertainty into four categories including; machine components, probe
components, part components, and repeatability components. Salsbury presented the
relationship between the uncertainty components and the geometric dimensioning and
tolerancing by table. An example of such relationship is shown in table 2-4. This table
explains whether a specific error affects the measured features.
TABLE 2-4 Relationship between the machine uncertainty component and specific
measured features [8]
Characteristic Machine
Feature of size Yes
Length (not feature of size) Yes
Angle, cone Possible, more likely for larger surfaces
Angle, between features Yes
Flatness Unlikely, except very large surfaces
Straightness Unlikely, except very large surfaces
Circularity (roundness) Unlikely, except very large surfaces
Cylindricity Unlikely, except very large surfaces
Perpendicularity (squareness) Yes
Angularity Yes
Parallelism Yes
Profile of a surface (no datums) Possible, more likely for larger surfaces
Profile of a line (no datums) Possible, more likely for larger surfaces
Profile of a surface (with datums) Yes
Profile of a line (with datums) Yes
Circular runout Yes

19
TABLE 2-4 (CONTINUED)
Characteristic Machine
Total runout Yes
Position (features of size) Yes
Position (not feature of size) Yes
In conclusion, Salsbury [8] said that “Consequently, the ability to determine all
of the uncertainty sources and to include them in an uncertainty evaluation for the
measurement at hand is more important than the categorization scheme of error
components that lead to uncertainties”.
The measuring machine is one factor for complete measurement results. It has
influences to the production and control processes. The characteristics of measuring
machine must be known such as accuracy, repeatability, stability, linearity, etc. figure
2-9 shows some characteristics of measuring machine.

20
FIGURE 2-9 The characteristic of measuring machine [13]
These definitions refer to Ford guideline for measurement system and
equipment capability [13].
Accuracy is the systematic difference between the observed average of
measurements and the true average of the same characteristic on the same component.
The accuracy of the measurement system is affected by its calibration.
Stability is the difference in the average of at least two sets of measurements
obtained with the same equipment on the same components taken at different times.
21
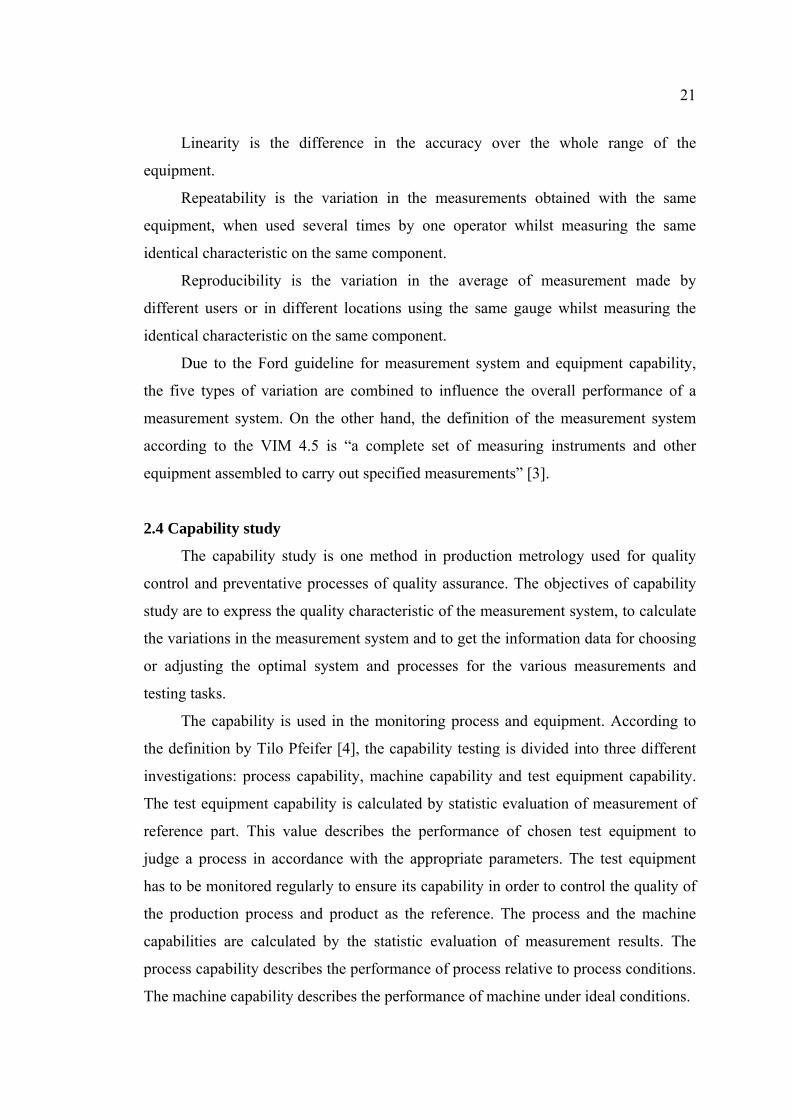
Linearity is the difference in the accuracy over the whole range of the
equipment.
Repeatability is the variation in the measurements obtained with the same
equipment, when used several times by one operator whilst measuring the same
identical characteristic on the same component.
Reproducibility is the variation in the average of measurement made by
different users or in different locations using the same gauge whilst measuring the
identical characteristic on the same component.
Due to the Ford guideline for measurement system and equipment capability,
the five types of variation are combined to influence the overall performance of a
measurement system. On the other hand, the definition of the measurement system
according to the VIM 4.5 is “a complete set of measuring instruments and other
equipment assembled to carry out specified measurements” [3].
2.4 Capability study
The capability study is one method in production metrology used for quality
control and preventative processes of quality assurance. The objectives of capability
study are to express the quality characteristic of the measurement system, to calculate
the variations in the measurement system and to get the information data for choosing
or adjusting the optimal system and processes for the various measurements and
testing tasks.
The capability is used in the monitoring process and equipment. According to
the definition by Tilo Pfeifer [4], the capability testing is divided into three different
investigations: process capability, machine capability and test equipment capability.
The test equipment capability is calculated by statistic evaluation of measurement of
reference part. This value describes the performance of chosen test equipment to
judge a process in accordance with the appropriate parameters. The test equipment
has to be monitored regularly to ensure its capability in order to control the quality of
the production process and product as the reference. The process and the machine
capabilities are calculated by the statistic evaluation of measurement results. The
process capability describes the performance of process relative to process conditions.
The machine capability describes the performance of machine under ideal conditions.

22
According to the Bosch book10 standard about Capability of Measurement and
Test Processes, the procedure for Testing Capability consists of five procedures
including:
Procedure 1: Variation and average position of measured values (Bias and
Repeatability).
Procedure 2: Variation of measured values by influence of handling by several
operators.
Procedure 3: Variation of measured values by influence of the measuring
objects.
Procedure 4: Linearity.
Procedure 5: Inspection and test equipment for qualitative characteristics.
The purpose of these procedures is testing of the capability and monitoring of
the stability of measurement processes to ensure that measuring device is capable of
measurement with a sufficiently small variation of measured value. The Procedure 1
is to investigate the capability testing in order to perform the repeatability and
accuracy of the measuring machine according to objectives of this study.
The Procedure 1 requires twenty-five or fifty times of measurement with a
standard workpiece or a production part which is done by one operator. The
measurement system must be calibrated before starting the measurement. In
accordance with the note in Procedure 1, the systematic deviation (bias) must always
be corrected by modification (e.g. adjustment) of the measurement system or it can be
compensated by correction of every result of the measurement. In addition, the
standard workpiece or the production part must be removed or replaced for each
measurement due to the procedure of Ford guideline for measurement system and
equipment capability [13]. The equations 2-1 and 2-2 are used to calculate the
capability indices (Cg, Cgk). The minimum requirements on capability indices of
Bosch standard are 1.33 while the uncertainty of calibration must be significantly
small when this value is less than 10% of tolerance. The capability indices can be
calculated as follows.
g
g s6T2.0C = Eq. 2-1

23
( )
∑
∑
=
=
=
−−
=
=
n
1ii
2n
1igi
Xn1X
XX1n
1
Tolerance T Where
gs
g
mg
gk s3
XXT1.0C
−−= Eq. 2-2
(master) workpiecestandard of valueTrueX
value)(absolute X and Xbetween differenceXX Where
m
mgmg
=
=−
2.0
)s6(CT gg
min = Eq. 2-3
10[2])Book Bosch with
accoedingindex capability theoft requiremen minimum (the 1.33C Where g =
FIGURE 2-10 The concept of capability index

24
Figure 2-10 shows the capability indices calculate the specified tolerance in the
comparison with the dispersion of the measurement value.
Measurement Uncertainty combined standard uncertainty
Measurement System Capability Type-1 Study Cg, Cgk
Documentation Part No., Description,Characteristic, Tolerance, Gage Gage No., Resolution, Actual Dimension, etc
Ustandard = (Ustandard/2) with P = 95% Ures = (1/2) · 0.6 · Resolution
Ustandard ≤ 5% of T Resolution ≤ 5% of T
Measure the standard Xmn times
Usys = 0.6 · mg XX ⋅
Uw = n
sg
Upm = 2x
2w
2sys
2res
2dardtans UUUUU ++++
Ux = other interference factors
Average gX
Bias mg XX ⋅
Standard Deviation Sg
Cg = gS4T2.0
⋅⋅
Cgk = g
g
S2
XmXT1.0 −−⋅
Type-2 Study
3 · (Upm/T) · ≤ 0.1 or 0.2
Extended Measurement Uncertainty
CgCgk ≥ 1.33 Improve
gauge
FIGURE 2-11 The comparison between the combined standard uncertainty (Upm)
and the capability indices type-1 study (Cg, Cgk)
In figure 2-11, the procedure of the measurement uncertainty calculation and the
procedure of the capability indices calculation can be combined into one diagram.
This figure shows the comparison between the machine uncertainty and the test
25
equipment capability procedure. The measurement uncertainty of the machine is
determined by the VDA5 whereas the capability indices are determined by the
automobile industrial standard.
Even though the reference standard for calculating the measurement uncertainty
and the capability indices in this figure is not the same as that used in this study, this
figure is a good explanation that the result from the capability study can be used to
estimate the combined uncertainty of measurement.
The average, the bias and the standard deviation of measurement result are used
in the calculation of the measurement uncertainty and the capability indices. This
corresponds with the introduction in the Bosch standard [2] that “the measurement
uncertainty must be specified when the measuring equipment is calibrated and
monitored”.
2.5 International standards related to form measurement and uncertainty
measurement
Most dimensioning standards used in industries refer to the American Society of
Mechanical Engineers (ASME) or the International Organization for Standardization
(ISO) standards. Due to dimensioning and Tolerancing document, the ASME and the
ISO standard are different. The ASME standard explains all dimensioning and
Tolerancing topic into a single standard. The approach to dimensioning based on the
functioning of product that is supported with illustrated examples of tolerancing
applications. The ASME standards on dimensioning are ASME Y14.5 Dimensioning
and Tolerancing, ASME Y14.5.1M Mathematical Definition of Dimensioning and
Tolerancing Principles, ASME Y14.8 Castings and Forgings and ASME Y14.32.1
Chassis Dimensioning Practices. On the other hand, the ISO standard covers multiple
standards that are explained in the theoretical subsets of dimensioning and tolerancing
topics for example:
ISO1101 Technical drawing- Geometrical Tolerancing-Tolerances of form,
orientation, location and runout – Generalities, definitions, symbols, indications on
drawings,
ISO2692 Technical drawing- Geometrical Tolerancing-Maximum material
principle,
ISO5458 Technical drawing- Geometrical Tolerancing-Positional Tolerancing

26
ISO8015 Technical drawing- Fundamental Tolerancing principle,
ISO10209-1 Technical product documentation vocabulary-Part 1: - Terms
relating to technical drawing – General and types of drawings, Etc.
However, the ASME and ISO standards organizations are continually making
revisions that bring the two standards closer together. Paul J. Drake [14] said that
“currently the ASME and ISO dimensioning standards are 60 to 70% common”.
Consequently, the trend of developing standard is toward a unique standard. The
national standards and the primary standards are combined and compared for making
the international standard references. Most the national laboratories have accepted the
GUM for analysis measurement uncertainty. The seven international standards and
metrology organizations, including International Bureau of Weights and Measures
(BIPM), International Electrotechnical Commission (IEC), International Federation of
Clinical Chemistry (IFCC), International Union of Pure and Applied Chemistry
(IUPAC), International Union of Pure and Applied Physics (IUPAP), International
Organization of Legal Metrology (OIML) and International Organization for
Standardization (ISO) take part in developing the GUM. The purposes of this standard
are to promote information about the uncertainty and to provide a basic for the
international comparison of measurement results.

CHAPTER 3
MEASUREMENT PROCESS
3.1 Measuring Machine (MMQ400) and Software
A measuring machine consists of the machine, a probe system and software.
First of all, MMQ400 is a precision measuring equipment, a new series of MarForm
Desktop Formtester of the Mahr Company. According to the company definition,
MMQ400 is a high-precision shop floor equipment for fast setting of the
manufacturing process for large measuring volume and large weight capacity of the
rotary table. MMQ400 machine consists of 3 main modules, a centering and tilting
table, vertical and horizontal axes. The combination of modules is made in order to
build up the machine for the customer satisfaction according to their budget and
requirements.
The measuring machine in this study is MMQ400_CNC of which its centering
and tilting table is computer numerically controlled as shown in figure 3-1. The linear
scale on the vertical axis (the z axis) has a measuring length of 350 mm while that on
a horizontal axis (the x axis) has a measuring length of 180 mm. The probe unit is
digital rotary encoder (T7W probe).
FIGURE 3-1 MMQ400 the precision measuring machine [15]

28
Mechanical elements of the measuring machine affect its accuracy. In the
designing stage, the sources of error in each component are analyzed in order to meet
the measuring machine requirements; high dimensional stability, high stiffness, light
weight, high damping capacity, low coefficient of thermal expansion and high thermal
conductivity. Due to the effect of temperature to the structure of the measuring
machine component, homogenous materials are used to minimize such effects. The
base unit and the vertical measuring axis are made from highly stable steel body. In
addition, the MMQ400 has a high damping capacity and large loading capability of
the centering and tilting table due to mechanical bearing. Even though the air bearing
has advantages with less fiction, no stick-slip effect and self-cleaning characteristics,
it is sensitive to the external surrounding effect. While this mechanical bearing has
similar quality as good air bearing. It is produced by Mahr with special production
techniques and materials.
Secondly, the T7W CNC probe system is augmented by motor-driven rotational
axis. It is possible to probe the workpiece 360° and can contact workpiece into two
directions; positive and negative probe angularity. The T7W probe can measure
internal or external surface as well as end face or top surface of the workpiece.
Because the probe arm is fixed with the probe system by magnetic mounting, it
ensures the flexibility of using multi-probe and the safety of the probe collision. The
technical data of T7W are;
Total measurement range of 2,000 µm (0.079")
Zero probe with a working range of ± 500 μm (± 0.0197")
Measuring force adjustable from 0.01 to 0.2 N
Contacting angle in 1° steps (Probe resolution)
Thirdly, MMQ400 operates with the software module that is designed and
developed by the Mahr Company. This software module supports a variety of
applications. It can generate the required information to carry out measurement data
in different programming methods. This software can operate the measuring machine
with the manual programming, learning programming or teach-in procedure and the
offline programming procedure. The structure level of MarWin software module used
to operate Mahr Form testers is shown in figure 3-2.
The measurement programs of this study are run in MarEdit module that is part
of the Professional Form software package and is an optional module in Advanced

29
Form software package. MarEdit is operated by "MarScript", a measuring language
based on C and Pascal programming languages. These include comments, definitions,
control structures (e.g. loops), statements and preprocessor statements. MarEdit is
suitable for specific tasks. It is able to program automatically motion cycles and
functional commands. It can be used to operate without a measuring device also.
FIGURE 3-2 The structure level of MarWin software module [15]
3.2 Reference measurement machine (MFU100)
MFU100 is one of Mahr Formtester series. The company definition of MFU100
is the reference form measuring machine for the inspection laboratory and the
production environment. In accordance with the measurement rule, the reference
machine should be more accurate than the measuring machine by at least 10 times. In
comparing the technical data of both machines, the resolution in X, Y, Z and C-axis of
MFU100 are 0.001 µm, 0.005 µm, 0.001 µm and 0.0001° while the resolution in X, Z
and C-axis of MMQ400 are 5.0 µm, 5.0 µm and 0.05°.
In addition, MFU100 has an attached sensor inside the machine to monitor the
temperature during measurement. The measurement results are corrected for the
temperature effect directly. The temperature compensation can be performed either
directly when the profile is being recorded or after the measurement. MMQ400 can
not compensate the temperature influence by the software technique as MFU100.
Thus it should be operated in the temperature controlled room in order to reduce the
temperature effect. This is also one of the reasons that the MFU100 is more accurate
than MMQ400.

30
Because of the above reasons, MFU100 can be used to obtain the reference
value of the workpiece in this study. The technical data of this measuring machine is
shown in Appendix B.
3.3 Temperature measurement device
Testo950, temperature measuring instrument of Testo AG, is a highly accurate
measuring instrument. Many kinds of probes can be used with this measuring
instrument for the variety applications such as a thermocouple sensor, a resistance
sensor (pt100) and a thermistor (NTC). “The probe type is determined by the
measuring task. The suitable temperature sensor is selected according to the following
criteria: measuring range, accuracy, design, response time and resistance [16].”
The probe type pt100, the precision air probe, is used to collect temperature data
in this study. Pt100 is the abbreviation for the resistance temperature sensor. This
probe is made from Platinum. It has a specified resistance of 100.00 ohms at 0°C. The
selected probe type is applicable to the 0-50°C measurement range.
TABLE 3-1 The technical data of probe type according to the Testo information [16] Technical data
Probe type Pt100 NTC Type K (NiCr-Ni)
Meas. range -200 to +800°C -40 to +150°C -200 to +1370°C
Accuracy
±1 digit
±0.1°C (-49.9 to +99.9°C)
±0.4°C (-99.9 to -50°C)
±0.4°C (+100 to +199.9°C)
±1°C (-200 to -100°C)
±1°C (+200 to +800°C)
±0.2°C (-10 to +50°C)
±0.4°C (-40 to -10.1°C)
±0.4°C (+50.1 to +150°C)
±0.4°C (-100 to +200°C)
±1°C (-200 to -100.1°C)
±1°C (+200.1 to +1370°C)
Resolution 0.01°C (-99.9 to +300°C)
0.1°C (-200 to -100°C)
0.1°C (+300 to +800°C)
0.1°C (-40 to +150°C)
0.1°C (-200 to +1370°C)
In the experiment, the testco950 put on the machine base in order to measure the
temperature at every 5 second. With this period of collecting temperature data, it can
be automatic recorded data for the experimental up to 22 hrs. The amount of recorded
data depends on the memory size of the measuring temperature device. The accuracy
of temperature measurement result is ±0.1°C when is measured at –49.4 to 99.9°C.
31
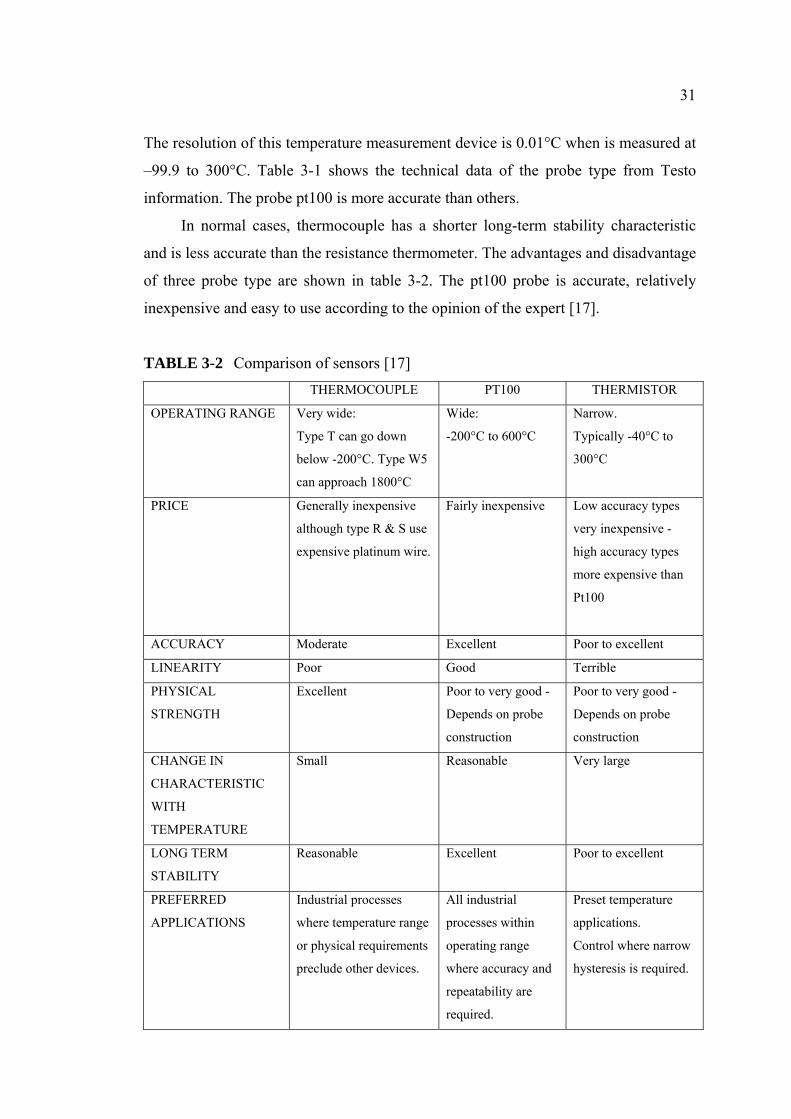
The resolution of this temperature measurement device is 0.01°C when is measured at
–99.9 to 300°C. Table 3-1 shows the technical data of the probe type from Testo
information. The probe pt100 is more accurate than others.
In normal cases, thermocouple has a shorter long-term stability characteristic
and is less accurate than the resistance thermometer. The advantages and disadvantage
of three probe type are shown in table 3-2. The pt100 probe is accurate, relatively
inexpensive and easy to use according to the opinion of the expert [17].
TABLE 3-2 Comparison of sensors [17] THERMOCOUPLE PT100 THERMISTOR
OPERATING RANGE Very wide:
Type T can go down
below -200°C. Type W5
can approach 1800°C
Wide:
-200°C to 600°C
Narrow.
Typically -40°C to
300°C
PRICE Generally inexpensive
although type R & S use
expensive platinum wire.
Fairly inexpensive Low accuracy types
very inexpensive -
high accuracy types
more expensive than
Pt100
ACCURACY Moderate Excellent Poor to excellent
LINEARITY Poor Good Terrible
PHYSICAL
STRENGTH
Excellent Poor to very good -
Depends on probe
construction
Poor to very good -
Depends on probe
construction
CHANGE IN
CHARACTERISTIC
WITH
TEMPERATURE
Small Reasonable Very large
LONG TERM
STABILITY
Reasonable Excellent Poor to excellent
PREFERRED
APPLICATIONS
Industrial processes
where temperature range
or physical requirements
preclude other devices.
All industrial
processes within
operating range
where accuracy and
repeatability are
required.
Preset temperature
applications.
Control where narrow
hysteresis is required.

32
3.4 Workpiece and clampling device
A cylindrical standard workpiece of this study is made of steel with a height of
100 mm and a diameter of 20 mm. This cylinder workpiece have two flat areas called
flick areas, at specific heights of the workpiece. The workpiece is called a universal
cylinder square or a high-precision cylinder square. It is used to calibrate the signal
transmission chain at two flick sections and to test the straightness and parallelism of
the axes as shown in figure 3-3.
In this study, the reference values of the workpiece are obtained from MFU100
along with calculated measurement uncertainty and the capability indices.
In addition, the workpiece has the same characteristics as that used in
interlaboratory comparison of parallelism measurements. The purpose of the
intercomparison of the parallelism measurements [18] are to make information of
straightness and parallelism measurement, to improve parallelism measurement
capabilities, to study the problem of the measuring machine and to test the uncertainty
evaluation. This workpiece characteristic is observed from the calibration results
which may reveal for any instability of form.
FIGURE 3-3 The cylindrical standard workpiece information [15]
On the other hand, the clamping device or fixturing is one of the influencing
factors on the form measurement. It is a possible source of error due to deformation
and workpiece alignment. Workpiece deforms due to applied probe force and
fixturing method. Its bending leads to imperfect parallelism between the line of
workpiece and the line of measurement. Moreover, fixturing directly affects
workpiece alignment.
33
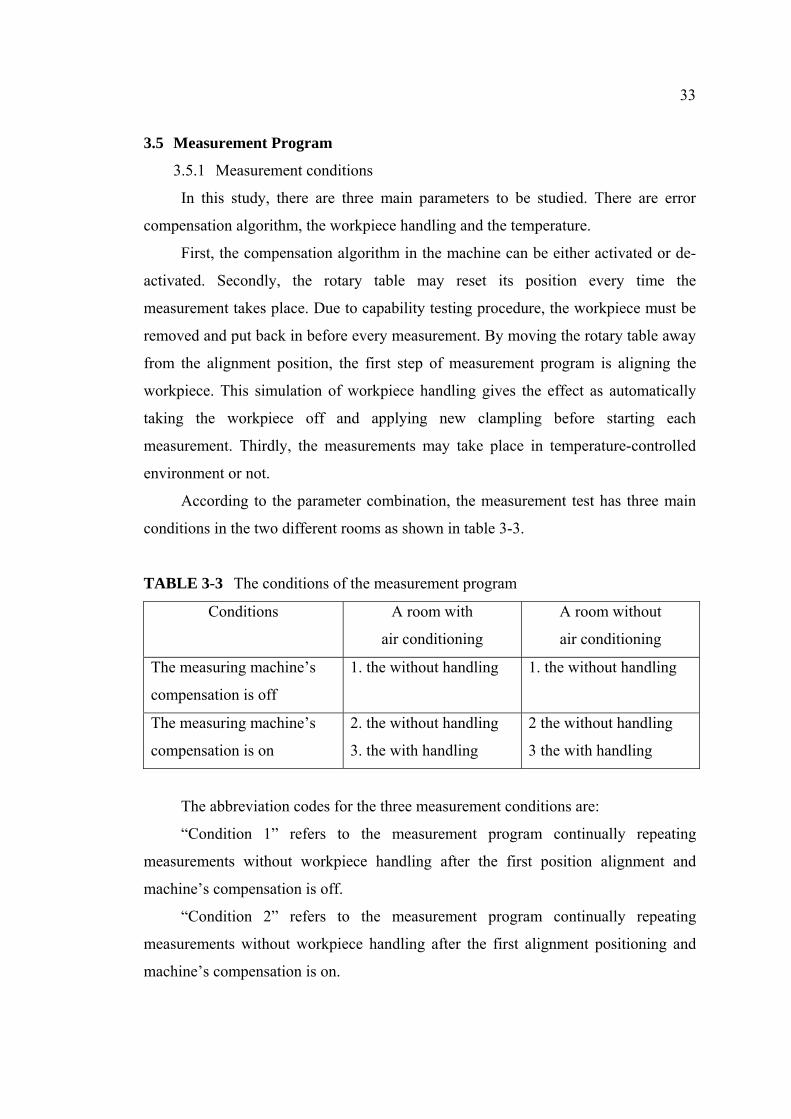
3.5 Measurement Program
3.5.1 Measurement conditions
In this study, there are three main parameters to be studied. There are error
compensation algorithm, the workpiece handling and the temperature.
First, the compensation algorithm in the machine can be either activated or de-
activated. Secondly, the rotary table may reset its position every time the
measurement takes place. Due to capability testing procedure, the workpiece must be
removed and put back in before every measurement. By moving the rotary table away
from the alignment position, the first step of measurement program is aligning the
workpiece. This simulation of workpiece handling gives the effect as automatically
taking the workpiece off and applying new clampling before starting each
measurement. Thirdly, the measurements may take place in temperature-controlled
environment or not.
According to the parameter combination, the measurement test has three main
conditions in the two different rooms as shown in table 3-3.
TABLE 3-3 The conditions of the measurement program
Conditions A room with
air conditioning
A room without
air conditioning
The measuring machine’s
compensation is off
1. the without handling
1. the without handling
The measuring machine’s
compensation is on
2. the without handling
3. the with handling
2 the without handling
3 the with handling
The abbreviation codes for the three measurement conditions are:
“Condition 1” refers to the measurement program continually repeating
measurements without workpiece handling after the first position alignment and
machine’s compensation is off.
“Condition 2” refers to the measurement program continually repeating
measurements without workpiece handling after the first alignment positioning and
machine’s compensation is on.
34
“Condition 3” refers to the measurement program having the workpiece
handling simulation by the resetting position of the rotational table before making
measurements and machine’s compensation is on.
The measurement program having the workpiece handling simulation by the
moving position of the rotational table before measurements and machine’s
compensation is off is not considered here. In normal case, the compensation in the
measuring machine is activated on only. The compensation is de-activated in order to
compare the correction of the measurement result between on and off compensation
and to prove the effect of the compensation algorithm.
Condition 2 is the primary condition to compare with other conditions.
Condition 2 is compared with Condition 1 in order to observe the effect of machine’s
compensation. The difference between measurement results between Condition 1 and
Condition 2 reveals the effectiveness of the compensation. On the other hand,
Condition 2 is compared with Condition 3 to observe the effect of workpiece handling
and the drifts in measuring machine‘s column during the measurement.
Finally, the measurement results of each condition when measured in the
temperature controlled and the temperature uncontrolled rooms are used to observe
the effect of temperature.
3.5.2 The measurement program steps
The measurement program created by MarWin software program is modified
from the cylindrical standard workpiece’s capability testing. The capability testing of
the cylinder standard workpiece is performed by the software program in the regularly
calibrated formtester. In this study, some commands are added in the measurement
program to collect additional data to meet the purposes.
The steps of measurement program consist of
3.5.2.1 Probe qualification
The probe information must be verified. In this study, probe diameter is 1.0 mm.
Its arm length is 60.0 mm. The probe angle is 12.0° following the settings in the
standard measurement program.
3.5.2.2 Setting the workpiece coordinate
The workpiece coordinate is set at the upper edge of the lowest workpiece
height in order to identify the measurement height following the specification
drawing. figure 3-4 modified from Mahr [15] show the measurement positions.

35
FIGURE 3-4 The specification information of the cylindrical standard workpiece
The measured positions and the determined features in this study are shown in
figure 3-4. The abbreviation code for the measurement results consists of two parts-
the feature name and the number of cutoff wavelength. The first group focuses on
measurement at certain positions:
“R10” refers to roundness deviation at 10 mm height in workpiece coordinates,
“G0” refers to straightness deviation at 0°,
“P0_180” ” refers to parallelism deviation at 0° and 180°,
“K0_180” ” refers to conicity deviation at 0° and 180°,
“RUNOUT” refers to radial runout deviation with z axis of the machine as
datum,

36
“CYL” refers to cylindricity deviation,
“RUNOUT1” refers to radial runout deviation with workpiece related datum.
3.5.2.3 Aligning workpiece
The workpiece is aligned by the scanning two polar coordinates in order to
make the line of measurement (the workpiece) parallel with the line of scale (the
machine). The setting of the permissible eccentricity value is 2.0 µm. From the
workpiece drawing, the first circle of alignment is at 5 mm above workpiece reference
coordinate. The second circle is at 95 mm above workpiece reference coordinate. The
distance between two aligned circles is considered evaluation length.
3.5.2.4 Setting the actual workpiece coordinate
The workpiece is moved to the suitable position that the line of the
measurement (the workpiece) and the line of scale (the machine) are parallel.
Depending on the actual position from aligning workpiece, it is necessary to set the
new workpiece coordinate system.
3.5.2.5 Measuring
The measuring machine scans three circles at 15.0, 50.0 and 85.0 mm of the
workpiece coordinate and two circles at 10.0 and 20.0 mm where the flicks are
located. Consequently, the measuring machine sequentially scans four lines at 0°,
180°, 90° and 270° of the rotary table. The measuring speed and acceleration of the
polar measurement are 30.0 °/sec and 50.0 °/sec2. The measuring speed and
acceleration of the linear measurement are 5.0 mm/s and 25.0 mm/sec2. The polar
measuring interval is 0.1° while the linear measuring interval is 0.1 mm. All the
measured profiles are saved for the purpose of re-calculation with other criteria.
The measurement program, under no-handling condition, repeat the
measurement until the number of measurements is fifty. The workpiece is aligned
once time at the beginning of the entire measurement process. In contrast, workpiece
is aligned before starting each repeated measurement under the handling condition.
3.5.2.6 Evaluating the measured profile
The measured profile is cut into specific wavelength by filtering process. With
polar measurements, the measured profile is cut off by low-pass filters of 15, 50, 150
and 500 undulations per revolution (upr). According the filtering principle, the lowest
polar cutoff wavelength number has the strongest filtering effect. However the higher
upr means not only less filtering effect but also allows more of the surrounding

37
disturbances. In this study, the measurement is performed in two different air
conditioning controlled rooms in order to observe the temperature effects.
Measurements in a room without air conditioning have more environmental
disturbances than those in a room with air conditioning. Consequently, the cutoff
wavelength number 150 upr is chosen for creating the circular profile.
The linear profile is determined by low-pass filter of 0.25 mm and 0.80 mm of
wavelengths. High linear cutoff wavelength number has strong filtering effect. The
filter 0.25 mm of wavelength is selected as a reference. The filter information is
described in section 2.3.
3.5.2.7 Determining Form and Location Tolerance
The evaluation method for the polar measurement is the Minimum Zone Circles
(MZC) while the evaluation method for the linear measurement is the Least Square
Straight line (LSS). The evaluation method details are described in Appendix A.
The measurement program of cylindrical standard workpiece (the high-precision
cylinder square) makes five polar measurements and four linear measurements and
combines with four polar filters and two linear filters. According to these steps, the
measured profiles are used to determine eight features:
a) Roundness at three different heights,
b) Roundness with flick at two different heights where the flick
are on workpiece,
c) Straightness at four angularity of the workpiece,
d) Parallelism by evaluating the same profile as straightness and
the opposite line as datum,
e) Conicity by evaluating the same profile as straightness and
the opposite line as datum,
f) Radial runout with machine datum by evaluating the middle
circular profile,
g) Radial runout with workpiece datum by creating workpiece
datum from three circles and evaluating the middle circular profile,
h) Cylindricity by evaluating three circles.
Roundness and straightness measurements provide information on form
tolerance of polar and linear profile. Parallelism and conicity are evaluated from the
same profile as straightness with the opposite line as datum. Radial runout with z axis
38
as datum is determined in this measurement program in order to investigate the
temperature effect on the machine column. The selected datum depends on the
measurement objective. The datum line is crated by evaluating with machine
information (machine datum) or determining line from centre of each polar profiles-
substitute circle elements (workpiece datum). The c-axis or the z-axis of the
formtester should be selected to be the reference element. Both machine-axes give the
same radial run out measurement results. The more detail about the comparison
between the radial run out with the machine datum when using the c-axis or the z-axis
of the formtester are described in Appendix B. As a result of the same profile,
roundness, radial runout with the machine datum and radial runout with workpiece
related datum are discussed together in order to verify the results. Cylindricity is
evaluated from the three profiles of roundness.
All evaluated values are saved in the form of electronic data for calculating the
measurement uncertainty and capability indices. The protocol of the measurement
result is saved for checking the complement of the measured profile. The example of
the measurement protocol is shown in Appendix B.
3.5.2.8 Calculating the Capability index
The capability testing of the cylinder standard workpiece can be done by
software measurement program. The workpiece is also used for calibrating the
sensitivity of the signal transmission chain by two flicks sections of the standard and
for testing the straightness and parallelism of the linear measuring axes of the
machine. The measurement program calculates the capability indices according to
Bosch Book 10 described in section 2.4.
The capability index is determined by the other measurement program along
with manual calculation. All measurement results of each feature are plotted in
graphs.

CHAPTER 4
MEASUREMENT RESULTS AND DISCUSSIONS
Eight measurements are selected in order to observe their deviations using
specific cutoff wavelength number. These results are R10_150, R50_150, CYL_150,
RUNOUT_150, G0_025, G180_025, P0_180_025 and K0_180_025.
“R10_150” represents roundness deviation measured at 10 mm height in
workpiece coordinates including the small flick, filtered by cutoff wavelength number
150 upr,
“R50_150” represents roundness deviation measured at 50 mm height in
workpiece coordinates, filtered by cutoff wavelength number 150 upr,
“CYL_150” represents cylindricity deviation determined by three polar
measurements at 15, 50 and 85 mm heights in workpiece coordinates, filtered by
cutoff wavelength number 150 upr,
“RUNOUT_150” represents radial runout deviation with z axis of the machine
as datum measured at 50 mm height in workpiece coordinates, filtered by cutoff
wavelength number 150 upr,
“G0_025” represents straightness deviation measured at 0 degree in workpiece
coordinates, filtered by cutoff wavelength number 0.25 mm,
“G180_025” represents straightness deviation measured at 180 degrees in
workpiece coordinates, filtered by cutoff wavelength number 0.25 mm,
“P0_180_025” represents maximum parallelism deviation for the generating
lines on the opposite side of the cylinder measured at 0 and 180 degrees in workpiece
coordinates, filtered by cutoff wavelength number 0.25 mm,
“K0_180_025” represents maximum conicity deviation for the generating lines
on the opposite side of the cylinder measured at 0 and 180 degree in workpiece
coordinates, filtered by cutoff wavelength number 0.25 mm.
The measurement at 10 mm height in workpiece coordinate is selected to
represent roundness deviation including the flick. Roundness deviations determined
from polar profile at 50 mm of the workpiece coordinate are selected to represent
roundness deviation. Cylindricity determined from three polar profiles are selected

40
also. Cylindricity feature is added to the measurement program as it is widely used in
various industries. Cylindricity tolerance is often used to measure bores, shafts and
pins. The three polar profiles are used to determine cylindricity deviation. Radial
runout deviation (RUNOUT_150) is determined from the same measured profile as
roundness deviation at 50 mm of the workpiece coordinate. Radial runout deviation
with the machine’s axes as datum (RUNOUT_150) is added to the measurement
program in order to study the effect of temperature on machine column.
Among others, the measurement program scans four vertical lines at 0, 90, 180
and 270 degrees in workpiece coordinates. The linear measured profile at 0° and 180°
in workpiece coordinates are selected not only to investigate straightness deviation
(G0_025 and G180_025) but also to check parallelism and conicity deviations.
Therefore, the parallelism and conicity at 0° and 180° in workpiece coordinates
(P0_180_025 and K0_180_025) are also included in this study.
Each measurement condition is performed in two separate rooms. Temperature
during the measurement is collected by the temperature measuring device: testco950.
The characteristic and technical data of the temperature measuring device is described
in section 3.3. The temperature information of each condition is shown in table 4-1.
TABLE 4-1 The temperature information when are measured at the different
controlled air conditioning room.
with air conditioning
without air conditioning
with air conditioning
without air conditioning
with air conditioning
without air conditioning
Range (°C) 1 1.81 0.68 2.23 0.45 5.61Maximum (°C) 20.49 27.67 20.52 30.6 20.81 33.8Minimum (°C) 19.49 25.86 19.84 28.37 20.36 28.19
Condition 2 Condition 3 Condition Temperature
Condition 1
The first room is controlled at 20±1°C by an air conditioning unit. 20±1°C is the
standard controlled temperature of precision measurement. The other room has no air
conditioning. Temperatures of the room without air conditioning under three
conditions are different depending on different date of measurement. Temperature
under Condition 1 has the lowest range among other results measured in the room
without air conditioning. Temperature of the room without air conditioning under
Condition 1 is 26±2°C. Temperatures of the room without air conditioning are
30±2°C under Condition 2 and 31±3°C under Condition 3. The ranges of temperature

41
measured in the room without air conditioning are bigger than those measured in the
room with air conditioning.
Mean value of repeated measurements is used to compare with the reference
value of the workpiece. The reference value is obtained from more accurate
measuring machine (MFU100). The mean value, standard deviation and range are the
main quantitative values for discussion and comparison of results under different
conditions. More details on the setting conditions are described in section 3.5.
4.1 The effect of air-conditioning room
The influence of temperature is more significant with length measurement as the
result of the expansion of workpiece and machine components. To diminish the
measurement uncertainty, it is necessary to decrease the sensitivity of measuring
device with respect to the environment or to carry out the measurements where
temperature can be controlled. This formtester, MMQ400, does not have an attached
sensor inside the machine to detect temperature during measurement. Then MMQ400
can not compensate the measurement results from temperature effect.
In this section, the measurement results between with and without air
conditioning is compared when the compensation is activated off. The difference
between two represent calibration room and production. The left-hand side in
figure 4-1 shows the measurement results from the room with air conditioning, while
the right-hand side shows the measurement results from the room without air
conditioning. Due to the comparison of the measurement results, the diagrams are
plotted between the number of measurement (time) and the deviations of each feature
in micrometer unit (µm).
Temperature has little effect on measurement features determined from only
polar profile. However, some features such as cylindricity and radial runout
deviations are not only determined from polar profile but also related to the
parallelism between the z and c axes. These features depend significantly on
temperature.
Three polar profiles at the specific heights are used to determine roundness and
cylindricity deviations. In figure 4-1, roundness deviations when measured in the
room with and without air conditioning are slightly different. Then roundness

42
deviations has little effect from temperature because this feature is only determined
from it polar profile.
FIGURE 4-1 Roundness and cylindricity deviations when the machine’s
compensation is activated off

43
While Cylindricity deviations measured in the room without air conditioning
fluctuate in wide range than others. Cylindricity deviations are determined from three
polar profiles at different height in z axis. Then this feature is affected by radial
direction in x-axis from each circles and axial direction in z-axis at different height of
measurements. Cylindricity is affected by temperature when the compensation is
activated off.
FIGURE 4-2 Roundness deviation including flick and runout deviations with the z
axis as datum when the machine’s compensation is activated off
Figure 4-2 shows roundness deviation including flick similar to roundness
deviations as shown in figure 4-1. The dispersions of this feature when measured in
the room with air conditioning are similar to the measurement results when measured
in the room without air conditioning.
In this study, radial runout deviation is determined from the same polar
measured profile as roundness deviation. The selected datum is the z axis of
measuring machine in order to observe the deformation of machine axes in relation to
time and temperature. Similar to cylindricity deviation, radial runout deviations with z
axis of the machine as datum has larger effect on measurement results in two different
air conditioning controlled room when the compensation is activated off.

44
FIGURE 4-3 Straightness deviations when the machine’s compensation is off
Figure 4-3 shows straightness deviations when measured in the room with and
without air conditioning. However straightness deviation is determined from it profile
only as roundness deviaition, straightness represent to temperature effects. These
features are not only determined from its profile but also related to the deformation of
machine column. Straightness deviation is determined from the linear profile that
measured at the side of the cylindrical standard workpiece. The formtester is turned
the workpiece into the specific angular position by rotary table. The probe is moved
along the workpiece in the z direction.
FIGURE 4-4 Parallelism and conicity deviations when the machine’s
compensation is activated off
Subsequently, parallelism and conicity deviations are determined from the same
linear measurement profiles as straightness deviations. Under evaluation method, linear
profile is determined itself in relation to the other lines that used to be reference
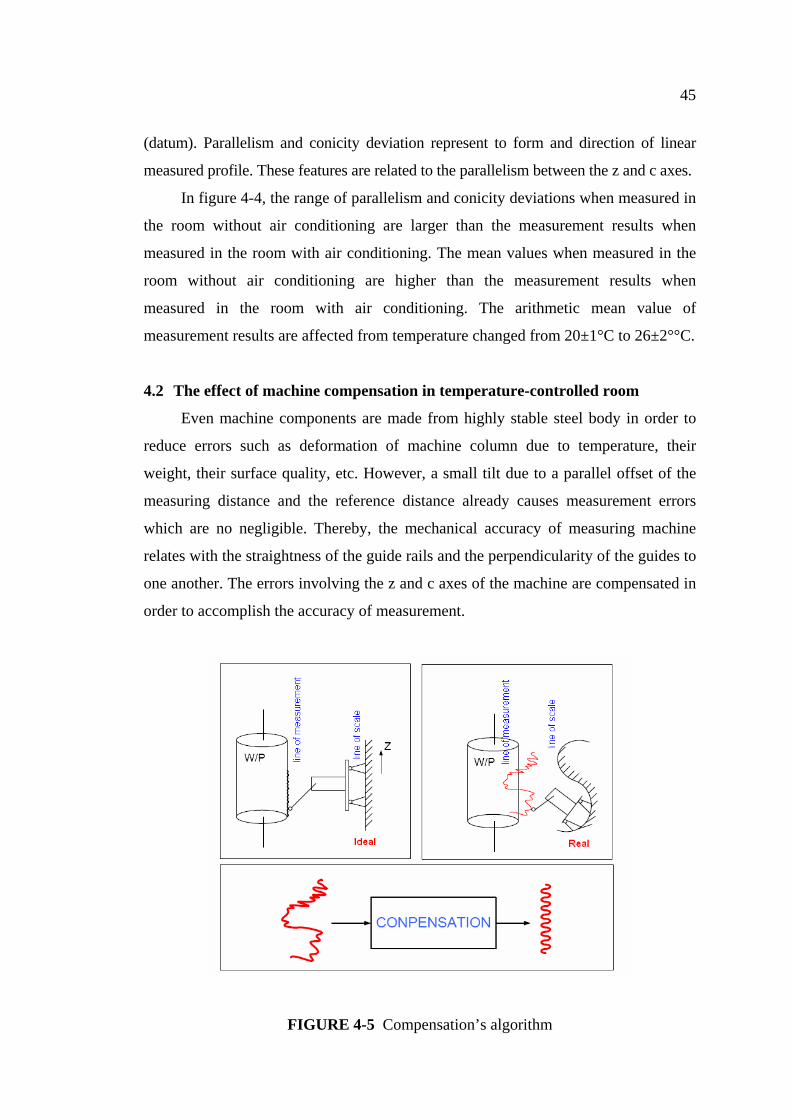
45
(datum). Parallelism and conicity deviation represent to form and direction of linear
measured profile. These features are related to the parallelism between the z and c axes.
In figure 4-4, the range of parallelism and conicity deviations when measured in
the room without air conditioning are larger than the measurement results when
measured in the room with air conditioning. The mean values when measured in the
room without air conditioning are higher than the measurement results when
measured in the room with air conditioning. The arithmetic mean value of
measurement results are affected from temperature changed from 20±1°C to 26±2°°C.
4.2 The effect of machine compensation in temperature-controlled room
Even machine components are made from highly stable steel body in order to
reduce errors such as deformation of machine column due to temperature, their
weight, their surface quality, etc. However, a small tilt due to a parallel offset of the
measuring distance and the reference distance already causes measurement errors
which are no negligible. Thereby, the mechanical accuracy of measuring machine
relates with the straightness of the guide rails and the perpendicularity of the guides to
one another. The errors involving the z and c axes of the machine are compensated in
order to accomplish the accuracy of measurement.
FIGURE 4-5 Compensation’s algorithm
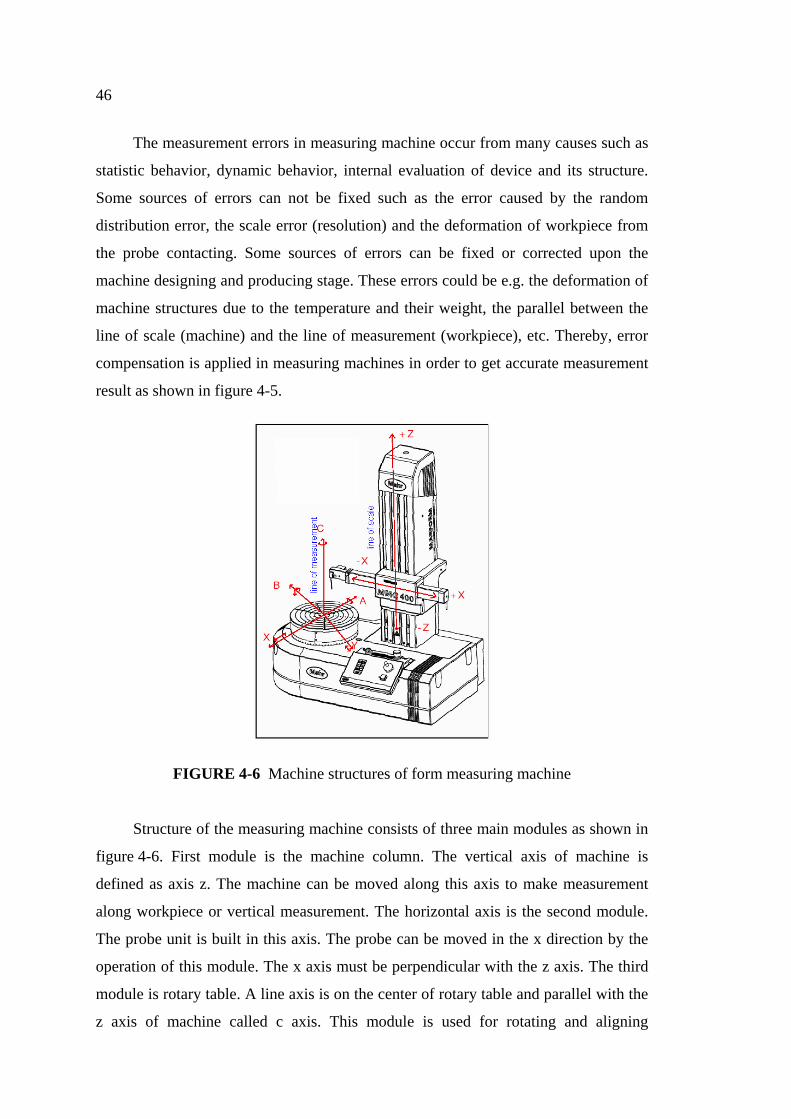
46
The measurement errors in measuring machine occur from many causes such as
statistic behavior, dynamic behavior, internal evaluation of device and its structure.
Some sources of errors can not be fixed such as the error caused by the random
distribution error, the scale error (resolution) and the deformation of workpiece from
the probe contacting. Some sources of errors can be fixed or corrected upon the
machine designing and producing stage. These errors could be e.g. the deformation of
machine structures due to the temperature and their weight, the parallel between the
line of scale (machine) and the line of measurement (workpiece), etc. Thereby, error
compensation is applied in measuring machines in order to get accurate measurement
result as shown in figure 4-5.
FIGURE 4-6 Machine structures of form measuring machine
Structure of the measuring machine consists of three main modules as shown in
figure 4-6. First module is the machine column. The vertical axis of machine is
defined as axis z. The machine can be moved along this axis to make measurement
along workpiece or vertical measurement. The horizontal axis is the second module.
The probe unit is built in this axis. The probe can be moved in the x direction by the
operation of this module. The x axis must be perpendicular with the z axis. The third
module is rotary table. A line axis is on the center of rotary table and parallel with the
z axis of machine called c axis. This module is used for rotating and aligning
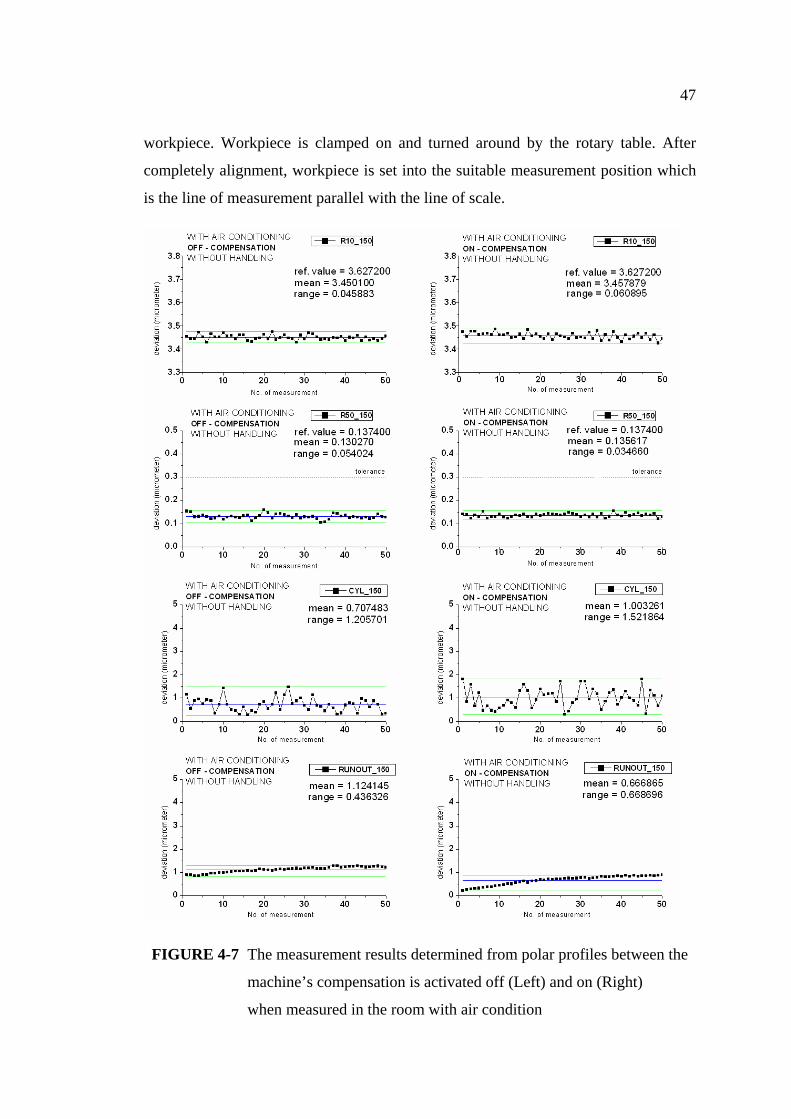
47
workpiece. Workpiece is clamped on and turned around by the rotary table. After
completely alignment, workpiece is set into the suitable measurement position which
is the line of measurement parallel with the line of scale.
FIGURE 4-7 The measurement results determined from polar profiles between the
machine’s compensation is activated off (Left) and on (Right)
when measured in the room with air condition

48
In this section, the measurement results when the machine’s compensation is
activated on and off are compared together. The left-hand side shows the
measurement results when the compensation is activated off. The right-hand side
shows the measurement results when the compensation is activated on. Both are
measured in the room with air conditioning.
When the machine’s compensation is activated on and off, roundness deviations
are similar as shown in figure 4-7. Then, roundness deviation has little effect on
compensation. Moreover mean value of these features when the machine is activated
on compensation are close to its reference value more than when the machine is
activated off compensation. Then results when the compensation is activated on are
more accurate than the results when the compensation is activated off.
Cylindricity and radial runout deviations when the machine’s compensation is
activated on are similar to the measurement results when the machine’s compensation
is activated off.
However, it can be noticed that cylindricity values are high value. The
fluctuation of cylindricity is in the big range when compare with the dispersion of
roundness. Cylindricity deviation is calculated relative to not only radial direction in
x-axis from each circles but also axial direction in z-axis at different height of
measurements. The mean value of cylindricity deviation under both condition are
between 0.7-1.0 µm. The technical official of roundness deviation is
0.02 µm+0.0005 µm. per mm of measurement height when using measurement
criteria LSC and filter 15 upr. These results have other influencing factors or some
errors occurred in that time of measurement. The details about how to get the precise
cylindricity deviation value are explained in section 4.6.
In figure 4-7, radial run out deviations with the z axis as datum have the off set
value at the beginning. It causes by the quality of alignment. The alignment is
complete when the parallelism between the c and z axes not exceeds the permissible
eccentricity value. When the machine’s compensation is off, the first radial runout
deviation is higher value than the result when the machine’s compensation id on.
Therefore, compensation has effect on features determined from polar profile
and related to the parallelism between the z and c axes such as cylindricity and radial
deviations.

49
FIGURE 4-8 The measurement results determined from linear profiles between
the machine’s compensation is activated off (Left) and on (Right)
when measured in the room with air condition
Figure 4-8 shows the measurement results in with air conditioning unit and the
measurement program continually repeating measurements without workpiece
handling after the first position alignment. Straightness deviations when the
machine’s compensation is on and off are slightly different. Then the compensation
has little effect on straightness deviation because straightness deviations are only
determined from its profile.
Subsequently, parallelism and conicity deviations are determined from the same
linear measurement profiles as straightness deviations. Under evaluation method,
linear profile is determined itself in relation to the other lines that used to be reference
(datum). Due to the relation of the parallelism between z and c axes, these features are
affected by the compensation and the temperature.

50
4.3 The effect of machine compensation in normal room temperature
The measurement results are compared between machine’s compensation is
activated on and off when measured in the room without air conditioning.
FIGURE 4-9 The measurement results determined from polar profiles between
the machine’s compensation is activated off (Left) and on (Right)
when measured in the room without air condition

51
The machine compensation has little effect on roundness when measured in the
room without air conditioning. As shown in figure 4-9, roundness deviations when the
machine’s compensation is activated on are similar to the measurement results when
the machine’s compensation is activated off.
In the room without air conditioning, cylindricity and radial runout deviations
are different when the machine’s compensation is activated between on and off. The
measurement temperature depends on date of measurement. Room’s temperature
when the machine is activated off is 26±2°C while room’s temperature when the
machine is activated on is 30±2°C. The difference of temperature affects to arithmetic
mean value of measurement results. Cylindricity and radial runout with z axis of the
machine as datum are not only affected by compensation but also temperature.
FIGURE 4-10 The measurement results determined from linear profiles between
the machine’s compensation is activated off (Left) and on (Right)
when measured in the room without air condition

52
The compensation has effect on features determined from linear profiles
especially parallelism and conicity deviations. In figure 4-10, straightness deviations
are quite similar when the compensation is activated between on and off. However,
straightness deviations when the machine’s compensation is off are more accurate
than the results when the machine’s compensation is on. The difference of arithmetic
mean value of these results depends on temperature and its changing. This graph
represent to the effect of temperature and compensation.
By conclusion of the measurement in the room without air conditioning unit,
features evaluated from linear profile such as straightness, parallelism and conicity
have compensation effect due to the relation of parallelism between the z and c axes
and represent to temperature effect also.
4.4 The effect of machine handling (center re-positioning) in temperature-
controlled room
In accordance with description of type-1 study (Cg study) [13], the standard or
master must be removed and replaced for each measurement and should not be
subject to changes over time. “Handling” refers to the workpiece handle before
starting the new measurement by moving position of rotation table. This condition is
created in order to observe drifts in measuring machine’s column during the
measurement. The handling condition is in relevant to the rotational c axis table and
the centering and tilting table.
FIGURE 4-11 Alignment concept
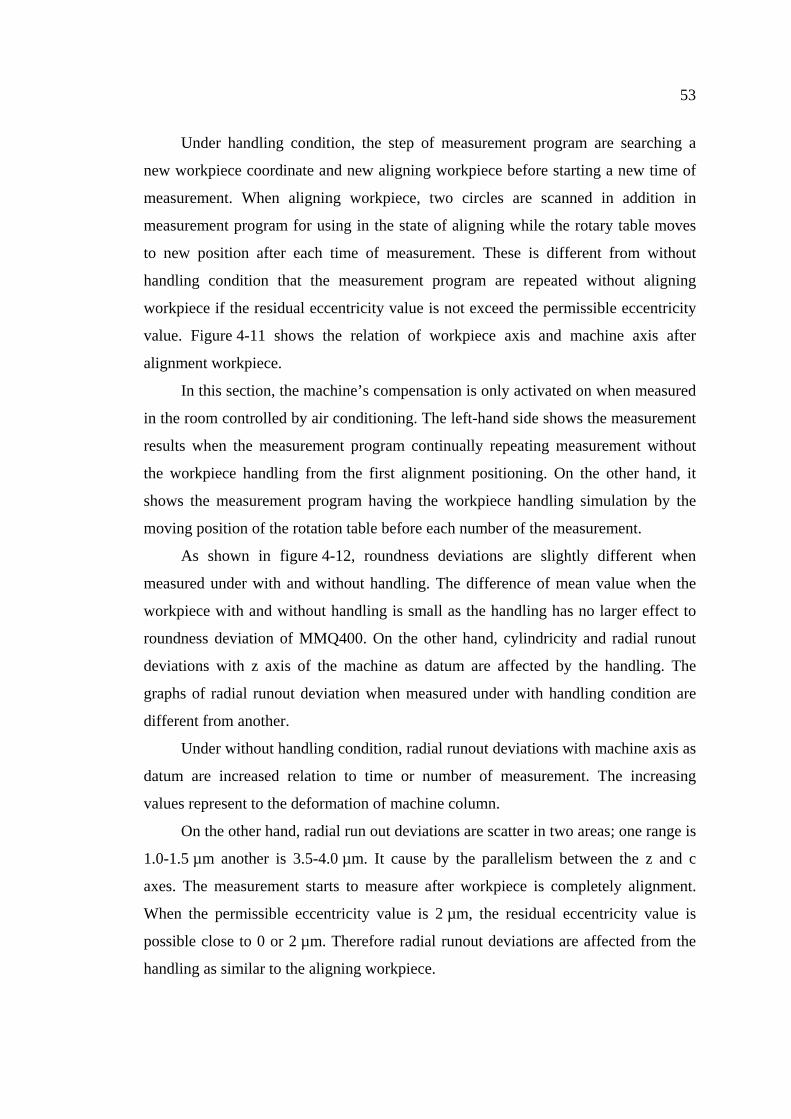
53
Under handling condition, the step of measurement program are searching a
new workpiece coordinate and new aligning workpiece before starting a new time of
measurement. When aligning workpiece, two circles are scanned in addition in
measurement program for using in the state of aligning while the rotary table moves
to new position after each time of measurement. These is different from without
handling condition that the measurement program are repeated without aligning
workpiece if the residual eccentricity value is not exceed the permissible eccentricity
value. Figure 4-11 shows the relation of workpiece axis and machine axis after
alignment workpiece.
In this section, the machine’s compensation is only activated on when measured
in the room controlled by air conditioning. The left-hand side shows the measurement
results when the measurement program continually repeating measurement without
the workpiece handling from the first alignment positioning. On the other hand, it
shows the measurement program having the workpiece handling simulation by the
moving position of the rotation table before each number of the measurement.
As shown in figure 4-12, roundness deviations are slightly different when
measured under with and without handling. The difference of mean value when the
workpiece with and without handling is small as the handling has no larger effect to
roundness deviation of MMQ400. On the other hand, cylindricity and radial runout
deviations with z axis of the machine as datum are affected by the handling. The
graphs of radial runout deviation when measured under with handling condition are
different from another.
Under without handling condition, radial runout deviations with machine axis as
datum are increased relation to time or number of measurement. The increasing
values represent to the deformation of machine column.
On the other hand, radial run out deviations are scatter in two areas; one range is
1.0-1.5 µm another is 3.5-4.0 µm. It cause by the parallelism between the z and c
axes. The measurement starts to measure after workpiece is completely alignment.
When the permissible eccentricity value is 2 µm, the residual eccentricity value is
possible close to 0 or 2 µm. Therefore radial runout deviations are affected from the
handling as similar to the aligning workpiece.

54
FIGURE 4-12 The measurement results determined from polar profiles between
with (Left) and without (Right) workpiece’s handling when
measured in the room with air condition

55
FIGURE 4-13 Radial runout deviation with z axis as datum (Left) and Permissible
eccentricity value (Right) when measured in the room with
air conditioning under condition on-compensation and with handling
Figure 4-13 shows the comparison between radial runout deviation and their
residual eccentricity value. The graph of radial runout deviation are similar to the
graph of residual eccentricity value however radial runout deviations is bigger than
residual eccentricity value in the way of offset value. Every residual eccentricity value
is less than 2.0 µm.
Additionally, the selected datum for determining radial run out depends on the
measurement objectives. The datum line can be crated by evaluating with machine
information (machine datum) or determining line from centre of each polar profiles-
substitute circle elements (workpiece datum). The c axis or z axis of the formtester
should be selected to be the reference element. Both machine axes give the same
tolerance value of radial runout. More details about radial runout deviation with
different datum axis are described in Appendix B.
Figure 4-14 shows straightness deviations at 0° and 180° when the workpiece
aligned only one time at the beginning of measurement similar to the results when the
workpiece aligned before every time of measurement. Then straightness deviation has
little effected on the handling.
In contrast with parallelism and conicity are evaluated from linear profiles and
determined in relative to the parallelism between the z and c axes. The measurement
results under conditions between with and without handling are different. These
features have effect on handling.

56
Parallelism and conicity deviations at 0° and 180° under with handling
condition are more accurate than when measured under without handling. The trend
line of parallelism deviations under without handling condition is increased due to the
deformation of machine column. On the other hand, parallelism and conicity
deviations are fluctuated in the range as straight line. The parallelism between the z
and c axes is adjusted by new workpiece’s alignment.
FIGURE 4-14 The measurement results determined from linear profiles between
with (Left) and without (Right) workpiece’s handling when
measured in the room with air condition
Additionally, the trend of conicity measurement is possible to increase in the
same way with parallelism deviation measurement results or decrease in the other
direction.
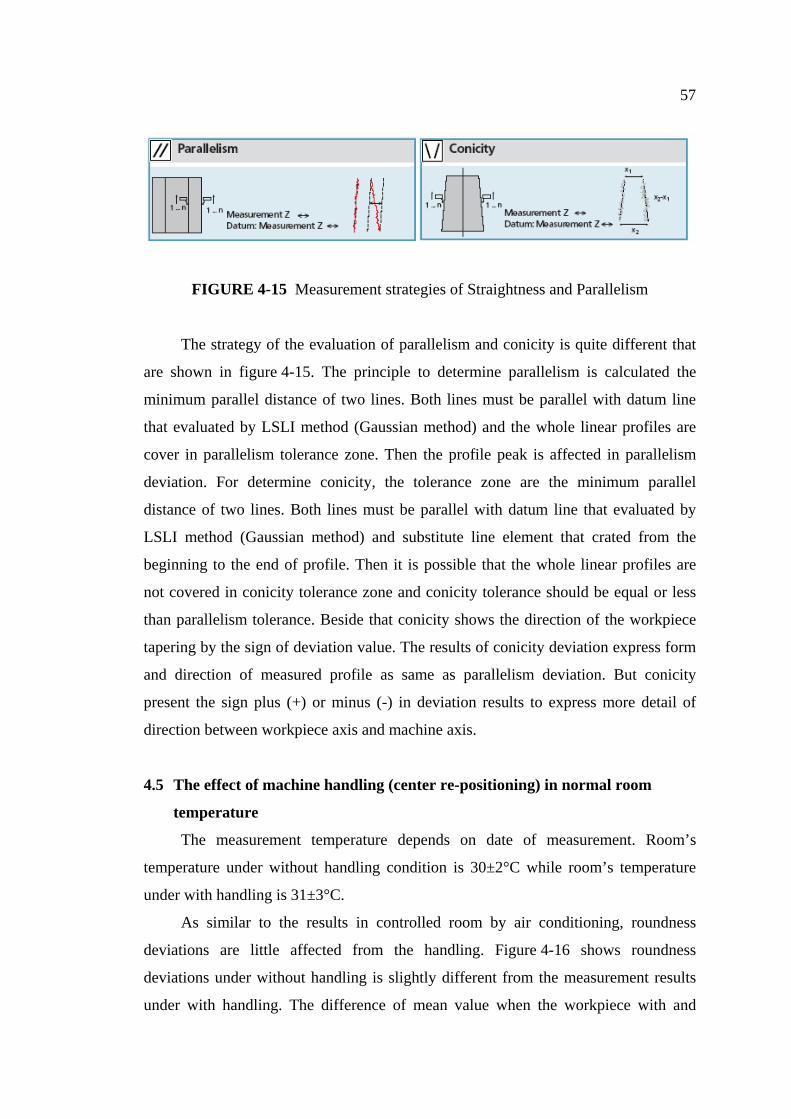
57
FIGURE 4-15 Measurement strategies of Straightness and Parallelism
The strategy of the evaluation of parallelism and conicity is quite different that
are shown in figure 4-15. The principle to determine parallelism is calculated the
minimum parallel distance of two lines. Both lines must be parallel with datum line
that evaluated by LSLI method (Gaussian method) and the whole linear profiles are
cover in parallelism tolerance zone. Then the profile peak is affected in parallelism
deviation. For determine conicity, the tolerance zone are the minimum parallel
distance of two lines. Both lines must be parallel with datum line that evaluated by
LSLI method (Gaussian method) and substitute line element that crated from the
beginning to the end of profile. Then it is possible that the whole linear profiles are
not covered in conicity tolerance zone and conicity tolerance should be equal or less
than parallelism tolerance. Beside that conicity shows the direction of the workpiece
tapering by the sign of deviation value. The results of conicity deviation express form
and direction of measured profile as same as parallelism deviation. But conicity
present the sign plus (+) or minus (-) in deviation results to express more detail of
direction between workpiece axis and machine axis.
4.5 The effect of machine handling (center re-positioning) in normal room
temperature
The measurement temperature depends on date of measurement. Room’s
temperature under without handling condition is 30±2°C while room’s temperature
under with handling is 31±3°C.
As similar to the results in controlled room by air conditioning, roundness
deviations are little affected from the handling. Figure 4-16 shows roundness
deviations under without handling is slightly different from the measurement results
under with handling. The difference of mean value when the workpiece with and

58
without handling is small as workpiece handling has no effect to roundness deviation
of MMQ400. Roundness deviation is only determined from its polar profile.
FIGURE 4-16 The measurement results determined from polar profiles between
with (Left) and without (Right) workpiece’s handling when
measured in the room without air condition

59
Cylindricity and radial runout deviations are determined not only its profile but
also the relation to the parallelism between c and z axis. However, it can be noticed
that cylindricity values are high value. As previous section, the fluctuation of
cylindricity is in the big range when compare with the dispersion of roundness. The
details about how to get the precise cylindricity deviation value are explained in
section 4.6.
Under without handling condition, radial runout deviations are increased due to
time. These results are continually values and represent to the deformation of machine
axes. The first value of radial runout deviation is high value at the beginning. The
increasing of radial runout depends on temperature and its changing. The fluctuation
of radial runout deviations under with handling is different from under without
handling condition.
FIGURE 4-17 The measurement results determined from linear profiles between
with (Left) and without (Right) workpiece’s handling when
measured in the room without air condition
60
On the hand, the step of measurement program are searching a new workpiece
coordinate and new aligning workpiece before starting a new time of measurement.
Then the parallelism between the z and c axes is new set after each time of alignment.
Radial runout deviations fluctuate as straightness line under with handling condition.
Therefore, cylindricity and radial runout with z axis of the machine as datum are not
only affected by compensation but also temperature.
Figure 4-17 shows form deviations evaluated from linear profiles when
measured in the room without air conditioning under conditions between without and
with handling. Straightness, parallelism and conicity when measured under with and
without handling condition are different.
Under with handling condition, straightness deviations are high values at the
beginning and have peak values during the measurement. These peak points cause by
the surrounding disturbances due to the protocol observation. The peak values of
straightness deviation have effect on parallelism and conicity deviations. Then it can
make conclusion that these features determined from linear profiles have effect of not
only handling but also temperature and environmental disturbance.
4.6 The effect of probe zeroize strategies
From the previous results, cylindricity values are high value. In the reason of
getting precise measurement results by reduction movement of machine axis, the
probe is set to zero before the starting position a bit and did not take off from the
workpiece during make three circles for evaluation cylindricity. The probe force error
and machine position error are neglected of the measurement result. In screening
experimental, the probe zeroize only one time is the probe is not take off from the
workpiece during the measurement. Probe force is adequate to keep the probe in
contact with the workpiece throughout the measurement. So that the expected results
of measurement after changing the method of measurement from zeroize the probe in
every profile to zeroize the probe only one time is improvement by reducing the
source of errors.
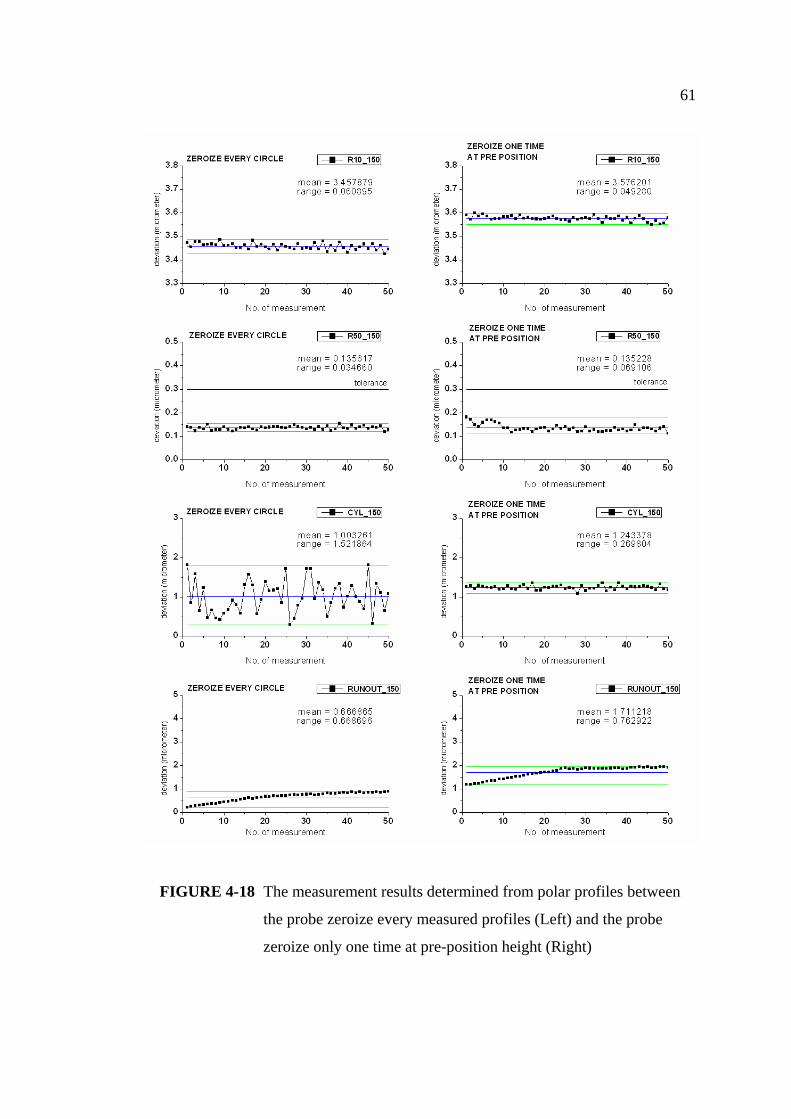
61
FIGURE 4-18 The measurement results determined from polar profiles between
the probe zeroize every measured profiles (Left) and the probe
zeroize only one time at pre-position height (Right)

62
In figured 4-18, cylindricity deviation when evaluated from polar profiles
getting from one time zeroize the probe is stable than results from zeroize the probe
every circles. The fluctuation of cylindricity deviations when evaluated from polar
profiles getting from one time zeroize the probe is in the narrow range than results
from zeroize the probe every circles. The range of cylindricity is better by the
reduction movement of machine as similar as reducing the probe force error and
machine position error.
When look at other features that evaluated from the same polar profile such as
roundness and radial run out, the first results are high value seemed that the
measurement is added off-set value at the beginning. That means, these measurement
present not only the effect probe zeroize strategies but also the error between the z
and c axes.
FIGURE 4-19 The measurement results determined from linear profiles between
the probe zeroize every measured profiles (Left) and the probe
zeroize only one time at pre-position height (Right)

63
As see also in figure 4-19, the range of straightness parallelism and conicity
deviations when zeroize the probe only one time are smaller than the results when
zeroize the probe every circles. Thereby, straightness parallelism and conicity
deviations are improved by changing the probe zeroize strategies.
Consequently, the zeroize probe is one significant factor to get the precise
measurement result. In comparison the zeroize method between zeroize the probe
only one time and zeroize the probe every circle, the spread of each feature is better
by changing the probe zeroize strategies. All feature are improved from changing the
probe zeroize method. The standard deviation of each feature when zeroize the probe
only one time is smaller than when zeroize the probe every circles. However, the
probe zeroize strategies have larger effect on the features related to the parallelism
between the z and c axes.
4.7 Summary
Conclusions drawn from measurement result analysis can be summarized as
follows:
4.7.1 Temperature has effect on the measurement results due to material
expansion property especially features evaluated from linear profiles such as
straightness, parallelism and conicity or features measured relative to the machine
column such as radial runout with z axis as datum.
4.7.2 The temperature affect can be reduced by measuring in the air-
conditioning controlled room. The formtester can be used in shop floor when
measuring features are determined form polar profile itself and not related to the
parallelism between the z and c axes such as roundness.
4.7.3 Features determined relative to the machine column is affected by
compensation and handling. They are determined not only from linear profile such as
parallelism and conicity but also from polar profile such as radial runout with z axis
as datum and cylindricity. Then compensation and handling has little effect on
roundness because it is only determined from polar profile.
4.7.4 As a result of this study, the measuring machine must be adjusted so that
the z axis is parallel to the c axis as the parallelism between the measured line and the
scale machine line. Even the small tilt between the two axes will cause measurement
errors.

64
4.7.5 The probe zeroize measurement method has influence on all measurement
features. Every time the probe touches the workpiece in order to make measurement,
errors take place. Therefore, errors can be reduced by minimizing the number of
movement points.

CHAPTER 5
MEASUREMENT SYSTEM ANALYSIS
The measurement results explained in chapter 4 are informed to calculate of a
capability index and its uncertainty. Mean value of each condition are compared
together to calculate a percentage of average increment in section 5.1. Section 5.2
describes about the uncertainty calculation. When calibrating and monitoring
measuring equipment, the measurement uncertainty must be specified in order to
characterize a range of measurement result relation to an estimated true value. Each
influence factors are determined to be individual uncertainty components. The
capability testing of the cylindrical standard workpiece has five individual uncertainty
components: repeated measurement, machine, measurement method, temperature and
workpiece.
In section 5.3, the capability indexes are explained relation to their measurement
results. The capability indexes of a reference condition are described to perform the
measuring machine’s characteristic. The difference in capability indexes results for
different conditions are described in order to perform the agreement of the capability
index result and their measurement result.
5.1 The percentage of the average increment
Each feature are calculated the average of mean value as shown in table 5-1.
The percentage of the average increment shown in table 5-2 can be calculated as follow.
| meani - meanref | x 100 Eq. 5-1
| meanref |
when
meani = mean value on the reference condition
meanref = mean value on the comparative condition
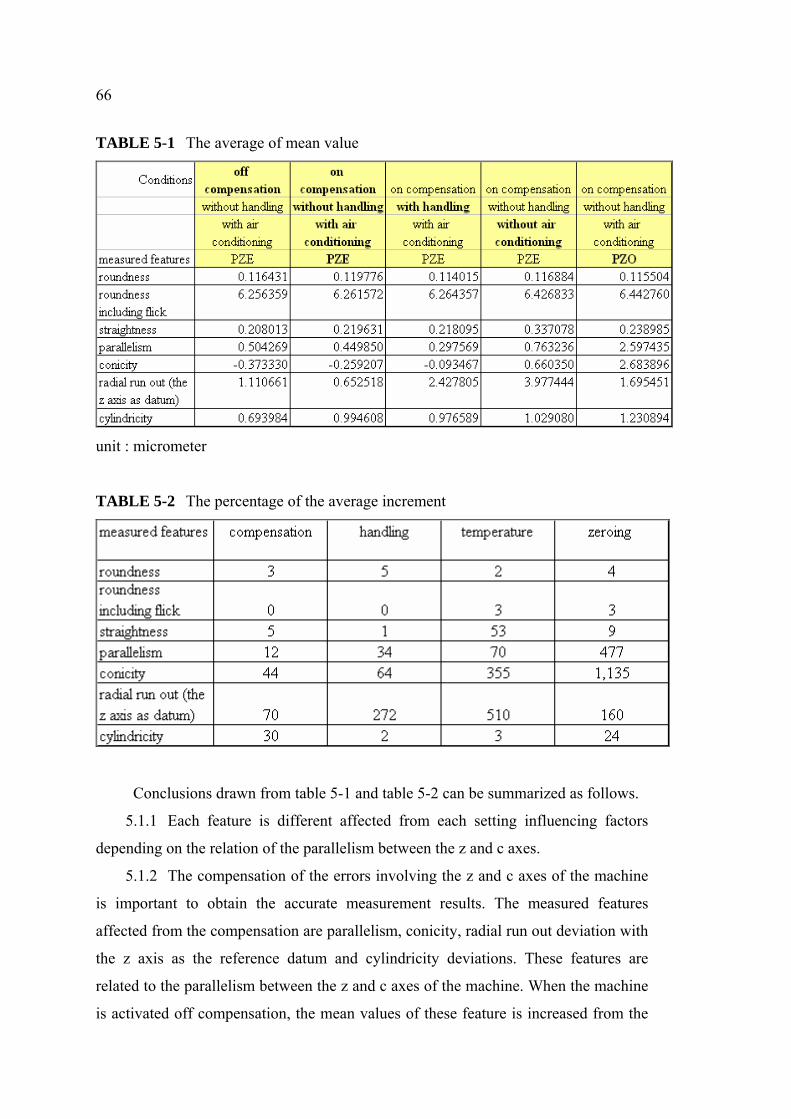
66
TABLE 5-1 The average of mean value
unit : micrometer
TABLE 5-2 The percentage of the average increment
Conclusions drawn from table 5-1 and table 5-2 can be summarized as follows.
5.1.1 Each feature is different affected from each setting influencing factors
depending on the relation of the parallelism between the z and c axes.
5.1.2 The compensation of the errors involving the z and c axes of the machine
is important to obtain the accurate measurement results. The measured features
affected from the compensation are parallelism, conicity, radial run out deviation with
the z axis as the reference datum and cylindricity deviations. These features are
related to the parallelism between the z and c axes of the machine. When the machine
is activated off compensation, the mean values of these feature is increased from the
67
reference mean value of the activated on compensation. The percentages of the
average increment are in between 12% to 70% depending on the relation of
measurement feature to the machine’s errors involving the z and c axes of the.
However, the compensation has little effect on roundness, roundness including
flick and straightness deviations. These features are only determined from its
measured profile.
5.1.3 The handling is more significant effect on three measurement results:
parallelism, conicity and radial run out with the z axis of the machine as datum. These
features are measured and calculated relation to the parallelism between the z and c
axes. The absolute percentages of the average increment are 34%, 64% and 272%
5.1.4 Temperature is primary effect on the four features: straightness,
parallelism, conicity and radial run out with the z axis of machine as datum.
Straightness, parallelism and conicity are sensitive to temperature due to their type of
measured profiles. The formtester scans linear profiles along the workpiece’s height
relation to the machine axis column. Due to the expansion property, the materials are
deformed as shown in these measurement results. On the other hand, run out deviation
with the z axis of machine as datum is determined from polar profile but related to the
the parallelism between the z and c axes.
When the temperature changes from 20±1°C to 28±2°C, the percentages of the
average increment are between 53% to 510% depend on the relation of the measured
feature to the errors involving the z and c axes of the machine.
5.1.5 In order to obtain the precision measurement result, the reduction errors by
reducing the movement of the machine is introduced. The probe contacting strategy is
changed from the probe set zero at every circle (PZE) to the probe set zero only one
time at the pre-position height (PZO).
When the measurement program changes the contacting method of probe from
PZE to PZO, every feature affect from the probe contacting strategy. The contacting
strategy of the probe combined to the other influencing factor make the percentage of
the average increment up to 1,000%.
5.1.6 Features determined from only one polar measured profile are smaller
sensitive to three setting conditions; the compensation, the handling and the
temperature. The percentages of the average increment are in between 0% to 5%.
These features are roundness and roundness including flick. The percentages of the

68
average increment of these features are less than 10% which is the repeatability of this
machine. Therefore, the compensation, the handling and the temperature has little
effect on roundness and roundness including flick.
5.1.7 Cylindricity and radial run out deviation with the z axis as datum are not
only determined from polar profiles but also evaluated relative to the parallelism
between the z and c axes. Therefore, radial run out deviation with the z axis of
machine as datum is more sensitive to the temperature than other setting conditions.
The second effect is the handling.
5.1.8 Features determined from linear profiles are more sensitive to the
temperature more than the compensation and the handling. As a result of this study,
straightness, parallelism and conicity deviations have higher effect on the temperature
condition than the compensation and the handling.
5.2 The uncertainty of measurement
According to the VIM 3.9 [3], uncertainty of measurement is “a parameter,
associated with the result of a measurement that characterizes the dispersion of the
values that could reasonably be attributed to the measurand”. Therefore, the
measurement results are used to analyze and evaluate the measurement uncertainty.
The range of a measurement result can be expressed in term of the measurement result
of a measurand with its uncertainty by a mathematical equation:
y - U ≤ Y ≤ y + U Eq. 5-2
when Y = the result of the measurement
y = the estimated measurement value
U = an expanded uncertainty
(the measurement uncertainty for a particular level of confidence)
The measurand is determined by the set of input qualities. The function relative
of the measurand with the input quantities is:
Y = f(X1, X2, X3, X4,..Xn) Eq. 5-3
when Y = the measurand (the quantity of interest)
X = the input quality
69
The measurement result dependence on the influence factors of measuring
uncertainty is described by the mathematic function model:
y = f(x1, x2, x3, x4,... xn ) Eq. 5-4
when y = the measurement result (the estimated value)
x = the influence factor in the measurement uncertainty evaluation
The measurement results has five main influencing factors; Man, Machine,
Method, Material and environment. The uncertainty of measurement result has effect
to these factors also. Corresponding to these reasons, the uncertainty components are
classified following these factors dependence on measurement conditions. In this
study, the relative between measurement results to influence factors is described by
the mathematic function:
y = f(x1, x2, x3, x4, x5) Eq. 5-5
when x1 is random (the effect from the repeated measurement)
x2 is machine (the effect from the machine)
x3 is method (the effect from the handling and the zeroing)
x4 is environment (the effect from the temperature)
x5 is material (the effect from the workpiece)
The effect from human is neglected for the reason that the measurements are
operated by only one person. The measurement is automatically repeated by setting
command in measurement program. The influence of operator is tested following the
capability testing procedure 2 and 3 of Bosch book 10 standards. This capability
testing is the procedure 1-the bias and repeatability.
Additionally, the uncertainties are divided into two types; type A and type B
standard uncertainties according to the GUM. The type-A standard uncertainty
evaluates the input quantities from repeated observations by calculating standard
uncertainty of the mean value. Whiles the type-B standard uncertainty evaluates input
quantities from a single observation or personal judgement based on experience. The
type-B standard uncertainty is calculated by calculating the estimated value that lies
within the boundaries with percentage of a confidence level. According to their
definition, the determining the uncertainty through repeated measurement is defined

70
as the type-A standard uncertainty. The effect of the repeated measurement, the
calibration, the temperature and the workpiece are classified into the type-A standard
uncertainty. The type-B standard uncertainty consists of the effect of the measurement
method that is combined from the effect of the handling and the zeroing.
5.2.1 The effect of the repeated measurement
The deformation of overall measuring machine is presented by their variation of
measurement result. To present the repeatability, the measurement result is calculated
in the assumption that the measurement result is a random variable for the same
conditions of the measurement. The standard deviation of repeated measurement is
calculated following the equation 5-6.
u1 = Sg Eq. 5-6
√n
when sg = the standard deviation of the observed values
n = the number of the observed values.
5.2.2 The effect of the machine
Every measuring machine has individual property and has many errors inside.
This measuring machine has three main parts; the machine structure, the probe system
and the software. The sources of error that relate to the mechanical structure are
identified and corrected since the machine design stage. For example, some of the
measuring machine elements, the base unit and the column, made from a highly stable
steel body in order to avoid the effect of the temperature with the structural. Even
though some errors can be identified and corrected, some can not and is calculated to be
the uncertainty of measurement. For example, the line of measurement (the workpiece)
must be in the same line of the scale (the machine) following the abbe’s rule. However
the guide and the measurement system can not align in the same line because of the
machine structure. Therefore, the calibration is performed in order to ensure the
straightness of the guide rails and the perpendicularity of the guides to one another.
The probe system is calibrated their sensitivity in order to inform their diameter,
length and direction of the probe arm. The probe signal and the probe force are also in
relative to the correction of the measurement result. However, the measurement result
is not affected with only the influence of the probe system. Therefore, the probe
71
system is not separated to be one factor in uncertainty calculation of this study. In
order to operate the measuring machine by the software, it is one main important part
of the machine. The software is tested their correction as the machine structure.
Corresponding to the combination of these three main parts, the variation of the
repeated measurement results are represented to the characteristic of the machine. The
standard uncertainty affected from the measuring machine is calculated by the
equation 5-7. This uncertainty component is calculated under the assumption that the
distribution of measurement result is normal distribution.
u2 = Sg Eq. 5-7
when sg = the standard deviation of the observed values
5.2.3 The effect of the handling and the zeroing
The measurement method is one influencing factor of the complete
measurement result following the cause and effect diagram of the production
metrology [4]. The repeatability of the measurement process is calculated the repeated
measurement result for the same conditions of the measurement. Therefore, the
differences of the measurement method represent to the effect of them to the
measurement result.
In accordance with the measurement conditions, the handling condition is set in
order to prove the centering and tilting table properties and the machine column
changing. The radial run out deviation with the z axis of the machine as datum is
added in the measurement program in order to observe the drift of the machine
column during the repeated measurement. As can be seen from the radial run out
deviation with the z axis of the machine as datum for the reference condition, the
machine column deforms in relative to the time. Additionally, the straightness, the
parallelism and the conicity deviations also show the effect of the handling.
On the other hand, the differences of the measurement method between zeroing
probes every profiles and the zeroing probe only one time at pre-position represent to
the zeroing effect to the measurement result. At the beginning, the different of the
probe zeroize method is the solution of the improvement the precise cylindricity
measurement result value. As can be seen from the measurement a result, every

72
measurement feature is affected by the probe zeroize method changing. The zeroing
effect to the form measurement result is described in section 4.6.
Due to their effect to the measurement result, the handling and the zeroing are
combined to be the one influence factor of the uncertainty calculation. The
measurement result values are assumed that the distribution of measurement result is
rectangular with 100% confidence level of the value when the uncertainty from the
method influencing factor is estimated.
With the uncertainty calculation from the handling effect, the boundary area of
the handling effect is 1.0 µm following the centering and tilting table machine
technical data. The measurement result effect from the parallel between the c and z
axes as a result of the handling effect. The parallel of the c and z axes depends on the
property of the centering and tilting table and the complete workpiece alignment.
According to the above reasons, the dispersion of the repeated measurement result
that effects from the handling effect is on the range of the centering and tilting table.
The tilting quality of the centering and tilting table is 10.0 µm per 1.0 m that equal to
1.0 µm per 100 mm.
With the uncertainty calculation from the zeroing effect, the boundary of
zeroing probe is set following the quality of the probe zeroize. The range of the probe
zeroize method is ±0.1 µm as a result of the positioning errors in the direction of x
and y axis when the machine searches the same position. Therefore, the boundary of
the zeroing effect is 0.2 µm. The more detail about the quality of the probe zeroize is
described in Appendix B. Equation 5-8 is used to calculate the standard uncertainty
affected from the handling and the zeroing according to these assumptions.
u3 = √ u231 + u2
32 Eq. 5-8
when u31 = the uncertainty component of the handling effect = 0.2 µm
√ 6
u32 = the uncertainty component of the zeroing effect = 1.0 µm
√ 6

73
TABLE 5-3 The relative between the machine component errors and the measured
features
Additionally, the relative between the machine component errors and the
easu
ir axes movements and
and the axis movement of machine of each feature.
The measured feature
roun
dnes
s
roun
dnes
s with
flic
k
radi
al ru
nout
with
m
achi
ne d
atum
radi
al ru
nout
with
w
orkp
iece
dat
um
cylin
dric
ity
stra
ight
ness
0°
stra
ight
ness
180
°
para
llelis
m
coni
city
measurement directionmeasurement in x-axis of machine x x x x x x x x xmeasurement in y-axis of machine measurement in z-axis of machine x x x x xmeasurement in c-axis of machine x x x x x x x xcalculation in relate with the reference x x x x
Source of errorsposition error in x-axis of x-axis x x x x x x x x xposition error in y-axis of x-axis x x x x x x x x xposition error in z-axis of x-axis x x x x x x x x xposition error in x-axis of y-axisposition error in y-axis of y-axisposition error in z-axis of y-axisposition error in x-axis of z-axis x x x x xposition error in y-axis of z-axis x x x x xposition error in z-axis of z-axis x x x x xangularity error in x-axis of x-axis x x x x xangularity error in y-axis of x-axis x x x x xangularity error in z-axis of x-axis x x x x xangularity error in x-axis of y-axisangularity error in y-axis of y-axisangularity error in z-axis of y-axisangularity error in x-axis of z-axis x x x x xangularity error in y-axis of z-axis x x x x xangularity error in z-axis of z-axis x x x x xperpendicularity between x-axis and y-axis x x x x xperpendicularity between y-axis and z-axis x x x x xperpendicularity between x-axis and z-axis x x x x x x x x x
m red features is shown in table 5-3. This table is used to analyze the dependence
of the related features and the handling and the zeroing effect.
The measured features are plotted in the relation with the
their evaluation method which is calculated with the reference datum. On the other
hand, the measuring machine has errors occurring at least 21 components of errors
when the machine is assumed to be a rigid body. These errors are the three positioning
errors and the three rotating errors for each axis adding with three squareness errors
between axes. These errors are plotted in relation of the form and tolerance principle
74
According to this table, the measured features, which are related to the
measurement in the c axis of the machine and are calculated with respect to the
perpendicular of the x and z axes. The probe zeroize expresses the
omb
ditioning is set to be the
ea he temperature effect. As can be expected, the
ation expresses the
5-9
w w M·ΔtM) Eq. 5-10
when L = the leng
α = Linear extension coefficient
reference datum, are calculated the uncertainty component of the handling effect.
Therefore, the four features are calculated with respect to the handling effect. These
four features are the radial run out deviation with the workpiece related datum, the
radial run out deviation with the z axis of the machine as datum, the parallelism and
the conicity.
On the other hand, the uncertainty component of the zeroing effect is calculated
following the
c ined errors of the x and z axes. These errors represent to the positioning, the
angularity and the perpendicular errors of the x and z axes.
5.2.4 The effect of the temperature
The measurement in the different rooms of air con
m surement conditions in order to study t
temperature effects to the measurement result due to the material expansion property.
The range of all repeated measurement results in the room with air conditioning is bigger
than the measurement results in the room without air conditioning.
The temperature standard uncertainty is calculated by the workpiece
deformation due to the temperature. The basic expansion equ
differential length caused by the temperature in term of the relation between the
length of measurement, the material linear extension coefficient and the differential
temperature. The variations of the measurement result are divided into the variation of
the workpiece and the variation of the measuring machine as the result of the different
material expansion property. The length variation of the workpiece and the length
variation of the measuring machine component are considered in a measurement
system due to the different material of them.
ΔL = L·α·Δt Eq.
ΔL = L·(α ·Δt - α
th of measurement
t = temperature

75
A er artial differentiatft p ion, the equation consists of four terms. Each term is
ece and the measuring machine have the same
mpe
sumption uΔtM = 0
effect of the temperature according to the
rgin of the temperature
thermal expansion of the cylindrical standard steel
u4 = L·√(uαw·Δtw)² + (uΔtw·αw)² + (uαM·ΔtM)² + (uΔtM·αM)² Eq. 5-11
when uα = Uncertainty of the linear extension coefficient
5.2.5 The effect of the workpiece
c of the workpiece direct effect to the
asu
owever, the quality of workpiece characteristic by itself depends on the
equally meaning as each sources of error. The standard uncertainty from temperature
effect is calculated by the equation 5-11 under the two assumptions.
The first assumption Δtw = ΔtM
The cylindrical standard workpi
te rature because the workpiece and the measuring machine put in the same air
conditioning room.
The second as
The measuring machine has no
technical data of this machine.
when uΔtw = ΔK / sqr(3)
ΔK = The error ma
αw = 12x10-6/K.
(the coefficient of
workpiece).
uΔt = Uncertainty of the temperature measurement
The property and characteristi
me rement result. According to the expansion material property, the workpiece
characteristic is changed in relative to the temperature. The variation of the workpiece
characteristic from the effect of the temperature is classified and calculated in section
5.2.4.
H
production and the controlling process. The reference value as the result of the
estimated true value of the workpiece characteristic is one parameter in the capability
study. The estimated true values of the workpiece characteristic obtain from the mean
repeated measurement value of the reference measuring machine (MFU100). As the
variation of the measurement result from the mean value is the measurement
76
accuracy, the variation of the repeated measurement of MFU100 from the mean is the
accuracy of the measurement result.
Therefore, the quality of the workpiece characteristic is represented by the
variation of the repeated measurement that is use to calculate the reference value of
the workpiece. As similar to the variation of the measurement result is represented to
the quality of the measurement process or the measurement machine.
The affected from the fixture and the fixing workpiece are neglected in this
study because the measurement results are not affected with only the fixture
influence. The effect of the workpiece and the clampling device are combined
together and are presented by the workpiece uncertainty component.
This uncertainty component is calculated under the assumption that the standard
deviation of the measurement result by the reference measuring machine is the
dispersion area of the workpiece characteristic. In addition, the measurement result
values of MFU100 are assumed that the measurement result distribution is uniform
with 100% confidence level of the value. Equation 5-12 is used to calculate the
workpiece uncertainty according to these assumptions.
U5 = Sg(reference value) Eq. 5-12
√3
when sg = the standard deviation of the repeated measurement by the
reference measuring machine.
5.2.6 The combined standard uncertainty
An estimated combined standard uncertainty is calculated by combining the
individual standard uncertainties together.
uc = √ u12 + u2
2 + u32 + u4
2 + u52 Eq. 5-13
5.2.7 The measurement result relative to the measurement uncertainty.
5.2.7.1 The method uncertainty is highest significant effect to the
combined uncertainty. The method uncertainty values are bigger than the other
individual uncertainty components. The method uncertainty is calculated by the
combined the effect of the workpiece handling with the probe zeroing method. These
effects are related to the parallelism between the z and c axes.

77
5.2.7.2 The variation of the workpiece causes by their property and their
characteristic. The variation due to their characteristic quality is identify and
calculated in the workpiece uncertainty component. Whiles the deformation of the
workpiece due to the temperature is identified and calculated to be the temperature
uncertainty components.
5.2.7.3 The machine uncertainty is expressed by the standard deviation
of the measuring machine. The workpiece uncertainty is expressed by the standard
deviation of the reference measuring machine. The workpiece uncertainty values are
smaller than the machine uncertainty values for all features when the measuring
machine is on activated compensation. These results prove the correction of the
calculation of the machine uncertainty and the workpiece uncertainty due to the
measurement principle and the objective of the workpiece calibration.
5.2.7.4 The workpiece uncertainty is least significant effect to the
combined uncertainty. The workpiece uncertainty values are smaller than the other
individual uncertainty components. As a result of using the standard workpiece to
perform the capability index, the variation of the standard workpiece is small.
5.2.7.5 When the measuring machine is activated on compensation, the
temperature uncertainty values are smaller than the repeated uncertainty values and
the machine uncertainty value for all features. These agree with the measurement
result in the room with air conditioning conclusion that the temperature is less
significant effect to the measurement result than other factors. The other factors are
the handling, the compensation and the parallelism between the z and c axes.
5.2.7.6 The correct and complete identification of the component of
uncertainty is more important than the classification of the type of uncertainty (type A
or B). Every individual uncertainty components are combined together as a result of
the combined standard uncertainty.
5.3 Capability index
The testing of the capability and the monitoring of the stability of measurement
processes are important in order to estimate the quality of the measurement process
and to modify the measurement results or the courses of error. According to the Bosch
book10 Capability of Measurement and Test Processes, the five procedures are
specified for investigating testing equipment. The purpose of these procedures is to

78
ensure that a measuring device is capable of measuring a quality characteristic at the
place of use with a sufficiently small variation of measured value.
In this study, the capability testing of a cylindrical standard workpiece is
performed on a formtester in order to test a machine axes property and to calculate the
sensitivity of the signal transmission chain. The results of this testing are used to
estimate the quality of the measuring machine and to modify the measurement
process. The changing characteristics of the measuring machine are evaluated and
guaranteed by the capability testing as a result of the calibration and the monitoring
process. Corresponding to the capability testing procedure 1, the capability of the
measurement process expresses the variation and the position of the measured value
in the tolerance zone of a characteristic. This measurement procedure, Bias and
Repeatability, is the precondition for implement of procedure 2 to 5.
The formtester is activated only on compensation status in the general case. The
measurement which the measuring machine is activated off compensation is set in
order to observe the different measurement results between the on and off
compensation. Therefore, the calculation of handling conditions are discussed and
analyzed in this section.
The variation of the measured values is small when using the standard
workpiece. However, the variation of the measured values is significant when using
the calibrated production workpiece. In this study, the workpiece is the cylindrical
standard workpiece. Even though the variation of the measured value of the standard
workpiece is small, the systematic deviation (bias) is proved in order to inform about
the measurement system.
The systematic deviation or bias of the measurement result is the difference
value between the mean of the repeated measurement result and the estimated true
value. The systematic deviation (bias) is proved by the relation to the standard
deviation of the measured value.
For n = 25 bias is significant if │ x – xm│ > 0.413·s
For n = 50 bias is significant if │ x – xm│ > 0.284·s
when x = the mean of the repeated measurement result.
xm = the estimated true value (the reference value)
s = the standard deviation of the repeated measurement result.
79
Due to its definition, the systematic deviation represents to the closeness
between the mean of the repeated measurement result ( x ) and the reference value
(xm) as the accuracy of the measurement. The bias is significant when the difference
between the mean of the repeated measurement result ( x ) and the reference value
(xm) is greater than the acceptance criteria. In other words, the repeated measurement
results are not more accurate due to the high value of the bias.
By the capability criteria approval, both conditions show that almost the
systematic deviations of the measured features have significant. Only R15_50 for the
ON compensation WITH handling condition is not significant bias. As a result of the
bias, the roundness at the lowest height is more accurate than other features. The
roundness deviation has effect of the measurement height due to the centering and
tilting property and the deformation of machine column.
For the reference condition, the bias is not significant at R15_50, R50_15,
R50_50, R50_150 and R85_500. Similar with the measurement result for Condition 3,
only the roundness deviations have no significant bias. The bias of the other measured
features is significant.
The numbers of insignificant bias for the both conditions are different due to the
different measurement steps. The results of Condition 3 are represented to the result
related to the deformation of the machine axes. On the other hand, the workpiece is a
new alignment before starting each time of measurement according to the handling
condition. By the alignment, the workpiece is moved to the new position. As a result
of the workpiece alignment, the numbers of insignificant measured feature for the
Condition 3 is more than for Condition 2 as the reference condition. As a result of the
influencing factor, the workpiece alignment effects to the accuracy of the
measurement result.
However, it can be noticed that the systematic deviation expresses only the
different value between the mean of the repeated measurement result ( x ) and the
reference value (xm) with respect to its standard deviation. When the workpiece
characteristic is small value as the roundness deviation of the cylinder standard
workpiece, the other influencing effect can not be identified by the acceptance of the
systematic deviation value. For example, the systematic deviation of R15_15 is not

80
significant whiles their measured profiles are affected by the environmental
disturbances from the first to the seventeenth of the number of measurement.
Next, the data of the repeated measurement is use to calculate the capability
index. The capability Indexes Cg and Cgk calculated from the equation 5-14 and 5-15.
The capability index calculations are summarized in table 5-4 together with the
significant approval of systematic deviation and the permissible range of the
measured value.
g
g s6T2.0C = Eq. 5-14
( )
∑
∑
=
=
=
−−
=
=
n
1ii
2n
1igig
Xn1X
XX1n
1s
Tolerance T Where
g
mg
gk s3
XXT1.0C
−−= Eq. 5-15
(master) workpiecestandard of valueTrueX
value)(absolute X and Xbetween differenceXX Where
m
mgmg
=
=−
TABLE 5-4 The summary table of the significant approval of bias, the capability
index calculations and the permissible range of the measured value
Measurement condition
Acceptance criteria
Condition 2
on activated compensation
without the handling
Condition 3
on activated compensation
with the handling
The approval of the
significant of the systematic
deviation following the
capability criteria.
(│ x – xm│ > 0.284·s )
The systematic deviation is
not significant in only 5
measured features;
R15_15, R50_15, R50_50,
R50_150 and R85_500.
The systematic deviation is
not significant in R15_50
only.
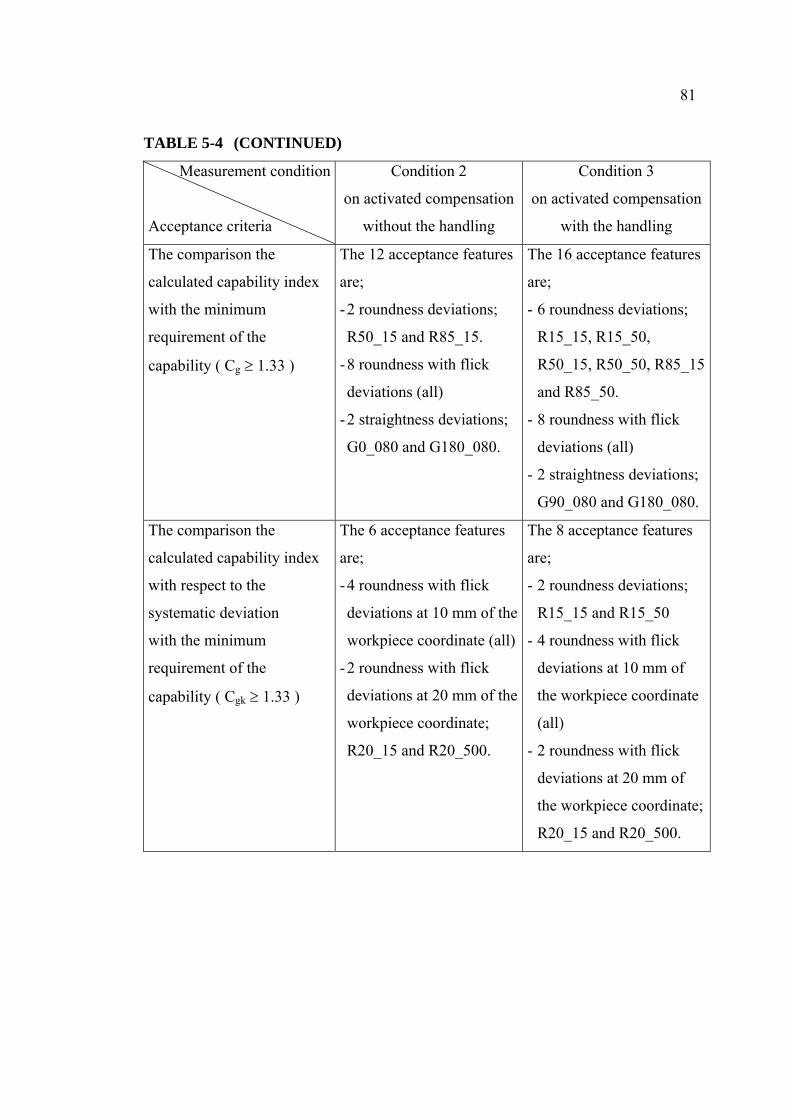
81
TABLE 5-4 (CONTINUED)
Measurement condition
Acceptance criteria
Condition 2
on activated compensation
without the handling
Condition 3
on activated compensation
with the handling
The comparison the
calculated capability index
with the minimum
requirement of the
capability ( Cg ≥ 1.33 )
The 12 acceptance features
are;
- 2 roundness deviations;
R50_15 and R85_15.
- 8 roundness with flick
deviations (all)
- 2 straightness deviations;
G0_080 and G180_080.
The 16 acceptance features
are;
- 6 roundness deviations;
R15_15, R15_50,
R50_15, R50_50, R85_15
and R85_50.
- 8 roundness with flick
deviations (all)
- 2 straightness deviations;
G90_080 and G180_080.
The comparison the
calculated capability index
with respect to the
systematic deviation
with the minimum
requirement of the
capability ( Cgk ≥ 1.33 )
The 6 acceptance features
are;
- 4 roundness with flick
deviations at 10 mm of the
workpiece coordinate (all)
- 2 roundness with flick
deviations at 20 mm of the
workpiece coordinate;
R20_15 and R20_500.
The 8 acceptance features
are;
- 2 roundness deviations;
R15_15 and R15_50
- 4 roundness with flick
deviations at 10 mm of
the workpiece coordinate
(all)
- 2 roundness with flick
deviations at 20 mm of
the workpiece coordinate;
R20_15 and R20_500.

82
TABLE 5-4 (CONTINUED)
Measurement condition
Acceptance criteria
Condition 2
on activated compensation
without the handling
Condition 3
on activated compensation
with the handling
The comparison between
their mean with their
combined uncertainty
(L_tol < mean±U < U_tol )
when
L_tol = Lower tolerance
U_tol = Upper tolerance
U = the combined uncertainty
The 33 measured features
are accepted according to
this criteria excluding
R10_15,
R20_15, and
P0_180_080.
The 34 measured features
are accepted according to
this criteria excluding
R10_15 and R20_15.
Remarkable from the
measurement result
- The polar measured
profile at 15 mm of the
workpiece coordinate
(R15) has environmental
disturbances at the
beginning of the repeated
measurement.
- The linear measured
profiles at C=90° and
C=180° have a
environmental disturbance.
Conclusions drawn from the analysis of the measurement result and capability
index can be summarized as follows:
5.3.1 The measuring machine must be adjusted the properties of the z and c axes
as the parallel offset of the measured line and the scale machine line in order to obtain
the accurate measurement result.. With the parallel offset of the measuring distance
and the reference distance, the small tilt already causes the measurement errors. The
acceptance measured results by the criteria of the capability testing and the
measurement uncertainty calculation show the problem of the measurement machine
in relative with the parallel of the z and the c axes.

83
5.3.2 The systematic deviation (bias) can be proved by the relation with the
standard deviation of the measurement value following the Bosch Book 10 standard.
The significant of the systematic deviation (bias) represent to the dispersion of the
measurement result with respect to the reference value as the accuracy of the
measurement. However it can not used to verify the source of errors. For example, the
measurement result R15_15 for the reference condition is not significant following
the systematic deviation criteria. However, the repeated measurement result of this
feature has the peaks at the beginning.
5.3.3 The tolerance factor and the sigma factor are significant factors in the
capability calculation as the correlative between the process and the measuring
machine. These factors effect to the tolerance zone. The suitable of these factors is
more important due to analyze the cause and effect of the measurement result by the
capability index results. The capability index can present the major unacceptable
results when using the suitable the correlative factors.
5.3.4 The problem of the measuring machine can be represented by the
comparison of the permissible range for the measured result with its tolerance. The
permissible range for the measured values is expressed by its estimated measurement
value (mean) and its combined uncertainty. The acceptance measured feature
following these criteria agrees with the measurement results.
The correction of the permissible range for the measured values depends on the
correction of the calculated measurement uncertainty. The measurement uncertainty is
importance influencing effect to the measurement result. Every measurement result
respects to the measurement uncertainty as same as the errors.
5.3.5 The number of the acceptance measured features due to Cg calculation is
more than due to Cgk calculation. The capability index (Cg) is calculated by the
relative of the process and the measuring machine. The capability index (Cgk) is
calculated by the relative of the process and the measuring machine and it systematic
deviation. The different of the acceptance measured feature between Cg and Cgk can
be used to observe the effect of the reference value as a result of the significant of the
systematic deviation.
5.3.6 The most of the acceptance measured feature is determined from the polar
measurement. A few of the straightness deviation is acceptable by Cg according to the
effect on linear measurement. These measurement results represent to the major

84
problem of the measuring machine in the stage of the study relating to it z axis. The
out off tolerance of the measured features can be represented to the cause and effect
of the measurement result. The parallelism deviation (P0_180) is out off its tolerance
as a result of the incomplete parallel between the z and c axes.
5.3.7 The unacceptance measured feature by the capability testing is not
presented only the problem of the machine characteristic but also the unsuitable of the
calculation factors and the effect of the other influencing. The influencing factors that
relates to the capability calculation are the setting tolerance of each measured feature
and the capability index factors. The other influencing factors to the measurement
system are the environmental disturbances, the measurement method, the workpiece,
etc.
Corresponding to these results, the major problems can be represented by
unacceptance features of the capability testing as the measurement result discussion
and the result of measurement uncertainty.

CHAPTER 6
CONCLUSIONS
The purpose of this thesis is to study the effects of compensation on a form
measuring machine. The mechanical accuracy of the measuring machine relates with
the straightness of the guide rails and the perpendicularity of the guides to one
another. The errors involving the z and c axes of the machine are compensated in
order to accomplish the accuracy of the measurement.
Capability testing of the cylindrical standard workpiece is used for ensuring the
performance of the formtester in a normal case and testing the functionality of the
machine compensation in this study. The capability testing is compiled with the
Bosch book 10 standard about Capability of Measurement and Test processes [2].
Three parameters are investigated: the error compensation, the workpiece handling
and the temperature. Measurements are made in two rooms differentiated by the
presence of air conditioning.
In the general state, the measuring machine is necessary to activate on
compensation. By compensation, the errors in the z and c axes are corrected into
every measurement results. When the machine is activated off compensation, the
mean values are increased from their reference mean value between 0% and 70%
depending on the relation of the measured features to the deformation of the machine
column. Therefore, the complete and sufficient of the machine’s compensation has a
direct effect on accurate measurement. However, the compensation is not the highest
effect for the accuracy of measurement results in this study.
Temperature is the primary effect to features determined from both the linear
profile such as straightness, parallelism and conicity and the polar profile such as
radial runout with the machine axis as datum. These features relate to the errors
involving the z and c axes of the machine. When the temperature changes from
20±1°C to 30±2°C, the percentages of the average increment of these four features are
in between 53% to 510%. Due to the temperature effect, the measurement in the room
with the air conditioning is recommended especially to measure features relative to
the parallelism between the z and c axes.
86
The handling condition is designed to observe the drift of the machine column
during the measurement. Increasing of radial runout deviation with the z axis of
machine as datum can represent the deformation of the machine column. On the other
hand, the handling is related to the property of centering and tilting table as an effect
of workpiece alignment. The efficiency of workpiece alignment affects the accuracy
measurement results as an effect from the parallelism between the z and c axes.
Only one feature is smaller sensitive to three setting conditions: the
compensation, the handling and the temperature. The percentages of the average
increment of roundness deviations are in between 0% to 5% and less than 10% which
is the repeatability of this machine. Roundness deviations are determined from only
the polar profile. Consequently, this formtester can be used on the shop floor when
measuring features are determined from the polar profile itself and not related to the
parallelism between the z and c axes, such as roundness.
The changing contacting strategy of the probe from the probe set zero at every
measured profile to the probe set zero only one time at pre-position height is
introduced in order to obtain a precise value of form measurement results. The probe
zeroize method is has influence on all features. Every time the probe touches the
workpiece in order to make a measurement, errors take place. Therefore, errors can be
reduced by minimizing the number of movement points. The mean values of the
measured features are decreased between 3% and 80% from the reference mean value
depending on the number of probe contacting. However, the probe zeroize strategies
have a larger effect on the features related to the parallel between the z and c axes.
As a result of this study, the accuracy of the measurement results is affected
from not only the three setting parameters, but also the contacting strategy of the
probe. The sensitivity of the measured feature with respect to each condition depends
on the relation of the measured features to the machine axis involving its
measurement.
Additionally, the setting tolerance and the capability index factors are
significant in order to analyze the capability index result and investigate the high
priority of problems related to the measurement process. With an insufficient setting
tolerance and unsuitable capability index factors, the high priority of the problem is
not executed, because the measurement process has many influence factors.
Accordingly, it is necessary to study and determined the uncertainty of the

87
measurement during the capability testing in order to not only perform and guarantee
the reliability of the measurement result, but also to inform of significant errors of the
measuring machine.
The data and the result of the capability testing can be used not only to perform
the main effects for improving the accurate measurement, but also to calculate the
measurement uncertainty for ensuring the reliability of the measurement result. The
ISO-Guide for the Expression of Uncertainty in Measurement [1] is used to be a
guideline for the estimation of the measurement uncertainty. The error sources of the
uncertainty measurement are classified into main five influence factors: random,
machine, method, environment and material. These individual uncertainty
components are combined together to be the combined uncertainty in order to identify
a permissible range of the measurement result. By the interpretation of each
calculated uncertainty component with respect to the measurement results, the
calculated uncertainties agree with the measurement results discussion. Therefore, the
measurement results, the results of the capability testing and the measurement
uncertainty are discussed together to perform the characteristics of the machine.
In conclusion, the error compensation algorithm is important and useful. The
machine compensation is a significant effect to the measurement results. However,
the compensation is not the only technique and method that is affected to the correct
and accurate measurement results. In terms of the precision measurement, the high
precision measuring machine is not only obtains precise measurement results, but also
effects the sensitivity of the parameters related in the measurement. In order to get the
complete and correct measurement results, the measurement process must be
controlled or the influencing factors must be reduced. The understanding in the
performance of the measuring machine, the machine characteristics, the measurement
uncertainty, the measurement process and their errors to control and reduce the
uncertainty and errors in the measurement is more important when using the high
precision measuring machine.
REFERENCES
1. International Organization of Standardization. Guide to the Expression of
Uncertainty in Measurement. 1st ed. Geneva : International Organization
of Standardization, 1993.
2. Robert Bosch GmbH. Quality Management in the Bosch Group. Technical
Statistics. No.10. 1st ed. [n.p.], 2003.
3. International Organization of Standardization. International Vocabulary of
Basic and General Terms in Metrology. 2nd ed. Geneva : International
Organization of Standardization, 1993.
4. Tilo Pfeifer. Production Metrology. Műnchen : Oldenbourg, 2002.
5. Department of Defense. Military Standard Gage Inspection MIL-STD-120.
Washington DC : United states government printing office, 1963.
6. Takamasu, K. Furutani, R. and Ozono, S. “Basic concept of feature-based
metrology.” Measurement. 26(3), (1999) : 151-156.
7. Liu, Q. Zhang, C. and Wang, H. P. Ben. “On the effects of CMM measurement
error on form tolerance estimation.” Measurement. 30(1), (1999) : 33-47.
8. R.G. Wilhelm, R. Hocken and H. Schwenke. “Task Specific Uncertainty in
Coordinate Measurement.” CIRP Annals - Manufacturing Technology.
50(2), (2001) : 553-563.
9. Yau, Hong-Tzong. “Uncertainty analysis in geometric best fit.” International
Journal of Machine Tools & Manufacture. 38(10), (1988) : 1323-1342.
10. Yau, Hong-Tzong. “Evaluation and uncertainty analysis of vectorial tolerances.”
Precision Engineering. 20(2), (1997) : 123-l37.
11. Trapet, E. and Waldele, F. “The Virtual CMM Concept, In Advanced
Mathematical Tools in Metrology II.” World Scientific. 40 (1996) : 238-247.
12. Salsbury, J.G. “A Simplified Methodology for the Uncertainty Analysis of CMM
Measurements.” Society of Manufacturing Engineers. (1995). cited in
R.G. Wilhelm, R. Hocken, H. Schwenke. “Task Specific Uncertainty in
Coordinate Measurement.” CIRP Annals - Manufacturing Technology.
50(2), (2001) : 553-563.
90
13. Dietrich, Schulze. Guidelines for the evaluation of Measurement Systems and
Processes, Acceptance of Production Facilities. Munich : Hanser
Publishers, 1998.
14. Paul J. Drake, Jr. Dimensioning and Tolerancing Handbook. New York :
McGraw-Hill, 1999.
15. Mahr GmbH. Mahr Information; Presentation and Catalog. GÖttingen : Mahr
GmbH, 2004.
16. Testo Inc. Temperature Measurement Engineering. [online] 2006. [cited 12
November 2006]. Available from : URL : http://www.testo.com
17. Philpott, Fred. The Pt100 Sensor. [online] 2006. [cited 12 November 2006].
Available from : URL : http://www.iqinstruments.com/temperatue/pt100
18. Thalmann, R. “Intercomparison of parallelism measurements.” Measurement.
17(1), (1996) : 17-27.
19. Mahr Academy. Level 3 Training Length metrology Part 1. GÖttingen : Mahr
GmbH, 2004.

APPENDIX A
DEFINITION OF TERMS
92
A.1 Measurement Definition and Terms
All definition and Terms refer to the International Vocabulary of Basic and
General Terms in Metrology (VIM) [3]. The Terms present following the sequent of
Alphabet letter. Each term express with a reference index. The reference index is
“VIM (x.y)” where: x is the number of chapter in VIM and y is the number of
definition and terms in each chapter.
The chapter of all definition and Terms in Metrology are classified into six
chapters;
A.1.1 QUANTITIES AND UNITS
A.1.2 MEASUREMENTS
A.1.3 MEASUREMENT RESULTS
A.1.4 MEASURING INSTRUMENTS
Many different terms are employed to describe the artefacts which are used in
measurement. This Vocabulary defines only a selection of preferred terms; the
following list is more complete and is arranged in an approximate order of increasing
complexity. These terms are not mutually exclusive.
A.1.4.1 element
A.1.4.2 component
A.1.4.3 part
A.1.4.4 measuring transducer
A.1.4.5 measuring device
A.1.4.6 reference material
A.1.4.7 material measure
A.1.4.8 measuring instrument
A.1.4.9 apparatus
A.1.4.10 equipment
A.1.4.11 measuring chain
A.1.4.12 measuring system
A.1.4.13 measuring installation
A.1.5 CHARACTERISTICS OF MEASURING INSTRUMENTS
Some of the terms used to describe the characteristics of a measuring instrument
are equally applicable to a measuring device, a measuring transducer or a measuring
93
system and by analogy may also be applied to a material measure or a reference
material.
The input signal to a measuring system may be called the stimulus; the output
signal may be called the response.
In this chapter, the term "measurand" means the quantity that is applied to a
measuring instrument.
A.1.6 MEASUREMENT STANDARDS, ETALONS
In science and technology, the English word "standard" is used with two
different meanings: as a widely adopted written technical standard, specification,
technical recommendation or similar document (in French "norme") and also as a
measurement standard (in French "étalon"). This Vocabulary is concerned solely with
the second meaning and the qualifier measurement" is generally omitted for brevity.
accuracy of a measuring instrument (VIM 5.18)
ability of a measuring instrument to give responses close to a true value
NOTE "Accuracy" is a qualitative concept.
accuracy of measurement (VIM 3.5)
closeness of the agreement between the result of a measurement and a true value
of the measurand
NOTES
1. "Accuracy" is a qualitative concept.
2. The term precision should not be used for "accuracy".
bias (of a measuring instrument) (VIM 5.25)
systematic error of the indication of a measuring instrument
NOTE The bias of a measuring instrument is normally estimated by averaging
the error of indication over an appropriate number of repeated measurements.
calibration (VIM 6.11)
set of operations that establish, under specified conditions, the relationship
between values of quantities indicated by a measuring instrument or measuring
system, or values represented by a material measure or a reference material, and the
corresponding values realized by standards

94
NOTES
1. The result of a calibration permits either the assignment of values of
measurands to the indications or the determination of corrections with respect to
indications.
2. A calibration may also determine other metrological properties such as the
effect of influence quantities.
3. The result of a calibration may be recorded in a document, sometimes called
a calibration certificate or a calibration report.
corrected result (VIM 3.4)
result of a measurement after correction for systematic error
correction (VIM 3.15)
value added algebraically to the uncorrected result of a measurement to
compensate for systematic error
NOTES
1. The correction is equal to the negative of the estimated systematic error.
2. Since the systematic error cannot be known perfectly, the compensation
cannot be complete.
correction factor (VIM 3.16)
numerical factor by which the uncorrected result of a measurement is multiplied
to compensate for systematic error
NOTE Since the systematic error cannot be known perfectly, the compensation
cannot be complete.
datum error (of a measuring instrument) (VIM 5.22)
error of a measuring instrument at a specified indication or a specified value of
the measurand, chosen for checking the instrument
deviation (VIM 3.11)
value minus its reference value
drift (VIM 5.16)
characteristic slow change of a metrological of a measuring instrument
error (of measurement) (VIM 3.10)
result of a measurement minus a true value of the measurand
95
NOTES
1. Since a true value cannot be determined, in practice a conventional true
value is used (see 1. 1 9 and 1.20).
2. When it is necessary to distinguish "error" from "relative error", the former
is sometimes called absolute error of measurement. This should not be confused with
absolute value of error, which is the modulus of the error.
experimental standard deviation (VIM 3.8)
for a series of n measurements of the same measurand, the quantity s
characterizing the dispersion of the results and given by the formula:
s = [∑ (xi-x) 2/ (n-1)] 1/2
xi being the result of the i-th measurement and x being the arithmetic mean of
the n results considered
NOTES
1. Considering the series of n values as a sample of a distribution, x is an
unbiased estimate of the mean m, and s2 is an unbiased estimate of the variance s, of
that distribution.
2. The expression s/√n is an estimate of the standard deviation of the
distribution of x and is called the experimental standard deviation of the mean.
3. Experimental standard deviation of the mean is sometimes incorrectly called
standard error of the mean.
fiducial error (of a measuring instrument) (VIM 5.28)
error of a measuring instrument divided by a value specified for the instrument
NOTE The specified value is generally called the fiducial value, and may be, for
example, the span or the upper limit of the nominal range of the measuring
instrument.
influence quantity (VIM 2.7)
quantity that is not the measurand but that affects the result of the measurement
EXAMPLES
a) temperature of a micrometer used to measure length;
b) frequency in the measurement of the amplitude of an alternating electric
potential difference;
c) bilirubin concentration in the measurement of haemoglobin concentration in
a sample of human blood plasma.

96
international (measurement) standard (VIM 6.2)
standard recognized by an international agreement to serve internationally as the
basis for assigning values to other standards of the quantity concerned
intrinsic error (of a measuring instrument) (VIM 5.24)
error of a measuring instrument, determined under reference conditions
limiting conditions (VIM 5.6)
extreme conditions that a measuring instrument is required to withstand without
damage, and without degradation of specified metrological characteristics when it is
subsequently operated under its rated operating conditions
NOTES
1. The limiting conditions for storage, transport and operation may be different.
2. The limiting conditions may include limiting values of the measurand and of
the influence quantities.
maximum permissible errors (of a measuring instrument) (VIM 5.21)
limits of permissible error (of a measuring instrument)
extreme values of an error permitted by specifications, regulations, etc. for a
given measuring instrument
measurand (VIM 2.6)
particular quantity subject to measurement
EXAMPLE vapour pressure of a given sample of water at 20 °C.
NOTE The specification of a measurand may require statements about
quantities such as time, temperature and pressure.
measuring instrument (VIM 4.1)
device intended to be used to make measurements, alone or in conjunction with
supplementary device(s)
measuring system (VIM 4.5)
complete set of measuring instruments and other equipment assembled to carry
out specified measurements
EXAMPLES
apparatus for measuring the conductivity of semiconductor materials;
apparatus for the calibration of clinical thermometers.

97
NOTES
1. The system may include material measures and chemical reagents.
2. A measuring system that is permanently installed is called a measuring
installation.
measurement procedure (VIM 2.5)
set of operations, described specifically, used in the performance of particular
measurements according to a given method
NOTE A measurement procedure is usually recorded in a document that is
sometimes itself called a "measurement procedure" (or a measurement method) and is
usually in sufficient detail to enable an operator to carry out a measurement without
additional information.
method of measurement (VIM 2.4)
logical sequence of operations, described generically, used in the performance
of measurements
NOTE Methods of measurement may be qualified in various ways such as:
substitution method, differential method, null method.
metrology (VIM 2.2)
science of measurement
NOTE Metrology includes all aspects both theoretical and practical with
reference to measurements, whatever their uncertainty, and in whatever fields of
science or technology they occur.
national (measurement) standard (VIM 6.3)
standard recognized by a national decision to serve, in a country, as the basis for
assigning values to other standards of the quantity concerned
nominal value (VIM 5.3)
rounded or approximate value of a characteristic of a measuring instrument that
provides a guide to its use
EXAMPLES
a) 1 00 W as the value marked on a standard resistor;
b) 1 L as the value marked on a single-mark volumetric flask;
c) 0.1 mol/L as the amount-of-substance concentration of a solution of
hydrogen chloride, HCl;
d) 25 °C as the set point of a thermostatically controlled bath.

98
random error (VIM 3.13)
result of a measurement minus the mean that would result from an infinite
number of measurements of the same measurand carried out under repeatability
conditions
NOTES
1. Random error is equal to error minus systematic error.
2. Because only a finite number of measurements can be made, it is possible to
determine only an estimate of random error.
reference conditions (VIM 5.7)
conditions of use prescribed for testing the performance of a measuring
instrument or for intercomparison of results of measurements
NOTE The reference conditions generally include reference values or reference
ranges for the influence quantities affecting the measuring instrument.
relative error (VIM 3.12)
error of measurement divided by a true value of the measurand
NOTE Since a true value cannot be determined, in practice a conventional true
value is used (see 1.19 and 1.20).
resolution (of a displaying device) (VIM 5.12)
smallest difference between indications of a displaying device that can be
meaningfully distinguished
NOTES
1. For a digital displaying device, this is the change in the indication when the
least significant digit changes by one step.
2. This concept applies also to a recording device.
repeatability (of a measuring instrument) (VIM 5.27)
ability of a measuring instrument to provide closely similar indications for
repeated applications of the same measurand under the same conditions of
measurement
NOTES
1. These conditions include: reduction to a minimum of the variations due to
the observer, the same measurement procedure, the same observer, the same
measuring equipment, used under the same conditions, the same location and
repetition over a short period of time.

99
2. Repeatability may be expressed quantitatively in terms of the dispersion
characteristics of the indications.
repeatability (of results of measurements) (VIM 3.6)
closeness of the agreement between the results of successive measurements of
the same measurand carried out under the same conditions of measurement
NOTES
1. These conditions are called repeatability conditions.
2. Repeatability conditions include: the same measurement procedure, the
same observer, the same measuring instrument, used under the same conditions, the
same location, repetition over a short period of time.
3. Repeatability may be expressed quantitatively in terms of the dispersion
characteristics of the results.
reproducibility (of results of measurements) (VIM 3.7)
closeness of the agreement between the results of measurements of the same
measurand carried out under changed conditions of measurement
NOTES
1. A valid statement of reproducibility requires specification of the conditions
changed.
2. The changed conditions may include: principle of measurement, method of
measurement, observer, measuring instrument, reference standard, location,
conditions of use and time.
3. Reproducibility may be expressed quantitatively in terms of the dispersion
characteristics of the results.
4. Results are here usually understood to be corrected results.
response time (VIM 5.17)
time interval between the instant when a stimulus is subjected to a specified
abrupt change and the instant when the response reaches and remains within specified
limits around its final steady value
result of a measurement (VIM 3.1)
value attributed to a measurand, obtained by measurement

100
NOTES
1. When a result is given, it should be made clear whether it refers to: the
indication, the uncorrected result, the corrected result and whether several values are
averaged.
2. A complete statement of the result of a measurement includes information
about the uncertainty of measurement.
span (VIM 5.2)
modulus of the difference between the two limits of a nominal range
EXAMPLE for a nominal range of -10 V to +10 V, the span is 20 V.
NOTE In some fields of knowledge, the difference between the greatest and
smallest values is called range.
stability (VIM 5.14)
ability of a measuring instrument to maintain constant its metrological
characteristics with time
NOTES
1. Where stability with respect to a quantity other than time is considered, this
should be stated explicitly.
2. Stability may be quantified in several ways, for example: in terms of the
time over which a metrological characteristic changes by a stated amount, or - in
terms of the change in a characteristic over a stated time.
systematic error (VIM 3.14)
mean that would result from an infinite number of measurements of the same
measurand carried out under repeatability conditions minus a true value of the
measurand
NOTES
1. Systematic error is equal to error minus random error.
2. Like true value, systematic error and its causes cannot be completely known.
3. For a measuring instrument, see "bias" (5.25).
traceability (VIM 6.10)
property of the result of a measurement or the value of a standard whereby it
can be related to stated references, usually national or international standards, through
an unbroken chain of comparisons all having stated uncertainties

101
NOTES
1. The concept is often expressed by the adjective traceable.
2. The unbroken chain of comparisons is called a traceability chain.
transparency (VIM 5.15)
ability of a measuring instrument not to alter the measurand
EXAMPLES
a) a mass balance is transparent;
b) a resistance thermometer that heats the medium whose temperature it is
intended to measure is not transparent.
true value (of a quantity) (VIM 1.19)
value consistent with the definition of a given particular quantity
NOTES
1. This is a value that would be obtained by a perfect measurement.
2. True values are by nature indeterminate.
3. The indefinite article "a", rather than the definite article "the", is used in
conjunction with "true value" because there may be many values consistent with the
definition of a given particular quantity.
uncertainty of measurement (VIM 3.9)
parameter, associated with the result of a measurement, that characterizes the
dispersion of the values that could reasonably be attributed to the measurand
NOTES
1. The parameter may be, for example, a standard deviation (or a given
multiple of it), or the half-width of an interval having a stated level of confidence.
2. Uncertainty of measurement comprises, in general, many components. Some
of these components may be evaluated from the statistical distribution of the results of
series of measurements and can be characterized by experimental standard deviations.
The other components, which can also be characterized by standard deviations, are
evaluated from assumed probability distributions based on experience or other
information.
3. It is understood that the result of the measurement is the best estimate of the
value of the measurand, and that all components of uncertainty, including those
arising from systematic effects, such as components associated with corrections and
reference standards, contribute to the dispersion.
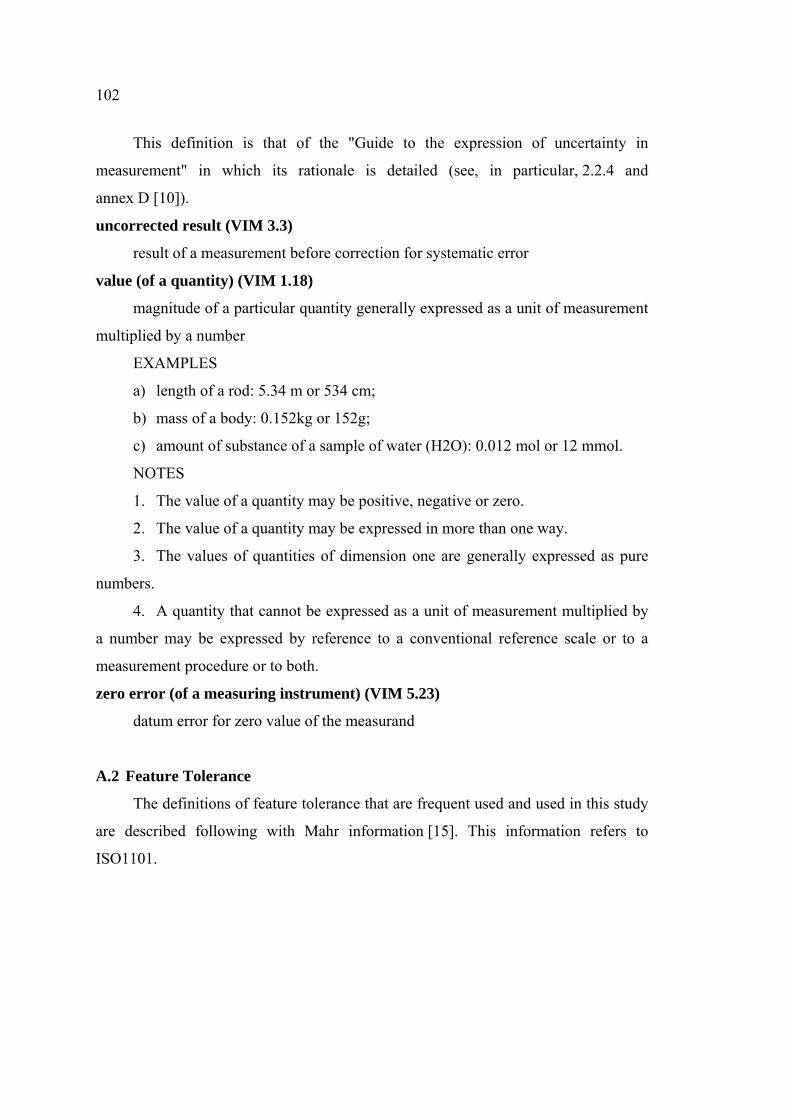
102
This definition is that of the "Guide to the expression of uncertainty in
measurement" in which its rationale is detailed (see, in particular, 2.2.4 and
annex D [10]).
uncorrected result (VIM 3.3)
result of a measurement before correction for systematic error
value (of a quantity) (VIM 1.18)
magnitude of a particular quantity generally expressed as a unit of measurement
multiplied by a number
EXAMPLES
a) length of a rod: 5.34 m or 534 cm;
b) mass of a body: 0.152kg or 152g;
c) amount of substance of a sample of water (H2O): 0.012 mol or 12 mmol.
NOTES
1. The value of a quantity may be positive, negative or zero.
2. The value of a quantity may be expressed in more than one way.
3. The values of quantities of dimension one are generally expressed as pure
numbers.
4. A quantity that cannot be expressed as a unit of measurement multiplied by
a number may be expressed by reference to a conventional reference scale or to a
measurement procedure or to both.
zero error (of a measuring instrument) (VIM 5.23)
datum error for zero value of the measurand
A.2 Feature Tolerance
The definitions of feature tolerance that are frequent used and used in this study
are described following with Mahr information [15]. This information refers to
ISO1101.

103
TABLE A-1 Symbol and definition of feature tolerance
Feature tolerance Symbol Definition
Straightness
The tolerance zone is limited in the
measuring plane by two parallel straight
lines a distance t apart.
Roundness /
Circularity
The tolerance zone is limited in the
measuring plane perpendicular to the axis
by two concentric circles a distance t
apart.
Cylindricity /
Cylinder form
The tolerance zone is limited by two
coaxial cylinders a distance t apart.
Parallelism
The tolerance zone is limited in the
measuring plane by two straight lines a
distance t apart and parallel to the datum.
Radial run out
The tolerance zone is limited in the
measuring plane perpendicular to the axis
by two concentric circles a distance t
apart, the common centre of which lies on
the datum axis.

104
TABLE A-1 (CONTINUED)
Feature tolerance Symbol Definition
Conicity
Not yet described by
standards.
The tolerance zone is limited in the
measuring plane by two straight lines a
distance t apart and parallel to the datum.
Not the measured profile, but that section
of the reference straight line calculated
according to LSS which is restricted to the
measuring length shall be contained
within the tolerance zone.
A.3 The Evaluation Methods
The definitions of The Evaluation Methods described following with Mahr
information [15]. This information refers to ISO2766.
TABLE A-2 The evaluation methods
Regression circle (Gaussian straight circle)
Circle laid into the measured circular profile such that the
sum of the squares of all profile deviations is a minimum.
(LSC =Least Square Circle)
Circular zone with minimum radial separation
Concentric circles enclosing the circular profile and having
the least radial separation.
(MZC =Minimum Zone Circles)
Minimum circumscribed circle
Smallest possible circle which can be fitted around the
circular profile.
(MCC =Minimum Circumscribed Circle)

105
TABLE A-2 (CONTINUED)
Maximum inscribed circle
Largest possible circle which can be fitted within the
circular profile.
(MIC =Maximum Inscribed Circle)
Regression straight line (Gaussian straight line)
Mean line laid through the measured profile such that the
sum of the squares of all profile deviations is a minimum.
(LSS =Least Square Straight line)
Enveloping parallel lines
Parallel, straight lines enclosing the profile and having the
least separation.
(MZS=Minimum Zone Straight lines)
Regression parabola
Mean parabola (2nd order) laid through the profile such
that the sum of the squares of all profile deviations is a
minimum.
(LSP =Least Square Parabola)
Edge identifikation
The position of a profile interruption (edge) is determines.
The profile is evaluated up to the edge according to LSS.
(EID =Edge IDentification)

APPENDIX B
SCREENING EXPERIMENTAL

108
B.1 Introduction
A screening experimental measures a cylindrical standard workpiece that is used
as the workpiece in this study. This screening experimental is used for checking the
assumption and the evaluation parameters in relative to the experimental. It is
performed in a temperature uncontrolled room with air conditioning unit. In normal
case, form measurement directly affect from temperature and its changing. The
objectives of this screening experimental are:
To present a positioning error in the direction of x, y and z axis when machine
searches the same position.
To compare roundness deviation when using the different evaluation criteria:
MZC and LSC.
To compare radial runout deviation when using z axis and c axis as reference
datum.
To compare radial runout deviation with workpiece related datum when using
the different number of circles or data points to calculate workpiece datum.
To prove the assumption that radial runout deviation with workpiece related
datum is limitation of roundness deviation when using the same profile to determine
both features.
To compare cylindricity deviation when using different methods of scanning
polar profiles: between zeroing the probe only one time for three circles and zeroing
the probes every circle.
B.2 Experimental Procedure
First, the workpiece is aligned by scanning two circles at 15 and 85 mm height
of the workpiece coordinate under the permissible eccentricity value is less than
2.0 µm. Next, the measurement program scans three circles (C1, C2 and C3) at three
different heights of workpiece coordinate to collect data for determining tolerance
feature. The heights of scanning circle are 15, 50, 85 mm of workpiece coordinate.
These specific heights of measurement are the same as the setting parameters in the
study experimental. However two heights of scanning circle, 15 and 85 mm, are the
same as two heights used to workpiece’s alignment. In normal case, alignment area
must cover measurement area. The measuring heights are not the same height as
aligning height in order to obtain accurate result. Due to these setting measurement
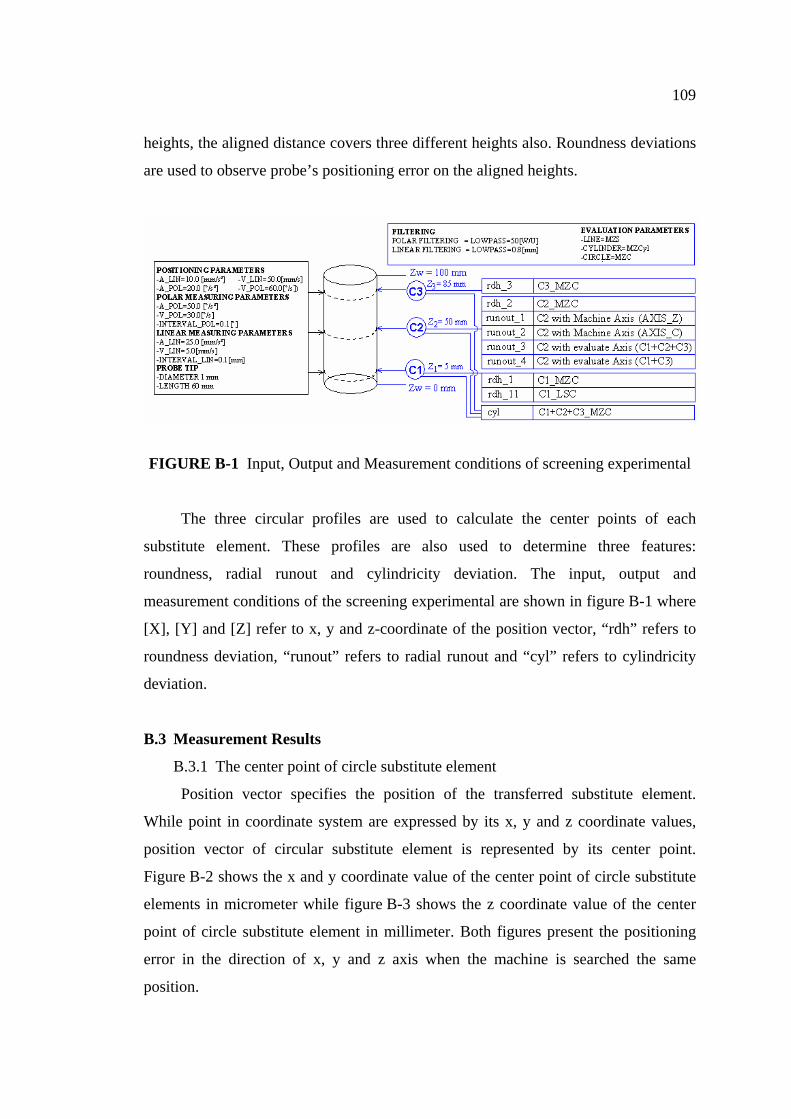
109
heights, the aligned distance covers three different heights also. Roundness deviations
are used to observe probe’s positioning error on the aligned heights.
FIGURE B-1 Input, Output and Measurement conditions of screening experimental
The three circular profiles are used to calculate the center points of each
substitute element. These profiles are also used to determine three features:
roundness, radial runout and cylindricity deviation. The input, output and
measurement conditions of the screening experimental are shown in figure B-1 where
[X], [Y] and [Z] refer to x, y and z-coordinate of the position vector, “rdh” refers to
roundness deviation, “runout” refers to radial runout and “cyl” refers to cylindricity
deviation.
B.3 Measurement Results
B.3.1 The center point of circle substitute element
Position vector specifies the position of the transferred substitute element.
While point in coordinate system are expressed by its x, y and z coordinate values,
position vector of circular substitute element is represented by its center point.
Figure B-2 shows the x and y coordinate value of the center point of circle substitute
elements in micrometer while figure B-3 shows the z coordinate value of the center
point of circle substitute element in millimeter. Both figures present the positioning
error in the direction of x, y and z axis when the machine is searched the same
position.
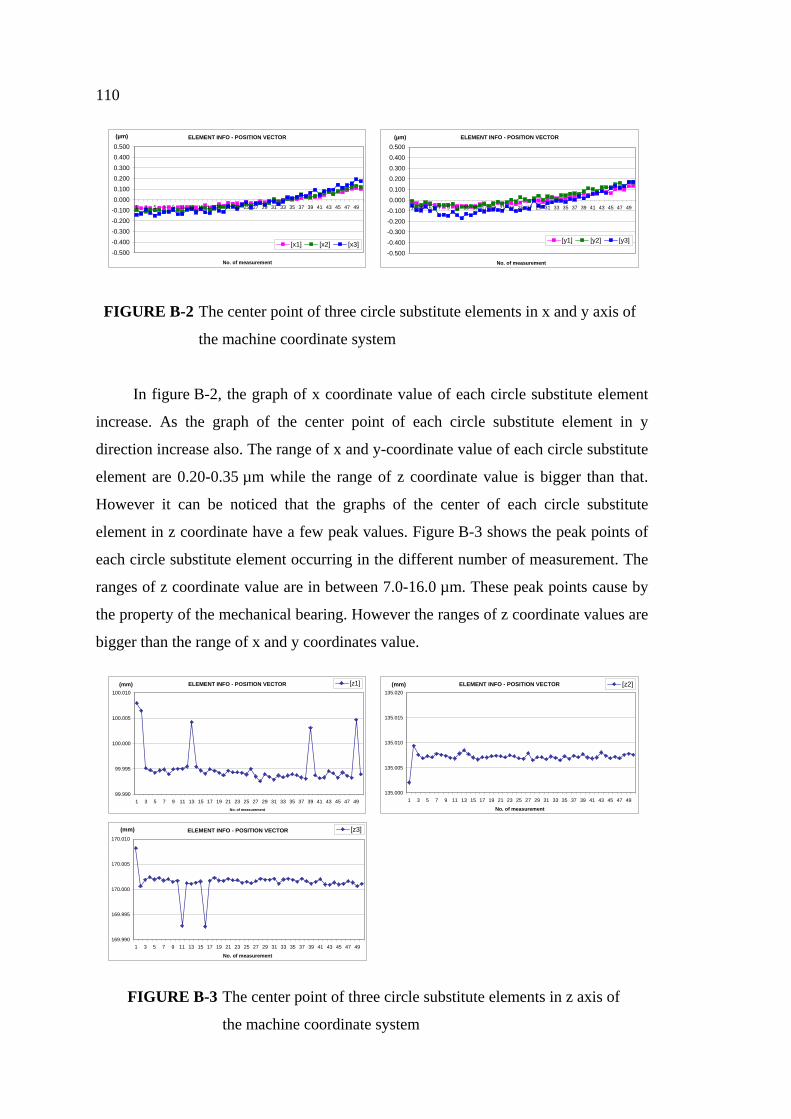
110
ELEMENT INFO - POSITION VECTOR
-0.500-0.400-0.300-0.200-0.1000.0000.1000.2000.300
0.4000.500
1 3 5 7 9 11 13 15 17 19 21 23 25 27 29 31 33 35 37 39 41 43 45 47 49
No. of measurement
(µm)
[x1] [x2] [x3]
ELEMENT INFO - POSITION VECTOR
-0.500-0.400
-0.300-0.200-0.100
0.0000.100
0.2000.300
0.4000.500
1 3 5 7 9 11 13 15 17 19 21 23 25 27 29 31 33 35 37 39 41 43 45 47 49
No. of measurement
(µm)
[y1] [y2] [y3]
FIGURE B-2 The center point of three circle substitute elements in x and y axis of
the machine coordinate system
In figure B-2, the graph of x coordinate value of each circle substitute element
increase. As the graph of the center point of each circle substitute element in y
direction increase also. The range of x and y-coordinate value of each circle substitute
element are 0.20-0.35 µm while the range of z coordinate value is bigger than that.
However it can be noticed that the graphs of the center of each circle substitute
element in z coordinate have a few peak values. Figure B-3 shows the peak points of
each circle substitute element occurring in the different number of measurement. The
ranges of z coordinate value are in between 7.0-16.0 µm. These peak points cause by
the property of the mechanical bearing. However the ranges of z coordinate values are
bigger than the range of x and y coordinates value.
ELEMENT INFO - POSITION VECTOR
99.990
99.995
100.000
100.005
100.010
1 3 5 7 9 11 13 15 17 19 21 23 25 27 29 31 33 35 37 39 41 43 45 47 49No. of measurement
(mm) [z1] ELEMENT INFO - POSITION VECTOR
135.000
135.005
135.010
135.015
135.020
1 3 5 7 9 11 13 15 17 19 21 23 25 27 29 31 33 35 37 39 41 43 45 47 49
No. of measurement
(mm) [z2]
ELEMENT INFO - POSITION VECTOR
169.990
169.995
170.000
170.005
170.010
1 3 5 7 9 11 13 15 17 19 21 23 25 27 29 31 33 35 37 39 41 43 45 47 49
No. of measurement
(mm) [z3]
FIGURE B-3 The center point of three circle substitute elements in z axis of
the machine coordinate system

111
Normally, the protocol is used to observe disturbances or affects from
measuring environment such as dust or vibration. Due to the peak value in z direction,
these protocols can not do that. Because these circular profiles are the plane in x and
y-direction, the peak points in z-direction do not represent by the protocols.
Corresponding to this reason, the profile results of the roundness and the radial runout
deviation are normal and do not have the peak or valley in the protocol of the number
of measurement having the peak point.
B.3.2 Roundness deviation
roundnees
0.000
0.100
0.200
0.300
0.400
0.500
1 4 7 10 13 16 19 22 25 28 31 34 37 40 43 46 49
No. of measurement
devi
atio
n (µ
m)
rdh_1
rdh_2
rdh_3
roundness (same profile_different measurement criteria)
0.000
0.100
0.200
0.300
0.400
0.500
1 4 7 10 13 16 19 22 25 28 31 34 37 40 43 46 49No. of measurement
devi
atio
n (µ
m)
rdh_1
rdh_11
FIGURE B-4 Roundness deviation
(Left) Roundness deviations when evaluation criteria are MZC
(Right) Roundness deviation of the second circle substitute element
(C2) when evaluation criteria are MZC and LSC
Three circular profiles are determined roundness deviations with MZC
evaluation criteria. Roundness deviations of each circle substitute element when using
MZC evaluation criteria are shown in the left-hand side of figure B-4. Roundness
deviations of three circles with the MZC evaluation criteria are nearly similarity in the
range 0.040-0.090 µm. However it can be noticed that the range and the mean value
of the third circular profile are bigger than others. These results agree with the
formtester principle, the measurement height affect to roundness deviation.
Roundness deviation is increased when the measurement height increases due to the
deformation of machine column. Then technical data of measuring machine represent
roundness deviation in µm+µm per mm of measurement height in the general.
Furthermore, the first circular profile (C1) is determined roundness with LSC
evaluation criteria for comparing roundness deviation when using the different
evaluation criteria between MZC and LSC. Figure B-4 in the right-hand side of shows

112
roundness measurement result of the same profile is difference when using the
different evaluation criteria. Roundness deviations with LSC evaluation criterion are
bigger than roundness deviations with MZC evaluation criterion in every
measurement. The range of roundness deviations with LSC evaluation criterion is also
bigger than the range of roundness deviations with MZC evaluation criterion. The
range of roundness deviations of the first circular profile when evaluating with MZC
and LSC criteria are 0.050535 µm and 0.065824 µm. Due to the changing in every
measurement, evaluation criteria effect to the measurement result. Therefore, the
comparison or the analysis of form measurement results must be done with similar
evaluation criteria.
However it can be noticed that roundness deviation evaluated with MZC
evaluation criteria is not bigger than roundness deviation evaluated with MZC
evaluation criteria in every time of measurement.
B.3.3 radial runout deviation
The second circular profile (C2) is determined radial runout deviation with the
four difference reference datum in order to observe the effect of difference reference
datum to radial runout deviation.
radial run out
0.000
0.100
0.200
0.300
0.400
0.500
0.600
1 4 7 10 13 16 19 22 25 28 31 34 37 40 43 46 49No. of measurement
devi
atio
n (µ
m)
runout_1 runout_2 runout_3 runout_4
roundness and radial run out (same profile)
0.000
0.100
0.200
0.300
0.400
0.500
0.600
1 4 7 10 13 16 19 22 25 28 31 34 37 40 43 46 49
No. of measurement
devi
atio
n (µ
m)
rdh_2 runout_2 runout_3 runout_4
FIGURE B-5 Radial runout deviation
(Left) four radial runout deviations with the difference reference
datum when evaluation criteria are MZC
(Right) the comparison between roundness and radial runout
deviation determined from the same profile (C2) when evaluation
criteria are MZC
The first comparison is radial runout with the different machine datum between
z and c axes (runout_1and runout_2). The z axis of the measuring machine is machine

113
column while the c axis refers to the line axis that is on the center point of the
rotational table and parallel with the z axis of measuring machine. Even through the z
and c axes are not the same axis according to the machine definition, radial runout
deviation with both machine as datum are also the same value. Because the
determining of the recorded profile deviation uses the probe ball to be the reference
coordinate system, both of the machine datum lines refer from the center of the c-
rotary table. The z axis are calculated from the center of the c-rotary table adding up
the radial of the workpiece and the radial of the probe tip while the c axis refers to the
line axis that is on the center point of the rotary table and parallel with the z axis of
the measuring machine. Figure B-5(Left) shows radial runout deviations with z axis
of the machine as datum are the same value as radial runout deviations with c axis of
the machine as datum.
Additionally, radial runout deviation with the machine as datum changes from
0.200 to 0.600 µm during one hour and thirty minute of the measurement program. It
is interesting what is the main influencing factor that affected with this measurement
result but the measurement result and the recorded data of this screening experimental
is less for making conclusion. Normally, radial runout deviation with the machine as
datum is affected from many sources of error for example the bending in machine
column form temperature, the parallel between machine column axis and the rotary
axis, the complement of aligning workpiece that made the workpiece axis parallel
with machine axis, etc.
The second comparison is radial runout with different workpiece related datum
between datum_A (runout_3) and datum_B (runout_4). The workpiece datum_A is
crated from three circles that measured at 15, 50 and 85 mm refer from the height of
workpiece while the workpiece datum_B is crated from two circles that measured at
15 and 85 mm. Figure B-5 in the left-hand side shows both radial runout deviations
with workpiece related datum are slightly the same. Because the workpiece datum is
the substitute line element that is calculated from the center of each circle substitute
element, the workpiece datum that evaluated from the different number of circles or
the different data points is not the same thing or the same datum.
In assumption that radial runout deviation with workpiece related datum is
limitation of roundness deviation when using the same profile in order to determining
both features. Figure B-5 in the right-hand side shows roundness deviation is smaller
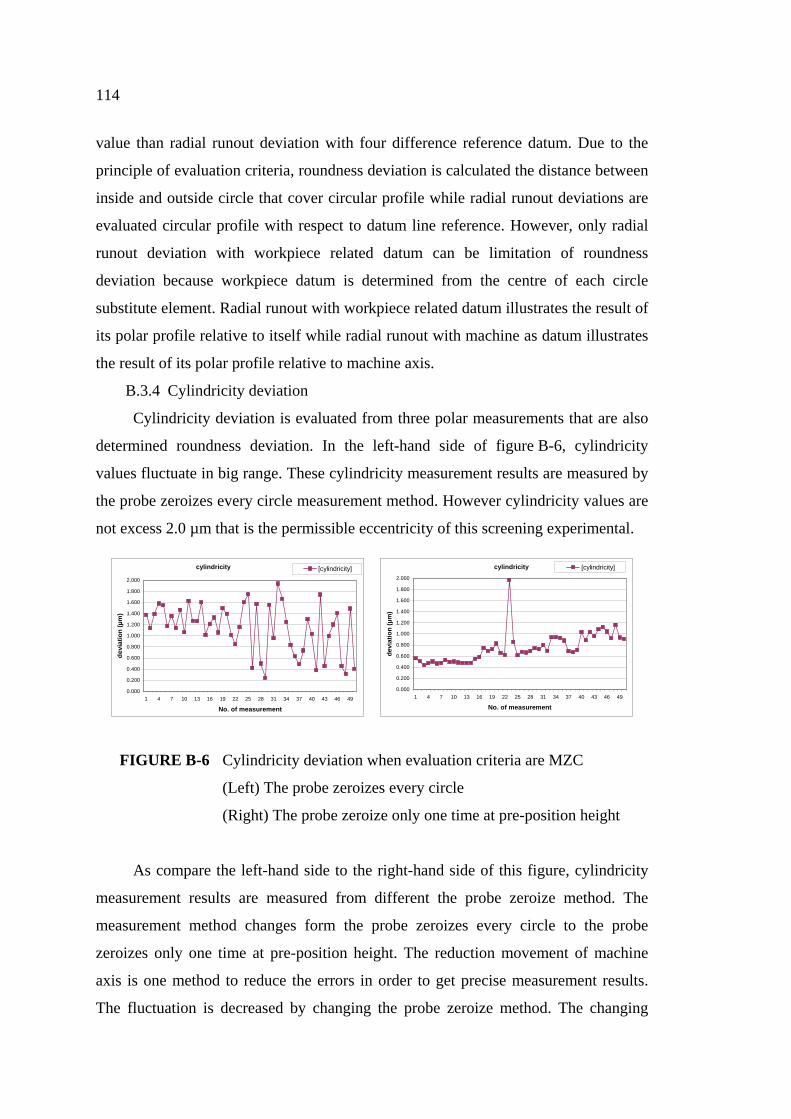
114
value than radial runout deviation with four difference reference datum. Due to the
principle of evaluation criteria, roundness deviation is calculated the distance between
inside and outside circle that cover circular profile while radial runout deviations are
evaluated circular profile with respect to datum line reference. However, only radial
runout deviation with workpiece related datum can be limitation of roundness
deviation because workpiece datum is determined from the centre of each circle
substitute element. Radial runout with workpiece related datum illustrates the result of
its polar profile relative to itself while radial runout with machine as datum illustrates
the result of its polar profile relative to machine axis.
B.3.4 Cylindricity deviation
Cylindricity deviation is evaluated from three polar measurements that are also
determined roundness deviation. In the left-hand side of figure B-6, cylindricity
values fluctuate in big range. These cylindricity measurement results are measured by
the probe zeroizes every circle measurement method. However cylindricity values are
not excess 2.0 µm that is the permissible eccentricity of this screening experimental.
cylindricity
0.000
0.200
0.400
0.600
0.800
1.000
1.200
1.400
1.600
1.800
2.000
1 4 7 10 13 16 19 22 25 28 31 34 37 40 43 46 49
No. of measurement
devi
atio
n (µ
m)
[cylindricity] cylindricity
0.000
0.200
0.400
0.600
0.800
1.000
1.200
1.400
1.600
1.800
2.000
1 4 7 10 13 16 19 22 25 28 31 34 37 40 43 46 49
No. of measurement
devi
atio
n (µ
m)
[cylindricity]
FIGURE B-6 Cylindricity deviation when evaluation criteria are MZC
(Left) The probe zeroizes every circle
(Right) The probe zeroize only one time at pre-position height
As compare the left-hand side to the right-hand side of this figure, cylindricity
measurement results are measured from different the probe zeroize method. The
measurement method changes form the probe zeroizes every circle to the probe
zeroizes only one time at pre-position height. The reduction movement of machine
axis is one method to reduce the errors in order to get precise measurement results.
The fluctuation is decreased by changing the probe zeroize method. The changing

115
probe zeroizes method from the probe zeroizes every circle to the zeroing probe only
one time in scanning can improve cylindricity deviation.
Furthermore, it can be seen that cylindricity deviations at the beginning is
stable. Cylindricity deviations increased after the measurement number fourteen cause
by surrounding disturbances. The highest peak point is at the twenty-three of number
of measurement. These observations can explain by comparison figure B-6 to and
figure B-7.
roundnees
0.000
0.100
0.200
0.300
0.400
0.500
0.600
0.700
0.800
0.900
1.000
1 4 7 10 13 16 19 22 25 28 31 34 37 40 43 46 49
No. of measurement
devi
atio
n (µ
m)
rdh_1 rdh_2 rdh_3
roundnees
0.000
0.100
0.200
0.300
0.400
0.500
0.600
0.700
0.800
0.900
1.000
1 4 7 10 13 16 19 22 25 28 31 34 37 40 43 46 49
No. of measurement
devi
atio
n (µ
m)
rdh_1 rdh_2 rdh_3
FIGURE B-7 Roundness deviation when evaluation criteria are MZC
(Left) The probe zeroizes every circle
(Right) The probe zeroize only one time at pre-position height
Figure B-7 shows roundness deviations when measured profiles by different
probe zeroize method. The left-hand side of the figure show results when the probe
zeroizes every circle. The right-hand side of the figure show results when the probe
zeroizes only one time at the pre-position height. These three roundness deviations are
determined from the same polar profiles used to determine cylindricity deviation. The
first polar profile is changed from the measurement number forty-one while the
second and the third polar profile are changed from the measurement number fourteen
as same as cylindricity. As these results, the increasing of cylindricity deviation after
the number fourteen causes by surrounding disturbances. These roundness results
agree with their protocols that show peaks and valleys in circular profiles. Protocol is
used to observe disturbances or surrounding affected such as dust or vibration.
Additionally, radial runout deviations evaluated from same polar profile as
roundness and cylindricity deviations is shown in figure B-8. The right-hand side of
this figure shows radial runout deviations when the probe zeroizes only one time at
pre-position height. Radial runout deviation with workpiece related as datum agrees

116
with roundness and cylindricity. The results of roundness and radial runout deviation
with workpiece related as datum are also increasing as cylindricity deviation. The
increasing of repeated measurement causes by surrounding disturbance.
runout
0.000
0.100
0.200
0.300
0.400
0.500
0.600
1 4 7 10 13 16 19 22 25 28 31 34 37 40 43 46 49No. of measurement
devi
atio
n (µ
m)
runout_1 runout_2 runout_3 runout_4
runout
0.000
1.000
2.000
3.000
4.000
5.000
6.000
7.000
1 4 7 10 13 16 19 22 25 28 31 34 37 40 43 46 49
No. of measurement
devi
atio
n (µ
m)
runout_1 runout_2 runout_3 runout_4
FIGURE B-8 Radial runout deviation when evaluation criteria are MZC
(Left) The probe zeroizes every circle
(Right) The probe zeroize only one time at pre-position height
However it can be noticed that radial runout deviation with machine axis as
datum is big value until the beginning of measurement. The mean value of this feature
has the off-set value at the beginning. Radial runout deviations with machine axis as
datum represent to other influencing factor to polar measurement results.
ELEMENT INFO - POSITION VECTOR
-0.500-0.400-0.300-0.200-0.1000.000
0.1000.2000.300
0.4000.500
1 3 5 7 9 11 13 15 17 19 21 23 25 27 29 31 33 35 37 39 41 43 45 47 49
No. of measurement
(µm)
[x1] [x2] [x3]
ELEMENT INFO - POSITION VECTOR
-0.500
-0.400
-0.300-0.200
-0.1000.000
0.1000.2000.3000.400
0.500
1 3 5 7 9 11 13 15 17 19 21 23 25 27 29 31 33 35 37 39 41 43 45 47 49
No. of measurement
(µm)
[y1] [y2] [y3]
ELEMENT INFO - POSITION VECTOR
0.0000.2000.4000.6000.8001.0001.2001.4001.6001.8002.0002.2002.4002.6002.800
1 3 5 7 9 11 13 15 17 19 21 23 25 27 29 31 33 35 37 39 41 43 45 47 49
No. of measurement
(µm)
[x1] [x2] [x3]
ELEMENT INFO - POSITION VECTOR
0.0000.2000.4000.6000.8001.0001.2001.4001.6001.8002.0002.2002.4002.6002.800
1 3 5 7 9 11 13 15 17 19 21 23 25 27 29 31 33 35 37 39 41 43 45 47 49
No. of measurement
(µm)
[y1] [y2] [y3]
FIGURE B-9 The center point of three circle substitute elements in x and y axis of
machine coordinate system. (Left) The probe zeroizes every circle
(Right) The probe zeroize only one time at pre-position height

117
On the other hand, the x, y and z-coordinate value of the center point of each
circle substitute element are presented in order to prove the other influencing factors.
In figure B-9, the left-hand side of figure shows measurement results when the probe
zeroizes every circle. The right-hand side of this figure shows results when the probe
zeroizes only one time at the pre-position height. Under the different zeroing methods
of probe, the trend lines of repeated measurement of each circular profile are similar.
The positioning value in x and y direction increases in relative to measurement’s time.
However the x and y absolute value of circle center point when the probe zeroizes
only one time are higher than when the probe zeroizes every circle. These cause by
complement of workpiece alignment. Due to the setting permissible eccentricity
value, the acceptance workpiece aligning position does not exceed 2 µm. The
workpiece axis and the machine axis are parallel in between 0-2 µm. As figure B-9,
the first value of every circle substitute element is under 2 µm.
These results agree with radial runout deviations with the machine axis as datum
is big value at the beginning of repeated measurement. The mean value of this feature
has off-set value at the beginning.
In contrast, the z value of center point when the zeroing probe only one time at
pre-position height is shown in figure B-10. When the probe zeroizes every circle, the
z value of circle center point of each circle should be changing in the same range.
Some peak points occurred during measurement because of random error from
mechanical bearing property.
When the probe zeroize only one time at pre-position, the range of z value of the
first circle is smaller range than other circles. The range of z position vector of C2 and
C3 is together similar but different from the first circle. As see also in the right-hand
side of figure B-10, the positioning error in z direction of circle 1(C1) is
approximately 3.0 µm while the positioning errors in z direction of others (C2 and
C3) are approximately 8.0 µm. The range of z coordinate value of C2 and C3 height
when the zeroing probe only one time at pre-position are bigger than the range of z-
coordinate value of C1. However the range of z-coordinate value of C1, C2 and C3
when the probe zeroize only one time at pre-position height are smaller than when the
probe zeroize every circle. The position vector result agree with cylindricity results
improved by changing the zeroize method.

118
ELEMENT INFO - POSITION VECTOR
99.990
99.995
100.000
100.005
100.010
1 3 5 7 9 11 13 15 17 19 21 23 25 27 29 31 33 35 37 39 41 43 45 47 49
No. of measurement
(mm) [z1]
ELEMENT INFO - POSITION VECTOR
135.000
135.005
135.010
135.015
135.020
1 3 5 7 9 11 13 15 17 19 21 23 25 27 29 31 33 35 37 39 41 43 45 47 49No. of measurement
(mm) [z2]
ELEMENT INFO - POSITION VECTOR
169.990
169.995
170.000
170.005
170.010
1 3 5 7 9 11 13 15 17 19 21 23 25 27 29 31 33 35 37 39 41 43 45 47 49No. of measurement
(mm) [z3]
ELEMENT INFO - POSITION VECTOR
99.990
99.995
100.000
100.005
100.010
1 3 5 7 9 11 13 15 17 19 21 23 25 27 29 31 33 35 37 39 41 43 45 47 49
No. of measurement
(mm) [z1]
ELEMENT INFO - POSITION VECTOR
135.000
135.005
135.010
135.015
135.020
1 3 5 7 9 11 13 15 17 19 21 23 25 27 29 31 33 35 37 39 41 43 45 47 49
No. of measurement
(mm) [z2]
ELEMENT INFO - POSITION VECTOR
169.990
169.995
170.000
170.005
170.010
1 3 5 7 9 11 13 15 17 19 21 23 25 27 29 31 33 35 37 39 41 43 45 47 49
No. of measurement
(mm) [z3]
FIGURE B-10 The center point of three circle substitute elements in z axis of
machine coordinate system. (Left) The probe zeroizes every circle
(Right) The probe zeroize only one time at pre-position height
The examples of the measurement result of this screening experimental are
shown in figure B-11 and figure B-12. While the protocol of the measurement number
24 when the probe set zero at every circles and when the probe set zero only one time
are shown in figure B-13 and figure B-14.

119
FIGURE B-11 The screening experimental measurement result; element information
results in x, y and z-coordinate of the position vector

120
FIGURE B-12 The screening experimental measurement results; form and location
tolerance

121
FIGURE B-13 The protocol of the screening experimental with the zeroing probes
every circle

122
FIGURE B-14 The protocol of the screening experimental with the zeroing probe
only one time at pre-position height
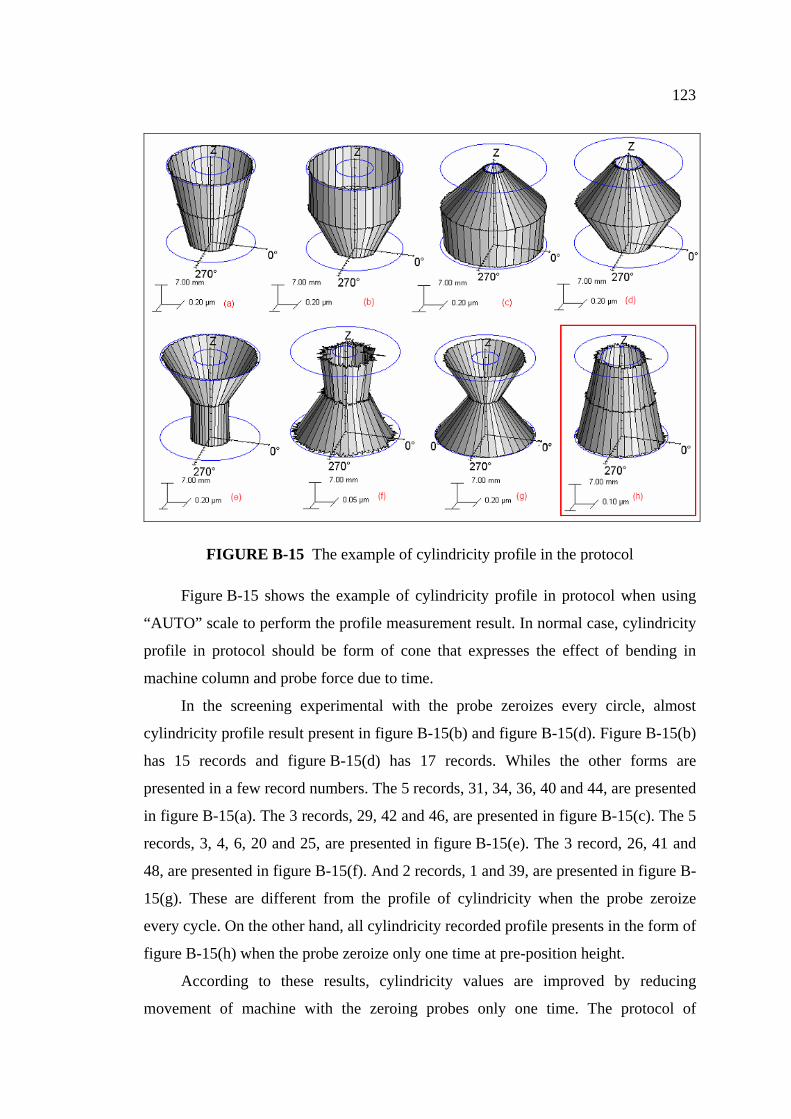
123
FIGURE B-15 The example of cylindricity profile in the protocol
Figure B-15 shows the example of cylindricity profile in protocol when using
“AUTO” scale to perform the profile measurement result. In normal case, cylindricity
profile in protocol should be form of cone that expresses the effect of bending in
machine column and probe force due to time.
In the screening experimental with the probe zeroizes every circle, almost
cylindricity profile result present in figure B-15(b) and figure B-15(d). Figure B-15(b)
has 15 records and figure B-15(d) has 17 records. Whiles the other forms are
presented in a few record numbers. The 5 records, 31, 34, 36, 40 and 44, are presented
in figure B-15(a). The 3 records, 29, 42 and 46, are presented in figure B-15(c). The 5
records, 3, 4, 6, 20 and 25, are presented in figure B-15(e). The 3 record, 26, 41 and
48, are presented in figure B-15(f). And 2 records, 1 and 39, are presented in figure B-
15(g). These are different from the profile of cylindricity when the probe zeroize
every cycle. On the other hand, all cylindricity recorded profile presents in the form of
figure B-15(h) when the probe zeroize only one time at pre-position height.
According to these results, cylindricity values are improved by reducing
movement of machine with the zeroing probes only one time. The protocol of
124
cylindricity profile can used to prove the effect on the machine column bending and
the probe force. However, the presented profile is adjusted by changing horizontal
scale. Only cylindricity recorded profile can not prove the causes that cylindricity
deviation is out of tolerance by only itself.
For example, figure B-13 shows protocol of screening experimental with the
probe zeroizes every circle. The three roundness deviations are 0.132, 0.138 and
0.196 µm while cylindricity deviation is 1.603 µm. If cylindricity relates with only
one circular profile, cylindricity protocol should be in cone form as figure B-15(a).
But cylindricity protocol express in form that having big diameter in the middle of the
cylindrical workpiece figure B-15(d). That means having other affected to cylindricity
determination. The second circular profile that is used to determine roundness and
radial runout deviation with workpiece related datum are similar. Both recorded
profiles have no high peak or valley. However protocols of radial runout deviation
with machine axis as datum are different from roundness and radial runout deviations
with workpiece related datum. It explains that the bigger diameter in the middle of the
cylindrical workpiece affect in relative to machine axes.
In figure B-14, protocol of screening experimental with the zeroing probe only
one time at pre-position height show three roundness deviation are 0.107, 0.487 and
0.487 µm. The second circular profile has a peak approximately 0.45 µm while the
third circular profile has a valley approximately 0.40 µm. The peak and the valley are
presented in cylindricity protocol. The protocols of radial runout deviation with
machine axis as datum and radial runout deviation with workpiece related as datum
have peak points as same as roundness. Cylindricity deviation is 0.868 µm and
cylindricity protocol express in form of cone. Cylindricity deviation measured by
zeroing the probe only one time is less value than by zeroing the probe every circle
even though the second and the third profiles of cylindricity have disturbances. It is
interesting what is the main influencing factor that affected with cylindricity
measurement result but the measurement result and the recorded data of this screening
experimental is less for making conclusion.
However the increasing of cylindricity value does not relates to only the
increasing of roundness. Because cylindricity deviation is evaluated from three circles
that measured at different heights. The x and y positioning error come form each
circle profile and the z positioning error comes from different height of polar

125
measurement. In addition, the cylinder substitute element is crated in three-dimension
element. Then the positioning in x, y and z direction are related with this feature. The
alternatively to the cylindricity form tolerance, the straightness, the circularity and the
parallelism can be tolerated [4]. That agrees with the explanation in Mahr manual
[19].
The cylindricity tolerance also indirectly limits the roundness and straightness
deviations, the parallelism deviations of the opposite generating lines as well as the
straightness deviations of the symmetry axis of the tolerance workpiece element.
However, it may be useful to perform additional roundness and straightness
measurement on the test surface in order to find the possible reason, why cylindricity
is out of tolerance.
B.4 Conclusions
B.4.1 Each of measurement point has at least the positioning errors. The value of
positioning errors in the x and y axes are closely. The values of positioning errors in
the z axis are bigger than others due to the effect of property of mechanical bearing
located in rotational table.
B.4.2 Due to evaluation criteria effect, the comparison or the analysis of form
measurement results must ensure that the deviation is determined by the same
evaluation criteria.
B.4.3 Radial runout deviation with the c axis as datum is the same value as radial
runout deviation with the z axis as datum. Both machine axes have no difference in
radial runout deviations because the software evaluates the position from probe ball.
As probe ball is used for the reference coordinate system in determining recorded
profile. The software compiles the c axis and the z axis of the measuring machine as
the same line.
B.4.4 The workpiece datum is the substitute line element that is calculated from
the centers of each circle substitute element. The workpiece lines datum that are
evaluated from the different number of circles or the different data points are not the
same datum. Radial runout deviation with workpiece related datum does not obtain
the same values when they are determined by different workpiece datum.
B.4.5 Radial runout deviation with workpiece related as datum is the limitation
of roundness deviation, because roundness deviation represents only deviation of its
126
polar profile. While radial runout deviation with workpiece related datum represents
deviation of its polar profile in relative to line reference calculated from measurement
on workpiece.
B.4.6 In order to get precise measurement results, cylindricity deviation are
improved by changing the probe zeroizes method. The probe zeroize method are
changed from zeroing the probe every circles to zeroing the probe only one time at
pre-position height in order to reduce the number of probe position. Due to reducing
positioning movement of machine, the sources of errors are reduced also because each
point of probe position has at least the positioning errors.
B.4.7 In this screening experiment, cylindricity deviation is determined from
three polar profiles. As cylindricity deviation is evaluated in form of three-
dimensioning, the sources of error in x, y, z and c direction of workpiece are added in
the cylindricity tolerance. The correct cylindricity deviation can be represented to the
complete measuring machine. However, many influencing factors are significant in
cylindricity evaluation. Additionally, only cylindricity deviation and its recorded
profile can not prove the causes of error that cylindricity deviation is out of tolerance.
Corresponding to these reasons, the other tolerances are also shown when determining
cylindricity deviation.

127
BIOGRAPHY
Name : Miss Nitima Nulong
Thesis Title : Investigation of Roundness Tester’s Accuracy and Compensation
Algorithm
Major Field : Production Engineering
Biography
I was born on September 13, 1977. I graduated Bachelor degree of Engineering
major Industrial Engineering in 1999 at Prince of Songkla university.
My contact address is 133/21 moo 3 Jangwattana Rd., Pak-kard, Nontaburee,
11120 Thailand. My e-mail address is [email protected]