investigation of relationships between diversification
TRANSCRIPT

THE RELATIONSHIPS BETWEEN DIVERSIFICATION STRATEGIES
AND FINANCIAL PERFORMANCE AND GROWTH AMONGST
ESTABLISHED SOUTH AFRICAN CONTRACTING FIRMS
BY
Idowu Olugbenga Adegelu
A research report submitted to the Faculty of Engineering and the Built Environment,
University of the Witwatersrand, in partial fulfilment of the requirements for the degree of
Master of Science in Building
Johannesburg, 2012

ii
TABLE OF CONTENTS
DECLARATION ........................................................................................................................ vii
ABSTRACT viii
ACKNOWLEDGMENTS ............................................................................................................. ix
LIST OF FIGURES ..................................................................................................................... x
LIST OF TABLES ....................................................................................................................... xi
LIST OF ABBREVATIONS ........................................................................................................ xii
GLOSSARY……… .................................................................................................................. xiii
CHAPTER ONE: ........................................................................................................................ 1
INTRODUCTION ....................................................................................................................... 1
1.1 Background.................................................................................................................. 1
1.2 Need for the Study ....................................................................................................... 6
1.3 Aim and Objectives ...................................................................................................... 8
1.4 Limitation of Study ....................................................................................................... 8
1.5 Research Question ...................................................................................................... 9
1.6 Research Hypothesis ................................................................................................... 9
1.7 Research Methodology ................................................................................................ 9
1.8 Benefits of Study .........................................................................................................10
1.9 Structure of the Research Report ................................................................................10
CHAPTER TWO: ......................................................................................................................12
LITERATURE REVIEW .............................................................................................................12
2.1 Introduction .................................................................................................................12
2.2 The Nature of Construction Industry ...........................................................................13
2.3 Strategic Assets and Competitive Advantage ..............................................................15
2.4 Modes of Competition in the Construction Industry .....................................................17
2.5 Diversification .............................................................................................................18
2.5.1 Diversification, financial performance and growth ................................................18 2.6 The Resource Based View (RBV) ...............................................................................21
2.7 Diversification and Firm Value.....................................................................................21
2.8 Diversification Strategies.............................................................................................22
2.8.1 Modes of diversification .......................................................................................23 2.9 Directions of Diversification .........................................................................................23
2.9.1 Vertical integration ...............................................................................................23 2.9.2 Horizontal integration ...........................................................................................23
2.10 Reasons for Diversifying .............................................................................................24
iii
2.10.1 Conditions for successful diversification ...............................................................24 2.11 Product Diversification ................................................................................................26
2.12 International Diversification .........................................................................................26
2.13 Environment-Specific Influences on Diversification Outcomes ....................................28
2.14 Measure of Firm Performance and Growth .................................................................29
CHAPTER THREE: ...................................................................................................................32
RESEARCH METHODOLOGY .................................................................................................32
3.1 Introduction .................................................................................................................32
3.2 Sampling Design .........................................................................................................32
3.2.1 Sample selection process ....................................................................................33 3.2.2 Selection of respondents within sample firms.......................................................34
3.3 Further Categorization of Samples ..............................................................................36
3.4 Development and Administration of Questionnaires ....................................................36
3.4.1 Questionnaire structure ........................................................................................37 3.5 Scales of Measurement ..............................................................................................37
3.6 Data Types .................................................................................................................38
3.6.1 Primary and secondary data ................................................................................38 3.6.2 Quantitative and qualitative data ..........................................................................39
3.7 Data Collection ...........................................................................................................39
3.8 Data Analysis ..............................................................................................................40
3.8.1 Descriptive and inferential statistics ........................................................................40 3.8.2 Test of hypothesis ................................................................................................45 3.8.3 Tests of significance ............................................................................................46 3.8.4 Probability values (p values) ................................................................................46
CHAPTER FOUR: .....................................................................................................................48
DATA ANALYSIS AND INTERPRETATION OF RESULTS.......................................................48
4.1 Introduction .................................................................................................................48
4.2 Analysis of Primary Data (Questionnaires) ..................................................................48
4.2.1 Test of reliability ...................................................................................................50 4.2.2 Section A: General information ............................................................................50 4.2.3 Section B: Company profile ..................................................................................50 4.2.4 Section C: Assessment of company’s strengths and weaknesses .......................52 4.2.5 Section D: Challenges and threats to the growth of the firms ...............................56 4.2.6 Section E: Diversification in company ..................................................................57
4.3 Analysis of Secondary Data (Financial Ratios) ............................................................64
4.3.1 Descriptive statistics on financial data ..................................................................65 4.3.2 Test on two independent samples ........................................................................68 4.3.2 Test on three independent samples .....................................................................69
4.4 Discussion of Findings ................................................................................................70
CHAPTER FIVE: .......................................................................................................................74

iv
CONCLUSIONS AND RECOMMENDATIONS ..........................................................................74
5.1 Summary of report ......................................................................................................74
5.2 Results of Hypothesis Testing .....................................................................................75
5.3 Summary of objectives, results and conclusions .........................................................75
5.4 Assumptions and limitations of the study ....................................................................78
5.5 Recommendations for Further Study...........................................................................79
REFERENCES 80
APPENDICES 89
Appendix A – Questionnaire cover letter ...................................................................................89
Appendix B1 – Questionnaire for undiversified firms .................................................................90
Appendix B2 – Questionnaire for diversified firms .....................................................................97
Appendix C1 – Financial ratios table ....................................................................................... 105
Appendix C2 – Financial ratios data of sampled firms ............................................................. 106
Appendix D1 – List of level 9 contracting firms ........................................................................ 107
Appendix D2 – Consolidated list of level 9 contracting firms ................................................... 115
Appendix E - Results of test of reliability ................................................................................. 119
Appendix F (Frequency tables) ............................................................................................... 120
Appendix F1 - Major areas of specialization of sampled firms ................................................. 120
Appendix F2 - Category of corporate registration .................................................................... 121
Appendix F3 – Firm strategy on expansion ............................................................................. 122
Appendix F4 - International operations of sampled firms ......................................................... 123
Appendix F5 - International operations of sampled firms (number of countries) ...................... 124
Appendix F6 - Interest in diversification (undiversified firms) ................................................... 125
Appendix F7 - Status of diversification (undiversified firms)..................................................... 126
Appendix F8 - Likely type of diversification to be implemented (undiversified firms) ................ 127
Appendix F9 - Likely mode of diversification to be implemented (undiversified firms) .............. 128
Appendix F10 - How the firm intends to achieve diversification (undiversified firms) ............... 129
Appendix F11 - Current / future management structure of the firm (undiversified firms) .......... 130
Appendix F12 – Type of diversification existing in the firm (diversified firms) .......................... 131
Appendix F13 – Type of organization – diversification type (diversified firms) ......................... 132
Appendix F14 - Existing mode of diversification (diversified firms) .......................................... 133
Appendix F15 - How diversification was achieved (diversified firms) ....................................... 134
Appendix F16 - Management structure before and after diversification (diversified firms) ....... 135
Appendix F17 – Centralized financial reporting structure in the firm (diversified firms) ............ 136
v
Appendix F18 – Post diversification experience (diversified firms) .......................................... 137
Appendix F19 - Factors influencing decision not to diversify (undiversified) ............................ 138
Appendix G – Results of factor analysis .................................................................................. 139
Appendix G1 – Communalities of variables for subsection C 1 (firm’s current
strengths/weaknesses) ........................................................................................................... 139
Appendix G2 – Total variance explained by components for subsection C 1 (firm’s current
strengths/weaknesses) ........................................................................................................... 140
Appendix G3 – Initial component matrix for subsection C 1 (firm’s current
strengths/weaknesses) ........................................................................................................... 141
Appendix G4 – Rotated component matrix for subsection C 1 (firm’s current
strengths/weaknesses) ........................................................................................................... 142
Appendix G5 – Communalities of variables for subsection C 2 (factors that influence firm
growth)………… ...................................................................................................................... 144
Appendix G6 – Total variance explained by components created for subsection C 2 (firm’s
current strengths/weaknesses) ............................................................................................... 145
Appendix G7 – Initial component matrix for subsection C 2 (firm’s current
strengths/weaknesses) ........................................................................................................... 146
Appendix G8 – Rotated component matrix for subsection C 2 (factors that influence firm
growth)………… ...................................................................................................................... 148
Appendix G9 – Communalities of variables for section D (challenges and threats to company’s
growth)………… ...................................................................................................................... 150
Appendix G10 – Total variance explained by components created for section D (challenges and
threats to company’s growth) .................................................................................................. 151
Appendix G11 – Initial component matrix for section D (challenges and threats to company’s
growth)………… ...................................................................................................................... 152
Appendix G12 - Rotated component matrix for section D (challenges and threats to company’s
growth)………… ...................................................................................................................... 153
Appendix G13 – Communalities of variables for section E 7 (motivation of diversification
strategy)………. ...................................................................................................................... 154
Appendix G14 – Total variance explained by components created for section E 7 (motivation of
diversification strategy) ........................................................................................................... 155
Appendix G15 – Initial component matrix for section E 7 (motivation of diversification
strategy)………. ...................................................................................................................... 156
vi
Appendix G16 – Rotated component matrix for section E 7 (motivation of diversification
strategy)………. ...................................................................................................................... 157
Appendix G17 - Communalities of variables for section E 9 (diversification barrier) ................ 158
Appendix G18 - Total variance explained by components created for section E 9 (diversification
barrier)………… ...................................................................................................................... 159
Appendix G19 - Initial component matrix for section E 9 (diversification barrier) ..................... 160
Appendix G20 - Rotated component matrix for section E 9 (diversification barrier) ................. 161
Appendix H – Tables of statistics ............................................................................................ 162
Appendix H1 – Group statistics for two (2) independent samples ............................................ 162
Appendix H2 – Group statistics for three (3) independent samples ......................................... 163
Appendix H3 – T Test: parametric test for two (2) independent samples ................................. 164
Appendix H4 – Sum of Ranks ................................................................................................. 165
Appendix H5 – Mann-Whitney: non parametric test of two independent samples .................... 166
Appendix H6 - One way analysis of variance (ANOVA): parametric test for three independent
samples……….. ...................................................................................................................... 167
Appendix H7 – Result of test of homogeneity of variances ...................................................... 168
Appendix H8 – Result of analysis of variance ......................................................................... 169
Appendix H9 – Kruskal Wallis test: non parametric test for three (3) independent samples .... 170

vii
DECLARATION
I declare that this research report is my own unaided wok. It is being submitted for the Degree of
Master of Science to the University of the Witwatersrand, Johannesburg. It has not been
submitted before any degree or examination to any other University.
.........................................................................................................................................................
(Signature of Candidate)
......................... day of ...............................year ...........................
Day month year

viii
ABSTRACT
Globalization, which has created a fairly free access for foreign firms to compete locally and low
entry barrier in the construction industry have increased the competition in the construction
industry in South Africa. The study investigated the relationship between diversification
strategies employed by contracting firms and their financial performance and growth.
Level 9 contracting firms on the Construction Industry Development Board (CIDB) database (as
at September 2008) were classified into undiversified, moderately diversified and highly
diversified firms. Two (2) separate questionnaires were administered to undiversified and
diversified firms to solicit information which assisted in the understanding of the strategies of
these firms. Financial information was also requested from the firms in order to calculate
financial ratios from audited financial statements for five years (2004 – 2008). The result from
the study did not establish any particular pattern in terms of performance and growth.
When the performances of the two independent samples of firms (undiversified and diversified)
were compared, the outcome of the study reveals that, on the average, undiversified firms
perform better than diversified ones on Return on Capital Employed (ROCE), Return on Equity
(ROE) and Return on Total Asset (ROTA). Diversified firms however have better performance
on Profit Margin (PM). The result of test of hypothesis on ROCE, ROTA and PM supports the
null hypothesis that there is no significant difference in the performances and growth of
undiversified and diversified firms. However, on the ROE, the null hypothesis is rejected.
When the three independent samples of firms (undiversified, moderately diversified and highly
diversified) were compared, the results suggest that undiversified firms had the highest average
on ROCE and ROE, followed by moderately diversified and highly diversified firms respectively.
On ROTA, moderately diversified firms had the highest average, followed by undiversified and
highly diversified firms respectively. Highly diversified firms had the highest average on PM,
followed by undiversified firms, which is closely followed by moderately diversified firms. The
results of test of hypothesis on ROCE and PM show that the null hypothesis that there is no
significant difference in the performance and growth of contracting firms is supported by the
data. The null hypothesis is not supported in terms of ROTA and ROE.
It should be noted that the empirical study occurred in 2009 and was submitted for assessment
in 2011.

ix
ACKNOWLEDGMENTS
I wish to appreciate the contributions of the following:
God Almighty, for making it possible for me to start and complete this study;
Late Dr. Joseph Kehinde, who started off this research in November 2006 under the
guidance of Dr. David Root (formerly of the University of Cape Town);
My parents, Mr. and Mrs. Moses Ademola Adegelu, for their immense contribution and
sacrifices on my education;
My wife and Children, Olubunmi Adetola; Oluwatomisin Adeolu and Olatomiwa
Oreoluwa, for their understanding while I was away spending more time with my studies;
My supervisor, Dr. A. A. Ilemobade for his guidance, encouragement and prompt
responses throughout the period of this study;
Mr. Bode Akindele, for his confidence, guidance and support during the early days of the
study;
Family, friends and colleagues, too many to mention here, who encouraged and
supported me during this study. Thank you all.

x
LIST OF FIGURES
Figure 4.1: Graphical representation of the means of financial ratios for two independent
samples ....................................................................................................................................66
Figure 4.2: Graphical representation of the means of financial ratios for three independent
samples ....................................................................................................................................67

xi
LIST OF TABLES
Table 1.1: Actual capital expenditure on new construction works by the public sector................ 2
Table 3.1: Comparison of probability sampling designs .............................................................35
Table 2.2: Classification of level 9 contracting firms ..................................................................36
Table 3.3: A summary of measurement scales, their characteristics, and their statistical
implications ...............................................................................................................................38
Table 3.4: Recommended statistical techniques by measurement level and testing ..................44
Table 4.1: Summary of questionnaire administration and response ..........................................49
Table 4.2: Breakdown of questionnaire analysis .......................................................................49
Table 4.3: Breakdown of firms that supplied financial data ........................................................65
Table 4.4: Kolmogorov Smirnov test for normality at 5% level of significanceError! Bookmark
not defined.7
Table 4.5: Summary of tests of hypothesis………………………………………….……………….69

xii
LIST OF ABBREVATIONS
BEE Black Economic Empowerment
BRT Bus Rapid Transport
CIDB Construction Industry Development Board
CSIR Council for Scientific and Industrial Research
ECDM Emerging Contractor Development Model
EPWP Expanded Public Works Programme
FDI Foreign Direct Investment
FIFA Fédération Internationale de Football Association
GDFI Gross Domestic Fixed Investment
GDP Gross Domestic Product
GFCF Gross Fixed Capital Formation
HAIs Historically Advantaged Individuals
HDIs Historically Disadvantaged Individuals
IRCs Important Resources and Competences
NIMS National Infrastructure Maintenance Strategy
PM Profit Margin
PPP Public Private Partnerships
RBV Resource Based View
ROCE Return on Capital Employed
ROE Return on Equity
ROTA Return on Total Asset
SACEM South African Construction Excellence Model
SAFCEC South African Federation of Civil Engineering Contractors
SIC Standard Industry Classification
SIC Strategic Business Unit
SPSS Statistical Package for Social Sciences

xiii
GLOSSARY
Competitive Advantage is the potential of a firm to expand its stock of strategic assets rapidly
than rivals.
Core competencies are the pool of experience, knowledge and systems, etc. that exists
elsewhere in the same corporation and can be deployed to reduce the cost or time required to
either create a new strategic asset or expand the stock of an existing one (Markides et al,
1994).
Standard Industry Classification (SIC) is a United States government system for classifying
industries by a four-digit code.
Strategic Assets are assets that underpin a firm’s cost or differentiation advantage in a
particular market and that are imperfectly imitable, imperfectly substitutable and imperfectly
tradable.
Strategic Business Unit (SBU) is understood as a business unit within the overall corporate
identity which is distinguishable from other business because it serves a defined external
market where management can conduct strategic planning in relation to products and markets
(Wikipedia, 2008).
Strategic Management is a system for producing strategies within an organizational
infrastructure, Fellows et al (2003).
Strategy is defined as a long term plan of action designed to achieve a particular goal
(Wikipedia, 2008).

1
CHAPTER ONE: INTRODUCTION
1.1 Background
The 1994 democratically elected government of South Africa has brought, amongst other things,
an upturn in government spending on infrastructure. This is evident in the increase in Gross
Domestic Fixed Investment (GDFI) (Merrifield, 1999). GDFI (now GFCF – Gross Fixed Capital
Formation) is the flow of expenditure on (additions to) a country’s total fixed capital stock. This
increase in government spending at the time revived the economy which had experienced a
recession in job creation, training and skills development, local business enterprise
development and economic growth (ibid). In 1998 however, this upsurge in infrastructure
spending experienced a downturn as capacity utilization in the construction industry declined to
less than 80%, which was the industry’s long term norm at the time (Merrifield, ibid).
Based on industry records in 1997 (CSS, 1997), there were 12,386 construction firms in South
Africa, out of which 14% were responsible for more than 75% of the total construction output. By
2004, eight (8) listed companies in the construction industry accounted for about 23% of South
Africa’s total output (CIDB, 2004b).
The Construction Industry Development Board (CIDB) was established by an act of parliament
(Act 38 of 2000) to lead the construction industry development in South Africa by providing
strategic leadership and a regulatory framework. Part of its aims is to achieve national
transformation objectives by ensuring that the construction industry offers access to mainstream
economy for those disadvantaged by policies of apartheid. One of the mandates of the board is
to establish the registration of projects and contractors, and other suppliers, to systematically
regulate and monitor the performance of the construction industry and its stakeholders (CIDB,
2004a).
The CIDB’s register of contractors has grown tremendously over the years. According to CIDB
(2007), in December 2004, there were 1,500 contractors registered on the database. By
December 2005, this number had increased to 7,500. At the end of 2006, it further increased to
25,000 contractors. By the end of March 2007, 32,264 contractors were registered with the
CIDB. The CIDB had captured a total of 63,148 contractors on its database by the end of March
2008 (CIDB, 2008). The latter figure represents an almost 100% increase in registered

2
contractors from March 2007. 48,236 of these contractors were active at the time. It should be
noted that an active contractor on the CIDB register implies a contractor whose registration is
still valid with the board. The active status does not inform on the level of activity or frequency at
which the registered entity is involved in a contract.
The statistics shown in Table 1.1 show expenditure towards new construction works in the
South African construction industry between the years 2001-2007.
Table 1.1: Actual capital expenditure on new construction works by the public sector
Year Expenditure
2001 19,223,590,000
2002 20,252,961,000
2003 36,485,231,000
2004 31,427,335,000
2005 37,515,186,000
2006 47,728,578,000
2007 58,053,342,000
Source: Statistics SA (2008: 93)
According to Table 1.1, South Africa enjoyed a 3 year boom in the construction economy from
2005. As a result, Davis Langdon (2005) predicted that demands for strategic materials, skilled
labour, construction plant and machinery, and management resources would exceed supply in
the industry. The CIDB (2005) reported that in more than a decade, building and construction
materials suppliers were utilising more than 50% of previous installed capacity in the period
2003-2004. CIDB (2008) also reported that grade 9 contractors on the CIDB database had
doubled their order books in the year 2007, mainly from the booming construction sector in
South Africa and also from diversified portfolios in other parts of the world.
Construction growth in recent times was driven by infrastructural development in preparation for
the hosting of the Fédération Internationale de Football Association (FIFA) world cup
competition in 2010 and the government’s commitment to infrastructure development for a
better South Africa. The national infrastructure maintenance strategy (NIMS) programme,
approved in August 2006 is a coordinated programme of actions that is essential to
government’s vision of delivering infrastructure services to all. This programme is expected to

3
contribute to the predicted growth in the industry and government’s aim of attaining GFCF of
25% of Gross Domestic Product (GDP) by year 2014. GDP is the total market value of all final
goods and services produced in a country in a given year. The GFCF was at 14% of GDP in the
late 1990’s, 16% in 2004 and 17% in 2005. The figure increased to 18.6% in 2006, 21.2% in
2007 and 24% by the third quarter of 2008 (Venter, 2009).
Consequently, there is an accelerated programme for the development of transportation
infrastructure – the Gautrain rapid rail link, Bus Rapid Transport (BRT) system, train stations,
dam construction, airport expansions, roads rehabilitations and replacements, sea port
construction, energy infrastructure and sports facilities nationwide. The hosting of the FIFA 2010
world cup and infrastructure projects was forecasted to drive and sustain economic growth
beyond year 2010.
From the foregoing, one can conclude that the growth potential of the South African economy is
high. The effects of the global economic meltdown from 2009 on the economy of South Africa
and specifically, the construction industry could however not be ascertained at the time of this
study. Constraints such as low and unstable rates of profitability, high risk, competition, high
rates of business failure, and inadequate supply of skilled personnel continue to characterise
the South African construction economy (CIDB, 2004b). The high rate of liquidations and
enterprise failure, particularly among the emerging contractor sector is a poor indicator of
sustainability and impacts negatively on industry growth (CIDB, 2004a).
Growing globalization in the South African economy has had impacts on the construction
industry. Large South African firms have had to be more competitive by expanding into offshore
markets in order to grow revenues, spread their risks and match the level of performances of
their counterparts operating in international markets (Dlungwana et al., 2002). According to
(CIDB, 2004b), one of South Africa’s top contracting firms was ranked 93rd in the world, in a top
global contractors’ list, for their total construction contracting revenue in 2002 (home and
abroad). The same firm was ranked 43rd for revenue generated outside of their home country
(amounting to 53% of total turnover).
The composition of contractors in the South African construction industry is distorted. The
industry comprises formal and informal sectors. The former consisting of more established,
highly capitalised and recognised firms (i.e. large firms), and the latter, consisting of emerging

4
contractors (i.e. small firms) (Nyembe, 1994, cited in Ofori et al., 1996). CIDB (2004a)
acknowledged that the South African construction industry presents unique challenges of
narrowing the gap and raising overall performance between these two sectors.
Various programmes that are being implemented by government in an effort to mitigate the
imbalances of the past include promulgating legislation such as the Employment Equity Act 55
of 1998; Preferential Procurement Policy Framework Act 5 of 2000 and Broad Based Black
Economic Empowerment Act 53 of 2003. These legislations give preference to previously
disadvantaged, yet qualified individuals and organisations, mainly with respect to access to
employment, more equitable distribution of income, preference on evaluation of and award of
government tenders, ownership of productive assets and possession of advanced skills. These
are practical initiatives by the government to address the supply-side constraints and stimulate
access to market by historically disadvantaged enterprises (CIDB, 2004a).
Targeted enterprises, owned by Historically Disadvantaged Individuals, HDIs, can participate in
public procurement in a number of ways. These include either directly as prime contractors or
as joint venture partners or indirectly as sub-contractors, suppliers, service providers and
manufacturers to a prime (main) contractor in the supply chain. Targeted labour can be
engaged as either employees or contract (project specific) workers. It would seem that one of
the outcomes expected from procurement policies targeted at the HDIs is the unbundling or
unpacking of contracts into smaller bits to make them accessible to these groups. The
implication of this is that firms in the construction industry will have to reduce their reliance on
capital-intensive technologies and increase the labour component. This is the main objective of
labour-intensive programme, driven under the auspices of the expanded public works
programme (EPWP) established in 2004 at national and provincial levels in the Department of
Public Works. Other similar initiatives which support the development of small and medium size
contractors include the emerging contractor development model (ECDM) and the South African
construction excellence model (SACEM) which are frameworks drawn up to develop the
management capacities of small and medium size contractors respectively. These models were
researched and developed by the Council for Scientific and Industrial Research (CSIR).
In contrast with the above paragraph, this implied that less government contracts were made
available to previously favoured firms, which are predominantly white-owned. While it may be
true that preferential procurement policy has reduced the amount of public sector projects
5
available to white-owned firms, the problem could also be attributed to oversupply due to low
entry barriers in the industry e.g. the collaboration between HDIs or firms and historically
advantaged individuals (HAIs) or firms. This appears to be an indication of diversification in the
operations of established contracting firms. In addition, it could be an indication of a solution to
the problem of integration between the two sectors (formal and informal) in the construction
industry.
In order to remain competitive, established contractors, who were previously advantaged, have
had to adopt business strategies which enable them take advantage of preferential procurement
policy, which has prioritised the empowerment of the HDIs. This reality must also be managed
with the consciousness of the country securing the hosting rights for the 2010 FIFA world cup.
The FIFA hosting right, has singularly attracted foreign contracting firms into the country,
competing for projects. It is therefore not strange that the use of more flexible contractual
practices (such as joint ventures, concessions, partnerships, etc) by contracting firms in South
Africa is an indication of some level of diversification in the operations of established
contractors.
For these established contractor, it had become imperative to adopt innovative business
management techniques which would improve their effectiveness and efficiency; develop
strength in core business areas; and build and maintain competitive advantage in order to
achieve a reasonable level of financial performance and growth for all stakeholders.
Governments in many parts of the world have gradually withdrawn their active participation in
the provision of housing and infrastructure but have employed innovative procurement
arrangements which would enable national development objectives to be achieved in a rapid
manner without undue and unsustainable strain on public financial resources. These innovative
approaches are now gaining wider acceptance and better popularity in other parts of the world
(Ofori and S.M Chong, 1994). Recent tender advertisements in South Africa, calling for Public
Private Partnerships (PPP) in the provision of housing and transport infrastructure attest to this
assertion. It is a matter of time before these procurement approaches, including others such as
build-operate-and-own and build-operate-and-transfer, become the norm in infrastructure
development in South Africa. It is therefore necessary for contracting firms to be prepared in
their business operations and strategies.

6
1.2 Need for the Study
Many factors have contributed to the need for contractors to be more competitive and diversified
e.g. the ease of registering a business entity; the easy and frequent entry of many emerging and
multinational firms into the industry; and dynamism and high competition in the industry. In a
personal communication with Mr. Henk Langenhoven, the executive director of the South
African Federation of Civil Engineering Contractors (SAFCEC), Merrifield (1999) wrote that
tender lists on civil engineering projects alone indicated the presence of more than 4,000 new
tendering entities between 1998 and 1999 alone. This could serve as an indication of the
number of new entrants and the level of competition that exists in the industry. Possibly, the
challenges faced by construction firms in general, especially in terms of survival, business
growth and competition for market share in the industry could be solved by diversification.
Diversification is defined by Pearce and Robinson (2000) as a firm’s distinct departure from
existing operations through acquisition or internal establishment of separate business that are
able to provide synergy with the original firm by counter-balancing strengths and weaknesses of
the two businesses.
In their article on the issue of diversification around a firm’s core business (concentric
diversification), Rijamampianina, Abratt and February (2003) remarked that diversification is one
solution to the challenge of sustainable business growth. Therefore, the consequences of
diversification can be observed for an individual firm with regards to long term financial
performance and growth.
Murray and Appiah-Baiden (2000) suggest that big construction companies in South Africa have
internationalized their operations by venturing into neighbouring countries, Central and West
Africa and in some cases, outside Africa. They attribute this decision to the decline in contracts
due to the Affirmative Action policy being implemented by the South African government. This
challenge (evidenced by shrinking market share) is presumably aggravated by high competition
from large foreign firms, on large and complex projects for which emerging contractors, due to
the nature of these projects (e.g. high technicalities, highly skilled human and financial
resources), are unqualified for. The influx of foreign contracting firms can be attributed to the low
entry barriers into the industry. Some of these foreign firms submit bids that are economically
unrealistic in order to achieve market penetration.

7
The diversification-performance relationship has been the focus of considerable research in
corporate strategy. In spite of the vast amount of research done, Ramanujam and Varadarajan
(1989), in an extensive review of research in this area, concluded that the findings of studies
attempting to demonstrate the effects of diversification on performance and growth remain
inconclusive. Rumelt (1974) concluded that diversified firms in general, and related diversifiers
in particular, outperformed others. Similarly, Michel and Shaked (1984), and Montgomery and
Wilson (1986) concluded that firms diversifying into unrelated areas have been able to generate
superior performance over those with related businesses.
In contrast to the above, Capon et al. (1988) argue that since each market/industry require
different skills for success, firms that concentrate in one market area should have superior
financial performance. Their empirical tests with a sample of manufacturing firms support this
relationship. Hill and Hansen (1991) in their longitudinal study of the US pharmaceutical industry
found that diversification resulted in lower performance. Stimpert and Duhaime (1990) validate
the view that results of research in this area were conflicting after they studied firms
experiencing especially high or low levels of performance. Their findings revealed that the level
of diversification, in itself, does not have a significant effect on performance.
A research conducted by Palich, Cardinal and Miller (2000) developed three models to explain
the relationship that exists between diversification, financial performance and growth. The first
model, which is theoretical, is based on the premise that the level of diversification and
performance are linearly and positively related. The second model, a curvilinear model, with two
alternatives (inverted U and intermediate) recognise that moderate levels of diversification are
better than none, but vary in their forecasts of performance as firms move from related towards
unrelated levels of diversification.
The motivation above informs the need for an exploratory and country specific study to
investigate the relationship between diversification strategies employed by established
contracting firms in order to sustainably grow their businesses and maintain a competitive
advantage over sister firms, and the financial performance and growth that results from these
strategies.
In this study, undiversified or focused firms are firms which are registered for general building or
civil engineering works. Moderately diversified firms are those which are registered for either of

8
these two categories or both, and up to three categories of work. Highly diversified firms on the
other hand are those that are registered for either of the two categories and more than three.
These definitions apply only to level 9 contracting firms which are registered on the CIDB’s
register of contractors as at September 2008.
1.3 Aim and Objectives
The aim of the study is to investigate the relationship between diversification strategies adopted
by established contractors in South Africa and the financial performance and growth in these
firms due to these strategies. By investigating the relationship that exists between diversification
strategies and financial performance and growth, emerging firms will be provided with a tool that
will assist them in strategically steering their firms towards sustainable growth.
The following are the objectives of the study:
1. To classify all South African contracting firms on the CIDB (level 9) database based
on the categories of work registered for, using globally accepted diversification
categories.
2. To measure the financial performance and growth of each of the firms classified
above using robust financial indices.
3. To explore the relationships that exist between diversification and financial
performance and growth in order to determine the marginal growth differences
between undiversified, moderate and highly diversified established contracting firms
within the construction industry.
1.4 Limitation of Study
In this study, the effect of diversification on financial performance and growth was studied. The
study covered public and private contracting firms operating in the South African construction
industry, with at least five years of work experience in the country. The study researches firms
with at least five years of work experience so as to make reasonable inferences from the data
collected. The study did not seek information on other business activities that the companies are
involved in, apart from the works registered for, on the CIDB database. The study however
analysed all incomes, assets and investments, including non-construction interests reported on
the companies’ financial statements, where this is applicable. This study did not attempt to

9
differentiate between related and unrelated diversifiers among the sampled firms. It is limited to
investigating the relationship between diversification strategies and financial performance and
growth but does not provide models for predicting the likely outcome of future diversification
decisions.
1.5 Research Question
The study seeks to find an answer to the research question: Does diversification bring about
better financial performance and growth in established contracting firms in South Africa?
1.6 Research Hypothesis
Different researchers have either found support for different forms of the diversification-
performance and growth relationship, or have concluded that diversification has a negative or
no impact on performance. The relationship between diversification and financial performance
and growth remains an open-ended and inconclusive debate amongst scholars and business
managers.
The hypotheses for this research work, which take a cue from the linear model proposed by
Palich et al. (2000), are set as follows:
Hypothesis (H1): The financial performance of diversified firms is better than that of
undiversified ones
Hypothesis (H2): The financial performance of established contracting firms (undiversified,
moderately diversified and highly diversified) is linearly related to their diversification
strategies.
1.7 Research Methodology
A thorough review of literature was undertaken in order to develop the theoretical framework for
this topic. As a result of distinct sample sizes from the target population (i.e. level 9 established
contractors) extracted from the CIDB database, a selective sampling method was adopted.
Level 9 firms were chosen because these firms have the organisational structure and resources
to diversify meaningfully. Each of the selected firms has had at least five years of work
experience in the construction industry in South Africa. Two different questionnaires
10
(Appendices B1 & B2) were designed and administered to senior management personnel of the
undiversified and diversified firms respectively.
Financial performance was measured using conventional ratios for growth and profitability i.e.
return on equity (ROE); return on total assets (ROTA); return on capital employed (ROCE); and
profit margin (PM). These measures have been used to measure firm performance in the
construction industry (Akintoye and Skitmore, 1991).
The data collected was analysed using computer-based statistical software Statistical Package
for Social Sciences (SPSS) and Microsoft Excel®. Relationship between diversification
strategies and financial performance and growth was explored. Profitability ratios of the firms
were compared (diversified and undiversified). A combination of parametric and non parametric
tests were carried out, based on the nature of the data collected.
Inferences drawn on the results of the analysis formed the basis for conclusions reached.
Finally, syntheses of the findings were done towards facilitating future direction in research and
management of diversification strategy in contracting firms in South Africa.
1.8 Benefits of Study
The results of the study may find relevance and application in other developing countries by
making necessary adjustments to accommodate disparity in experience, technology, peculiarity
and culture. The study will also serve the need of the emerging contracting firms in South Africa
and beyond which are planning for successful diversification or already in the process of
diversifying.
1.9 Structure of the Research Report
There are 5 chapters in this research report. Chapter 1 contains the background, need for the
study, aim and objectives, delimitation of study, research question and hypothesis, summary of
the research methodology and benefits of study.
Chapter 2 contains literature review on the subject, discussing definitions which are relevant to
the study e.g. nature of the construction industry, strategic assets and competitive advantage,

11
modes of competition in the construction industry, diversification, resource based views,
diversification and firm value, diversification strategies, directions of diversification, reasons for
diversifying, product diversification, international diversification, environment-specific influences
on diversification outcomes, and measure of firm performance and growth.
The third chapter explains the various research methods and procedures employed in the study.
The chapter discusses sampling design, categorization of samples, instruments used in the
study, scales of measurement, data types, data collection and data analysis.
The fourth chapter focuses on the analysis of data and interpretation of results. This chapter
records the results of the analysis of responses received from the questionnaires and the
outcomes of the analyses carried out on the financial data.
Chapter 5 comprises the summary of the study, conclusions reached from the findings,
limitations of the study, and recommendations for future study. The findings from the study are
tied back to literature in this chapter.

12
CHAPTER TWO: LITERATURE REVIEW
2.1 Introduction
‘The importance of studying issues in corporate strategy has been considerably affected by the
lack of clear-cut research results. The mixed research results reported over the years should
however not be allowed to diminish the importance of corporate strategy related decisions and
other strategic moves organizations make to diversify their activities’ (Mukherji, 1998). The lack
of clarity and incoherence of research results, it appears, has deprived business managers of
making informed and educated decisions on diversification strategies. Further, this challenge
should not lessen the importance of adequate planning before strategic decisions are made.
Arndt (2011) asserts that strategic management is simply the formation and sustainability of
competitive advantage. The reviews of literature on the subject of strategic management in the
construction industry reveal that the subject requires more attention and empirical studies. Kim
and Reinschmidt (2011) are of the opinion that this study area has recently gained some
attention.
Research into strategic management started in the 1960’s (Rumelt et al., 1994), with substantial
progress achieved between then and the time of this study. Strategic management in the
construction industry in particular, has not received much attention, despite other industries
such as biotech, finance, automobile, information technology, organizational sociology, political
science and cognitive psychology undertaking substantial studies in this area. Cheah and Chew
(2005) remarked that management studies, building on either empirical or anecdotal evidence
related to the construction industry appear to be lacking. Cheah et al (2004) suggests therefore
that the construction industry can learn and benefit from applying selected strategic
management concepts and tools that have been developed in other industries.
Strong development of the field of strategic management in the 1960’s in some western
countries has helped industrial corporations strive under diverse business environments
(Rumelt et al., 1994). But in contrast, the application of strategic management to construction
remains lacking (Chinowsky, 2000). The lack of interest in strategic management in the
construction industry, according to Cheah and Chew (2005), could be due to the following three
reasons;
13
1. “The fragmented nature of the industry and multiple-party contractual arrangements in
any given project procurement system. The complexities involved might have raised the
barriers for researchers of a more generalist nature to conduct insightful studies;
2. Construction is sometimes portrayed as a “low-growth, low-tech” industry, thus lessening
its appeal as a researchable context;
3. The relatively limited information available on individual firms, compared to other
industries such as pharmaceutical, adds to the difficulty of conducting management
studies on construction firms”.
There are six (6) schools of thought on strategic management, identified by Fellows et al.
(2003): strategic planning; strategy-structure; power-culture; competitive advantage;
instrumentalists and synthesis schools. This study focuses on diversification strategies
employed by established contracting firms and their relationships with financial performance and
growth. Therefore much of the discussion below is within the strategy-structure and competitive
advantage schools of thought, as they are the most applicable to the study.
The strategy-structure school proposed a hypothesis that the organizational structure of a firm
responds to its business strategy at any given point in time. This group of researchers believe
that business strategy, which is the process of formulating strategic plans and management,
cannot take place in a vacuum. Therefore, their conclusion that business strategy and
organization structure must be interrelated. The competitive advantage scholars believe that a
firm can attain a position of superior performance by rapidly developing strategic assets than its
competitors. This study, is an attempt to study the relationship between diversification strategies
and financial performance and growth in established contracting firms in the South African
context.
2.2 The Nature of Construction Industry
In a study undertaken by Cheah and Garvin (2004) which combined a study of 24 international
engineering and construction firms with established theories of strategy development introduced
a new conceptual model for corporate strategy in the construction industry. The study proposed
that seven strategic fields (business, operational, information technology, marketing,
technology, human resource and financial strategies) and two organizational mechanisms

14
(organizational structure and corporate culture) should function together with external dynamics
in order to improve strategic outlook of a construction firm. The management of construction
firms will need skills from these different strategic fields in order to achieve a successful
corporate strategy. This suggests that successful corporate strategy is a conscious and
deliberate amalgamation of various factors and aspects of an organization.
Construction business is inherently risky and highly competitive. Many of the projects in the
industry are secured through competitive bidding processes. Contractors have to compete with
their peers within the industry to secure projects. In order to submit competitive bids, contracting
firms sometimes have to reduce their profits substantially. The nature of the construction
industry is such that there are no certainties with respect to future projects. Construction firms
are not able to create demands for their products and services, unlike other sectors. Most of the
projects in the industry are by derived demand. Contractors only compete for available projects
in the market.
The risky nature of construction business compels contractors to have subconscious risk
attitudes, which informs their bidding decisions (Kim and Reinschmidt, 2011). Park et al. (2010)
identified factors such as the dynamic nature of the construction industry; fast pace of changes
in the global construction markets; and lowest price bidding as some challenges in the industry.
Ibrahim et al. (2009) emphasised that construction company executives face challenges in
making strategic decisions in a volatile and an uncertain construction market.
Kim and Reinschmidt (2011) concluded that the competition within the construction industry has
an impact on the profit margin of construction firms. In essence, the level of competition in the
construction industry has a consequence for financial performance and growth of contracting
firms.
Business enterprises employ the corporate strategy of diversification for growth and risk
management. Contracting firms may diversify their project portfolios in order to have a repertoire
of negatively correlated projects in order to form a balanced portfolio for business stability and
sustainability. For this reason, diversified firms may choose to secure projects in diverse
sectors. One may be right to assume that diversified firms should have a better chance of
survival than their undiversified counterparts. However, this needs to be empirically proven.
Chung and Cheah (2006) are of the opinion that diversified firms may have their portfolio

15
comprise of high-margin works in order to balance the ones with lower margin ones. They
further assert that as firms grow, they develop the capacity to shift their competitive strategy
from focus to broadly targeted. This claim is supported by Kim and Reinschmidt (2011) who
commented that larger firms tend to be more diversified than smaller ones. They opined that
diversified strategy would benefit such diversified firms since it would lessen the risk of
fluctuating business cycles experienced by an undiversified firm.
To further buttress the portfolio strategy used by construction firms, Ravanshadnia et al. (2010)
explained that a single project held in isolation has a different risk profile to the same project
held in a portfolio. It is understood that the management of construction firms do carry out
periodic portfolio selection sessions. The selected portfolio of projects is expected to serve the
strategic objectives of the organization, while keeping a balance among available capacity,
resources and project commitments.
2.3 Strategic Assets and Competitive Advantage
Markides and Williamson (1994) demonstrated that firms that compete across markets where
certain types of strategic assets are important outperform the ones that compete where these
strategic assets are less important. The study further argued that if a competing firm could
purchase a strategic asset in an open market, it would not have competitive advantage over its
competitors for long, as they would quickly achieve similar market position by acquiring such an
asset.
Wiggins and Ruefli (2002) defined competitive advantage as a capability (or set of capabilities)
or resource (or set of resources) that gives a firm an advantage over its competitors, which,
ceteris paribus, leads to higher relative performance. According to Porter (1980), a firm should
be able to offer customers a set of benefits at lower cost which its rivals cannot match, to have a
competitive advantage in any market. Barney (1986) and Dierickx and Cool (1989), remarked
that strategic assets on which long term competitive advantage critically depend are those that
are imperfectly imitable and imperfectly substitutable. A deduction can then be made that readily
tradable assets are not strategic assets and therefore cannot act as sources of long term
competitive advantage for a firm.

16
According to Smallbone et al. (1995), the following are categories of strategic assets; customer
assets (brand recognition, customer loyalty and installed base); channel assets (established
channel access, distributor loyalty and pipeline stock); input assets (knowledge of imperfect
factor markets, loyalty of suppliers and financial capacity); process assets (proprietary
technology, product or market-specific functional experience and organizational systems) and
market knowledge assets (accumulated information on the goals and behaviours of competitors,
price elasticity of demand or market response of the business cycle).
Creating strategic assets, it seems, is not an end in itself, as the long term competitive
advantage market position of a firm depends largely on its ability to continuously improve and
adapt its strategic assets to meet market-specific demands and to create new strategic assets
that it can exploit in existing or new markets. One could reasonably infer that strategic assets
are the building blocks of competitive advantage, which consequently results in higher economic
performance and growth, in a normal market environment.
Barney (1991) and Conner (1991) have speculated that factors that sustain competitive
advantage will generate superior economic performance that persists over time. Jacobson
(1992) and Brown and Eisenhardt (1997) assert that temporal dynamics, resulting from factors
such as imitation, entry and the introduction of substitutes will erode almost all competitive
advantages and thus prevent superior economic performance from persisting.
Ofori and Chan (2000) wrote that persistent superior economic performance has been argued
theoretically and found empirically to be rare. Result of a study of 6,772 firms in 40 industries,
over a time period of 25 years has shown that only a very small minority exhibit superior
economic performance and it rarely persists for a long time. This reinforces the need for firms to
continuously build and create new strategic assets which respond to market demands in order
to remain competitive and operate at an advantage over rival firms.
Competitive advantages include cost or differentiation advantage (Porter, 1985); physical capital
(Williamson, 1975); human capital (Becker, 1964); technological opportunities and learning
(Teece, 1986); Organizational capital (Tomer, 1987) and institutional context (Oliver, 1997).

17
Wiggins and Ruefli (2002) however, concluded in their study that sustained superior economic
performance is rare. They cautioned that superior economic performance and growth can only
be achieved by skilfully implemented business strategies.
2.4 Modes of Competition in the Construction Industry
Competitive advantage is a position of superior performance which can be attained through cost
leadership, differentiation or focus strategies (Porter, 1985). Modes of competition refer to a
firm’s method of developing competitive advantage. Cheah et al. (2007) developed a conceptual
model which showed that competitive strategies, important resources and competences (IRCs)
represent two major sources of competitive advantage for the Chinese construction industry.
Porter (1980) listed cost leadership, differentiation and focus as competitive strategies. He
further explained that cost leadership entails management’s focusing its attention on competing
on cost. Cheah et al. (2007) listed the following as components of cost leadership strategy for
construction firms: procurement costs of materials and equipment, manpower costs, costs
during construction, administrative costs and subcontracting costs. According to Cheah et al
(ibid), the differentiation strategy is concerned with creating something that is perceived by the
buyers as unique. Components of differentiation strategy could include having a good
reputation, involvement with high quality projects, use of advanced technology, building
relationships and connections and being involved in project financing. This seems to be the
preferred strategy for large and influential companies with more resources and competences.
They prefer to adopt differentiation strategies to secure revenue and profit growth, rather than
the cost leadership strategy. A focus strategy implies that a company would compete on only
limited functions or market segments. This relates to the breadth of developing competitive
advantage. According to Cheah (2002), the focus strategy is divided into three dimensions:
market or product, geography and function.
In construction, the market or product dimension would mean the type of project that the firm
would want to be involved in. This could mean focussing on a specific type of projects. For
instance, construction of residential or commercial buildings, civil structures, infrastructure
projects, etc. The dimension of geography relates to the geographical area that the firm would
want to compete in. This could mean diversification into different domestic, regional and
international markets, depending on the economic benefits in doing so. The dimension of
function relates to vertical integration of different functions within a value system. For a
18
contractor, this could mean backward vertical integration into the functions of engineering
design, construction materials, equipment or forward vertical integration into real estate
development and project financing (Cheah et al, 2007).
In their study of five competitive strategies (cost leadership, differentiation, market or product,
geography, and vertical integration), Cheah et al. (ibid) discovered that only differentiation and
market or product could contribute directly towards the competitive advantage in terms of
revenue and profit growth. The study suggests that market or product competitive strategy helps
to reduce business risks which are faced by firms competing with focus strategy, which target
only one market segment. In the study of IRCs (relationships and connections, project
management competencies, financial capabilities, technological and innovative capabilities and
reputation), only financial capabilities, technological and innovative capabilities and relationships
and connections significantly contribute towards competitive advantage in terms of revenue
growth.
2.5 Diversification
A diversified firm can be considered as one having operations in more than a single industry.
Some scholars believe that these operations must be in synergy for diversification to be
meaningful. Ofori and Chan (2000) identified diversification as one of three business growth
paths (apart from concentration and acquisition). There appears to be two schools of thought
on the subject of diversification strategy as it relates to financial performance and growth of a
firm; industrial organization and strategic management group (Palepu, 1985):
a. Schools of thought (e.g. Gort, 1962; Arnould, 1969 and Markham, 1973) which conclude
that there is no significant relationship between diversification strategy and a firm’s
financial performance and growth.
b. Schools of thought (e.g. Rumelt, 1974; Rumelt, 1982, Montgomery, 1982; and
Christensen and Montgomery, 1981) which conclude that a systematic relationship
exists between a firm’s diversification strategy and financial performance and growth.
2.5.1 Diversification, financial performance and growth
There are inconclusive arguments on the subject of performance and growth as it relates to
diversified and undiversified firms. Some earlier studies claim that specialized firms outperform

19
diversified ones. Hill and Hansen (1991) found out in their study within the pharmaceutical
industry in the US that undiversified firms performed better than diversified ones.
Hitt et al. (1996) alleges that the lower performance of diversified firms is partly due to less
innovation in diversified firms, especially those that have diversified through acquisition. Hall
(1990) demonstrated that firms with low research and development (R&D) investments are
more likely to diversify than firms with higher R & D expenditures. It is note-worthy that reduction
in R&D could be a strategic action, and not an inefficient investment. Perhaps a lack of
innovative ideas could lead to less investment in R&D by firms.
From previous studies, higher levels of diversification increases managerial, structural and
organizational complexity, incurs greater coordination and integration costs, strains top
management resources (Grant et al., 1988); limits organizational attention (Ocasio, 1997) and
inhibits firms’ ability to respond to major external changes (Donaldson, 2000).
Diversification inefficiencies also arise from conflicting dominant logistics between businesses,
internal capital market conflicts, increased control and effort losses due to shirking (Markides,
1992). Graham, Lemmon and Wolf (2002) claim that diversification through acquisition
introduces changes in accounting that could cause bias or influence performance results. On
the issue of poor financial performance and growth, Miller (2004) explained that many
diversifying firms have inferior financial performance prior to diversifying. It also emerged from
the same study that performance trends before diversification – either positive or negative,
persists, even after diversification. The findings support the claim that the performance
problems of diversification would have been inherent in the firm before a diversification move.
Palich et al. (2000) on the other hand suggests that focused firms are unlikely to generate
above average profit. They are of the opinion that focused firms cannot exploit between-unit
synergies or ‘the portfolio effects’ which are available to moderately or highly diversified firms.
Their study was an attempt to bring a degree of clarity to the diversification-performance
literature by reviewing, critiquing and synthesizing three decades of research into this linkage.
There are three theoretical models established during the review.
i. Linear Model
The linear model is based on the assertion that diversification and performance are linearly and
positively related. This assumption is founded on market power theory; such as predatory

20
pricing, reciprocal buying and selling; and internal market efficiency arguments; cross-
subsidization of business units and access to internal capital market and critical resources. The
assertion under this model is that the more diversified a firm is, the more it can build and
develop market power advantages over rivals. Under this model, the tax benefits of
diversification and the possibility of exploiting resources that would have been non-performing
are noted.
Curvilinear Models
The research claims that a number of researchers have postulated theory that could be
interpreted as a curvilinear relationship on the diversification-performance linkage. The
curvilinear models support the assertion that higher levels of diversification may not be
accompanied by higher financial performance. The curvilinear models are briefly explained
below:
ii. Inverted U Model
The study revealed that moderate diversification yielded better performance than lower and
higher levels of diversification. Therefore, the curvilinear model supports the claim that
performance increases as firms shift from single business strategies to related diversification,
but performance decreases as firms change from related diversification to unrelated
diversification.
An earlier study, Markides (1995) wrote that as much as 50% fortune 500 firms were refocusing
in the 1980s. Denis et al. (2002) wrote that increased competition has forced companies to
focus on their core lines of business. These assertions seem to support the notion that focused
firms may have superior performances than diversified ones.
iii. Intermediate model
The intermediate model of Palich et al (2000) which purports that diversification yields positive
but diminishing returns beyond some point of optimization, supports a study by Markides (1992)
which claim that as a firm increases in diversification, it moves further away from its core
business, and the benefit of diversification at the margin declines.
Inverted U and intermediate models of curvilinear relationship between diversification and
performance and growth posit that a moderate level of diversification is better than none, but
21
they differ in their predictions of performance as firms move toward higher levels of
diversification.
Although most of the results of the test in the study support an inverted U pattern, caution and
careful industrial studies should be undertaken in order to make sense of diversification-
performance and growth relationships, as the subject seems to be industry or environment-
specific. Indiscriminate use of heterogeneous data from multiple industries may produce
misleading research results on the subject. Industry effects and cross sectional studies that do
not adjust for industry effects may bias the findings of the diversification-performance
relationship.
2.6 The Resource Based View (RBV)
The resource based view (RBV) theory is a dominant theory which challenges the subject of
diversification. The RBV states that resources owned by a firm forms the basis of its strategy
and constitute the determinants of its competitive advantage. According to Theuven (2004),
RBV is a theoretical approach in the field of strategic management that considers strategies like
diversification or vertical integration as a way of finding new uses for existing resources or of
filling gaps in an organization’s resource base.
Andreu et al. (2008) remarks that the perspective of the RBV is that the growth of a firm requires
a balance between the exploitation of existing resources within a firm and the development of
new ones. A firm’s decision and its future success depend on the specific characteristics of the
resources available to it.
2.7 Diversification and Firm Value
Denis et al (2002) claim that on average, diversified firms are valued at a discount when
compared to undiversified ones. This assertion stems in part, from inefficient investment policies
by diversified firms. It is a general belief that these poor investment decisions benefit corporate
managers, many of whom are more interested in building increased power and prestige for
themselves rather than protecting shareholders’ investments.
Jensen (1986), an agency theory researcher, claims that poor financial management which
allows managers to finance acquisitions from free cash flows remains an agency problem. Tosi

22
et al. (2000) remarked that managerial compensation and incentives are tied to firm size rather
than performance, which influences bad investments by managers. Miller (2004) advised that
agency problems related to innovation can be reduced by active, institutional owners. His study
alludes to an agency theory that managerial decisions about risky investments are usually
aligned with the governance provided by boards, incentive contracts and active shareholders.
Lamont and Polk (2001) in their study concluded that diversification destroys firm value. Miller
(2004) went further to ask the question whether a diversified firm creates more value than an
undiversified one, if it had not diversified at all. Villalonga (2002) argues that it may not be the
act of diversification that destroys value, but the underlying trait that determines diversification
and economic performance and growth.
Matsusaka (2001) investigated value-adding strategy in diversification, revolving the notion of
organizational capabilities. His view is that a firm consists of organizational capabilities, i.e. skills
and abilities of top and middle management, which are to some degree transferable across
products and industries. He claims that firms would rather apply these recourses to new
products or industries than to go out of existence. Since it is uncertain and challenging to find a
business that matches the organizational capabilities, diversification effort therefore becomes a
trial and error or experimentation. He submits that diversified firms trade at discounts because
they do not have a good match for their organizational capabilities.
Doukas and Lang (2003) revealed that Foreign Direct Investment (FDI) outside the core
business of a firm are associated with a loss in shareholder value, whereas the core-related FDI
are found to be value increasing. The study, however warned that such corporate activities
might lead to diversification discount on firm value, if care is not taken.
2.8 Diversification Strategies
There are two types of diversification strategies identified in the literature on the subject - related
and unrelated diversification. Relatedness in this regard translates to the fit between the existing
operations of a firm and the diversified operations (Choi and Russel, 2004).
Related diversifiers are involved with various businesses that can take advantage of a common
pool of corporate resources (Nayyar, 1992). In essence, related diversifiers run a portfolio of
businesses that enhance operational synergies and are mutually benefitting.

23
Gary (2005) warns that a diversification effort could fail, despite substantial opportunities for a
firm, if not properly implemented. He further emphasizes the need to properly manage the
implementation strategy and process mechanisms.
2.8.1 Modes of diversification
Pawaskar (1999) identified two ways by which diversification could be achieved in an enterprise;
internal capacity expansion or mergers and acquisitions. In essence, mode of diversification is
the extent to which a firm relies on internal business development relative to external
acquisitions or mergers as a means of venturing into new business activities (Ramanujam and
Varadarajan, 1989).
2.9 Directions of Diversification
2.9.1 Vertical integration
Fan and Lang (2000) stated that two businesses are vertically integrated if one can employ the
other’s products or services as input for its own production or supply output as the other’s input.
A vertically integrated company would provide a set of services or goods through its business
units (in-house) in a single value chain. In this instance, integrated firms will transfer all of their
relevant goods and services to adjacent, in-house business units.
A construction firm will be said to be vertically integrated if, for instance, it provides in-house
engineering design or real estate services. Vertical integration is a decision in a make-or-buy
situation. Roger (2001) alleged that firms may favour vertical integration when the cost of relying
on the market is higher than in-house production. Firms sometimes make this move in order to
reduce uncertainty in their business environment.
2.9.2 Horizontal integration
Horizontal integration results when a firm merges with another one in the same market, or when
a firm diversifies into a market related to its existing business due to the existence of common
types of outlets or because of common resources, or when a firm diversifies into a totally
unrelated business.

24
This definition of horizontal integration suggests that a construction firm acquiring a ready-mix
concrete or brick-making business can be said to be involved in horizontal integration. Makarfi
(2005) believes that horizontal integration is undertaken to increase the stability of profits by
spreading risks or reducing the proportion of high risk businesses in the portfolio of a firm. In
addition, a firm could diversify horizontally to compensate for barriers to expansion in existing
markets and to take advantage of the outcome of an unanticipated occurrence in the business
(Hillebrandt and Cannon, 1989).
2.10 Reasons for Diversifying
One of the main objectives of a business is to make profit and increase the value of the
shareholders’ investments. Miller (2004) suggests that diversification could be an option for
failing firms in the sense that a diversifying firm can apply existing resources and/or knowledge
into the production of other products or industries.
Pawaskar (1999) concludes in his study that diversification, which could be through internal
capacity expansion or external expansion by merger and acquisition, is essentially a means of
growth. According to Rijamampianina (2003), firms diversify for the following reasons; increased
stock value of the firm; increased growth rate of the firm; better use made of funds than internal
investment; revenue growth; improved stability of earnings; increased efficiency and profitability.
Chakrabarti et al (2007), in their study conducted on 3,117 firms across six Asian countries, in
different institutional environments, claim that diversification could be driven by a range of
perceived benefits; greater market power; more efficient allocation of resources through internal
capital markets; utilization of excess productive factors; more efficient utilization of existing
resources in new settings, or reduced performance variability by virtue of a portfolio of
imperfectly correlated set of businesses.
2.10.1 Conditions for successful diversification
Two critical factors have been highlighted to affect a firm’s success. One is initial conditions,
noted by Levinthal and Myatt (1994), and the other is the importance of core competencies and
strategic assets (Markides and Williamson, 1996).
Core competencies are the pool of experience, knowledge and systems, etc. that exists
elsewhere in the same corporation and can be deployed to reduce the cost or time required to

25
either create a new strategic asset or expand the stock of an existing one (Markides and
Williamson, 1994).
In his studies on the relationship between prior successful performance and diversification,
Mukherji (1998) conclude that industries with prior high performance tend to have successful
diversification. He established that firms in this category consistently out perform firms from
lesser performing industries, whether they were diversified or undiversified.
According to Duhaime and Stimpert (1994), other variables influence performance and growth in
a diversified firm, such as industry profit levels, expenditure on research and development,
capital outlay and efficiency levels. Mukherji (1998) asserts that the most important factor in
diversification is the strategic relatedness between assets and competencies and the ability to
create and sustain competitive advantage through these two.
While individual firms do not have control over industry performance, it appears that initial
business conditions influence the outcome of diversification. The implication is that
diversification move alone may not be the way to solve the problem of poor performance.
Mukherji (ibid) claims that the creation of competitive advantage through acquisition of strategic
assets, development of successful routines and possession of core competences are
prerequisites for a successful diversification effort.
In essence, the success of diversification efforts not only depend on industry performance, but
on the firm’s capability to master other variables internally. It could be reasonably inferred that
successful performance is as a result of initial favourable conditions and continuous
development and proper management of strategic assets and core competencies.
The line of argument being built here is that early success has a decisive impact on a firm’s
continued economic performance and growth, and that diversification efforts of successful firms
are likely to be significantly different when compared to those of poorly performing firms.
This suggests that a firm needs to first be successful in its current operations, i.e. have
favourable initial conditions, own sufficient strategic assets, possess core competencies, and
create conditions of competitive advantage before it can achieve success in diversified business
26
activities. Therefore, diversification exercise from a position of weakness is likely to be rewarded
by lower levels of success in new businesses.
2.11 Product Diversification
Heinrich (2001) wrote that product diversification is one of the most difficult ways to expand a
corporate enterprise. This, he attributed to the challenge of choosing new product lines that
would enable the diversifying firm to branch into new markets that would bring value to the
company in order to achieve economic performance and growth.
Any kind of diversification effort (internal capacity expansion, merger or acquisition) involves
considerable investment. Diversification requires a firm to change its structure and mode of
operation (central to a decentralized system), as the new product would require expertise that
lies beyond the purview of the traditional management system (Rumelt, 1986). This will further
reduce head office costs.
In the construction industry, possible construction related products include civil engineering,
building, property development, estate development and construction product development
(Langford and Male, 2001). According to Hillebrandt and Cannon (1990), construction firms are
involved in activities such as time share, form work, healthcare, waste disposal, mechanical and
electrical engineering and mining. Hillebrandt (1996) further identified material production and
housing development as some activities into which large construction firms were involved.
Failure to adjust management structure to suit diversification strategy has caused the failure of
many promising diversification efforts. Heinrich (2001) cautions that traditional marketing
techniques could be a failure when used for diversification. If not well planned, corporate
structure of diversified firms could create constraints on capital flow and allocation for other
divisions of diversified firms.
2.12 International Diversification
Capar and Kotabe (2003) defined international diversification as a firm’s expansion beyond the
borders of its home country across different countries and geographical regions. In their study of
international diversification and performance of firms from four industries in Germany -
retail/wholesale, utility, information technology services and tourism, Capar and Kotabe (ibid)

27
stated that international diversification is a growth strategy employed by firms. They claim that
service and manufacturing firms undertake international diversification for similar reasons –
reduced labour costs, market access and resources, among others. It is yet to be tested or
proven if construction firms do diversify internationally for the same reasons.
Buhner (1987) suggests that international diversification offers prospective market opportunities
for greater growth, in addition to the benefits of internalization in international markets, such as
economies of scale, scope and learning and sharing core competencies among different
business segments and geographic markets (Hamel, 1991).
Internationalization is believed to lead to exploitation of tangible and intangible resources which
is expected to lead to higher economic performance and growth, Hymer (1976). It is a known
fact that multinational firms, with greater bargaining power due to increased size, exploit market
imperfections such as less competitive environment and cross-border transactions when they
diversify internationally.
It has been argued that higher levels of international diversification, especially combined with
product diversification and expansion into markets that are physically and culturally distant,
greatly enhances transaction costs and information processing demands (Erramilli, 1991; Hitt et
al., 1994).
Factors such as logistics, trade barriers and cultural diversity are likely to increase the cost of
operations in a firm that is internationally diversified. Environmental factors such as government
regulations, trade laws and currency fluctuations contribute to the complexity of their operations.
Doukas and Lang (2003) presents evidence that geographic diversification increases
shareholder value and improves long-term economic performance and growth, when firms
engage in core-related foreign direct (Greenfield) investments. The same study states that non-
core-related foreign investments are found to be associated with both short-term and long-term
losses. The study applauds the purchase of foreign assets, formation of joint venture, alliances
and partnerships in pursuit of international diversification.

28
Graham et al. (2000) however warns that purchase of foreign assets may be associated with
poorly managed assets and that joint ventures and alliances may involve poor performers, to
the detriment of the diversifying firm.
The study alludes that removal of cross-border restrictions on international capital flows
(globalization) has increased the growth of FDI activity. Also, the relaxation of capital controls by
many nations has stimulated cross-border investments.
2.13 Environment-Specific Influences on Diversification Outcomes
Questions about the effect of country differences on antecedents and consequences of firm
diversification outcomes might have been raised by strategy research in different market
economies (Chang and Hong 2002; Hoskisson et al., 2000; Wan and Hoskisson, 2003).
Chakrabarti et al (2007) in their study found positive outcomes in underdeveloped institutional
environments and negative in developed institutional environments. This might lead to an
argument on the resource capacity of firms in less developed institutional environments to
undertake and manage the complexities associated with diversification, which are considered to
lack managerial talent, financial and information efficiencies. The study also revealed that
diversification does not generally alleviate the impact of an economy-wide shock on
performance and neither does it provide substantial spreading of risks benefits for firms facing
systemic or economy-wide shifts in economic conditions.
The results of the study made it apparent that the outcomes of diversification efforts are
dependent on stability in the economic environment. The study concludes that outcomes of
diversification are influenced by institutional environments, economic stability and business
group affiliation.
Kogut et al. (2002) remarked that nation-specific conditions may prevent convergence on
specific diversification outcomes. Ahmadjian and Robbins (2005) and Guillen, (2001) believe
that institutional and country heterogeneity will persist on the study diversification. Aoki (2001)
and Peng (2002) are of the opinion that closer attention to contextual, institutional and country
characteristics is required.

29
One could then propose that diversification strategy study should be contextualised in future
researches. It is however not clear if strategy research has improved managerial understanding
of firm specific, complex and conditional issues that influence business decisions.
2.14 Measure of Firm Performance and Growth
Construction contractors can be distinguished by factors such as the size of annual turnover,
capacity and capability. Ofori and Chan (2000) are of the opinion that the best strategy for an
enterprise is dependent on the company’s performance, strengths, weaknesses and
opportunities and threats in its specific environment. These variables are bound to change with
time, as the company undergoes different stages of development.
Greenley (1989) wrote that growth can be achieved in a number of ways such as internal
resources and personnel development, external acquisition, merger, joint venture and other
strategic alliances. Financial growth can also be achieved by improving efficiency, financial
control and increasing turnover. Construction firms usually look into other areas of activity in the
value chain in order to improve their performance. This may be the reason why some
construction firms venture into other areas in the industry, such as property development to
grow their business.
Firm economic performance and growth could be measured on the basis of assets, corporate
turnover, share prices, sales revenue, volume of output, share of market, profit, number of
employee and branches and extent of geographical spread.
Financial statements on their own are of limited use, they need to be interpreted in order to gain
additional information from them. There are variety of ratios that could be calculated, depending
on the need of the user of such information. In the interpretation of financial ratios, the following
group of ratios could be calculated; profitability ratios; liquidity ratios; long term financial stability
ratios and investor ratios.
This study is limited to the calculations and analyses of return on equity (ROE); return on total
asset (ROTA); return on capital employed (ROCE) and profit margin (PM). These ratios
measure a firm’s use of its assets and control of its expenses to generate an acceptable rate of

30
return. These measures have been employed by researchers such as Akintoye and Skitmore
(1991) and Ibrahim and Kaka (2007), among others to assess firm performance.
ROTA: It is also called net asset turnover. This is the ratio of sales revenue to the capital
employed (net assets) and is expressed as the following:
%100assets)(net employed Capital
revenue SalesROTA times per annum (ACCA, 2008)
or
100assets totalAverage
taxand charges finance beforeProfit ROTA (Sowden-Service, 2009)
ROE: This is the ratio of net income (income available to common stockholders) to
stockholders equity. It is a measure of company performance from the viewpoint of
shareholders. It is essential in the calculation of the ROE to use the profit for ordinary
shareholders, which is the profit after tax and after interest charges (Weetman, 2003). It
is expressed as:
%100Reserves Capital Share
TaxAfter Profit
ROE (Weetman, ibid)
or
%100equity rs'shareholdeordinary Average
dividends preference andafter tax Profit ROE (Sowden-Service, 2009)
PM: This ratio is also called operating profit margin. It is the ratio of profit before interest
and tax (PBIT) to sales revenue. It is calculated as:
%100revenue Sales
Tax andinterest beforeProfit )( netPM (ACCA, 2008)
or
%100salesNet
taxand charges finance beforeProfit )( netPM (Sowden-Service, 2009)
ROCE: This is the ratio of profit to capital employed. It is expressed as :

31
%100employed Capital
Profit ROCE (ACCA, 2008)
or
%100employed capital Average
tax and charges finance beforeProfit ROCE (Sowden-Service, 2009)
ROCE for the current year should be compared to; ROCE of the prior year; a target
ROCE; the cost of borrowing; other companies’ ROCE in the same industry.
Please note:
Capital employed = Shareholders’ equity + Non-current liabilities
or
Capital employed = Total assets – current liabilities.

32
CHAPTER THREE: RESEARCH METHODOLOGY
3.1 Introduction
This chapter sets out the various statistical methods undertaken in the study. Effort was made to
explain and justify the appropriateness of the statistical procedures used. Though effort was
made to obtain the required information from each sampled firm which met the criteria for final
selection requirements, the firms whose information are used in the study are those which
responded to the questionnaire and made requested financial data available for the study.
This chapter starts by explaining the sampling design adopted for the study and how the final
sample firms were selected after some conditions were applied, in order to achieve the
objectives of the study. These included consolidation of the original list of level 9 contractors on
the CIDB register, applying the minimum requirements that must be met before a firm could be
selected and further categorization of sample firms. The basis for further categorization of the
firms is explained and the reasons for constraint on geographical area for the study are also
stated. Assumptions are listed, explained and justified. Definitions of terms and concepts are
given and further explanations stated where considered important.
3.2 Sampling Design
A sample is defined by Cooper and Schindler (2008) as part of the target population, carefully
selected to represent that population. The basic idea of sampling is that by selecting some of
the elements in a population, we may draw conclusions about the entire population.
The global population for this study comprises all registered contracting firms registered on the
register of contractors of the CIDB, as at September 2008. The target population are registered
level 9 contracting firms. Level 9 contracting firms on the CIDB register of contractors are the

33
highest class of contracting firms in South Africa. These firms have no limits on the value of
projects they can undertake. They are considered to have the organizational structure, human
capital, strategic assets and the financial resources to be able to diversify meaningfully.
As at the said date (September 2008), there were 83 registered entities on the CIDB as level 9
contracting firms. Please refer to Appendix D1 for the list of level 9 contracting firms. It was
discovered that some level 9 contracting firms registered different business units on the same
register. This was considered a duplication of data and potential source of error on the study.
The initial list of 83 was therefore consolidated into 48 in order to address this challenge. Please
refer to Appendix D2 for the consolidated list of level 9 contracting firms for details. The
consequences of this consolidation were accordingly addressed in the analysis done on
financial statements of the affected firms. The 48 firms were later reduced to 17 after some
other conditions were applied to select the final study sample group (see section 3.2.1).
3.2.1 Sample selection process
The composition of the CIDB register of contractors lends itself to the stratified sampling
method, which is adopted in this study. This approach involves stratifying the population into
mutually exclusive sub-populations or strata (see Table 3.1 for a summary of sampling
methods). The approach is useful when studying characteristics of certain population sub-
groups, which in this particular circumstance, is the established contracting firms on level 9.
According to Leedy and Ormrod (2005), stratified random sampling has the advantage of
guaranteeing equal representation of each of the identified strata. This assertion should
however be tested in future studies on this subject.
The CIDB register is in different strata (levels 1-9). Therefore, by choosing level 9 contracting
firms, the study employed the stratified sampling method for the first selection of the target
population. Within the selected stratum, other conditions for selection which were further applied
were:
A firm must have a minimum of five years’ work experience in the construction industry
in South Africa;
a firm must be actively operating its business in South Africa;
a firm must have an administrative office in South Africa;
a firm must have its head office in Gauteng, South Africa.

34
These conditions were applied to ensure that the study focused only on firms which are actively
operating in the construction industry and have physical presence in the country at the time. The
study was restricted to Gauteng because it is the nerve centre of economic activities in South
Africa. Furthermore, constraints on time and resources had their impacts on the decision to
keep the study within the Gauteng Province. Since most of the data for the study would
eventually have been publicly published by the head offices of these firms, the criteria listed
above are justified. After these criteria were applied, the firms sample size reduced from 48 to
17 entities.
3.2.2 Selection of respondents within sample firms
The selection of the representatives of the sample firms was not according to a particular
formulated process. However, the principle of the approach was consistent. The Gauteng
headquarters of the final list of sample firms were first approached via telephone calls. This was
done to inform the firm that there was a research being undertaken at the University and that
some form of assistance was needed with respect to data.
The experience was that the staff member responding to the call asked few questions about the
study and clarified what specific information was needed for the research. At this stage, verbal
responses were provided by the student. The personnel then requested for the questionnaire to
be sent via an electronic mail or a fax line. The staff member took it upon him or herself to get
the questionnaire completed by a representative best qualified to do so. This was then followed
by several follow-up phone calls until the requested information was made available by the
organization.

35
Table 3.1: Comparison of probability sampling designs
Source: Copper and Schindler (2008)
Type Description Advantages Disadvantages
Simple random Each population element has an equal chance of being selected into the sample. Sample drawn using random number table/generator.
Easy to implement with automatic dialing (random digit dialing) and with computerized voice response systems.
Requires a listing of population elements. Takes more time to implement. Uses larger sample sizes. Produces larger errors. Expensive.
Systematic Selects an element of the population at a beginning with a random start and following the sampling fraction selects every kth element.
Simple to design. Easier to use than the simple random. Easy to determine sampling distribution of mean or proportion. Less expensive than simple random.
Periodicity within the population may skew the sample and results. If the population list has a monotonic trend, a biased estimate will result based on the start point.
Stratified Divides population into sub-populations or strata and uses simple random on each strata. Results may be weighed and combined.
Researcher controls sample size in strata. Increased statistical efficiency. Provides data to represent and analyze sub-groups. Enable use of different methods in strata.
Increased error will result if sub-groups are selected at different rates. Expensive. Especially expensive if strata on the population have to be created.
Cluster Population is divided into internally heterogeneous sub-groups. Some are randomly selected for further study.
Provides an unbiased estimate of population parameters if properly done. Economically more efficient than simple random. Lowest cost per sample, especially with geographic clusters. Easy to do without a population list.
Often lower statistical efficiency (more error) due to sub-groups being homogenous rather than heterogeneous .
Double (sequential or multiphase)
Process includes collecting data from a sample using a previously defined technique. Based on the information found, a sub-sample is selected for further study.
May reduce costs if first stage results is enough data to stratify or cluster the population.
Increased costs if used indiscriminately.
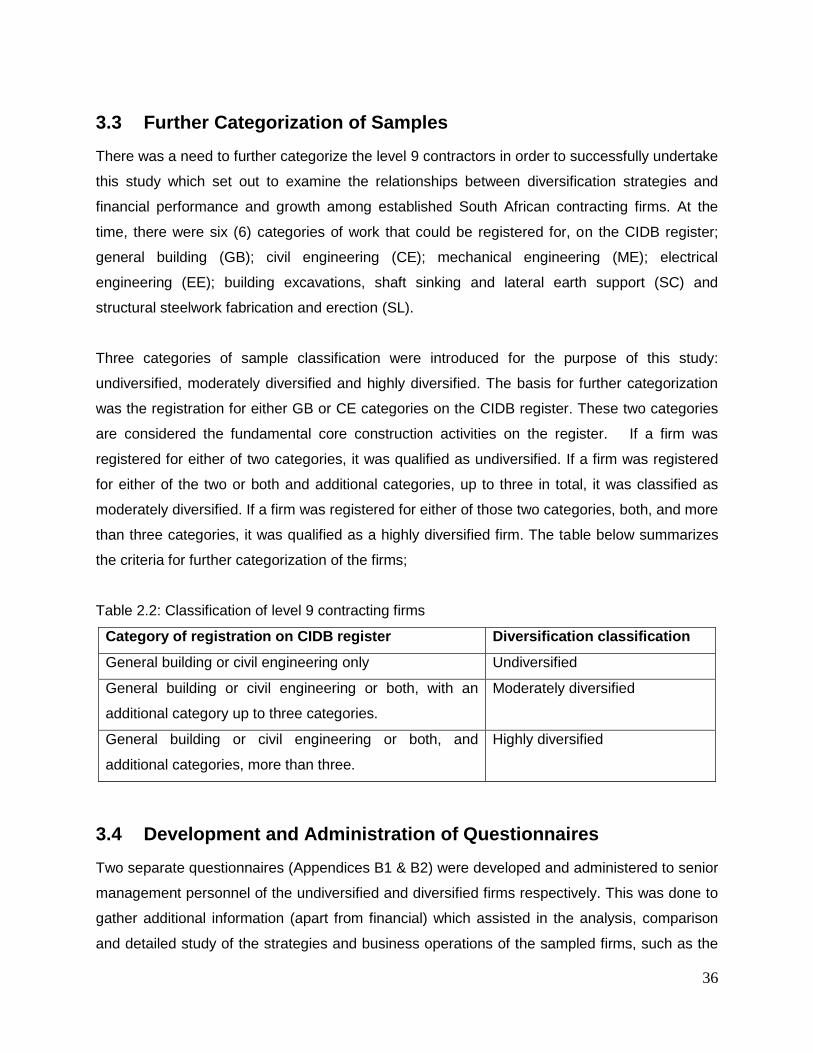
36
3.3 Further Categorization of Samples
There was a need to further categorize the level 9 contractors in order to successfully undertake
this study which set out to examine the relationships between diversification strategies and
financial performance and growth among established South African contracting firms. At the
time, there were six (6) categories of work that could be registered for, on the CIDB register;
general building (GB); civil engineering (CE); mechanical engineering (ME); electrical
engineering (EE); building excavations, shaft sinking and lateral earth support (SC) and
structural steelwork fabrication and erection (SL).
Three categories of sample classification were introduced for the purpose of this study:
undiversified, moderately diversified and highly diversified. The basis for further categorization
was the registration for either GB or CE categories on the CIDB register. These two categories
are considered the fundamental core construction activities on the register. If a firm was
registered for either of two categories, it was qualified as undiversified. If a firm was registered
for either of the two or both and additional categories, up to three in total, it was classified as
moderately diversified. If a firm was registered for either of those two categories, both, and more
than three categories, it was qualified as a highly diversified firm. The table below summarizes
the criteria for further categorization of the firms;
Table 2.2: Classification of level 9 contracting firms
Category of registration on CIDB register Diversification classification
General building or civil engineering only Undiversified
General building or civil engineering or both, with an
additional category up to three categories.
Moderately diversified
General building or civil engineering or both, and
additional categories, more than three.
Highly diversified
3.4 Development and Administration of Questionnaires
Two separate questionnaires (Appendices B1 & B2) were developed and administered to senior
management personnel of the undiversified and diversified firms respectively. This was done to
gather additional information (apart from financial) which assisted in the analysis, comparison
and detailed study of the strategies and business operations of the sampled firms, such as the

37
company’s strategy on expansion; assessment of the firm’s strength and weaknesses;
assessment of factors influencing growth in the firm; challenges and threats to growth in the
firm; barriers to diversification; company’s diversification strategies and management structure.
+Due to challenges experienced in gathering financial information from private firms included in
the research, a table of ratios (Appendix C1) was prepared in order to overcome the challenge
of requesting sensitive financial data.
3.4.1 Questionnaire structure
The questionnaires administered in the study have the following subdivisions;
Section A: This section was used to solicit information on the background, experience
and position of the personnel completing the questionnaire on behalf of the contracting
firm.
Section B: This section was used to solicit information on the profile of the contracting
firm.
Section C: This section solicits information on the firm’s strengths and weaknesses.
Section D: This section solicits information on the challenges and threats to the growth
of the firm.
Section E: This section solicits information on diversification in the firm.
3.5 Scales of Measurement
Measurement scales have a direct influence on the types and sophistication of the statistical
procedure that would be used during data analysis for a study. Table 3.3 is a summary of the
characteristics of different measurement scales.
Marczyk et al., 2005 consider nominal and ordinal data as non-metric data, and interval and
ratio data as metric data. The first three scales were employed in this study. The first two scales
(nominal and ordinal) were adopted in the questionnaires while the interval scale was employed
in the section on financials.

38
Table 3.3: A summary of measurement scales, their characteristics, and their statistical
implications
Measurement
Scale
Characteristics of the Scale Statistical possibilities of the
Scale
Nominal scale A scale that measures in terms of
names or designations of discrete units
or categories.
Enables one to determine the
mode, percentage values, or the
chi-square.
Ordinal scale A scale that measures in terms of such
values as more or less, larger or
smaller, but without specifying the size
of the intervals.
Enables one to determine the
median, percentile rank, and
rank correlation.
Interval scale A scale that measures in terms of equal
intervals or degrees of difference but
whose zero point, or point of beginning,
is arbitrarily established.
Enables one to determine the
mean, standard deviation, and
product moment correlation;
allows one to conduct most
inferential statistical analyses.
Ratio scale A scale that measures in terms of equal
intervals and an absolute zero point of
origin.
Enables one to determine the
geometric mean and the
percentage variation; allows one
to conduct virtually any
inferential statistical analysis.
Source: Leedy and Ormrod, 2005.
3.6 Data Types
3.6.1 Primary and secondary data
Primary data are data collected for the first time and specifically for the project at hand. These
are data generated for a specific project, either via questionnaires, interviews, surveys,
experimentation, observation, etc. Primary data does not exist unless it has been generated in
the process of a research project.
Secondary data are data that already exist in one form or the other, but which are not primarily
collected for the purpose of the project at hand. Lancaster (2005) is of the opinion that no new

39
data should be collected until existing data are examined. In most cases, secondary data are
usually the starting point of data collection. Secondary data could include reports, information on
the internet, registers, government surveys, reports, articles, academic publications i.e.
Journals, essays, web pages, government publications, online indexes and catalogues,
commercial research organizations, company annual reports, conference papers, industry
publications, etc. The secondary data used in this study are the financial statements of the
participating firms.
3.6.2 Quantitative and qualitative data
The distinction between quantitative and qualitative studies is based on the kind of information
used to study a phenomenon. Quantitative relies on numbers and figures while qualitative base
their accounts on qualitative information; words, sentences and narratives. Quantitative data is
data which can be expressed numerically or classified by some numerical value. Qualitative
data, on the other hand are easily applicable to phenomena which cannot be or difficult to
quantify and measured. Therefore, they cannot be numerically analysed (Ghosh and Chopra,
2003).
In this study, quantitative data were extracted from audited financial statements of companies
for analysis. The outcomes to be measured; management performance, are phenomena which
are measurable via numerical data which can be quantified and analysed by using quantitative
data from financial statements.
3.7 Data Collection
Data was collected for the study in two ways; primary data collected through the distribution of
self-administered questionnaires via electronic mails and secondary data collected in the form of
five (5) year audited financial statements from the different firms, reports, journal articles,
textbooks, etc.
The financial data collected were five year financial statements (2004-2008). The
communication approach in this study included electronic mail messages and direct contact
(collection of financial statements). Follow ups were done via telephone and electronic mails.
Some firms declined to participate due to the confidentiality of the requested financial data,

40
while others were not interested in assisting with the research. One of the sampled firms
however, assisted with the questionnaire but did not provide financial data because the
management the data sensitive.
3.8 Data Analysis
3.8.1 Descriptive and inferential statistics
According to Fellows and Liu (2008), there are two classifications of statistics: descriptive and
analytical statistics. Descriptive statistics are used to express the important features of a
population (population parameters), intended sample or sample obtained (samples statistics)
numerically; they include percentages and other numerical descriptors of the distribution under
examination. Descriptive statistics include mean, median mode, variance, standard deviation,
percentiles, etc.
Analytical or inferential statistics on the other hand allow one to make inferences from the data
obtained in a study. Please refer to Table 3.4 for some statistical tests available to researchers.
Kolmogorov Smirnov test for normality was carried out on the four sets of data used in the
study. This was done to establish the distribution of the data. The consistency of the
questionnaires was assessed by reliability analysis to estimate the extent to which a
measurement taken with multiple-item scale (questionnaire) reflects mostly the true score of the
dimension that is to be measured, relative to the error. The internal consistency of the
questionnaires was measured by Cronbach’s alpha coefficient. The range of the alpha is from 0
to 1. As a rule of thumb the alpha of a scale that equals 0.70 or greater is acceptable for items
to be reliable. This assessment is based on the correlations between the individual items or
measurements that make up the scale, relative to the variances of the items.
Combinations of parametric and non parametric tests were used on four different data sets in
the study. These data sets represent data on return on capital employed; return on equity;
return on total asset and profit margin. A test of normality of these data revealed that some of
the data represent normal distribution while others are not normally distributed. In instances
where the data are normally distributed, parametric tests were carried out and non-parametric
tests undertaken where normality is not established.
41
According to Naoum (1998), normality is a major requirement of the application of parametric
tests. Non-parametric tests on the other hand are distribution-free and flexible in application,
according to Fellows and Liu (2008).
The t-statistic is a parametric test which is used to compare the means of two samples.
According to Pagano (1981), the two fundamental assumptions underlying the use of the t-test
are: normality of distribution and homogeneity of variances. In order to counter the effect of the
assumption of homogeneity of variance, the statistic employed is the two independent samples
t-statistic that assumes unequal variances. The Mann-Whitney U test on the other hand was
adopted for the analysis of two independent samples where normality of data is not established.
Performance differences across the undiversified, moderately diversified and highly diversified
firms were analysed using one way analysis of variance (ANOVA), which, according to Fellows
and Liu (2008), is used to analyse the differences among the means of categorised groups. The
ANOVA is used where homogeneity of variances are established and K-samples Kruskal-Wallis
one-way ANOVA where homogeneity of variances was not established.
3.8.1.1 Principal Components Analysis
In statistical analysis, variables are sometimes combined in order to simplify data analysis and
interpretation. Factor analysis is a multivariate method which analyses relationships among
correlated variables which are difficult to interpret, in terms of a few conceptually meaningful,
relatively independent factors, each of which represents some combination of original variables
(Comrey and Lee, 1992).
One of the several ways of conducting factor analysis is principal component analysis, which
was adopted in this study. Component analysis was carried out on the variables measured on
the questionnaires in order to group them and simplify the interpretation. Components are
interchangeably called factors in this report. The main applications of component analysis
techniques are to reduce the number of variables and detect structure in the relationships
between variables, i.e. to classify variables. It should be noted that these variables must be
inter-correlated before a component analysis is run, because they are supposed to be
measuring the same latent construct.

42
The procedure was used to create a correlation matrix among the original variables. This was
done to check if the variables are not measuring the same thing. Highly correlated variables
would mean that the variables are measuring the same thing and can be combined. Low
correlation on the other hand would mean that the variables are measuring distinctively different
things. In this case, separate components can be created for each variable. When the original
matrix is created, the variables are standardized and the initial total variance is equal to the
number of variables. This is because each standardized variable has a variance equal to 1, for a
correlation matrix created.
Communalities of the variables show the proportion of each variable’s variance that can be
explained by the principal components (see Appendices G1, G5, G9, G13 and G17).These are
Appendices for different sections of the questionnaires. The general criterion is that with less
than 30 variables, the average communality after extraction should be greater than 0.7.
Eigenvalues are the variances of the principal components. The first component always
accounts for the most variance. Therefore, it will have the highest eigenvalue. The next
component accounts for most of what is left of the total variance and so on. This translates that
each successive component accounts for less and less variance. Extraction and rotation sums
of squared loadings are determined by the number of principal components with eigenvalues
with value of 1 or greater, which the study was interested in retaining. Please refer to
Appendices G2, G6, G10, G14 and G18 for extraction and rotation sums of squared loadings for
the created components for different sections of the questionnaires.
The variables with the highest correlations to a particular component which forms a lateral
construct is grouped together under a component. That component explains the common
characteristics that are supported by the variables which are significantly correlated to that
component. In essence, the principal components explain a set of observed variables.
Component loadings are the values which explain how the variables are closely related to each
one of the components discovered. The matrix structure of the correlations between the
variables and created components were rotated about their axes without changing the relative
locations of the points to each other. However, the coordinates of the points (component
loadings) had to change. This was done to establish a clear pattern of component loadings of
the variables Please see Appendices G3 and G4; G7 and G8; G11 and G12; G15 and G16; and
G19 and G20 for initial and rotated component matrices for different sections of the
questionnaires. Rotation has the effect of optimizing the component structure and the relative

43
importance of the components is equalized. Such as components that are marked by high
loadings for some variables and low loadings for others.
The component loadings in the relevant Appendices are the correlations between the variables
and the components, which can have values ranging from +1 to +1.Absolute values of the
loadings are normally considered in the interpretation of a component.
The variances explained per section are recorded in the relevant Appendices for each section. It
should be noted that components are not correlated to each other. Component analysis was
carried out on the questionnaire data under sections C, D and E.
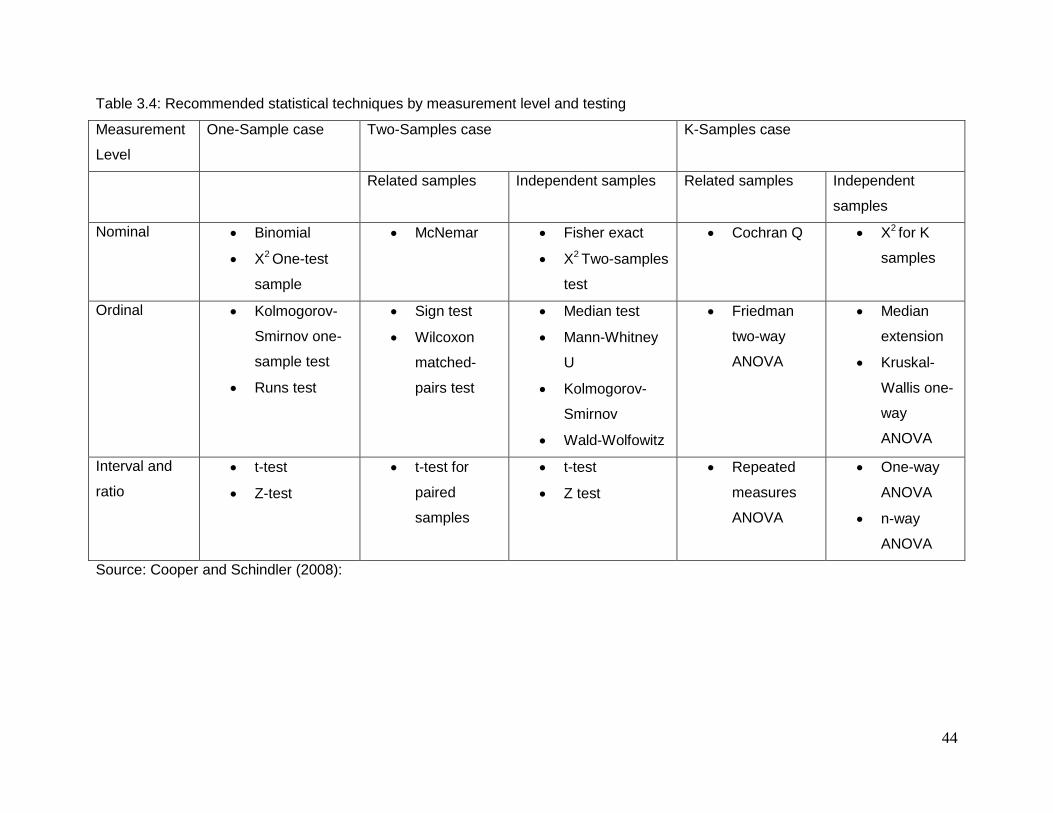
44
Table 3.4: Recommended statistical techniques by measurement level and testing
Measurement
Level
One-Sample case Two-Samples case K-Samples case
Related samples Independent samples Related samples Independent
samples
Nominal Binomial
X2 One-test
sample
McNemar Fisher exact
X2 Two-samples
test
Cochran Q X2 for K
samples
Ordinal Kolmogorov-
Smirnov one-
sample test
Runs test
Sign test
Wilcoxon
matched-
pairs test
Median test
Mann-Whitney
U
Kolmogorov-
Smirnov
Wald-Wolfowitz
Friedman
two-way
ANOVA
Median
extension
Kruskal-
Wallis one-
way
ANOVA
Interval and
ratio
t-test
Z-test
t-test for
paired
samples
t-test
Z test
Repeated
measures
ANOVA
One-way
ANOVA
n-way
ANOVA
Source: Cooper and Schindler (2008):

45
3.8.2 Test of hypothesis
In the words of Leedy and Ormrod (2005), a hypothesis is a logical supposition, a
reasonable guess or an educated conjecture. It is a speculation on how the study will turn
out. Christensen, (2001) asserts that a hypothesis attempts to explain, predict and explain
the relationship between two or more variables being studied. The following are the two
hypotheses tested in this study;
Hypothesis (H1): The financial performance of diversified firms is better than that of
undiversified ones
HO : µ1= µ2
HA : µ1 ≠ µ2
Where:
µ1 = sample mean1
µ2 = sample mean2
Ho = null hypothesis
HA = alternative hypothesis
Hypothesis (H2): The financial performance of established contracting firms
(undiversified, moderately diversified and highly diversified) is linearly related to their
diversification strategies. It is expressed as follows;
HO : µ1 = µ2 = µ3
HA : µ1 ≠ µ2 ≠ µ3
Where:
µ1 = sample mean1
µ2 = sample mean2
µ3 = sample mean3
Ho = null hypothesis
HA = alternative hypothesis

46
Note: If the p value is less than the significance level (0.05 for this study), the null
hypothesis is rejected (if p < , reject null). If p is greater than or equal to the
significance level, the null hypothesis is not rejected (if p ≥ don’t reject null).
A hypothesis could be a one or two-tailed tests. According to Cooper and Schindler (2008),
a one-tailed test or directional test places the entire probability of an unlikely outcome into
the tail specified by the alternative hypothesis while the two-tailed test, or non-directional
test considers two possibilities. The two hypotheses tested in this study are one-tailed tests.
In hypothesis testing, two kinds of hypotheses are used; null and alternative hypotheses.
The null hypothesis is a statement based on empirical fact (if available) or logical
assumption or the standpoint of a researcher between a parameter and the statistic being
compared to it. Therefore we test a claim from the information from the sample under
investigation. A hypothesis enables one to make inferences on population parameters. The
null hypothesis is either rejected or fails to be rejected, based on the sample data collected.
It is considered worthwhile to briefly mention likely errors that could be inherent in
hypothesis testing. Marczyk et al. (2005) record that type I error ( ) is committed when a
true null hypothesis is rejected. The value is called the level of significance and is the
probability of rejecting the true null (probability of type I error). A type II error (β) on the other
hand is committed when one fails to reject a false null hypothesis.
3.8.3 Tests of significance
There are two major types of tests of significance that can be used to test hypotheses for a
study; parametric and non-parametric tests (Fellows and Liu, 2008). It is important that an
appropriate test be chosen before a test of hypothesis is carried out.
3.8.4 Probability values (p values)
The p-value represents the probability of chance error in determining whether a finding is
valid and thus representative of the population (Marczyk et al., 2005). In essence, this
represents the probability of a type I error that must be assumed if the null hypothesis is
rejected.

47
In interpreting the hypothesis tests, the p value is compared to the significance level ( ),
which dictates whether the null hypothesis is either rejected or not rejected. If the p value is
less than the significance level, the null hypothesis is rejected (if p < , reject null). If p is
greater than or equal to the significance level, the null hypothesis is not rejected (if p ≥
don’t reject null).

48
CHAPTER FOUR: DATA ANALYSIS AND INTERPRETATION
OF RESULTS
4.1 Introduction
This study aims to investigate the relationships between diversification strategies adopted
by established contractors in South Africa and the financial performance and growth in these
firms. The study seeks to answer the following research question: does diversification bring
about better financial performance and growth in established contracting firms in South
Africa? This chapter presents the outcome of the analyses carried out on the questionnaires
administered to the sampled firms and financial information received from them.
Each subsection of the questionnaires was analysed and comparisons were made between
undiversified, moderately diversified and highly diversified. Firms’ financial performance and
growth is measured by ROCE, ROE, ROTA and PM. These measures were tested to
determine if they differ significantly, on average, among diversified and undiversified
companies, using t test, Mann Whitney test, one way analysis of variance (ANOVA) and
Kruskal-Wallis test.
Data entry and capturing on this study was done with Microsoft Excel 2003. All the analyses
were carried out using the Statistical Package for Social Sciences (SPSS) version 13.
4.2 Analysis of Primary Data (Questionnaires)
Questionnaires were administered to a consolidated list of 17 firms. Nine (9) of these firms
returned the questionnaires. These translate to a response rate of 53% on the
questionnaires. The breakdown is shown in the following Table.

49
Table 4.1: Summary of questionnaire administration and response
Category Administered Questionnaires Returned Questionnaires
(No.) (%) (No.) (%)
Undiversified 8 47.06 3 17.647
Moderately diversified 6 35.29 3 17.647
Highly diversified 3 17.65 3 17.647
Total 17 100 9 52.941
As noted earlier in the report, there are two separate questionnaires which were designed
and administered, i.e. for undiversified and diversified firms. However, the explanations of
the analyses follow the order of different sections of the questionnaires in order to have a
better mental tracking of the analyses and interpretation of results. It should be noted that
some sections and subsections apply specifically to undiversified firms and others to
diversified firms. In order to avoid confusion in the analyses that follow in this section of the
research report, the following table was prepared to indicate the group that each section
applies.
Table 4.2: Breakdown of questionnaire analysis
Questionnaire sections and subsections
Title Relevant group(s)
A General information All sampled firms
B Company profile All sampled firms
C (comprising C1 and C2) Assessment of company’s strengths and weaknesses
All sampled firms
D Challenges and threats to the growth of the firms
All sampled firms
E (subsections E1-E6) Diversification in company Separate analyses for undiversified and diversified firms
E7 Motivation of firm’s diversification strategy
All sampled firms
E8 Post diversification experience
Diversified firms only
E9 Barriers to diversification strategy
All sampled firms
E10 Factors influencing decision not to diversify
Undiversified firms only

50
4.2.1 Test of reliability
Cronbach’s Alpha is a coefficient (a number between 0 and 1) that is used to rate the
internal consistency (homogeneity) or the correlation of items in a test or questionnaire. It
assesses the degree to which a set of items measures a single undimensional latent
construct. If a test has a strong internal consistency, most measurement experts agree that
it should show only moderate correlation among items (0.70 to 0.90).
The Cronbach’s Alpha coefficients are at least 0.70 (70%) for all the sections except
subsection E8 with an alpha coefficient of 0.005 (0.5%). This shows that the questions
consistently assessed the concept in each of the respective sections and subsections
except in section E8. This means that variables under section E8 are not sufficiently inter-
correlated to combine to yield a latent construct, i.e. a factor. Details of the results of
reliability are contained in Appendix E.
4.2.2 Section A: General information
Subsection A (1) on the questionnaires solicit information on the rank or position of the
personnel completing the questionnaire on behalf of the firm. Out of total of nine (9)
questionnaires returned, three (3) were completed by top level managers and six (6) by
middle level managers, which represent 33.33% and 66.67% of total response received
respectively.
Subsection A (2) solicits information on the status of the personnel completing the
questionnaire; owner, joint owner or an employee. There were seven (7) responses received
under this subsection and all of them were employees. This represents 77.78% of response
received. There was no response to this subsection from two of the sampled firms.
4.2.3 Section B: Company profile
Subsection B (1) of the questionnaires was used to classify the firms based on their areas of
specialisation in the industry. The breakdown of the responses in Appendix F1 revealed that
100% of respondents specialise in Civil Engineering; 77.78% specialise in General Building

51
works and 55.57% specialise in Mechanical Engineering. These three highest percentages
are distributed among the three categories; undiversified, moderately and highly diversified
firms respectively. These are the three areas of specialisations where the undiversified firms
provided information. The undiversified firms registered two responses under ‘others’;
infrastructure (pipelines) and rail track projects.
Subsection B (2) requested information on the corporate registrations of the sampled firms.
Appendix F2 reveals that all the undiversified firms are privately owned, while all the
moderately and highly diversified firms are public owned and registered with the
Johannesburg Stock Exchange (JSE). None of them is registered as a close corporation.
Subsection B (3) solicits information on the expansion strategies adopted by the firms to
grow their businesses. Appendix F3 shows that all the respondent firms responded that they
use internal capacity expansion as their strategy. One of the moderately diversified firms
however chose mergers as one of its strategies for expansion. Acquisitions and joint
ventures are also common across the three categories of firms.
Subsection B (4) solicits information on the international operations of the firms. Appendix
F4 shows that all the three categories of firms responded that they had operations outside
the boarders of South Africa. Moderately and highly diversified firms have the highest
responses with a score of 33.34% each, with undiversified firms with the lowest score of
22.23%. 11.12% of the respondents, from the undiversified group responded that they did
not have international operations.
Subsection B (5) requests information on the international operations of the firms, with
respect to the number of countries in which they have international operations. Appendix F5
shows the following firms with the highest number of international operations; Murray and
Roberts (highly diversified firm) operates in ten (10) countries; Stefanutti Stocks Holding
(moderately diversified firm) operates in nine (9) countries and Wilson Bayly Holmes-Ovcon
(WBHO) (moderately diversified firm) operates in seven (7) countries. Only Trencon
(undiversified firm) does not have operations outside the borders of South Africa.

52
4.2.4 Section C: Assessment of company’s strengths and
weaknesses
4.2.4.1 Subsection C1: Current status of the firms
Subsection C1 was used to obtain information on the firm’s current strengths and
weaknesses. Appendices G1 to G4 show the outcome of factor analysis for this section. The
result reveals that the variables explained a total of 95.5% of the variance. The average
communality after extraction in this subsection is 0.96.
The results show that the following variables with the associated component loadings are
correlated to independent lateral constructs:
component 1: ‘use information and communication technologies’(-0.897); ‘adoption of
black economic empowerment’ (-0.891); ‘high quality of products and services’ (0.854);
‘skilled and competent management staff’ (0.634); and ‘ability to access and retain
highly qualified subcontractors and specialist labour’ (0.533);
component 2: ‘goodwill and brand name of the enterprise’ (0.843); ‘professionalism
(ethical practices) and reputation’ (0.826); ‘fixed asset base’ (0.753); ‘sound financial
management practices’ (0.722); ‘project delivery to budget and time’ (-0.694); and
‘adequate plant and equipment’ (0.689);
component 3: ‘flexibility in operation and company organization structure’ (0.989);
‘avoidance of adversarial postures during contract execution’ (0.818); ‘ability to build
long term relationships with customers’ (-0.679); and ‘high overhead costs’ (0.626);
component 4: ‘provision of after sale services and support to clients’ (0.875); and
‘creativity and innovation in project delivery process’ (0.875);
component 5: ‘skilled and competent technical staff’ (0.932); ‘highly trained operatives’
(0.811) and ‘age of company and experience’ (-0.609);
component 6: ‘access to credit and finance (suppliers, banks, stock market,
subcontractors, etc)’ (0.928); and ‘financial base and ability to support client financially’
(0.771).
The results of the component analysis of section C1 reveal that some variables are
positively correlated, while others are inversely correlated. The minus sign indicates an
inverse or a negative relationship and the absence of a sign indicate a direct or positive
53
relationship. The positively correlated variables are interpreted as strengths, while the
negatively correlated variables are interpreted as weaknesses.
The structures of component loadings in Appendix G2 reveal that component 1 has the
maximum variance of 37.96% and 19.75% of the total variance explained, before and after
rotation respectively. Based on the variables that are loaded to component 1, the theme
explained can be summarised as: information technology; implementation of BEE policy;
and quality of products, services and human resources. It can be inferred that lack of use of
information and communication technologies and inability to adopt black economic
empowerment policy are weaknesses experienced by the firms, as shown under component
1 due to the inverse correlations.
Component 2 has the next highest variance of 20.36% and 19.67% of total variance
explained, before and after rotation respectively. Based on the variables that are correlated
to component 2, the underlying theme explained by component 2 can be summarised as:
goodwill and reputation; fixed asset base and financial management practices; and
adequate machinery. Inability to deliver projects to budget and time is identified as a
weakness under component 2 due to the inverse correlation identified.
Component 3 has the next highest variance of 12.67% and 16.51% of total variance
explained, before and after rotation respectively. Based on the variables that are correlated
to component 3, the theme explained by component 2 can be summarised as: flexibility in
operations and organisational structure; favourable disposition during contract execution,
long term relationships with clients and high overhead costs. Due to inverse correlation,
inability to build long term relationships with customers is identified as a weakness under
component 3.
Component 4 has a variance of 10.48% and 13.47% of total variance explained, before and
after rotation respectively. The underlying theme identified in the variables that are
correlated to component 4 are: innovation and customer care.
Component 5 has a variance of 8.33% and 13.19% of total variance explained, before and
after rotation respectively. The common themes of the variables which are correlated to
component 5 are: skills level and training of staff; and age and experience of the firm. The

54
age and experience of the firm was identified as a weakness under component 5 due to the
inverse correlation.
Component 6 has a variance of 5.72% and 12.94% of total variance explained, before and
after rotation respectively. The common theme of the variable which are correlated to
component 6 is access to finance.
4.2.4.2 Subsection C2: Factors that have influenced firm growth
Subsection C2 was used to extract information on the influence of variables on the growth of
the contracting firm. Appendices G5 to G8 are the results of factor analysis for this section.
The result reveals that the variables explained a total of 94.3% of the variance. The average
communality in this subsection is 0.94.
The results show that the following variables with the associated component loadings are
correlated to independent lateral constructs:
component 1: ‘adequate plant and equipment’ (0.946); ‘project delivery to budget and
time’ (0.938); ‘financial base and ability to support client financially’(0.804); ‘access to
credit and finance (suppliers, banks, stock market, subcontractors, etc) (0.794) ;
‘creativity and innovation in project delivery process’ (0.707); provision of after sale
services and support to clients’ (0.698); ‘skilled and competent management staff’
(0.681)’ and ‘fixed asset base’ (0.589);
component 2: ‘adoption of joint venture and alliances with other companies’ (0.920);
‘use of information and communication technologies’ (0.878); ‘adoption of black
economic empowerment policy’ (0.875); ‘avoidance of adversarial postures during
contract execution’ (0.762); ‘professionalism (ethical practices) and reputation’ (0.669);
and ‘high quality of products and services’ (-0.632);
component 3: ‘ability to access and retain highly qualified subcontractors and specialist
labour’ (0.897); ‘sound financial management practices’ (0.878); and ‘ability to build long
term relationships with customers’ (0.700);
component 4: ‘highly trained operatives’ (0.980); ‘skilled and competent technical staff’
(0.842); and ‘flexibility in operation and company organizational structure’ (0.764);

55
component 5: ‘goodwill and brand name of the enterprise’ (0.800) and ‘age of company
and experience’ (0.656);
component 6: ‘high overhead cost’ (0.929).
The structure of component loadings in Appendix G6 reveals that component 1 has the
maximum variance of 38.39% and 23.59% of the total variance explained, before and after
rotation respectively. Based on the variables that are loaded to component 1, the common
themes explained can be summarised as: adequacy of required construction plant;
efficiency and innovation in project delivery; access to finance; availability of skilled
management staff; and customer care.
Component 2 has a variance of 21.44% and 20.66% of total variance explained, before and
after rotation respectively. The underlying themes of the variables that are correlated to
component 2 are: alliances with other firms; use of information and communication
technologies; adoption of government’s BEE policy; favourable disposition during contract
execution; reputation; and high quality of products and services. The variable, ‘high quality
of products and services’ has an inverse correlation to component 2. This translates that this
variable does not directly contribute to the growth of a firm.
Component 3 has a variance of 11.76% and 15.60% of total variance explained, before and
after rotation respectively. The themes of the variables that are correlated to component 3
are: quality of human resources; and financial and relationship management.
Component 4 has a variance of 9.60% and 13.80% of total variance explained, before and
after rotation respectively. The themes of the variables that are correlated to component 4
are: staff competence; and flexibility in operation and organizational structure.
Component 5 has a variance of 8.03% and 10.84% of total variance explained, before and
after rotation respectively. The themes of the variables that are correlated to component 5
are: reputation; and age and experience of firm.
Component 6 has a variance of 5.11% and 9.85% of total variance explained, before and
after rotation respectively. The only variable correlated to component 6 is high overhead
costs.
56
4.2.5 Section D: Challenges and threats to the growth of the firms
Section D was used to assess both challenges and threats to the growth of a contracting
firm, as a basis for ameliorating them. The results reveal that the variables explained a total
of 86.5% of the variance in this section. The average communality for this section is 0.87.
The results of this section are contained in Appendices G9 to G12.
The results show that the following variables with the associated component loadings are
correlated to independent lateral constructs:
component 1: ‘government’s policy of black economic empowerment’ (0.944); ‘adoption
of targeted preferential procurement system’ (0.921); ‘projects geographically dispersed’
(0.8676); ‘globalization (allows entry of bigger and better equipped firms as competitors)’
(0.874); ‘adoption of joint ventures and alliances with other companies’ (0.822);
‘fluctuating demand and project types’ (0.816); ‘low flexibility in operation and company
organization structure’ (0.754); ‘low financial base and access to credit and finance
(suppliers, banks, stock market, subcontractors, etc.)’ (0.684); ‘over specialization in
operation and market already saturated’ (0.682); and ’high establishment cost to
maintain branches’ (0.651);
component 2: ‘lack of technical skills for certain types of projects’ (0.929); ‘high overhead
cost: makes some projects unprofitable’ (0.887); ‘lack of access to adequate plant and
equipment’ (0.807); and ’young company and inexperienced – clients unwilling to
commit projects to us’ (0.647);
component 3: ‘low entry barrier and use of lowest bid competitive tendering’ (0.968).
Component 1 has a variance of 60.22% and 45.90% of total variance explained, before and
after rotation respectively (see Appendix G10). The themes of the variables that are
correlated to component 1 are: policy on HDI; industry alliances; saturation and high
competition in the market; uncertainty in the industry (demand, project types and location);
lack of access to finance; low flexibility in operation; and high establishment costs.
Component 2 has a variance of 16.37% and 25.21% of total variance explained, before and
after rotation respectively. The themes of the variables that are correlated to component 2
are: lack of required skills; high overhead costs; lack of access to required construction
plant; and lack of experience.

57
Component 3 has a variance of 9.87% and 15.35% of total variance explained, before and
after rotation respectively. The underlying theme of the variable that is correlated to
component 3 is lack of entry barrier and lowest bid tendering approach.
4.2.6 Section E: Diversification in company
Subsections E1- E6 in the questionnaires were used to solicit specific information that is
peculiar to undiversified and diversified firms respectively. Therefore, the discussions of
these results are separated, starting with undiversified firms.
4.2.6.1 Subsection E1 – E6: Diversification in company
(undiversified firms)
Subsection E1 obtained information on the interest of undiversified firms in diversification.
Two (2) out of the three undiversified firms responded positively while the third firm
registered no interest, as shown in Appendix F6.
Subsection E2 was used to extract information on the status of diversification. As shown in
Appendix F7, the response reveals that 2 out of the 3 undiversified firms were not interested
in diversification now and in the near future and 1 responded that the discussion about
diversification had just been initiated at the senior management level of the firm.
Subsection E3 obtained information on the likely type of diversification that the undiversified
firms might want to implement. Appendix F8 shows that 1 of the 3 respondents responded in
favor of addition of new products – related to current business; movement into new markets
(expansion of client base) – same products (existing); and shareholding in other businesses
(without active participation).
Subsection E4 was used to solicit information on the mode of diversification that the firms
would likely adopt if they diversify i.e. internal organic growth; external and both internal and
external. Appendix F9 shows that 2 out of 3 responses were in favor of capacity building
within the firms’ core competence (internal organic growth); 1 response was in favor of

58
product diversity and move to new markets; both of which are under internal organic growth
category. 1 response was in favor of acquisition and joint venture/alliance.
Subsection E5 obtained information with respect to how undiversified firms intend to achieve
diversification. Appendix F10 shows that 2 out of 3 undiversified firms intend to use both
internal and external human resources to achieve diversification. 1 of the respondents was
not interested in diversification at present and in the near future.
Subsections E 6a and 6b were used to solicit information on the current management
structures in the undiversified firms and the likely structures after the firms might have
diversified. The breakdown in Appendix F11 reveals the following; 1 out of 3 of the sampled
undiversified firms was not interested in diversification now and in the near future; the two
management structures (functional and divisional) remain unchanged in 1 of the 3 sampled
firms, as the current structure in undiversified firms and as likely structures after the firms
might have diversified.
4.2.6.2 Subsection E1 – E6: Diversification in company (diversified
firms)
Subsection E1 solicits information on the type of diversification existing in the firms.
Appendix F12 shows that 3 of the 6 diversified firms responded in favor of movement into
new markets (expansion of client base) – existing products and shareholding in other
businesses (without active participation). 2 of 6 firms responded in favor of addition of new
product(s) – related to current business.
Subsection E2 was used to solicit information on the options that best suits the firms in
terms of the existing type of diversification, ranked in the order of importance. Appendix F13
reveals that 3 of 6 diversified firms responded that movement into new markets (expansion
of client base) – existing products best suits their type of organization, followed by 2 of 6
firms responding in favor of addition of new products – related to current business and 1 of
the 6 firms responding in favor of shareholding in other businesses (without active
participation). On the other hand, 4 of 6 firms responded that retailing in related and
unrelated goods least suit their type of organization, followed by 1 of 6 firms responding that

59
addition of new products (manufacturing) – unrelated to current business least suits their
type of organization.
Subsection E3 solicits information on the mode of diversification adopted by the diversified
firms; internal organic growth; external or both internal and external. As shown in Appendix
F14, under the internal organic growth mode, 5 of 6 firms responded in favor of move to new
markets and capacity building within firm’s area of core competence while 3 of 6 responded
in favor of product diversity. Under the external mode of diversification, all 6 firms responded
in favor of joint venture/alliance as their mode of diversification, followed by 1 of 6 favor of
merger and acquisition. There was no response for both internal and external.
Subsection E4 solicits information on how the diversification process was achieved; through
internal management staff; external professional staff only or both internal and external staff.
The responses (Appendix F15) reveals that 3 of 6 responded in favor of internal
management staff of the firms and the other 3 of 6 responded in favor of both internal and
external staff to achieve diversification.
Subsections E 5a and 5b were used to solicit information about the management structure
of diversified firms before and after diversification. The breakdown in Appendix F16 reveals
the following; the use of functional structure in the firms decrease from 3 to 2 of 6 after
diversification; the use of regional administration in the firms remains unchanged in 2 of 6;
the use of divisional structure increased from 2 to 3 of 6 after diversification.
Subsection E6 extracted information on the financial reporting structure of the diversified
firms. All of the 6 sampled firms responded positively to the question; they all use a central
financial reporting system. This is shown in Appendix F17.
4.2.6.3 Subsection E7: Motivation of firm’s diversification strategy
Subsection E7 was used to obtain information on the factors that motivate a firm’s
diversification strategy. The results in Appendices G13 to G16 reveal that the variables
explained a total of 84.8% of the variance in this section of the questionnaire. . The average
communality for this section is 0.85. There are three (3) components from the list of twelve
(12) variables being measured in this section.

60
The results show that the following variables with the associated component loadings are
correlated to independent lateral constructs:
component 1: ‘hope to enjoy economy of scale through operational efficiencies’ (0.941);
‘hope to enjoy economy of scope through building of synergies in asset utilization’
(0.921); ‘attracted to more profitable business(es)’ (0.903); ‘need to engage unutilized
resources’ (0.901); ‘desire to create a monopoly in the market’ (0.684); and ‘present
market is saturated-stiff competition’ (0.600);
component 2: ‘cyclical and fluctuating demand in present market’ (0.971); ‘diversified
companies appear to be doing better than us’ (0.821); ‘bandwagon effect – others are
doing it’ (0.818); and ‘need for growth (increase turnover and profit)’ (0.650);
component 3: ‘improve the stability and survival of the company’ (0.936); and ‘the need
to spread risk-risk aversion’ (0.866).
Component 1 has a variance of 49.50% and 39.04% of total variance explained, before and
after rotation respectively. This is shown in Appendix G14. The themes of the variables that
are correlated to component 1 under subsection E7 are: anticipation of increased efficiency
and profit; value extraction from unutilized resources; pursuit of higher market share; and
better competition in the marketplace.
Component 2 has a variance of 24.06% and 24.20% of total variance explained, before and
after rotation respectively. The themes of the variables that are correlated to component 2
are: uncertainty in existing business; favourable perception of diversification; conformity to
business trend; and other reasons except growth. It is noteworthy that firms decide to
diversify not because they are interested in the growth of the business. This is shown in
inverse correlation of ‘need for growth’ to component 2.
Component 3 has a variance of 11.26% and 21.57% of total variance explained, before and
after rotation respectively. The themes of the variables that are correlated to component 3
are: stability; and risk balancing for the firm.

61
4.2.6.4 Subsection E8: Post diversification experience (diversified firms)
Section E8 was used to extract information regarding post diversification experience of
diversified firms. The result of the reliability test carried out shows that the variables are not
sufficiently inter-correlated to form a factor, with 0.5% score on reliability from this section of
the questionnaire. It is suspected that the few responses received for this section may be
responsible for the low score on reliability. Furthermore, for ease of reference during
analysis, E8 was omitted from the questionnaires for undiversified firms. The details of the
analysis for this section are found in Appendix F18. The following points could be deduced
from the frequency table generated from the responses:
3 of 6 and 2 of 6 respondents agree and strongly agree, respectively, that the firm
experienced steady growth in sale volume after diversification;
3 of 6 respondents agree that there was steady growth in overall profitability after the
firm diversified;
3 of 6 respondents neither agree nor disagree that improvement in the utilization of
resources was realized after diversification;
3 of 6 and 2 of 6 respondents neither agree nor disagree and strongly agree,
respectively, that a boost in the corporate image of the firm was achieved, after
diversification;
2 of 6 respondents disagree and agree that their firms achieved an edge over
competitors, post diversification;
2 of 6 respondents agree and strongly agree that the firm’s management structure
had to change after diversification;
3 of 6 respondents neither agree nor disagree that more professionals and skilled
staff have to be employed, after the firm diversified;
2 of 6 respondents disagree and agree that at a point, the firm had to divest its
interest in some business to refocus its operation due to failure in such businesses,
post diversification;
2 of 6 respondents disagree and neither agree nor disagree that the company did not
enjoy economy of scope – build synergies in asset utilization, after diversification;
2 of 6 respondents disagree that it was not possible to achieve economy of scale
because of production type – usually customized products, post diversification;

62
2 of 6 respondents strongly disagree and agree that their firms were unable to create
a monopoly in the market, after diversification.
The responses in this subsection suggest that the implementation of diversification strategy
may improve sales volume, increase overall profitability, boost corporate image and change
a firm’s management structure. The responses are in support of the notion that economy of
scale can be achieved with customized products and that a monopoly can still be created
post diversification.
The analyses show that there may be no significant changes to: the utilization of resources;
edge over competitors; employment of professional and skilled staff; and business failures
due to the implementation of diversification strategy. The responses reveal that there might
be no benefit of economy of scope, i.e. synergies in asset utilization post diversification.
4.2.6.5 Subsection E9: Barriers to diversification strategy
Subsection E9 obtained information on barriers to achieving diversification in the
construction industry. The result reveals the total variances explained to be 84.5%. There
are three (3) components created from the list of twelve (12) variables being measured in
this section. Appendices G17 to G20 show the details of the results.
The results show that the following variables with the associated component loadings are
correlated to independent lateral constructs:
component 1: ‘there was not enough attention and investment to new business(es)’
(0.964); ‘inadequate planning before diversification was implemented’ (0.956); ‘unable to
build sufficient synergy for profitable growth’ (0.883); ‘management has poor knowledge
of new business environment’ (0.860); and ‘too many peripherical activities unrelated to
main business’ (0.835);
component 2: ‘insufficient information about new market and customer preferences’
(0.944); ‘customers were reluctant to try out new products’ (0.944); ‘lack of transferable
knowledge and technology and skills’ (0.906); ‘unaware of market restrictions through
legislations against foreign firms’ (0.817) and ‘stiff competition in the new market and
product’ (0.634);

63
component 3: ‘need of services of professional consultants to help with the development
of the strategy plan’ (0.929) and ‘business was acquired by mistake’ (0.541).
Component 1 has a variance of 40.89% and 36.24% of total variance explained, before and
after rotation respectively (see Appendix G18). The themes of the variables that are
correlated to component 1 under subsection E9 are: management’s lack of interest and
knowledge on other businesses and poor planning and implementation of diversification
strategy.
Component 2 has a variance of 32.17% and 33.20% of total variance explained, before and
after rotation respectively. The themes of the variables that are correlated to component 2
are: management’s and client’s insufficient knowledge on diversification, management’s lack
of knowledge of government’s protection of local firms against foreign firms and high
competition in the new market.
Component 3 has a variance of 11.45% and 15.07% of total variance explained, before and
after rotation respectively. The theme of the variables that are correlated to component 3 is:
lack of the involvement of professional consultants on strategy development and business
acquisition.
4.2.6.6 Subsection E10: Factors influencing decision not to diversify
The results from the analysis of this subsection, according to Appendix F19, show that:
2 of 3 respondents strongly agree that they are satisfied with the present level of growth
in their companies.
1 of 3 agree that they consider diversification process to be too difficult and involving;
they have inadequate resources (human, technical and financial); present market is not
saturated and there are more opportunities; there is high cost involved in diversification;
they prefer to be focused and specialized in present business; diversified companies are
not doing better;
1 of 3 disagree that: they have insufficient knowledge of other types of businesses;
present market is not saturated; there is high cost involved in diversification; prefer to be
focused and specialized in present business; diversified business are not doing better.
64
1 of 3 strongly disagree that: they have insufficient knowledge of other types of
businesses; they consider diversification process too difficult / involving; they have
inadequate resources (human, technical and financial).
The responses in this subsection suggest that undiversified firms may have decided not to
diversify due to the satisfaction with the current level of growth in their firms.
4.2.6.7 Subsection E11: Additional comments from respondents
This subsection obtained general observations and comments from the respondents that
could help improve the study, which was not covered. One of respondents from a
moderately diversified firm remarked that, ‘over a certain size, large companies reach critical
mass and cannot expand without a merger or acquisition’. He further stated that ‘mergers
and acquisitions cannot work unless it is very carefully planned, managed, and done with a
very high level of communication’. There was a comment from one of the undiversified firms
which is a specialist firm on rail track construction and maintenance that ‘the industry they
operate in, is small and dependent on decisions at Trans-Freight environment’. There was
another remark that ‘the relevance of questions on the questionnaires be checked’.
4.3 Analysis of Secondary Data (Financial Ratios)
Financial data was requested from a consolidated list of 17 firms. Eight (8) out of these 17
firms provided the requested information. One (1) of the firms declined the request for
financial information, which it considered too sensitive to be released. This translates to
47.06% response rate on financial information. The breakdown of the response is provided
in the following Table 4.3:
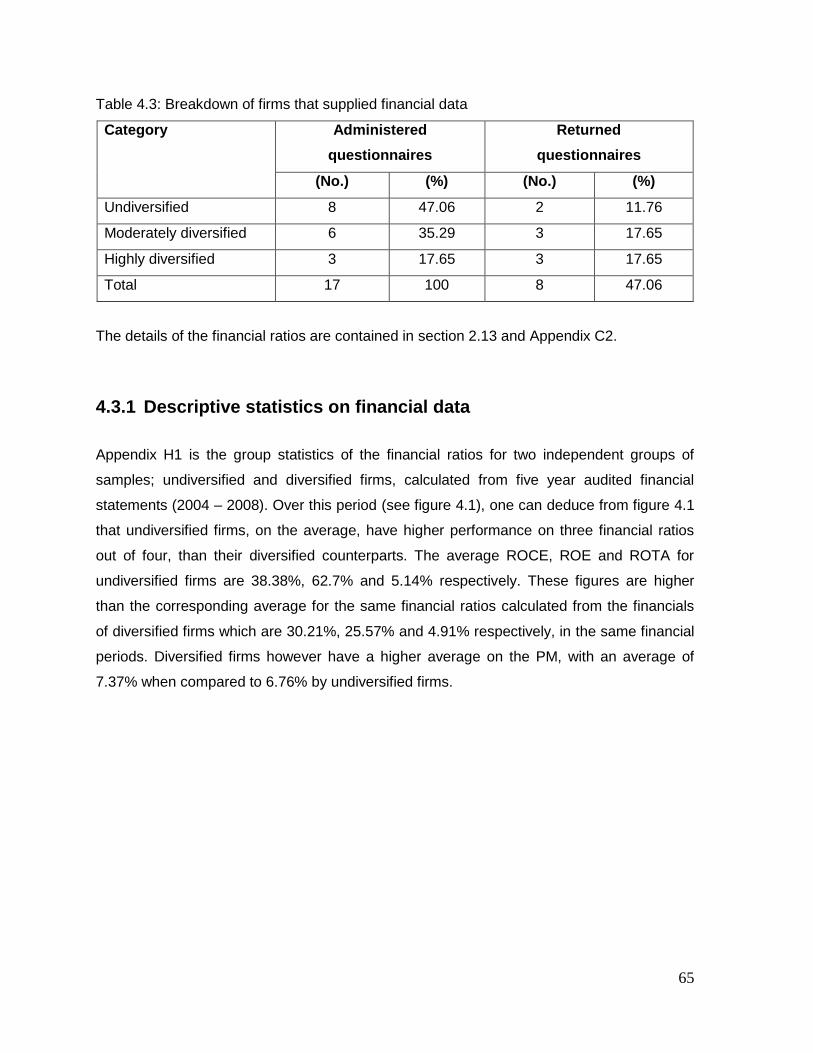
65
Table 4.3: Breakdown of firms that supplied financial data
Category Administered
questionnaires
Returned
questionnaires
(No.) (%) (No.) (%)
Undiversified 8 47.06 2 11.76
Moderately diversified 6 35.29 3 17.65
Highly diversified 3 17.65 3 17.65
Total 17 100 8 47.06
The details of the financial ratios are contained in section 2.13 and Appendix C2.
4.3.1 Descriptive statistics on financial data
Appendix H1 is the group statistics of the financial ratios for two independent groups of
samples; undiversified and diversified firms, calculated from five year audited financial
statements (2004 – 2008). Over this period (see figure 4.1), one can deduce from figure 4.1
that undiversified firms, on the average, have higher performance on three financial ratios
out of four, than their diversified counterparts. The average ROCE, ROE and ROTA for
undiversified firms are 38.38%, 62.7% and 5.14% respectively. These figures are higher
than the corresponding average for the same financial ratios calculated from the financials
of diversified firms which are 30.21%, 25.57% and 4.91% respectively, in the same financial
periods. Diversified firms however have a higher average on the PM, with an average of
7.37% when compared to 6.76% by undiversified firms.

66
ROCE ROE ROTA PM
Undiversified 38.38 62.7 5.14 6.76
Diversified 30.21 25.57 4.91 7.37
0
10
20
30
40
50
60
70
ROCE ROE ROTA PM
Means of Financial Ratios
Undiversified Diversified
38.38%
30.21%
62.70%
25.57%
5.14% 4.91% 6.76% 7.37%
Figure 1: Graphical representation of the means of financial ratios for two
independent samples
Appendix H2 is the group statistics of the financial ratios for three independent groups of
samples; undiversified, moderately diversified and highly diversified firms, calculated from
five year audited financial statements (2004 – 2008). Over this period (see figure 4.2),
undiversified firms had the highest ROCE and ROE, followed by moderately diversified and
highly diversified firms respectively. On ROTA, moderately diversified firms had the highest
average, followed by undiversified and highly diversified firms respectively. Highly diversified
firms had the highest average on PM, followed by undiversified firms, which is closely
followed by moderately diversified firms.

67
ROCE ROE ROTA PM
Undiversified 38.38 62.70 5.14 6.76
Moderately diversified 36.98 31.02 6.28 6.56
Highly diversified 24.79 21.22 3.72 8.08
0
10
20
30
40
50
60
70
ROCE ROE ROTA PM
Means of Financial Ratios
Undiversified Moderately diversified Highly diversified
38.38% 36.98%
24.79%
62.70%
31.02%
21.22%
5.14% 6.28% 3.72%
6.76% 6.56% 8.08%
Figure 2: Graphical representation of the means of financial ratios for three
independent samples
Results of the Test of Normality of Data
The results of the test of normality of the financial data received from the firms are displayed
in Table 4.4. The p values from the tests were compared to the level of significance of 5%
(0.05). The result of the test revealed that return on capital employed (ROCE) and return on
total asset (ROTA) represent normal distribution while return on equity (ROE) and profit
margin (PM) are not normally distributed.
Table 4.4: Kolmogorov Smirnov test for normality at 5% level of significance
Financial Ratio P-value Outcome
Return on capital employed (ROCE) (%) 0.264 Normal
Return on equity (ROE) (%) 0.027 Not normal
Return on total asset (ROTA) (number of times) 0.605 Normal
Profit margin (PM) (%) 0.024 Not normal
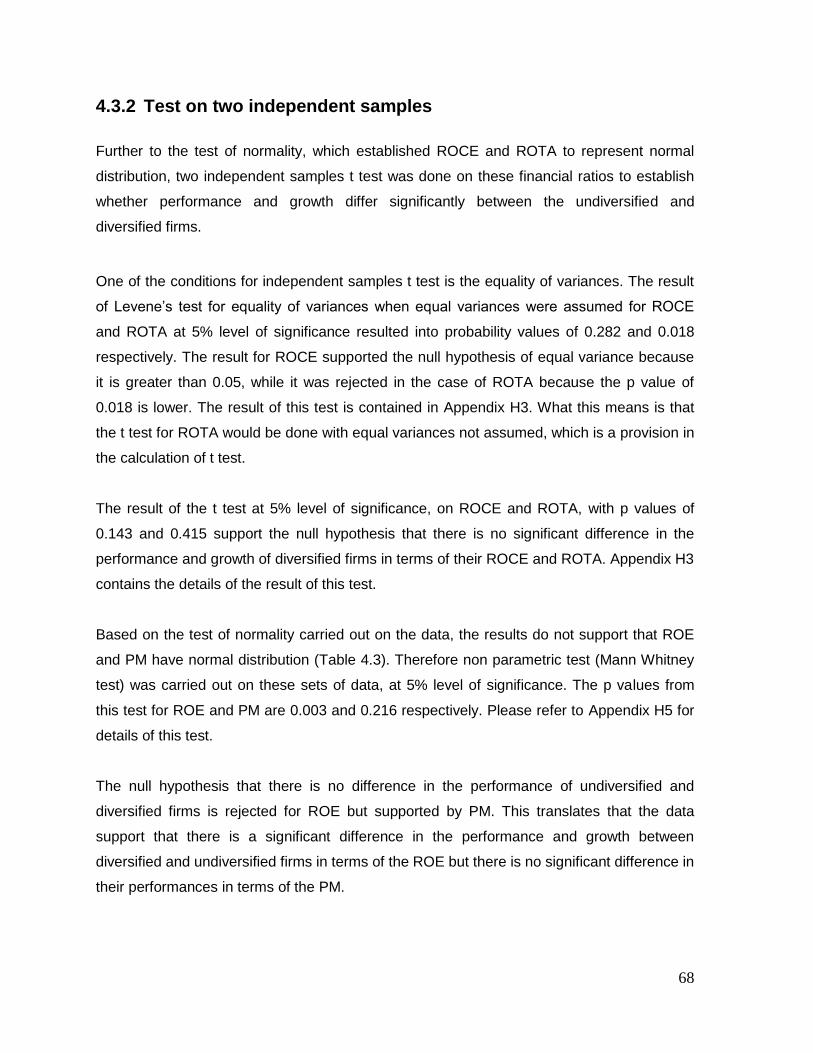
68
4.3.2 Test on two independent samples
Further to the test of normality, which established ROCE and ROTA to represent normal
distribution, two independent samples t test was done on these financial ratios to establish
whether performance and growth differ significantly between the undiversified and
diversified firms.
One of the conditions for independent samples t test is the equality of variances. The result
of Levene’s test for equality of variances when equal variances were assumed for ROCE
and ROTA at 5% level of significance resulted into probability values of 0.282 and 0.018
respectively. The result for ROCE supported the null hypothesis of equal variance because
it is greater than 0.05, while it was rejected in the case of ROTA because the p value of
0.018 is lower. The result of this test is contained in Appendix H3. What this means is that
the t test for ROTA would be done with equal variances not assumed, which is a provision in
the calculation of t test.
The result of the t test at 5% level of significance, on ROCE and ROTA, with p values of
0.143 and 0.415 support the null hypothesis that there is no significant difference in the
performance and growth of diversified firms in terms of their ROCE and ROTA. Appendix H3
contains the details of the result of this test.
Based on the test of normality carried out on the data, the results do not support that ROE
and PM have normal distribution (Table 4.3). Therefore non parametric test (Mann Whitney
test) was carried out on these sets of data, at 5% level of significance. The p values from
this test for ROE and PM are 0.003 and 0.216 respectively. Please refer to Appendix H5 for
details of this test.
The null hypothesis that there is no difference in the performance of undiversified and
diversified firms is rejected for ROE but supported by PM. This translates that the data
support that there is a significant difference in the performance and growth between
diversified and undiversified firms in terms of the ROE but there is no significant difference in
their performances in terms of the PM.

69
4.3.2 Test on three independent samples
In testing the difference of means in the three categories of firms; undiversified, moderately
diversified and highly diversified, the one-way ANOVA test was employed. More details are
contained in Appendix H6. Since normality is supported by ROCE and ROTA, ANOVA
would be applicable. However, one of the conditions for the use of ANOVA is homogeneity
of variances. Appendix H7 contains details of test of homogeneity of variances.
A test of homogeneity of variances was carried on the two sets of data (ROCE and ROTA)
at 5% level of significance. The null hypotheses of homogeneity of variances are supported
and rejected with p values of 0.371 and 0.003 on ROCE and ROTA respectively (see
Appendix H7). This means that ANOVA could not be carried out on ROTA because the
result did not support the null hypothesis of homogeneity of variance. Therefore only ROCE
could be tested with ANOVA. See Appendix H8 for more details. ROTA, ROE and PM were
analysed by Kruskal-Wallis test. The result of Kruskal-Wallis test is shown in Appendix H9.
The result of ANOVA on ROCE, with a p value of 0.091 supports the null hypothesis that
there is no significant difference in the performance and growth of the three categories of
firms, in terms of their ROCE. The result of the Kruskal-Wallis test carried out on ROTA,
ROE and PM, with p values of 0.003, 0.014 and 0.708 shows that the null hypothesis is not
supported in terms of ROTA and ROE. It is however supported by the results of the test on
PM. Please refer to Table 4.5 for a summary of the results of tests of hypothesis.
Table 4.5: Summary of tests of hypothesis
Financial ratios Two (2) independent samples Three (3) independent samples
ROCE Supports null hypothesis Supports null hypothesis
ROE Null hypothesis is rejected Null hypothesis is rejected
ROTA Supports null hypothesis Null hypothesis is rejected
PM Supports null hypothesis Supports null hypothesis
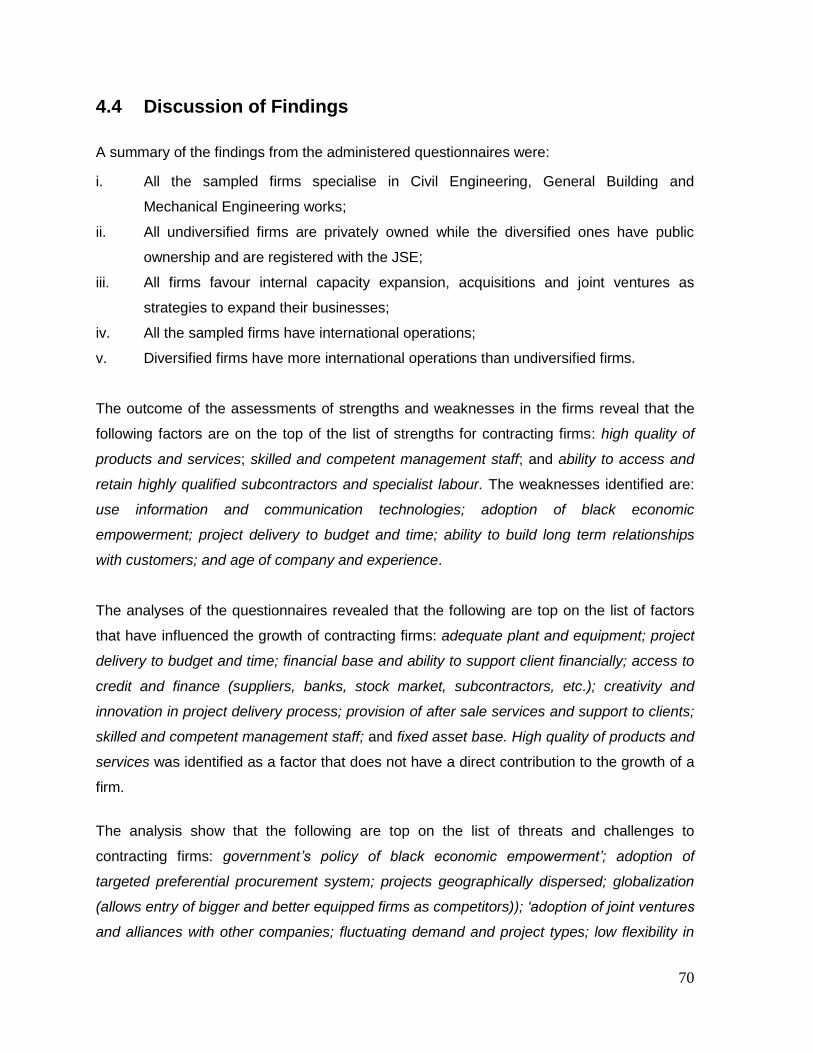
70
4.4 Discussion of Findings
A summary of the findings from the administered questionnaires were:
i. All the sampled firms specialise in Civil Engineering, General Building and
Mechanical Engineering works;
ii. All undiversified firms are privately owned while the diversified ones have public
ownership and are registered with the JSE;
iii. All firms favour internal capacity expansion, acquisitions and joint ventures as
strategies to expand their businesses;
iv. All the sampled firms have international operations;
v. Diversified firms have more international operations than undiversified firms.
The outcome of the assessments of strengths and weaknesses in the firms reveal that the
following factors are on the top of the list of strengths for contracting firms: high quality of
products and services; skilled and competent management staff; and ability to access and
retain highly qualified subcontractors and specialist labour. The weaknesses identified are:
use information and communication technologies; adoption of black economic
empowerment; project delivery to budget and time; ability to build long term relationships
with customers; and age of company and experience.
The analyses of the questionnaires revealed that the following are top on the list of factors
that have influenced the growth of contracting firms: adequate plant and equipment; project
delivery to budget and time; financial base and ability to support client financially; access to
credit and finance (suppliers, banks, stock market, subcontractors, etc.); creativity and
innovation in project delivery process; provision of after sale services and support to clients;
skilled and competent management staff; and fixed asset base. High quality of products and
services was identified as a factor that does not have a direct contribution to the growth of a
firm.
The analysis show that the following are top on the list of threats and challenges to
contracting firms: government’s policy of black economic empowerment’; adoption of
targeted preferential procurement system; projects geographically dispersed; globalization
(allows entry of bigger and better equipped firms as competitors)); ‘adoption of joint ventures
and alliances with other companies; fluctuating demand and project types; low flexibility in

71
operation and company organization structure; low financial base and access to credit and
finance (suppliers, banks, stock market, subcontractors, etc.); over specialization in
operation and market already saturated); and ’high establishment cost to maintain
branches).
The study shows that majority (67.67%) of undiversified firms responded that they are
interested in diversifying but are not interested now and in the near future. Equal
percentages (33.33%) of undiversified firms are likely to adopt the following types of
diversification - addition of new products which are related to current business; and
movement into new markets by expanding client base and shareholding in other businesses
(without active participation). Majority (66.67%) of the firms would prefer to build capacity
within the core competence of the firm (internal organic growth) as the preferred mode of
diversification. The same percentage would use both internal and external human resource
to achieve diversification. Results of the analyses reveal that functional and divisional
management structures are currently preferred and scored highest as the likely structures
after the firms might have diversified.
A fair percentage (50%) of diversified firms are: currently diversified by moving into new
markets (expansion of client base) and shareholding in other businesses (without active
participation). When asked to provide the options that best suits their organizations, 50% of
diversified firms responded that movement into new markets (expansion of client base) –
with existing products best suits their organizations. On the other hand, 66.67% responded
that retailing in related and unrelated goods least suit their type of organizations. When
asked to indicate the mode of diversification adopted by diversified firms, 83.33% responded
in favour of movement into new markets and capacity building within firm’s area of core
competence, under the internal organic growth mode of diversification. Under the external
mode of diversification, 100% of diversified firms responded in favor of joint venture/alliance
as their mode of diversification.
The study found that the process of diversification in the diversified firms was achieved
equally (50% each) by internal management staff, and both internal and external staff. It was
found that the use of functional structures in the firms decreased from 50% to 33.34% after
diversification; the use of regional administration in the firms remained unchanged at
33.34%; and the use of divisional structures increased from 33.34% to 50% after the firms
diversified.

72
The study found that 100% of diversified firms use a central financial reporting system.
When asked what the motivation for diversification was, the responses on top of the list
were – hope to enjoy economy of scale through operational efficiencies; hope to enjoy
economy of scope through building of synergies in asset utilization; attracted to more
profitable business(es); need to engage unutilized resources; desire to create a monopoly in
the market; and present market is saturated-stiff competition.
The results from the study suggest that diversified firms might have experienced steady
growth in sale volume, enjoyed economies of scope as a result of synergies in asset
utilization, and possibly of economies of scale regardless of the type of product the firm
offers, after the firm diversified. The study further reveals that diversification may not
necessarily lead to the improvement in the utilization of resources, achievement of
competitive edge over competitors, the need or demand for more professionals and skilled
staff, the failure in business and the creation of market monopoly.
The results of the analysis reveal the following as top on the list of barriers to diversification
strategy: there was not enough attention and investment to new business(es); inadequate
planning before diversification was implemented; unable to build sufficient synergy for
profitable growth; management has poor knowledge of new business environment; and too
many peripheral activities unrelated to main business. The most important factor which may
influence decision not to diversify is the satisfaction with the existing growth in a firm.
When the performances of the two independent samples of firms (undiversified and
diversified) were compared, the outcome of the study reveals that on average, undiversified
firms perform better than diversified ones on ROCE, ROE and ROTA. Diversified firms
however have better performance on PM. The result of tests of hypothesis on ROCE, ROTA
and PM supports the null hypothesis that there is no significant difference in the
performance and growth of undiversified and diversified firms. However, on the ROE, the
null hypothesis is rejected. This result suggests that the management of undiversified firms
are creating more value per unit share capital for investment made.
When the three independent samples of firms (undiversified, moderately diversified and
highly diversified) were compared, the results suggest that undiversified firms had the
highest average on ROCE and ROE, followed by moderately diversified and highly
diversified firms respectively. On ROTA, moderately diversified firms had the highest

73
average, followed by undiversified and highly diversified firms respectively. Highly diversified
firms had the highest average on PM, followed by undiversified and moderately diversified
firms respectively. The results of test of hypothesis on ROCE and PM show that the null
hypothesis which states that there is no significant difference in the performance and growth
of contracting firms is supported by the data. The null hypothesis is not supported in terms
of ROTA and ROE. The result of the study suggests that the management teams of
undiversified firms are more effective than moderately and highly diversified firms in utilizing
their assets in generating profit. The finding on ROE for the three groups is similar in that it
suggests that the management teams of undiversified firms are creating more value per unit
share capital on investment made in these firms.

74
CHAPTER FIVE: CONCLUSIONS AND
RECOMMENDATIONS
5.1 Summary of report
The history of South Africa is marked with racial imbalances in all spheres of the society,
including the construction industry. The government has attempted to reverse these
imbalances through procurement policies which favour individuals disadvantaged by policies
of apartheid.
The implication of preferential procurement policy is that less government contracts are
awarded to HAIs. This reality informs various innovative and survival strategies in the
industry. The competition from foreign firms within the industry and low entry barriers
presumably aggravated the challenge of shrinking market share. These inform the need for
contracting firms in South Africa to build competitive advantage in order to achieve a
reasonable level of financial performance and growth for all stakeholders. This exploratory
study is an attempt at investigating the relationship between diversification strategies
adopted by established contracting firms, and the financial performance and growth that
result from these strategies. This study takes a cue from a research conducted by Palich et
al. (2000).
A review of literature is presented in Chapter 2, which suggests that there are incoherent
results from studies into the subject of diversification strategies and performance and
growth. This subject has not received much attention in the construction industry. Lack of
adequate literature during the study attests to this assertion. Review of literature reveals that
strategic assets are requisites for competitive advantage, which create superior economic
performance and growth, in a normal market environment. However, sustained superior
economic performance has been found to be rare (Ofori and Chan, 2000). This implies that
firms need to continuously build and create new strategic assets which respond to market
demands per time, in order to remain competitive and operate at an advantage over rival
firms. Sampled firms’ performances were measured by calculating the ROTA, ROE, ROCE
and PM.

75
Research methods adopted in the study and their justifications are discussed in Chapter 3.
Sample selection and further sample categorization processes are also explained, including
the various statistical tests undertaken on the study. Chapter 4 contains the analyses of data
received from the questionnaires and financial data. The findings from the results of the
analyses were discussed and inferences made.
5.2 Results of Hypothesis Testing
The following are the results of hypotheses postulated for the study:
Hypothesis (H1): The financial performance of diversified firms is better than that of
undiversified ones.
The test of this hypothesis using ROCE, ROTA and PM support the null hypothesis that
there is no significant difference in the performances and growth of undiversified and
diversified firms. However, the ROE results support the alternative hypothesis that there is a
significant difference in the performance and growth between the two categories of firms.
Hypothesis (H2): The financial performance of established contracting firms is linearly
related to their diversification strategies.
The test of this hypothesis using ROCE and PM show that the null hypothesis, which states
that there is no significant difference in the performance and growth of contracting firms, is
supported by the data. The null hypothesis is not supported in terms of ROTA and ROE.
5.3 Summary of objectives, results and conclusions
The objectives of this study were: 1. To classify all South African contracting firms on the Construction Industry Development
Board, CIDB (level 9) database based on the categories of work registered for, using
globally accepted diversification categories. This was achieved in chapter 3.
2. To measure the financial performance and growth of each of the firms classified above
using robust financial indices. After measuring the financial performance and growth of
each of the firms, a comparative analysis would be undertaken to determine trends and
relationships. This was achieved in chapter 4.

76
3. To explore the relationships that exist between diversification and financial performance
and growth in order to determine the marginal growth differences between undiversified,
moderate and highly diversified established contracting firms within the construction
industry. This was achieved in chapter 4.
The analyses carried out to address the above objectives produced the following findings:
On average, undiversified firms perform better than the diversified ones. This result
lends itself to the conclusion reached by Pandya and Rao (1998) in their study of 2,000
firms in multiple industries, that the best performing firms are the specialised ones.
The result in this study is in support of Tasi (1994), who concluded that specialization is
favourable to maximize expected return.
The result is in agreement with Hill and Hansen (1991) who concluded, on their study in
the pharmaceutical industry in the US that undiversified firms performed better than
diversified ones.
No particular pattern of performance was established when comparisons were made
across the three categories of firms; undiversified, moderately diversified and highly
diversified groups. However, previous studies such as Choi and Russel (2005); Gort
(1965); Palepu (1985) and Chang and Thomas (1989) who concluded that there is no
significant relationships between firm performance and level of diversification, are
supported by the results in this study with respect to ROCE and PM only.
The result support recent study by Ibrahim et al., (2009) who found no difference in the
performance of three diversification groups. This agreement is based on ROCE only.
The findings contradict Rumelt (1974), who concluded that diversified firms in general,
outperform others.
The findings are in agreement with Capon et al. (1988) who argue that firms that
concentrate in a market area should have superior financial performance.
All the moderately and highly diversified firms are listed and undiversified ones are
privately owned. This is in agreement with Kim and Reinschmidt (2011) who assert that
larger firms tend to be more diversified than smaller firms. This may also point to the fact
that diversified firms have more capacity in that they have shifted from focus to broadly
targeted competitive strategy, according to Chung and Cheah (2006).
One may conclude that undiversified firms are involved in highly specialised areas.

77
Most of the undiversified firms operate as specialist contractors. From questionnaire
responses, these firms seem to be satisfied with their levels of growth and as a result,
most of them are not interested in diversifying now and in the near future.
Undiversified and diversified firms seem to be equally interested in the same types of
diversification; movement into new markets by expanding client base and shareholding
in other businesses (without active participation).
Undiversified and diversified firms favour internal capacity building within the
organization’s core competence (internal organic growth) as a mode of diversification.
Undiversified firms appear to prefer functional and divisional management structures for
their existing strategy and would likely implement the same after they may have
diversified. For the diversified firms, there is a decline in the use of functional structure,
there is no change in the use of regional administration, and the use of divisional
structure increased.
Diversified firms seem to have preference for joint venture and alliance as external mode
of diversification.
The study results suggest that the use of central financial reporting system is common to
all diversified firms.
The anticipation of economies of scale through operation efficiencies, the anticipation of
economy of scope through building of synergies in asset utilization, the attraction to
more profitable businesses, the need to engage unutilized resources, the desire to
create a monopoly in the market and the impression that the current market is saturated
seem to be some of the important motivations for diversification in diversified firms.
It seems that synergies in asset utilization in diversified firms could positively improve
sale volume. It is also noteworthy that diversification may not bring about the following:
improvement in resource utilization, achievement of competitive edge over competitors,
the need for more professionals and skilled staff, the failure in business, and the creation
of market monopoly.
The lack of attention to new businesses, the inadequate planning before diversification,
the inability to build sufficient synergy for profitable growth, the management’s poor
knowledge of new business environment and the existence of too many peripheral
activities unrelated to main business have been identified as possible barriers to a
diversification exercise.
The decision not to diversify may be influenced by the level of satisfaction with the
existing growth in the firm.

78
It should be noted that firms can diversify for reasons that may not be related to the
growth of the firm.
The implementation of government’s policy of black economic empowerment and
adoption of targeted preferential procurement system are the two issues that top the list
of challenges and threats to the growth of the firms.
5.4 Assumptions and limitations of the study
The sample size in the study was relatively small, which may make the findings not
generalizable.
This study is not predictive of financial performance of contracting firms, neither is it a
model for outcomes of diversification efforts.
The study did not look into the business models employed by contracting enterprises.
The study did not classify contracting firms according to the sector or industry that they
are active in. For instance, the nature of client such as mining, concession, specialist
contracting and subcontracting, manufacturing, professional services, project financing,
infrastructure development, development management, etc.
The study is restricted to relatively recent times.
The study experienced some outliers from the financial data of some of the sampled
firms.
The study could not employ advanced analysis techniques because the sample size was
not large enough.
Some of the firms sampled in the study have a huge project order from international
contracts. This may misrepresent the findings, as some other firms only rely on the
South African local market for their income.
The study did not take any corrective measures or adjustment on the financial
information received from the sampled firms. Some might have restructured the financial
statements to take the benefit of tax incentives or have a particular financial outlook, as
the management of the firm may have deemed fit.
The results in the study are discussed conservatively and conscious effort has been
made not to draw broad conclusions based on this single study, as it is possible that the
results are an aberration from the actual state of things in the industry.
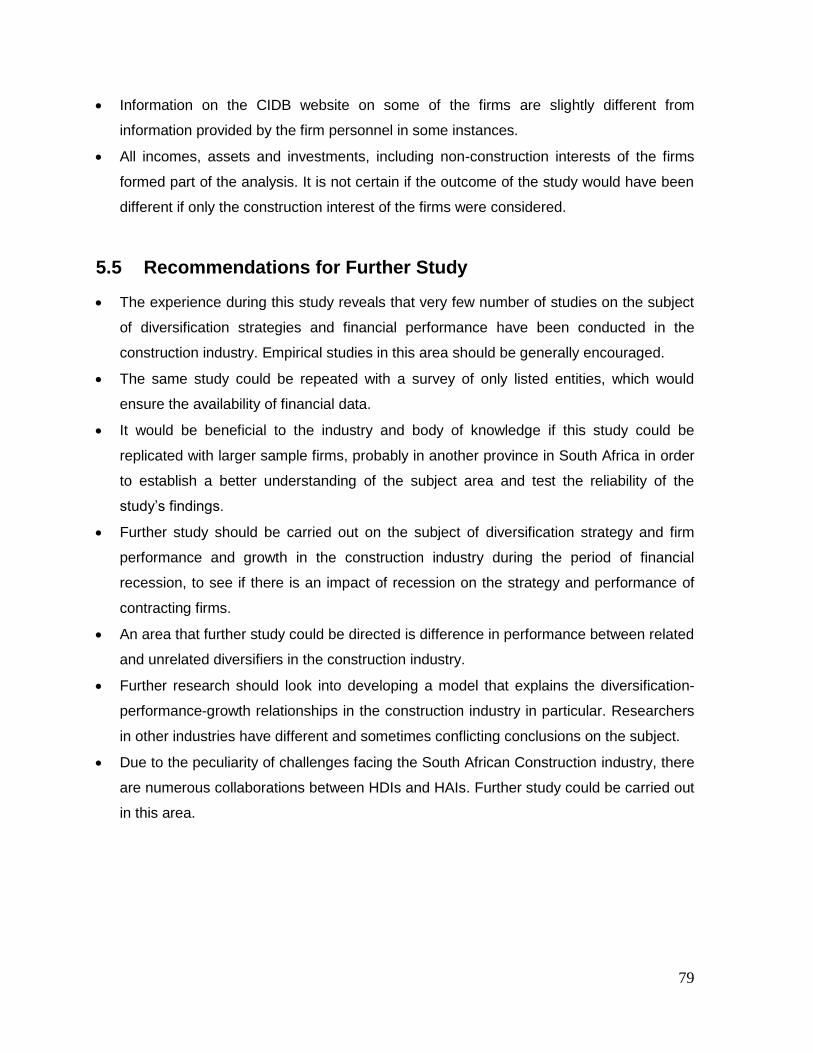
79
Information on the CIDB website on some of the firms are slightly different from
information provided by the firm personnel in some instances.
All incomes, assets and investments, including non-construction interests of the firms
formed part of the analysis. It is not certain if the outcome of the study would have been
different if only the construction interest of the firms were considered.
5.5 Recommendations for Further Study
The experience during this study reveals that very few number of studies on the subject
of diversification strategies and financial performance have been conducted in the
construction industry. Empirical studies in this area should be generally encouraged.
The same study could be repeated with a survey of only listed entities, which would
ensure the availability of financial data.
It would be beneficial to the industry and body of knowledge if this study could be
replicated with larger sample firms, probably in another province in South Africa in order
to establish a better understanding of the subject area and test the reliability of the
study’s findings.
Further study should be carried out on the subject of diversification strategy and firm
performance and growth in the construction industry during the period of financial
recession, to see if there is an impact of recession on the strategy and performance of
contracting firms.
An area that further study could be directed is difference in performance between related
and unrelated diversifiers in the construction industry.
Further research should look into developing a model that explains the diversification-
performance-growth relationships in the construction industry in particular. Researchers
in other industries have different and sometimes conflicting conclusions on the subject.
Due to the peculiarity of challenges facing the South African Construction industry, there
are numerous collaborations between HDIs and HAIs. Further study could be carried out
in this area.

80
REFERENCES
ACCA, Association of Chartered Certified Accountants (2008). Official text for the
professional qualification; Paper F7 INT, financial reporting (FR). Kaplan Publishing,
UK.
Ahmadjian, C. L. and Robbins, G. E. (2005). A clash of capitalism: foreign shareholders and
corporate restructuring in 1990s Japan. American Sociological Review, Vol. 70, pp. 451-
471.
Akintoye, A. and Skitmore M. (1991). Profitability of UK construction contractors.
Construction Management and Economics, Vol. 9, pp. 311 – 325.
Andreu, R., Claver, E. and Quer, D. (2008). Type of diversification and firm resources: new
empirical evidence from the Spanish tourism industry. International Journal of Tourism
Research, Vol. 11, issue 3, pp. 229-239.
Aoki, M. (2001). Towards a comparative institutional analysis. MIT Press, Cambridge, MA.
Arnould, R. J. (1969). Conglomerate growth and profitability, In L. Garoian (ed.), Economics
of Conglomerate Growth. Oregon State University, Corvallis, OR, pp. 72–80.
Barney, J. B. (1991). Firm resources and sustained competitive advantage. Journal of
Management, 17, pp. 99-120.
Barney, J.B (1986). Strategic factor markets: expectations, luck and business strategy.
Management Science, 32, pp. 1232-1241.
Becker, G.S. (1964). Human capital: a theoretical and empirical analysis, with special
reference to education. Columbia University Press, New York.
Brown, S.L. and K. M. Eisenhardt (1997). The art of continuous change: linking complexity
theory and time-paced evolution in relentless shifting organizations. Administrative
Science Quarterly, 42, pp. 1-34.
Buhner, R. (1987). Assessing international diversification of West German corporations.
Strategic Management Journal, 8 (1): 25-37.
Cannon J. and Hillebrandt P.M. (1989). Diversification in the management of construction
firms: aspects of theory. Hillebrandt, P.M and Cannon, J. (eds), pp. 31-42. Macmillan,
Basingstoke.
Capar, N. and Kotabe, M. (2003). The relationship between international diversification and
performance in service firms. Journal of international Business studies, 34, pp. 345-355.

81
Capon, N., Hulbert, J. M., Farley, J. U. and Martin, L. E. (1988). Corporate diversity and
economic performance: the impact of market specialization. Strategic management
Journal, Vol 9, No. 1 (Jan-Feb 1988), pp 61-74.
Chakrabarti, A., Singh, K. and Mahmood, I. (2007). Diversification and performance:
evidence from East Asian firms. Strategic Management Journal, 28, pp. 101-120.
Chang, S. J. and Hong, J. (2002). How much does the business group matter in Korea?
Strategic Management Journal, 23(3), pp. 265-274.
Chang, Y. and Thomas, H. (1989). The impact of diversification strategy on risk-return
performance. Strategic Management Journal, 10(3), pp. 271–284.
Cheah, C.Y.J. and Garvin, M.J. (2004). An open framework for corporate strategy in
construction. Journal of Engineering, Construction and Architectural Management, 11(3),
pg. 176.
Cheah C.Y., Garvin M.J and Miller J.B. (2004). Empirical study of strategic performance of
global construction firms. Journal of Construction Engineering and Management, Vol.
130, no 6, pp. 808 – 817.
Cheah, C.Y.J., Kang, J. and Chew, D.A. S.(2007). Strategic analysis of large local
construction firms in China. Construction Management and Economics, 25, issue 1,
January 2007, pp 25-38.
Cheah, C.Y.J. and Chew, D.A.S. (2005). Dynamics of strategic management in the Chinese
construction industry. Management Decision, 43(4), 551–67.
Cheah, Y.J. (2002). Fundamental analysis and conceptual model for corporate strategy in
global engineering and construction markets. PhD dissertation, Massachusetts Institute
of Technology, Cambridge, MA.
Chinowsky, P.S. (2000) Strategic Corporate Management for Engineering, Oxford University
Press, New York.
Choi, J. and Russel J. S. (2004). Economic gains around mergers and acquisitions in the
construction industry of the United States of America. Canadian Journal of Civil
Engineering. Vol. 31, No. 3, pp. 513 – 525.
Choi, J. and Russel, J.S. (2005). Long-term entropy and profitability change of United States
public construction firms. Journal of Management in Engineering, 21(1), pp. 17–26.
Christensen, H. K. and Montgomery C. A. (1981). Corporate economic performance:
diversification strategy versus market structure. Strategic Management Journal, 2(4), pp.
327–343.
Christensen, L.B. (2001). Experimental methodology. 8th ed. Boston: Allyn & Bacon.

82
Chung, Y.Y. and Cheah, C.Y.J. (2006). Fundamental analysis of profitability of large
engineering and construction firms. Journal of Management in Engineering, Vol. 22, no.
4.
CIDB, Construction Industry Development Board (2004a). Annual report of the CIDB 2002 -
2003, January 2004. CIDB, Pretoria.
CIDB, Construction Industry Development Board (2004b), South African construction
industry status report 2004: synthesis review on the South African construction industry
and its development. Discussion document, CIDB, Pretoria.
CIDB, Construction Industry Development Board (2007). Annual report of the CIDB 2006 –
2007, October 2007. CIDB, Pretoria.
CIDB, Construction Industry Development Board (2008). Annual report of the CIDB 2007 -
2008, October 2008. CIDB, Pretoria.
Comrey, A.L. and Lee, H.B. (1992). A first course in factor analysis. Lawrence Earlbaum
Associates, Hillsdale, NJ.
Conner, K. R. (1991). A historical comparison of resource-based theory and five schools of
thought within industrial organization economics: do we have a new theory of the firm?
Journal of Management, 17, pp. 121-124.
construction firms in China. Construction Management and Economics, 25, 1, 25-38.
Cooper, D.R. and Schindler, P.S. (2008). Business research methods. 10th ed. McGraw-Hill
Irwin.
CSS (1997). The 1994 census of construction. Central Statistical Service, Pretoria.
Davis Langdon (2005). Nature of South African Construction Industry, World Construction
2005–2006. Davis Langdon.
Denis, D.J., Denis, D.K. and Yost, K. (2002). Global diversification, industrial diversification,
and firm value, The Journal of finance, Vol. LVII, No. 8, October 2002.
Dierickx, I. and K. Cool (1989). Asset stock accumulation and sustainability of competitive
advantage. Management Science, 35, pp. 1504-1514.
Dlungwana, S., Nxumalo, X.H., Huysteen, S., Rwelamila, P.D. and Noyana, C. (2002).
Development and implementation of the South African Construction Excellence Model
(SACEM). Proceedings of the international conference on construction in the 21st
Century (CITC2002). 25-26 April 2002, Miami, Florida, USA.
Donaldson, L. (2000). Organizational portfolio theory: performance driven organization
change. Contemporary Economic Policy, 18, pp. 386-396.

83
Douglas J. M. (2004). Firms’ technological resources and performance effects of
diversification: a longitudinal study. Strategic Management Journal, 25; 1097-1119.
Doukas, J.A. and Lang, L.H.P. (2003). Foreign direct investment, diversification and firm
performance. Journal of International Business Studies, 34, pp. 153-172.
Duhaime, I.M., and Stimpert, J.L. (1994). Seeing the big picture: the influence of industry
diversification and business strategy on firm performance. Unpublished working paper,
University of Memphis, Memphis, TN.
Erramilli, M.K. (1991). The experience factor in foreign market entry behavior of service
firms. Journal of International Business Studies, 22(3): 479-501.
Fan, J.P.H. and Lang, L.H.P. (2000). The measurement of relatedness: an application to
corporate diversification. The Journal of Business, Vol 73, No.4 , pp. 629-660
Fellows, R.F., Langford, D., Newcombe, R., Urry, S. (2003). Introduction to strategic
management, in Construction Management in Practice, Chapter 2, (2nd edition),
Blackwell Science Limited, pp 11-15.
Fellows, R. and Liu, A. (2008). Research methods for construction (3rd ed.). Blackwell
Publishing.
Gary, M.S. (2005). Implementation strategy and performance outcomes in related
diversification. Strategic Management Journal, 26, pp. 643-664.
Ghosh, B.N. and Chopra, P.K. (2003). A dictionary of research methods. Leeds, UK:
Wisdom House Publications.
Gort, M. (1962). Diversification and integration in American industry. National Bureau of
Economic Research, General Series 77, Princeton University Press, Princeton, NJ.
Graham, J., Lemmon, M. and Wolf, J. (2002). Does corporate diversification destroy value?
Journal of Finance, 57, pp. 695-720.
Graham, J., Lemmon, M. and Wolf, J. (2002). Does corporate diversification destroy value?
Journal of Finance, 57, pp. 695-720.
Grant, R. M. Jammine, A. P. and Thomas, H. (1988). Diversity, diversification and
profitability among British manufacturing companies. Academy of Management Journal,
31, pp. 771-801.
Greenley, G.E. (1989). Strategic Management. Prentice-Hall, New York.
Guillen, M. (2001). The limits of convergence: globalization and organizational change in
Argentina, South Korea and Spain. Princeton University Press, Princeton, NJ.
Hall, B. H. (1990). The impact of corporate restructuring on industrial research and
development. Brookings papers on Economic activity, Vol. 1, 85-124.

84
Hamel, G. (1991). Competition for competence and interpartner learning within international
strategic alliances. Strategic Management Journal 12: 83-103.
Heinrich, T. (2001). Product diversification in the U.S pulp and paper industry: the case of
International Paper, 1898-1941. The Business History Review, Vol. 75, No. 3.
Hill, C.W.L. and Hansen, G.S. (1991). A longitudinal study of the causes and consequences
of changes in diversification in the US pharmaceutical industry 1977-1986. Strategic
Management Journal, Vol. 12, pp. 187-99.
Hill, C.W.L. and Hansen, G.S. (1991). A longitudinal study of the causes and consequences
of changes in diversification in the US pharmaceutical industry 1977-1986. Strategic
Management Journal, Vol. 12, pp. 187-99.
Hillebrandt, P.M. (1996). Long-term success or failure of contractors’ strategy of
diversification: The organisation and management of construction- shaping theory and
practice. In D.A Langford and A. Retik (eds). Managing the construction enterprise.
London: E & F.N Spon, 23–32.
Hillebrandt, P.M. and Cannon, J. (1990). The modern construction firm. Basingstoke:
Macmillan.
Hitt, M. A., Hoskisson, R. E., Johnson, R. A. and Moesel, D. D. (1996). The market for
corporate control and firm innovation. Academy of Management Journal, 39, pp. 1084-
1119.
Hoskisson, R. E, Eden L., Lau C. M, and Wright M. (2000). Strategy in emerging economies.
Academy of Management Journal, 43(3), pp. 249-267.
Hymer, S.H. (1976). A study of direct foreign investment. MIT Press: Cambridge, MA.
Jacobson, R. (1992). The ‘Austrian’ school of strategy. Academy of Management Review,
17, pp. 782-807.
Jensen, M. C. (1986). Agency costs of free cash flow, corporate finance, and takeovers.
American Economic Review, 76, 323-329.
Kim, H. J. and Reinschmidt, K. F. (2011). Diversification by the largest US contractors.
Canadian Journal of Civil Engineering, Volume 38.
Kogut, B., Wlaker G. and Anand, J. (2002). Agency and institutions: national divergences in
diversification behavior. Organization science, 13(2): pp. 162-178.
Lamont, O. and Polk, C. (2001). Does diversification destroy value? Evidence from industry
shocks, Journal of Financial Economics, 63, 51-77.
Lancaster, G. (2005). Research methods in management: a concise introduction to research
in management and business consultancy. Elsevier Butterworth-Heinemann.
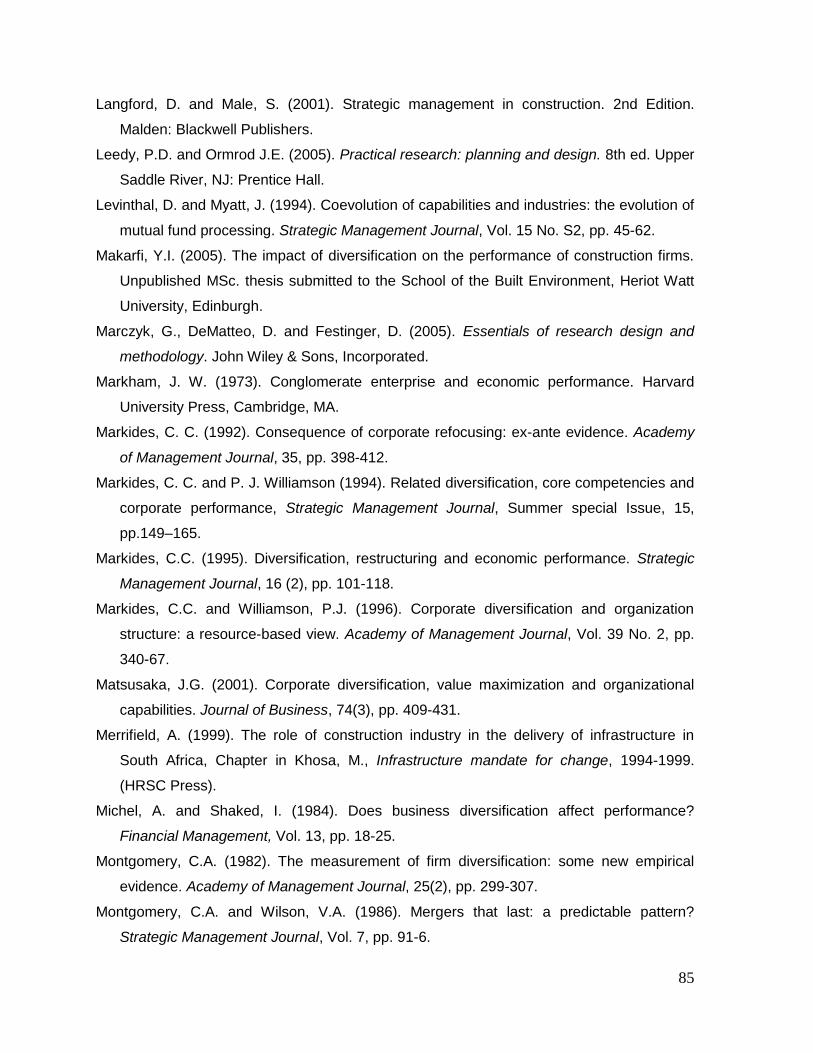
85
Langford, D. and Male, S. (2001). Strategic management in construction. 2nd Edition.
Malden: Blackwell Publishers.
Leedy, P.D. and Ormrod J.E. (2005). Practical research: planning and design. 8th ed. Upper
Saddle River, NJ: Prentice Hall.
Levinthal, D. and Myatt, J. (1994). Coevolution of capabilities and industries: the evolution of
mutual fund processing. Strategic Management Journal, Vol. 15 No. S2, pp. 45-62.
Makarfi, Y.I. (2005). The impact of diversification on the performance of construction firms.
Unpublished MSc. thesis submitted to the School of the Built Environment, Heriot Watt
University, Edinburgh.
Marczyk, G., DeMatteo, D. and Festinger, D. (2005). Essentials of research design and
methodology. John Wiley & Sons, Incorporated.
Markham, J. W. (1973). Conglomerate enterprise and economic performance. Harvard
University Press, Cambridge, MA.
Markides, C. C. (1992). Consequence of corporate refocusing: ex-ante evidence. Academy
of Management Journal, 35, pp. 398-412.
Markides, C. C. and P. J. Williamson (1994). Related diversification, core competencies and
corporate performance, Strategic Management Journal, Summer special Issue, 15,
pp.149–165.
Markides, C.C. (1995). Diversification, restructuring and economic performance. Strategic
Management Journal, 16 (2), pp. 101-118.
Markides, C.C. and Williamson, P.J. (1996). Corporate diversification and organization
structure: a resource-based view. Academy of Management Journal, Vol. 39 No. 2, pp.
340-67.
Matsusaka, J.G. (2001). Corporate diversification, value maximization and organizational
capabilities. Journal of Business, 74(3), pp. 409-431.
Merrifield, A. (1999). The role of construction industry in the delivery of infrastructure in
South Africa, Chapter in Khosa, M., Infrastructure mandate for change, 1994-1999.
(HRSC Press).
Michel, A. and Shaked, I. (1984). Does business diversification affect performance?
Financial Management, Vol. 13, pp. 18-25.
Montgomery, C.A. (1982). The measurement of firm diversification: some new empirical
evidence. Academy of Management Journal, 25(2), pp. 299-307.
Montgomery, C.A. and Wilson, V.A. (1986). Mergers that last: a predictable pattern?
Strategic Management Journal, Vol. 7, pp. 91-6.

86
Mukherji, A. (1998). The relationship between prior performance and diversification: a study
of three industries. Management Decision, 36,3, pp. 180–188
Murray, M. and Appiah-Baiden, J. (2000). Difficulties facing contractors from developing
Countries: problems and solutions. Proceeding of the 2nd international conference on
construction in developing Countries. Garbarone, Botswana.
Naoum, S. G. (1998). Dissertation research and writing for construction students. Elsevier
butterworth-Heinemann, Oxford.
Nayyar, P. (1992). On the measurement of corporate diversification: evidence from large
U.S service firms. Strategic Management Journal, 13 (3), pp. 219-235.
Nyembe, L. (1994). COCOSA: a single, powerful voice for construction, S.A Construction
World, April 1994, pp. 28-33.
Ocasio, W. (1997). Towards an attention based view of the firm. Strategic Management
Journal, Summer Special Issue, 18, pp. 187-206.
Ofori, G. and Chan, S.L. (2000). Growth paths of construction enterprises in Singapore,
1980-98. Engineering, Construction and Architectural Management, 7, 3, pp. 307-321.
Ofori, G. and Chong, S.M. (1994). Corporate Strategic Planning: incorporation of host
Countries’ construction industry development objectives. Proceedings of the A J Etkin
International Seminar on Strategic Planning in Construction Companies, Technion,
Israel, June 1994, pp. 134 – 157.
Ofori, G., Hindle, R. and Hugo, F. (1996). Improving the construction industry of South
Africa. Habitat International, vol. 20, No.2, pp. 203-220, 1996. Elsevier Science Limited.
Pagano, R. R. (1981). Understanding statistics in the behavioural sciences. West publishing
company, Minnesota.
Palepu K. (1985). Diversification strategy, profit performance and entropy measure.
Strategic Management Journal, Vol. 6, 239-255 (1985).
Palich, L. E., Cardinal, L. B. and Miller, C. C. (2000). Curvilinearity in the diversification -
performance linkage: an examination of over three decades of research. Strategic
Management Journal 21(2): 155–174.
Pandya, A. M., and Rao, N. V. (1998). Diversification and firm performance: An empirical
evaluation. Journal of Financial Strategic Decision, 11(2), 67–81.
Park, C.S., Jang, H.S., Choi, S.I. and Cho, H.C. (2010). Comparative analysis of strategic
planning in construction firms. Journal of Asian Architecture and Building Engineering,
(30), May 2010.

87
Pawaskar V. (1999). Effect product market diversification on firm performance: a study of
the Indian corporate sector. Unpublished PhD. dissertation, Indira Gandhi Institute of
Development Research, Mumbai.
Pearce, J.A. II and Robinson, R.B. Jr. (2000). Strategic management: formulation,
implementation and control. Irwin McGraw-Hill, Boston, M.A.
Peng, M. W. (2002). Towards an institution-based view of business strategy. Asia Pacific
Journal of Management, 19, pp. 251-267.
Porter M.E. (1980). Competitive strategy: techniques for analyzing industries and
competitors. Free Press, New York.
Porter, M.E. (1985) Competitive advantage. The free press, New York, NY.
Ramanujam V. and Varadarajan P. (1989). Research on corporate diversification: a
synthesis. Strategic Management Journal. Vol. 10, pp. 523 – 551.
Ravanshadnia, M., Rajaie, H., and Abbasian, H.R. (2010). Hybrid fuzzy MADM project-
selection model for diversified construction companies. Canadian Journal of
Engineering, 37, pp. 1082 – 1093.
Rijamampianina R., Abratt R. and February Y. (2003), A framework for concentric
diversification through sustainable competitive advantage. Management Decision, Vol.
44 No. 4, pp. 362-371.
Rijamampianina R., Abratt R. and February Y. (2003). A framework for concentric
diversification through sustainable competitive advantage. Management Decision, Vol.
44 No. 4, pp. 362-371.
Rogers M. (2001). The effect of diversification on firm performance. Melbourne Institute
Working Paper No. 2/01. Melbourne Institute of Applied Economic and Social Research.
Rumelt, R. P. (1974). Strategy, structure, and economic performance. Harvard University
Press, Cambridge, MA.
Rumelt, R. P. (1982). Diversification strategy and profitability. Strategic Management
Journal, 3(4), pp. 359–369.
Rumelt, R. P. (1986). Strategy, structure, and economic performance. Boston: Harvard
Business School Press.
Rumelt, R.P., Schendel, D.E. and Teece, D.J. (1994). Fundamental issues in strategy: a
research agenda. Harvard Business School Press, Boston, MA, .
Smallbone, D., Roger L. and David, N. (1995). The characteristics and strategies of high
growth SMEs. International Journal of Entrepreneurial Behaviour & Research, Vol.1
No.3, pp.44-62.

88
Sowden-Service, C. (2009). Gripping GAAP 2009, 10th edition. Your guide to international
financial reporting standards. LexisNexis, Durban.
Statistics South Africa (2008). Stats in brief, 2nd edition, Statistics South Africa, Private bag
X44, Pretoria 0001, South Africa, www.statssa.gov.za
Tasi, C. (1994). Diversification strategies for construction companies in the U.S. M.S. thesis,
Massachusetts Institute of Technology, Cambridge, MA.
Theuven, L. (2004). Vertical integration in the European package tour business. Annals of
Tourism Research, 31(2), pp. 111-125.
Tosi, H. L., Werner, S., Katz, J. P. and Gomez-Mejia, L. R. (2000). How much does
performance matter? A meta-analysis of CEO pay studies. Journal of Management, 26,
pp. 301-339.
Venter, I. (2009). Fixed investment now stands at 24% of SA’s GDP.
www.engineeringnews.co.za/article/fixed-investment-now-stands-at-24-of-sas-gdp-2009-
02-11, accessed on 11 February 2009.
Villalonga, B. (2002). Does diversification cause the ‘diversification discount’? Working
paper, Harvard University.
Wan, C. and Hoskisson, R. E. (2003). Home country environments, corporate diversification
strategies, and firm performance. Academy of Management Journal, 46, pp. 27-45.
Weetman, P. (2003). Financial and management accounting. 3rd ed. Pearson, England
Wiggins, R. R. and Ruefli, T. W. (2002). Sustained competitive advantage: temporal
dynamics and the incidence and persistence of superior economic performance.
Organization Science, 13(1), pp. 82-105.
Williamson, O. E. (1975). Markets and hierarchies: analysis and anti-trust implications. The
free press, New York.
Ibrahim, Y.M. and Kaka, A.P. (2007). The impact of diversification on the performance of UK
construction firms, Journal of Financial Management of Property and Construction, Vol.
12 Iss: 2 pp. 73 - 86

89
APPENDICES
Appendix A – Questionnaire cover letter 011 530 9700 (Work)
086 629 8739 (Fax)
072 785 0885 (Cell)
Dear Sir/Madam,
The University of Witwatersrand is currently undertaking research into the relationships
between diversification strategies and growth among established construction contractors in
South Africa. The research is in partial fulfilment of the requirement for a Masters Degree in
Building (MSc Building) at the School of Construction Economics and Management,
University of the Witwatersrand, Johannesburg and is being undertaken by myself and
supervised by Dr. Ilemobade in the School of Civil and Environmental Engineering. The
research would provide useful guide to diversifying the operations of contracting
organizations thereby enhancing their growth and survival in the face of ever changing
economic environment.
As part of this research we are sending out a questionnaire to your firm from a selection of
established and emerging contracting enterprises. The information collected will be
confidential and individual firms will not be identified in the research report. We would
therefore ask you to complete the questionnaire and return it as an attachment via email to:
[email protected] or by fax to the number indicated above. The
questionnaire should take about 20 - 25 minutes to complete, and we hope that you may be
able to spare us this time.
If you have any queries or concerns about the questionnaire or wish to talk to us in more
detail about the research then please feel free to contact me on the numbers provided.
While thanking you for your kind assistance and contribution, we look forward to receiving
your responses.
Yours,
Idowu Adegelu
Postgraduate Student

Appendix B1 – Questionnaire for undiversified firms
Questionnaire
Introduction
For each question, please place an (X) in the box adjacent to the option that is closest to the
organisation’s experience. The questionnaire is formatted in such a way that you can complete it
electronically and return as attachment to the email address provided below. Otherwise, it may
be printed, filled and sent by post to the researcher.
Section A: General Information (To obtain information on the background, experience and
position of person completing questionnaire). 1. What is your rank/position in the organisation?
Top level Manager – (e.g. CEO, Director, Board member, etc)
Middle level Manager – (e.g. Functional/unit head, Contract manager etc)
Low level Manager – (e.g. Technical/operation manager, Site managers, Accountant
etc)
2. Which of the following best describe your status in relation to the company?
Owner-Manager Joint owner – Manager Employee
Section B: Company Profile (The purpose of this section is to be able to properly classify the
company based on its background, experience and current capacity)
1. Major areas of specialisation of the company:
General building works Civil engineering Mechanical engineering
Electrical engineering Building excavations, shafts sinking and lateral earth support
Structural steelwork fabrication & erection Formwork
Property development Estate development Plant hire Construction product
Healthcare Waste disposal Mining Securities trading
Others
____________________________________________________________________
2. Category of corporate registration:
Closed corporation (CC) Private (PTY) limited
Public - Is your company listed on the Johannesburg Stock Exchange Yes No
3. What is the company’s strategy on expansion?
Internal Capacity expansion Mergers Acquisition Joint Ventures
4. Does your company operate outside the Republic of South Africa? Yes No
5. If yes in question (B4), state number of countries in which the company is doing business:
_________________________________________________________________________
_________________________________________________________________________

91
_________________________________________________________________________
_________________________________________________________________________
Section C: Assessment of company’s strengths/weaknesses (This section seeks to
determine the factors within and outside the organizations that influences their growth/successes).
1. Please give a candid assessment of the current status of the company against the following
factors, where 5 stands for a position of great strength and 1for absence of such in the company. (Kindly note that, the availability, presence or utilization of a factor/variable indicates strength, while the absence of such indicates a weakness).
Factor Very strong
Strong Moderate Weak Very weak
5 4 3 2 1
Skilled and competent management staff
Skilled and competent technical staff
Highly trained operatives
Fixed asset base
Adequate plant and equipment
Financial base and ability to support client financially
Flexibility in operation and company organisation structure
High overhead costs
Sound financial management practices
Access to credit/finance (suppliers, banks, stock market, subcontractors etc)
Ability to access and retain highly qualified subcontractors and specialist labour.
High quality of products and services
Age of company and experience
Goodwill and brand name of the enterprise
Ability to build long term relationships with customers
Provision of after sale services/support to clients
Project delivery to budget and time
Creativity / innovation in project delivery process
Avoidance of adversarial postures during contract execution
Professionalism (ethical practices) and reputation
Use Information and Communication Technologies (ICT)
Adoption of Black Economic Empowerment (BEE)Policy

92
2. Please rank the following factors as they have influenced the growth of your company, where 5 represents strong influence and 1 represents no influence on growth.(Growth here implies increase in sales volume/turnover, fixed assets, employee size, profit and shareholders funds)
Factor Very strong
Strong Moderate Weak
Very weak
5 4 3 2 1
Skilled and competent management staff
Skilled and competent technical staff
Highly trained operatives
Fixed asset base
Adequate plant and equipment
Financial base and ability to support client financially
Flexibility in operation and company organisation structure
High overhead cost
Sound financial management practices
Access to credit/finance (suppliers, banks, stock market, subcontractors etc)
Ability to access and retain highly qualified subcontractors and specialist labour.
High quality of products and services
Age of company and experience
Goodwill and brand name of the enterprise
Ability to build long term of relationships with customers
Provision of after sale services/support to clients
Project delivery to budget and time
Adoption of Black Economic Empowerment (BEE)Policy
Adoption of Joint Venture/Alliances with other companies
Creativity / innovation in project delivery process
Avoidance of conflicts/adversarial posture during contract execution
Professionalism (ethical practices) and reputation
Use Information and Communication Technologies (ICT)

93
Section D: Challenges/Threats to growth of the company (The section is aimed at being able to assess both challenges and threats to growth of companies in the industry as a basis for ameliorating them). The following are some perceived challenges/threats to the growth and survival of companies in the industry. Please rank each as they affect your company’s growth on a scale of 1 – 5, where 1 represents no influence and 5 represents extreme negative influence.
Section E: Diversification in company (This section seeks to examine the status, proposed type, mode and processes of diversification to be adopted by companies that are interested in implementing diversification strategy). Those not interested in diversifying are also required to fill this section.
1. Is your company interested in diversifying? Yes No
2. Which of the following describes the status of the process of diversification in your company?
The company is not interested in diversification now and in the near future
The discussion about diversification has just been initiated at the senior management
level
The board is in the process of making a decision on diversification of the company
Factors Very strong
Strong Moderate Weak
Very weak
5 4 3 2 1
Globalisation (allows entry of bigger and better equipped firms as competitors)
Adoption of targeted preferential procurement system
Government’s policy of Black Economic Empowerment
Adoption of Joint Venture/Alliances with other companies
Low entry barrier and use of lowest bid competitive tendering
Lack of access to adequate plant and equipment
Lack of technical skills for certain types of projects
Over specialization in operation and market already saturated
Low flexibility in operation and company organisation structure
High overhead cost; makes some projects unprofitable
Low financial base and access to credit/finance (suppliers, banks, stock market, subcontractors etc)
Young company and inexperienced – clients unwilling to commit projects to us – their preference is for established firms
Fluctuating demand and project types
High establishment cost to maintain branches
Projects geographically dispersed

94
The board has reached a conclusion on diversification of the company
The company has begun restructuring to implement the strategy of diversification
3. Which of the following option(s) best describe the type of diversification your company is
likely to implement?
The company is not interested in diversification now and in the near future
Addition of new product(s) – related to current business
Movement into new markets (expansion of client base) - same products
Addition of news products (manufacturing) – unrelated to current business
Share holdings in other business (without active participation).
Retailing in related and unrelated goods
Others specify:
_____________________________________________________________
4. Indicate which mode of diversification your company is likely to adopt (please tick as many
as is applicable):
The company is not interested in diversification now and in the near future
Internal (organic growth) External Both internal and external
product diversity
move to new markets
(local and international)
Capacity building within
firm’s area of core competence
Merger
acquisition
joint venture/alliance
5. How do you intend to achieve diversification? Through the services of ;
The company is not interested in diversification now and in the near future
Company’s management staff only
External professional consultants only
Both internal and external
6a. Which of the following describes the current management structure of the company?
Unitary structure (military)
Functional (professional managers heading units)
Regional administration (with semi-autonomy)
Divisional structure (under central administration)
Other specify:
________________________________________________________________
6b. Which of the following describes the likely management structure of the company after it
might have been diversified?
The company is not interested in diversification now and in the near future

95
Unitary structure (military)
Functional (professional managers heading units)
Regional administration (with semi-autonomy)
Divisional structure (under central administration)
Other
specify:________________________________________________________________
7. Please indicate how the following factors have motivated the company’s diversification strategy. Where 5 represents strong motivation and 0 represents no influence.
The company is not interested in diversification now and in the near future
9. The following are some barriers to achieving success in diversification strategies in the
construction industry. Please, indicate your opinion on a scale of 1 – 5, with 1 representing extreme disagreement and 5 representing extreme agreement with each statement
Factor Very strong
Strong Moderate
Weak Very weak
5 4 3 2 1
The need to spread risk – risk aversion
Present market is saturated – stiff competition
Need for growth (increase turnover and profit)
Need to engage unutilized resources (human, technical and financial)
Attracted to more profitable business(es)
“Bandwagon effect” – others are doing it
Cyclical/fluctuating demand in present market
Diversified companies appear to be doing better than us
Improve the stability/survival of the company
Hope to enjoy economy of scope – build synergies in asset utilisation
Hope to enjoy economy of scale through operational efficiencies
Desire to create a monopoly in the market
Parameter Strongly agree
Agree
Neither agree nor
disagree
Disagree
Strongly disagre
e
5 4 3 2 1
Management has poor knowledge of new business environment
Too many peripheral activities (small scale investments) – unrelated to main business.
There was not enough attention/investment to new business(es)
Inadequate planning before diversification was implemented
Lack of transferable knowledge/technology and skills

96
10. To what extent have the following factors influenced your reason not to diversify your
business? Where 5 represents strong influence and 0 represents no influence.
11. Kindly state any general observations/comments that could help to improve the study which
has not been covered: _________________________________________________________
____________________________________________________________________________
____________________________________________________________________________
Thank you for your valued time and contribution.
Stiff competition in the new market/product – unable to build/sustain competitive advantage
Customers were reluctant to try out new products
Insufficient information about new market/customer preferences
Business was acquired by mistake – just a spur of the moment decision, a pet idea of a valued director/staff or “bandwagon syndrome”
Unaware of market restrictions through legislations against foreign firms
We needed to have engaged the services of professional consultants to help with the development of the strategic plan
We were unable to build sufficient synergy for profitable growth
Factor Strongly agree
Agree Neither agree nor
disagree
Disagree
Strongly disagre
e
5 4 3 2 1
Satisfied with the present level of growth
Insufficient knowledge of other types of businesses
Consider diversification process too difficult/involving
Inadequate resources (human, technical and financial)
Present market not saturated – more opportunities exit here
High cost involved in diversification
Prefer to be focused and specialised in present business
Diversified companies are not doing better than us

97
Appendix B2 – Questionnaire for diversified firms
Questionnaire
Introduction For each question, please place an (X) in the box adjacent to the option that is closest to the organisation’s experience. The questionnaire is formatted in such a way that you can complete it electronically and return as attachment to the email address provided below. Otherwise, it may be printed, filled and sent by post to the researcher. Section A: General Information (To obtain information on the background, experience and
position of person completing questionnaire). 1. What is your rank/position in the organisation?
Top level Manager – (e.g. CEO, Director, Board member, etc)
Middle level Manager – (e.g. Functional/unit head, Contract manager etc)
Low level Manager – (e.g. Technical/operation manager, Site managers, Accountant
etc)
2. Which of the following best describe your status in relation to the company?
Owner-Manager Joint owner – Manager Employee
Section B: Company Profile (The purpose of this section is to be able to properly classify the
company based on its background, experience and current capacity)
1. Major areas of specialisation of the company:
General building works Civil engineering Mechanical engineering
Electrical engineering Building excavations, shafts sinking and lateral earth support
Structural steelwork fabrication & erection Formwork
Property development Estate development Plant hire Construction products
Healthcare Waste disposal Mining Securities trading
Others
____________________________________________________________________
2. Category of corporate registration:
Closed corporation (CC) Private (PTY) limited
Public - Is your company listed on the Johannesburg Stock Exchange Yes No
3. What is the company’s strategy on expansion?
Internal Capacity expansion Mergers Acquisition Joint Ventures
4. Does your company operate outside the Republic of South Africa? Yes No
5. If yes in question (B4), state number of countries in which the company is doing business:
__________________________________________________________________________
__________________________________________________________________________
__________________________________________________________________________
___________________________________________________________________________

98
Section C: Assessment of company’s strengths/weaknesses (This section seeks to determine the factors within and outside the organizations that influences their growth/successes).
1. Please give a candid assessment of the current status of the company against the following factors, where 5 stands for a position of great strength and 1for absence of such in the company. (Kindly note that, the availability, presence or utilization of a factor/variable indicates strength, while the absence of such indicates a weakness).
Factor Very strong
Strong Moderate Weak Very weak
5 4 3 2 1
Skilled and competent management staff
Skilled and competent technical staff
Highly trained operatives
Fixed asset base
Adequate plant and equipment
Financial base and ability to support client financially
Flexibility in operation and company organisation structure
High overhead costs
Sound financial management practices
Access to credit/finance (suppliers, banks, stock market, subcontractors etc)
Ability to access and retain highly qualified subcontractors and specialist labour.
High quality of products and services
Age of company and experience
Goodwill and brand name of the enterprise
Ability to build long term relationships with customers
Provision of after sale services/support to clients
Project delivery to budget and time
Creativity / innovation in project delivery process
Avoidance of adversarial postures during contract execution
Professionalism (ethical practices) and reputation
Use Information and Communication Technologies (ICT)
Adoption of Black Economic Empowerment (BEE)Policy
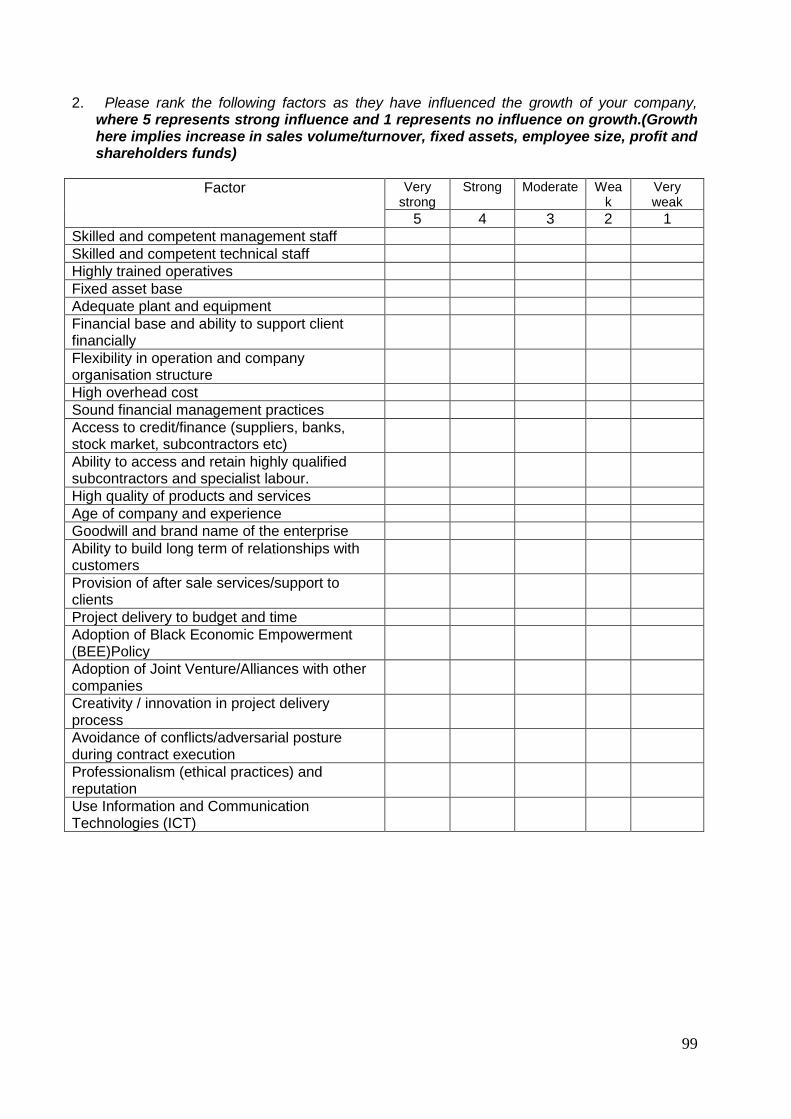
99
2. Please rank the following factors as they have influenced the growth of your company, where 5 represents strong influence and 1 represents no influence on growth.(Growth here implies increase in sales volume/turnover, fixed assets, employee size, profit and shareholders funds)
Factor Very strong
Strong Moderate Weak
Very weak
5 4 3 2 1
Skilled and competent management staff
Skilled and competent technical staff
Highly trained operatives
Fixed asset base
Adequate plant and equipment
Financial base and ability to support client financially
Flexibility in operation and company organisation structure
High overhead cost
Sound financial management practices
Access to credit/finance (suppliers, banks, stock market, subcontractors etc)
Ability to access and retain highly qualified subcontractors and specialist labour.
High quality of products and services
Age of company and experience
Goodwill and brand name of the enterprise
Ability to build long term of relationships with customers
Provision of after sale services/support to clients
Project delivery to budget and time
Adoption of Black Economic Empowerment (BEE)Policy
Adoption of Joint Venture/Alliances with other companies
Creativity / innovation in project delivery process
Avoidance of conflicts/adversarial posture during contract execution
Professionalism (ethical practices) and reputation
Use Information and Communication Technologies (ICT)

100
Section D: Challenges/Threats to growth of the company (The section is aimed at being able to assess both challenges and threats to growth of companies in the industry as a basis for ameliorating them). The following are some perceived challenges/threats to the growth and survival of companies in the industry. Please rank each as they affect your company’s growth on a scale of 1 – 5, where 1 represents no influence and 5 represents extreme negative influence.
Factors Very strong
Strong Moderate Weak
Very weak
5 4 3 2 1
Globalisation (allows entry of bigger and better equipped firms as competitors)
Adoption of targeted preferential procurement system
Government’s policy of Black Economic Empowerment
Adoption of Joint Venture/Alliances with other companies
Low entry barrier and use of lowest bid competitive tendering
Lack of access to adequate plant and equipment
Lack of technical skills for certain types of projects
Over specialization in operation and market already saturated
Low flexibility in operation and company organisation structure
High overhead cost; makes some projects unprofitable
Low financial base and access to credit/finance (suppliers, banks, stock market, subcontractors etc)
Young company and inexperienced – clients unwilling to commit projects to us – their preference is for established firms
Fluctuating demand and project types
High establishment cost to maintain branches
Projects geographically dispersed

101
Section E: Diversification in company (This section seeks to examine the type, mode and processes of diversification adopted by companies in the industry and explore its relationship with their performance as well as identify some difficulties in the process).
1. Which of the following option(s) best describe the type of diversification in your company?
Addition of new product(s) – related to current business
Movement into new markets (expansion of client base) - same products
Addition of news products (manufacturing) – unrelated to current business
Share holdings in other business (without active participation).
Retailing in related and unrelated goods
Others specify:
_____________________________________________________________
2. Please, rank in order of importance from experience, which of these options best suits
your type of organisation? (Starting with 1 = for the best option and 5 = least option)
Addition of new product(s) – related to current business
Movement into new markets (expansion of client base) - same products
Addition of news products (manufacturing) – unrelated to current business
Share holdings in other business (without active participation).
Retailing in related and unrelated goods
3. Indicate which mode of diversification was adopted by your company (please tick as many
as is applicable):
Internal (organic growth) External Both internal and external
product diversity
move to new markets
(local and international)
Capacity building within
firm’s area of core competence
Merger
acquisition
joint venture/alliance
4. Was the diversification processes achieved using the services of?
Company’s management staff only
External professional consultants only
Both internal and external
5a. Which of the following describes the management structure of the company before
diversification?
Unitary structure (military)
Functional (professional managers heading units)
Regional administration (with semi-autonomy)
Divisional structure (under central administration)
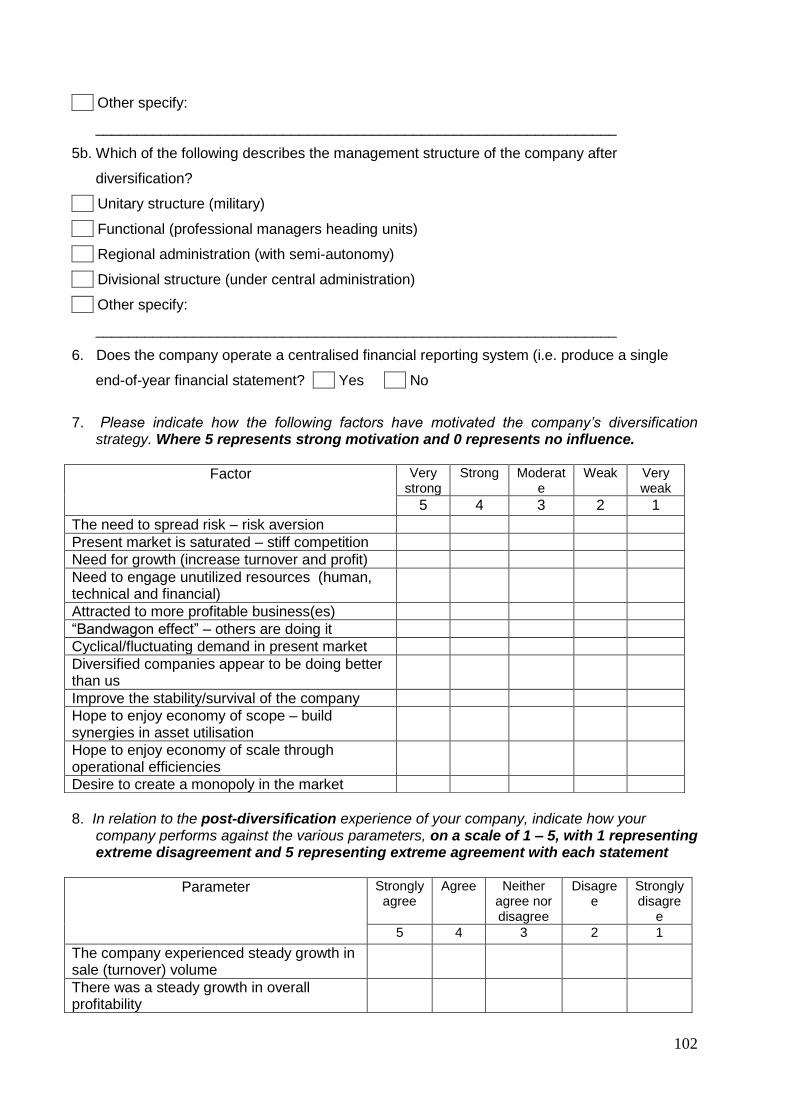
102
Other specify:
________________________________________________________________
5b. Which of the following describes the management structure of the company after
diversification?
Unitary structure (military)
Functional (professional managers heading units)
Regional administration (with semi-autonomy)
Divisional structure (under central administration)
Other specify:
________________________________________________________________
6. Does the company operate a centralised financial reporting system (i.e. produce a single
end-of-year financial statement? Yes No
7. Please indicate how the following factors have motivated the company’s diversification
strategy. Where 5 represents strong motivation and 0 represents no influence.
8. In relation to the post-diversification experience of your company, indicate how your
company performs against the various parameters, on a scale of 1 – 5, with 1 representing extreme disagreement and 5 representing extreme agreement with each statement
Factor Very strong
Strong Moderate
Weak Very weak
5 4 3 2 1
The need to spread risk – risk aversion
Present market is saturated – stiff competition
Need for growth (increase turnover and profit)
Need to engage unutilized resources (human, technical and financial)
Attracted to more profitable business(es)
“Bandwagon effect” – others are doing it
Cyclical/fluctuating demand in present market
Diversified companies appear to be doing better than us
Improve the stability/survival of the company
Hope to enjoy economy of scope – build synergies in asset utilisation
Hope to enjoy economy of scale through operational efficiencies
Desire to create a monopoly in the market
Parameter Strongly agree
Agree Neither agree nor disagree
Disagree
Strongly disagre
e
5 4 3 2 1
The company experienced steady growth in sale (turnover) volume
There was a steady growth in overall profitability

103
9. The following are some barriers to achieving success in diversification strategies in the
construction industry. Please, indicate your opinion on a scale of 1 – 5, with 1 representing extreme disagreement and 5 representing extreme agreement with each statement
Asset turnover for the company increased
Improvement in the utilisation of resources (human, technical and financial) was realised
A boost in the corporate image of the company was achieved
The company achieved an edge over competitors
The company’s management structure had to change
More professionals and skilled staff have to be employed
At a point, the company had to divest its interest in some business to refocus its operation – due to failure in such business(es)
Company didn’t enjoy economy of scope – build synergies in asset utilisation
Its was not possible to achieve economy of scale because of production type – usually customised products
Unable to create a monopoly in the market
Parameter Strongly agree
Agree
Neither agree nor
disagree
Disagree
Strongly disagre
e
5 4 3 2 1
Management has poor knowledge of new business environment
Too many peripheral activities (small scale investments) – unrelated to main business.
There was not enough attention/investment to new business(es)
Inadequate planning before diversification was implemented
Lack of transferable knowledge/technology and skills
Parameter Strongly agree
Agree
Neither agree nor
disagree
Disagree
Strongly disagre
e
5 4 3 2 1
Stiff competition in the new market/product – unable to build/sustain competitive advantage
Customers were reluctant to try out new products
Insufficient information about new market/customer preferences

104
10. For those who answered No in (E1), to what extent have the following factors influenced
your reason not to diversify your business? Where 5 represents strong influence and 0 represents no influence.
11. Kindly state any general observations/comments that could help to improve the study which
has not been covered: _________________________________________________________
____________________________________________________________________________
____________________________________________________________________________
Thank you for your valued time and contribution
Business was acquired by mistake – just a spur of the moment decision, a pet idea of a valued director/staff or “bandwagon syndrome”
Unaware of market restrictions through legislations against foreign firms
We needed to have engaged the services of professional consultants to help with the development of the strategic plan
We were unable to build sufficient synergy for profitable growth
Factor Strongly agree
Agree Neither agree nor
disagree
Disagree
Strongly disagre
e
5 4 3 2 1
Satisfied with the present level of growth
Insufficient knowledge of other types of businesses
Consider diversification process too difficult/involving
Inadequate resources (human, technical and financial)
Present market not saturated – more opportunities exit here
High cost involved in diversification
Prefer to be focused and specialised in present business
Diversified companies are not doing better than us

Appendix C1 – Financial ratios table
011 530 9700 (Work) 086 629 8739 (Fax) 072 785 0885 (Cell)
[email protected] Dear Sir/Madam, Our experience on this research has revealed that private companies treat financial information with a high level of confidentiality, as expected. We feel that preparing a table like the one below (which eliminates the need for raw data) would help overcome this challenge. Kindly assist us in filling out the table below and the attached questionnaire and return via email or fax above. Your anticipated assistance is much appreciated. Yours,
Idowu Adegelu Postgraduate student (0612264A).
Years Return on Equity (ROE)
Return on total Asset (ROTA)
Return on Capital Employed (ROCE)
Profit Margin (PM)
2008
2007
2006
2005
2004
2003
Notes
Return on equity (ROE) = %100funds rs'shareholdeEquity
dividends preference andafter tax Profit
Return on Total Assets (ROTA) = employed Capital
Sales
Return on Capital Employed (ROCE) = %100sliabilitiecurrent - assets Total
tax andinterest beforeProfit
Profit Margin (PM) = %100Sales
tax andinterest beforeProfit

Appendix C2 – Financial ratios data of sampled firms
RETURN ON CAPITAL EMPLOYED - ROCE (%)
YEAR STEFANUTTI & STOCKS
(ST) AVENG (AV) BASIL READ (BA) GROUP 5 (G5) WBHO (WB) MURRAY & ROBERTS
(MU) TRENCON (TR) LENNING DEC (LE)
2004 - 18.04 - 19.60 24.84 11.94 11.60 -
2005 47.81 22.53 65.23 18.40 26.59 13.79 51.20 -
2006 32.41 26.95 21.06 17.25 29.58 15.92 42.30 15.60
2007 56.57 73.78 30.78 15.86 32.61 26.43 40.80 -
2008 30.15 32.30 - 23.38 46.10 35.73 68.80 -
RETURN ON EQUITY - ROE (%)
YEAR STEFANUTTI & STOCKS
(ST) AVENG (AV) BASIL READ (BA) GROUP 5 (G5) WBHO (WB) MURRAY & ROBERTS
(MU) TRENCON (TR) LENNING DEC (LE)
2004 - 7.54 - 19.90 24.81 18.33 7.22 -
2005 34.67 12.14 74.81 18.03 26.25 15.10 32.80 100.00
2006 14.80 16.70 27.12 11.48 28.14 16.59 51.60 129.00
2007 16.99 68.13 32.91 15.11 27.54 19.30 40.90 32.00
2008 22.84 21.88 - 22.80 41.35 35.23 58.80 112.00
RETURN ON TOTAL ASSET ROTA (TIMES)
YEAR STEFANUTTI & STOCKS
(ST) AVENG (AV) BASIL READ (BA) GROUP 5 (G5) WBHO (WB) MURRAY & ROBERTS
(MU) TRENCON (TR) LENNING DEC (LE)
2004 - 4.7 11.71 5.06 5.32 2.48 6.66 -
2005 5.41 4.74 10.75 5.19 7.07 2.47 9.03 0.06
2006 5.44 4.55 4.55 5.91 6.07 2.62 9.05 3.57
2007 6.29 2.01 3.63 2.94 6.78 3.62 9.76 2.25
2008 3.44 2.81 NIL 2.78 5.18 3.92 5.49 0.36
PROFIT MARGIN - PM (%)
YEAR STEFANUTTI & STOCKS
(ST) AVENG (AV) BASIL READ (BA) GROUP 5 (G5) WBHO (WB) MURRAY & ROBERTS
(MU) TRENCON (TR) LENNING DEC (LE)
2004 - 3.84 - 4.58 4.67 4.81 23.70 -
2005 8.83 4.76 6.07 3.54 3.76 5.59 0.03 0.36
2006 5.96 5.92 4.62 2.92 4.87 6.08 10.05 1.61
2007 9.00 36.70 8.47 5.40 4.81 7.30 3.21 0.66
2008 8.77 11.48 - 8.40 8.89 9.11 12.33 8.87
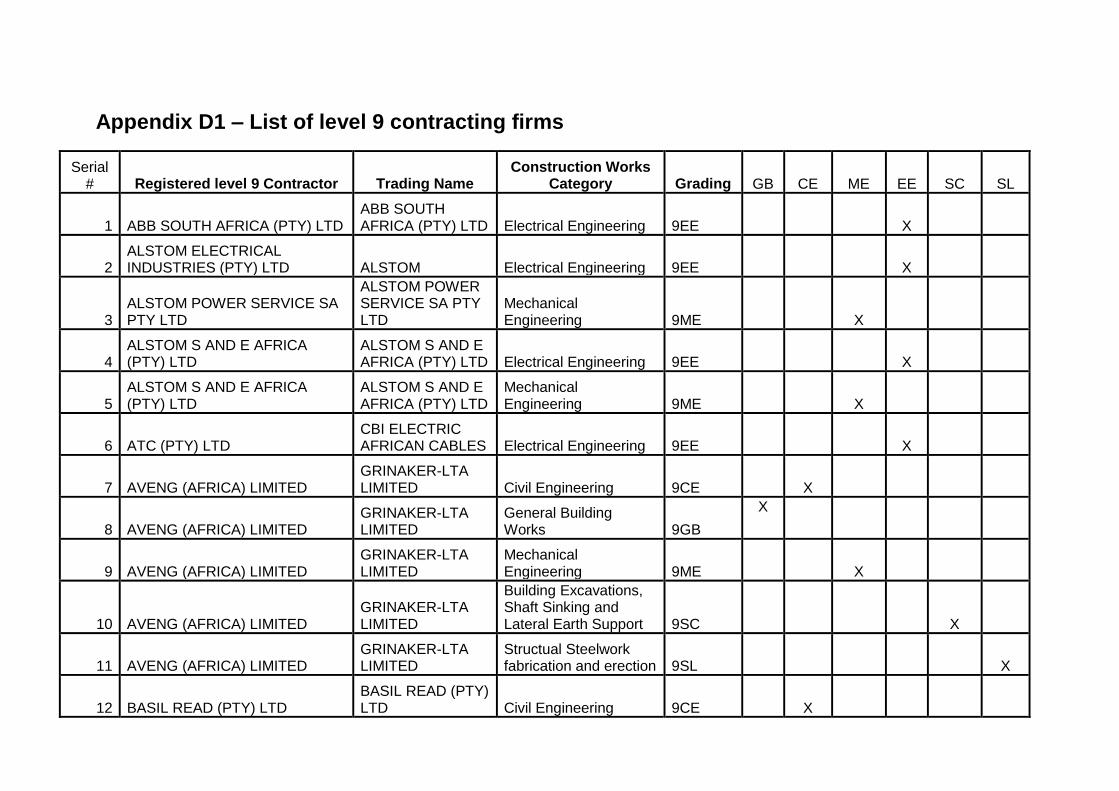
Appendix D1 – List of level 9 contracting firms
Serial # Registered level 9 Contractor Trading Name
Construction Works Category Grading GB CE ME EE SC SL
1 ABB SOUTH AFRICA (PTY) LTD ABB SOUTH AFRICA (PTY) LTD Electrical Engineering 9EE X
2 ALSTOM ELECTRICAL INDUSTRIES (PTY) LTD ALSTOM Electrical Engineering 9EE X
3 ALSTOM POWER SERVICE SA PTY LTD
ALSTOM POWER SERVICE SA PTY LTD
Mechanical Engineering 9ME X
4 ALSTOM S AND E AFRICA (PTY) LTD
ALSTOM S AND E AFRICA (PTY) LTD Electrical Engineering 9EE X
5 ALSTOM S AND E AFRICA (PTY) LTD
ALSTOM S AND E AFRICA (PTY) LTD
Mechanical Engineering 9ME X
6 ATC (PTY) LTD CBI ELECTRIC AFRICAN CABLES Electrical Engineering 9EE X
7 AVENG (AFRICA) LIMITED GRINAKER-LTA LIMITED Civil Engineering 9CE
X
8 AVENG (AFRICA) LIMITED GRINAKER-LTA LIMITED
General Building Works 9GB
X
9 AVENG (AFRICA) LIMITED GRINAKER-LTA LIMITED
Mechanical Engineering 9ME
X
10 AVENG (AFRICA) LIMITED GRINAKER-LTA LIMITED
Building Excavations, Shaft Sinking and Lateral Earth Support 9SC
X
11 AVENG (AFRICA) LIMITED GRINAKER-LTA LIMITED
Structual Steelwork fabrication and erection 9SL X
12 BASIL READ (PTY) LTD BASIL READ (PTY) LTD Civil Engineering 9CE X

108
13 BASIL READ (PTY) LTD BASIL READ (PTY) LTD
General Building Works 9GB X
14 BATEMAN AFRICA PTY LTD BATEMAN AFRICA PTY LTD
Mechanical Engineering 9ME X
15
BOUYGUES TRAVAUX PUBLICS (INCORPORATED IN VERSAILLES)
BOUYGUES TRAVAUX PUBLICS
General Building Works 9GB X
16
BOUYGUES TRAVAUX PUBLICS (INCORPORATED IN VERSAILLES)
BOUYGUES TRAVAUX PUBLICS Civil Engineering 9CE X
17
CHINA HARBOUR ENGINEERING COMPANY LIMITED
CHINA HARBOUR ENGINEERING COMPANY LIMITED Civil Engineering 9CE X
18
CHINA HARBOUR ENGINEERING COMPANY LIMITED
CHINA HARBOUR ENGINEERING COMPANY LIMITED
Mechanical Engineering 9ME X
19 CHINA RAILWAY SEVENTH GROUP SA
CHINA RAILWAY SEVENTH GROUP SA Civil Engineering 9CE X
20 CHINA RAILWAY SEVENTH GROUP SA
CHINA RAILWAY SEVENTH GROUP SA
General Building Works 9GB X
21 CONCOR HOLDINGS (PTY) LTD
CONCOR HOLDINGS (PTY) LTD
Mechanical Engineering 9ME X
22 CONCOR HOLDINGS (PTY) LTD
CONCOR HOLDINGS (PTY) LTD Civil Engineering 9CE X
23 CONCOR HOLDINGS (PTY) LTD
CONCOR HOLDINGS (PTY) LTD
General Building Works 9GB X
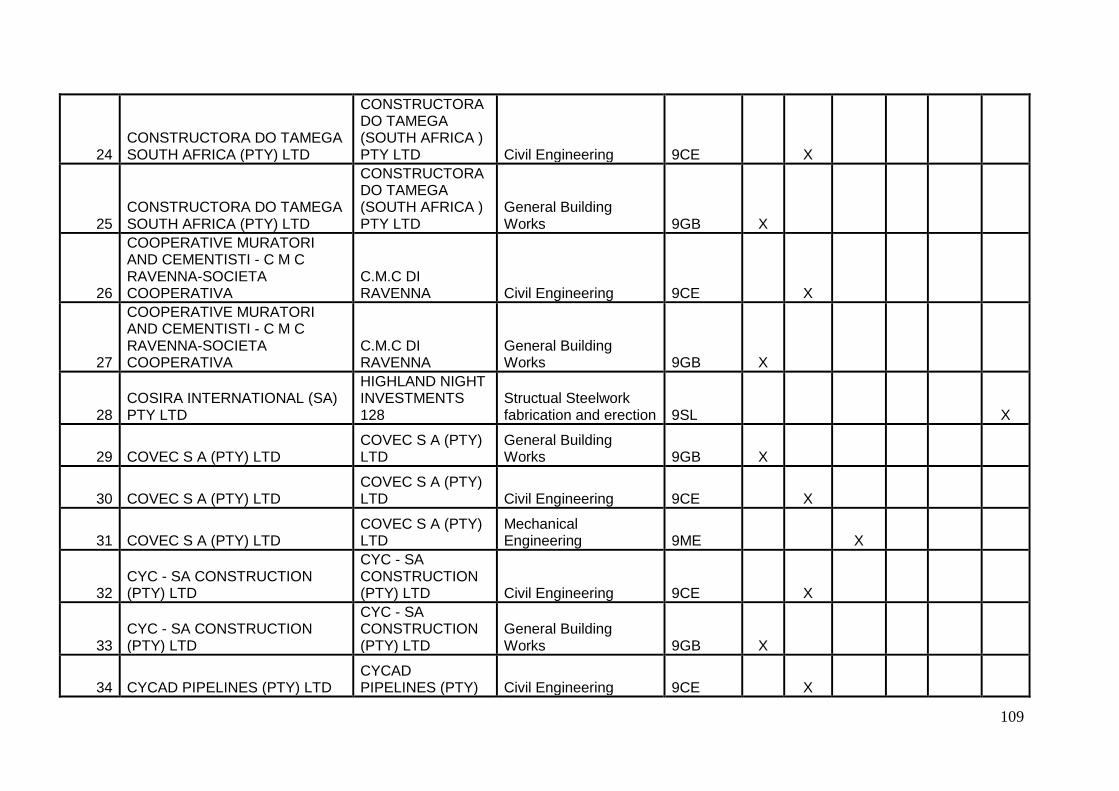
109
24 CONSTRUCTORA DO TAMEGA SOUTH AFRICA (PTY) LTD
CONSTRUCTORA DO TAMEGA (SOUTH AFRICA ) PTY LTD Civil Engineering 9CE X
25 CONSTRUCTORA DO TAMEGA SOUTH AFRICA (PTY) LTD
CONSTRUCTORA DO TAMEGA (SOUTH AFRICA ) PTY LTD
General Building Works 9GB X
26
COOPERATIVE MURATORI AND CEMENTISTI - C M C RAVENNA-SOCIETA COOPERATIVA
C.M.C DI RAVENNA Civil Engineering 9CE X
27
COOPERATIVE MURATORI AND CEMENTISTI - C M C RAVENNA-SOCIETA COOPERATIVA
C.M.C DI RAVENNA
General Building Works 9GB X
28 COSIRA INTERNATIONAL (SA) PTY LTD
HIGHLAND NIGHT INVESTMENTS 128
Structual Steelwork fabrication and erection 9SL X
29 COVEC S A (PTY) LTD COVEC S A (PTY) LTD
General Building Works 9GB X
30 COVEC S A (PTY) LTD COVEC S A (PTY) LTD Civil Engineering 9CE X
31 COVEC S A (PTY) LTD COVEC S A (PTY) LTD
Mechanical Engineering 9ME X
32 CYC - SA CONSTRUCTION (PTY) LTD
CYC - SA CONSTRUCTION (PTY) LTD Civil Engineering 9CE X
33 CYC - SA CONSTRUCTION (PTY) LTD
CYC - SA CONSTRUCTION (PTY) LTD
General Building Works 9GB X
34 CYCAD PIPELINES (PTY) LTD CYCAD PIPELINES (PTY) Civil Engineering 9CE X

110
LTD
35 ERICSON SOUTH AFRICA (PTY) LTD
ERICSON SOUTH AFRICA (PTY) LTD Electrical Engineering 9EE X
36 FLSMIDTH MINERALS (PTY) LTD
FLSMIDTH MINERALS (PTY) LTD
Mechanical Engineering 9ME X
37 GEA NILENCA (PROPRIETARY) LIMITED
GEA NILENCA (PROPRIETARY) LIMITED
Mechanical Engineering 9ME X
38 GROUP FIVE LIMITED
GROUP FIVE CONTRUCTION (PTY) LTD
Structual Steelwork fabrication and erection 9SL X
39 GROUP FIVE LIMITED
GROUP FIVE CONTRUCTION (PTY) LTD
General Building Works 9GB X
40 GROUP FIVE LIMITED
GROUP FIVE CONTRUCTION (PTY) LTD
Mechanical Engineering 9ME X
41 GROUP FIVE LIMITED
GROUP FIVE CONTRUCTION (PTY) LTD Electrical Engineering 9EE X
42 GROUP FIVE LIMITED
GROUP FIVE CONTRUCTION (PTY) LTD Civil Engineering 9CE X
43 HITACHI POWER AFRICA PTY LTD
HITACHI POWER AFRICA PTY LTD
Mechanical Engineering 9ME X
44 HITACHI POWER EUROPE GMBH
HITACHI POWER EUROPE GMBH
Mechanical Engineering 9ME X
45 HO HUP CORPORATION (SA)(PTY)LTD
HO HUP CORPORATION (SA)(PTY)LTD Civil Engineering 9CE X

111
46 HO HUP CORPORATION (SA)(PTY)LTD
HO HUP CORPORATION (SA)(PTY)LTD
Mechanical Engineering 9ME X
47 HO HUP CORPORATION (SA)(PTY)LTD
HO HUP CORPORATION (SA)(PTY)LTD
General Building Works 9GB X
48 HOCHTIEF CONSTRUCTION AG
HOCHTIEF CONSTRUCTION AG Civil Engineering 9CE X
49 IMPREGILO S.P.A. IMPREGILO S.P.A. Civil Engineering 9CE X
50 IST HOLDINGS PTY LTD IST HOLDINGS Electrical Engineering 9EE X
51 IST HOLDINGS PTY LTD IST HOLDINGS Mechanical Engineering 9ME X
52 JUNG IN CONSTRUCTION AND ENGINEERING (PTY) LTD
JUNG IN CONSTRUCTION AND ENGINEERING (PTY) LTD Civil Engineering 9CE X
53 KHUMBULA PROPERTY SERVICES (PTY) LTD
KHUMBULA PROPERTY SERVICES (PTY) LTD
General Building Works 9GB PE X
54 LENNINGS DEC RAIL SERVICES (PTY) LTD
LENNINGS DEC RAIL SERVICES (PTY) LTD Civil Engineering 9CE X
55 LONEROCK CONSTRUCTION (PTY) LTD
LONEROCK CONSTRUCTION (PTY) LTD Civil Engineering 9CE X
56 MURRAY & ROBERTS CEMENTATION (PTY) LTD
MURRAY & ROBERTS CEMENTATION Civil Engineering 9CE X
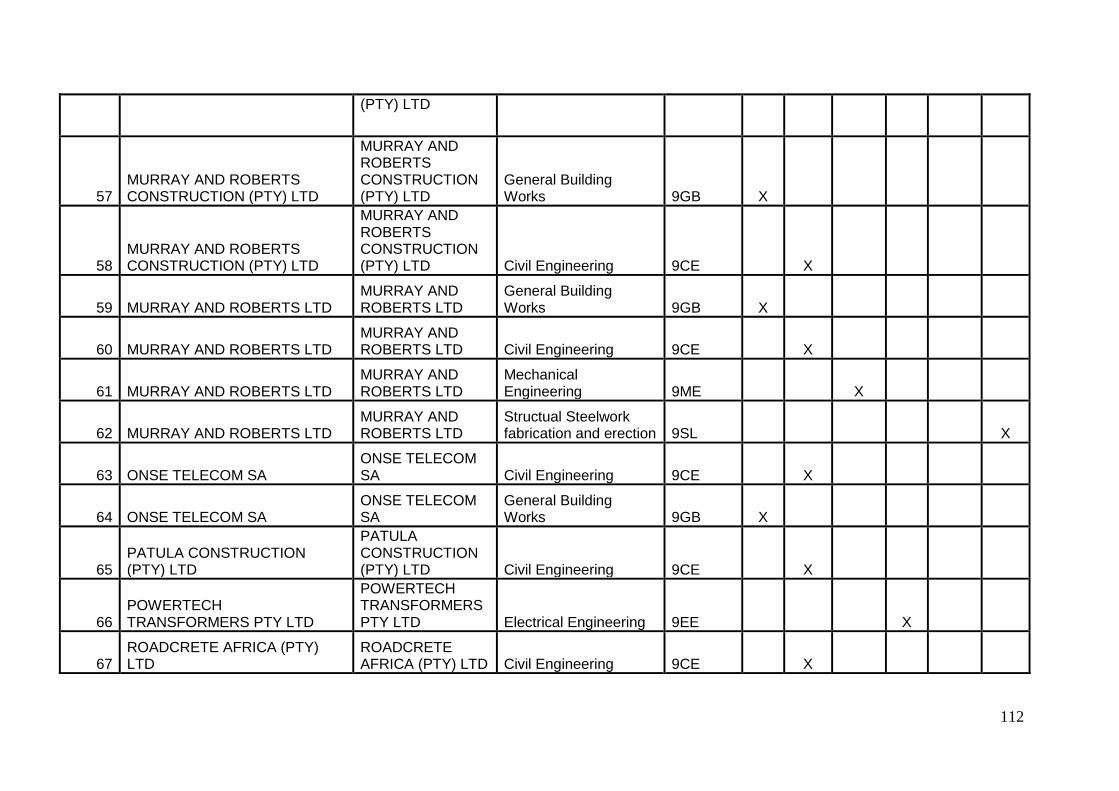
112
(PTY) LTD
57 MURRAY AND ROBERTS CONSTRUCTION (PTY) LTD
MURRAY AND ROBERTS CONSTRUCTION (PTY) LTD
General Building Works 9GB X
58 MURRAY AND ROBERTS CONSTRUCTION (PTY) LTD
MURRAY AND ROBERTS CONSTRUCTION (PTY) LTD Civil Engineering 9CE X
59 MURRAY AND ROBERTS LTD MURRAY AND ROBERTS LTD
General Building Works 9GB X
60 MURRAY AND ROBERTS LTD MURRAY AND ROBERTS LTD Civil Engineering 9CE X
61 MURRAY AND ROBERTS LTD MURRAY AND ROBERTS LTD
Mechanical Engineering 9ME X
62 MURRAY AND ROBERTS LTD MURRAY AND ROBERTS LTD
Structual Steelwork fabrication and erection 9SL X
63 ONSE TELECOM SA ONSE TELECOM SA Civil Engineering 9CE X
64 ONSE TELECOM SA ONSE TELECOM SA
General Building Works 9GB X
65 PATULA CONSTRUCTION (PTY) LTD
PATULA CONSTRUCTION (PTY) LTD Civil Engineering 9CE X
66 POWERTECH TRANSFORMERS PTY LTD
POWERTECH TRANSFORMERS PTY LTD Electrical Engineering 9EE X
67 ROADCRETE AFRICA (PTY) LTD
ROADCRETE AFRICA (PTY) LTD Civil Engineering 9CE X

113
68 SIEMENS LIMITED SIEMENS Electrical Engineering 9EE X
69 SIEMENS LIMITED SIEMENS Mechanical Engineering 9ME X
70 SINOHYDRO CORPORATION SINOHYDRO CORPORATION Civil Engineering 9CE X
71 STEFANUTTI & BRESSAN HOLDINGS LIMITED
STEFANUTTI & BRESSAN HOLDINGS LIMITED Civil Engineering 9CE X
72 STEFANUTTI & BRESSAN HOLDINGS LIMITED
STEFANUTTI & BRESSAN HOLDINGS LIMITED
General Building Works 9GB X
73 STEINMULLER AFRICA PTY LTD
STEINMULLER AFRICA PTY LTD
Mechanical Engineering 9ME X
74 STEINMULLER ENGINEERING SERVICES PTY LTD
STEINMULLER ENGINEERING SERVICES PTY LTD
Mechanical Engineering 9ME X
75 STOCKS (PROPRIETARY) LIMITED STOCKS LIMITED
General Building Works 9GB X
76 SULZER PUMPS (SOUTH AFRICA) LIMITED
SULZER PUMPS (SOUTH AFRICA) LIMITED
Mechanical Engineering 9ME X
77 THYSSENKRUPP ENGINEERING (PTY) LTD
THYSSENKRUPP ENGINEERING (PTY) LTD
Mechanical Engineering 9ME X
78 TRENCON CONSTRUCTION (PTY) LTD
TRENCON CONSTRUCTION (PTY) LTD
General Building Works 9GB PE X

114
79 VANDERLANDE INDUSTRIES B.V.
VANDERLANDE INDUSTRIES B.V.
Mechanical Engineering 9ME X
80 WBHO CONSTRUCTION (PTY) LTD
WBHO CONSTRUCTION (PTY) LTD Civil Engineering 9CE X
81 WBHO CONSTRUCTION (PTY) LTD
WBHO CONSTRUCTION (PTY) LTD
General Building Works 9GB X
82 WK PIPELINE PTY LTD WK PIPELINE PTY LTD Civil Engineering 9CE X
83 ZEST ELECTRIC MOTORS (PTY) LTD
ZEST ELECTRIC MOTORS (PTY) LTD Electrical Engineering 9EE X
Notes
GB - General Building Works
CE - Civil Engineering
ME - Mechanical Engineering
EE - Electrical Engineering
SC - Building Excavations, Shaft Sinking and Lateral Earth Support
SL - Structual Steelwork fabrication and erection

Appendix D2 – Consolidated list of level 9 contracting firms
Serial # Level 9 Contractors
Construction Works Categories Working in
SA Admin
Office in SA HQ in
Gauteng Diversification
classification of sampled firms GB CE ME EE SC SL Yes No Yes No Yes No
1 AVENG (AFRICA) LIMITED X X X X X X X X Highly diversified
2 GROUP FIVE LIMITED X X X X X X X X Highly diversified
3 MURRAY & ROBERTS CEMENTATION (PTY) LTD X X X X X X X Highly diversified
4 CONCOR HOLDINGS (PTY) LTD X X X X X X
-
5 COVEC S A (PTY) LTD X X X X X X
-
6 HO HUP CORPORATION (SA)(PTY)LTD X X X X X X
-
7 ALSTOM ELECTRICAL INDUSTRIES (PTY) LTD X X X X X
-
8 BASIL READ (PTY) LTD X X X X X
Moderately diversified
9 BOUYGUES TRAVAUX PUBLICS (INCORPORATED IN VERSAILLES) X X X X X
Moderately diversified
10 CHINA HARBOUR ENGINEERING COMPANY LIMITED X X X X
Moderately diversified
11 CHINA RAILWAY SEVENTH GROUP SA X X
-
12 CONSTRUCTORA DO TAMEGA SOUTH AFRICA (PTY) LTD X X X
-
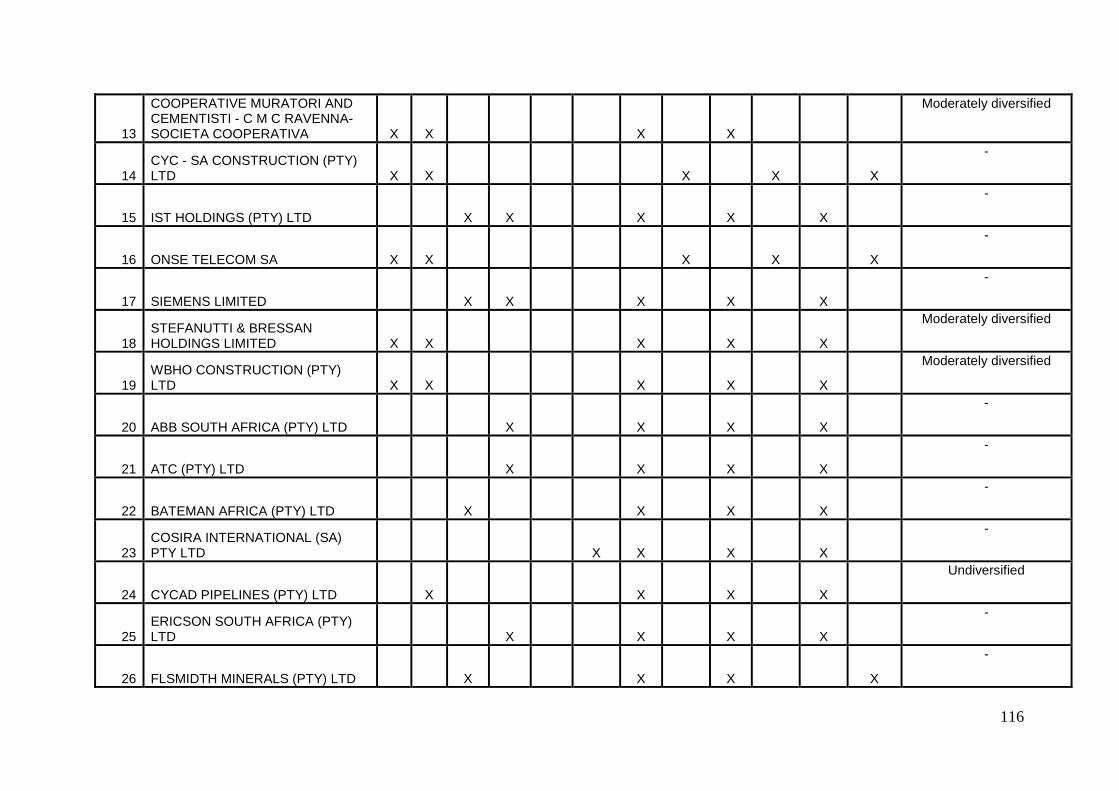
116
13
COOPERATIVE MURATORI AND CEMENTISTI - C M C RAVENNA-SOCIETA COOPERATIVA X X X X
Moderately diversified
14 CYC - SA CONSTRUCTION (PTY) LTD X X X X X
-
15 IST HOLDINGS (PTY) LTD X X X X X
-
16 ONSE TELECOM SA X X X X X
-
17 SIEMENS LIMITED X X X X X
-
18 STEFANUTTI & BRESSAN HOLDINGS LIMITED X X X X X
Moderately diversified
19 WBHO CONSTRUCTION (PTY) LTD X X X X X
Moderately diversified
20 ABB SOUTH AFRICA (PTY) LTD X X X X
-
21 ATC (PTY) LTD X X X X
-
22 BATEMAN AFRICA (PTY) LTD X X X X
-
23 COSIRA INTERNATIONAL (SA) PTY LTD X X X X
-
24 CYCAD PIPELINES (PTY) LTD X X X X
Undiversified
25 ERICSON SOUTH AFRICA (PTY) LTD X X X X
-
26 FLSMIDTH MINERALS (PTY) LTD X X X X
-

117
27 GEA NILENCA (PROPRIETARY) LIMITED X X X X
-
28 HITACHI POWER AFRICA (PTY) LTD X X X X
-
29 HITACHI POWER EUROPE GMBH X X X X
-
30 HOCHTIEF CONSTRUCTION AG X X X X
-
31 IMPREGILO S.P.A. X X X X
-
32 JUNG IN CONSTRUCTION AND ENGINEERING (PTY) LTD X X X X
-
33 KHUMBULA PROPERTY SERVICES (PTY) LTD X X X X
Undiversified
34 LENNINGS DEC RAIL SERVICES (PTY) LTD X X X X
Undiversified
35 LONEROCK CONSTRUCTION (PTY) LTD X X X X
Undiversified
36 PATULA CONSTRUCTION (PTY) LTD X X X X
Undiversified
37 POWERTECH TRANSFORMERS (PTY) LTD X X X X
-
38 ROADCRETE AFRICA (PTY) LTD X X X X
Undiversified
39 SINOHYDRO CORPORATION X X X X
-
40 STEINMULLER AFRICA (PTY) LTD X X X X
-

118
41 STEINMULLER ENGINEERING SERVICES (PTY) LTD X X X X
-
42 STOCKS (PTY) LIMITED X X X X
-
43 SULZER PUMPS (SOUTH AFRICA) LIMITED X X X X
-
44 THYSSENKRUPP ENGINEERING (PTY) LTD X X X X
-
45 TRENCON CONSTRUCTION (PTY) LTD X X X X
Undiversified
46 VANDERLANDE INDUSTRIES B.V. X X X X
-
47 WK PIPELINE (PTY) LTD X X X X
Undiversified
48 ZEST ELECTRIC MOTORS (PTY) LTD X X X X
-

Appendix E - Results of test of reliability
Section
Number of
items or
variables
Cronbach’
Alpha
coefficient
C. Assessment of company’s
strengths / weaknesses
C.1 22 0.813
C.2 23 0.889
D. Challenges/threats to growth of the company 15 0.994
E. Diversification in the company
E.7 strategy 12 0.873
E.8 Post
diversification 12 0.005
E.9 Barriers 12 0.727

120
Appendix F (Frequency tables)
Appendix F1 - Major areas of specialization of sampled firms Percentage of response received (%)
Areas of specialization Undiversified Moderately
Diversified
Highly
diversified
Total
General Building 11.12 33.34 33.34 77.80
Civil Engineering 33.34 33.34 33.34 100.00
Mechanical Engineering 11.12 11.12 33.34 55.57
Electrical Engineering - 11.12 11.12 22.24
Building Excavations - 22.23 - 22.23
Structural steelwork - 11.12 11.12 22.24
Formwork - 11.12 11.12 22.24
Property Dev - - 11.12 11.20
Estate Development - - 11.12 11.20
Plant hire - - - -
Construction products - - 22.23 22.23
Healthcare - - - -
Waste disposal - - - -
Mining - 22.23 11.12 33.35
Securities trading - - - 0
Others 22.23 - - 22.23

121
Appendix F2 - Category of corporate registration Percentage of response received (%)
Corporate registration Undiversified Moderately diversified Highly diversified
Close corporation - - -
Private (Pty) Limited 33.34 - -
Public – listed on JSE - 33.34 33.34

122
Appendix F3 – Firm strategy on expansion
Percentage of response received (%)
Strategy on expansion Undiversified Moderately
diversified
Highly diversified
Internal capacity expansion 33.34 33.34 33.34
Mergers - 11.12 -
Acquisitions 11.12 33.34 11.12
Joint ventures 11.12 22.23 22.23
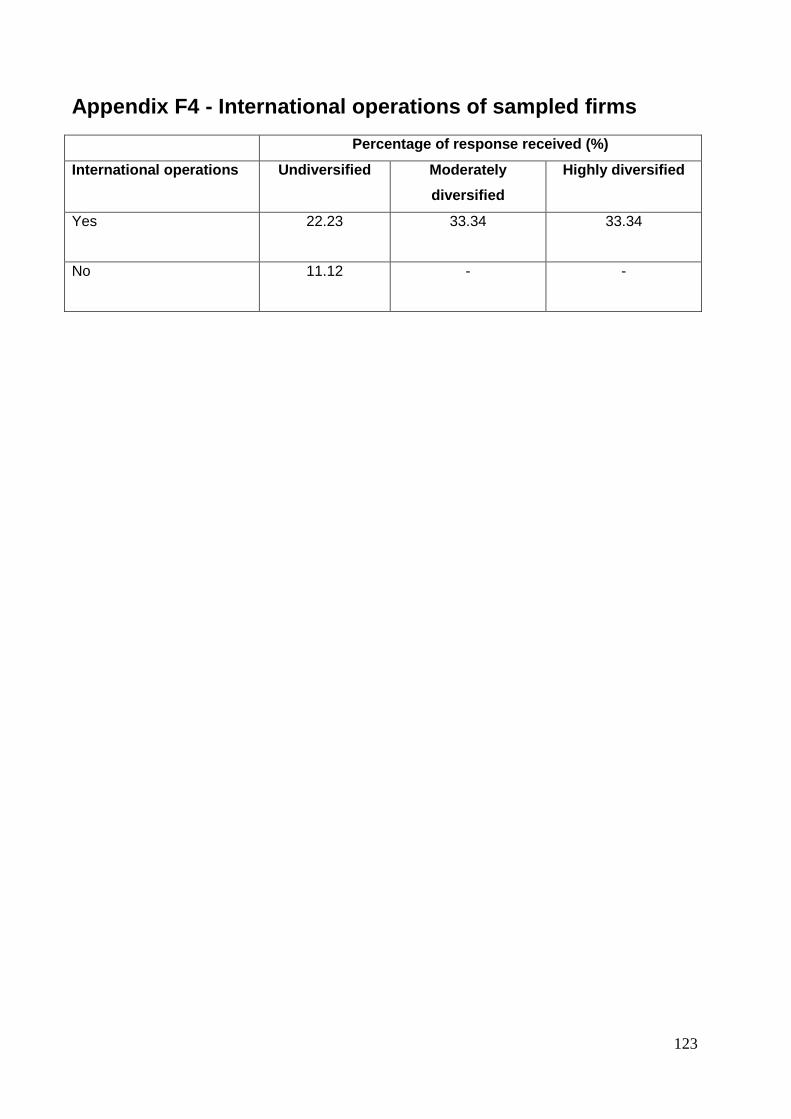
123
Appendix F4 - International operations of sampled firms
Percentage of response received (%)
International operations Undiversified Moderately
diversified
Highly diversified
Yes 22.23 33.34 33.34
No 11.12 - -

124
Appendix F5 - International operations of sampled firms
(number of countries)
Number of countries (international operations)
Firms Undiversified Moderately
diversified
Highly diversified
Wk Pipelines 2 - -
Trencon Construction 0 - -
Lenning DEC 3 - -
Wilson Bayly Holmes-
Ovcon (WBHO)
- 7 -
Stefanutti Stocks Holdings - 9 -
Basil Read - 2 -
Murray and Roberts - 10
Group 5 - - 5
Aveng - - 4

125
Appendix F6 - Interest in diversification (undiversified firms)
Interest in diversification
Response Percentage of total
response (%)
Yes 66.67
No 33.33

126
Appendix F7 - Status of diversification (undiversified firms)
Status of the process of diversification Percentage
response (%)
The company is not interested in diversification now and in the near future 66.67
The discussion about diversification has just been initiated at the senior
management level
33.34
The board is in the process of making a decision on diversification of the
company
-
The board has reached a conclusion on the diversification of the company -
The company has begun restructuring to implement the strategy of
diversification
-
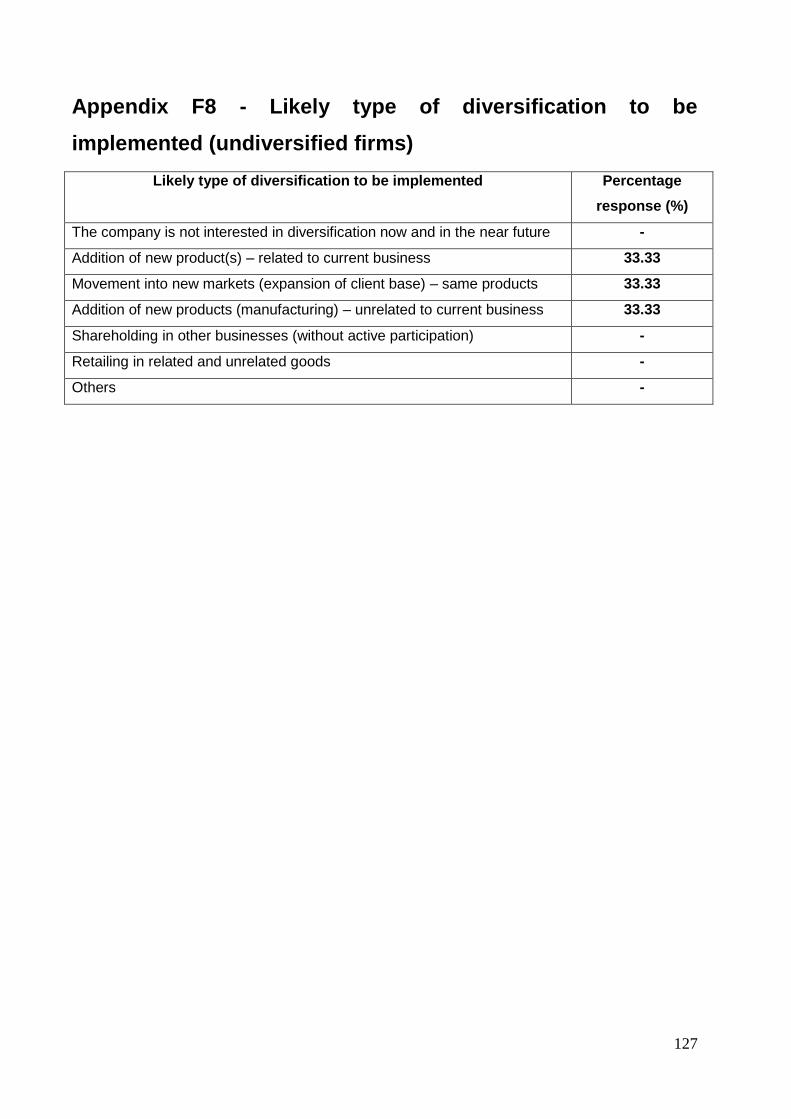
127
Appendix F8 - Likely type of diversification to be
implemented (undiversified firms)
Likely type of diversification to be implemented Percentage
response (%)
The company is not interested in diversification now and in the near future -
Addition of new product(s) – related to current business 33.33
Movement into new markets (expansion of client base) – same products 33.33
Addition of new products (manufacturing) – unrelated to current business 33.33
Shareholding in other businesses (without active participation) -
Retailing in related and unrelated goods -
Others -

128
Appendix F9 - Likely mode of diversification to be
implemented (undiversified firms)
Likely mode of diversification (%)
Internal (organic growth) External Internal
&
External
Product
diversity
Move to
new
markets
Capacity building
within firm’s area
of core
competence
Merger Acquisition Joint
venture/alliance
-
33.34 33.34 66.67 - 33.34 33.34 -
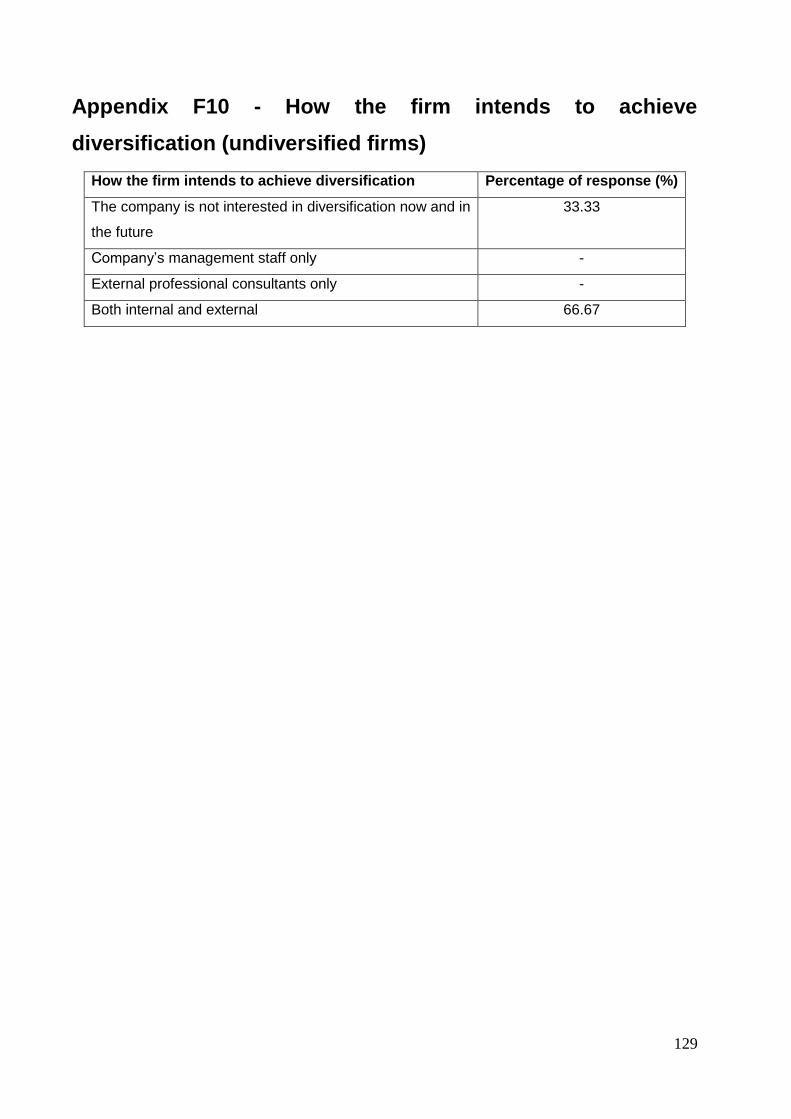
129
Appendix F10 - How the firm intends to achieve
diversification (undiversified firms)
How the firm intends to achieve diversification Percentage of response (%)
The company is not interested in diversification now and in
the future
33.33
Company’s management staff only -
External professional consultants only -
Both internal and external 66.67

130
Appendix F11 - Current / future management structure of the
firm (undiversified firms)
Management structures of the company Percentage of response
(%) (current)
Percentage of
response (%) (likely -
after)
The company is not interested in
diversification now and in the near future
Not applicable 33.34
Unitary structure (military) - -
Functional (professional managers heading
units)
33.34 33.34
Regional administration (with semi-
autonomy)
- -
Divisional structure (under central
administration)
33.34 33.34
Others (specify) - -

131
Appendix F12 – Type of diversification existing in the firm
(diversified firms)
Type of diversification existing in the firm Percentage
response (%)
Addition of new product(s) – related to current business 33.34
Movement into new markets (expansion of client base) – same products 50.00
Addition of new products (manufacturing) – unrelated to current business -
Shareholding in other businesses (without active participation) 50.00
Retailing in related and unrelated goods -
Others -

132
Appendix F13 – Type of organization – diversification type
(diversified firms)
Type of organization
(diversification type)
Rankings in order of importance (% of response)
1 2 3 4 5
Addition of new product(s) – related to
current business
33.34 16.67 50.00 - -
Movement into new markets (expansion
of client base) – same products
50.00 16.67 16.67 16.67 -
Addition of new products
(manufacturing) – unrelated to current
business
- 33.34 - 33.34 16.67
Shareholding in other businesses
(without active participation)
16.67 33.34 - 33.34 -
Retailing in related and unrelated
goods
- - 16.67 - 66.67
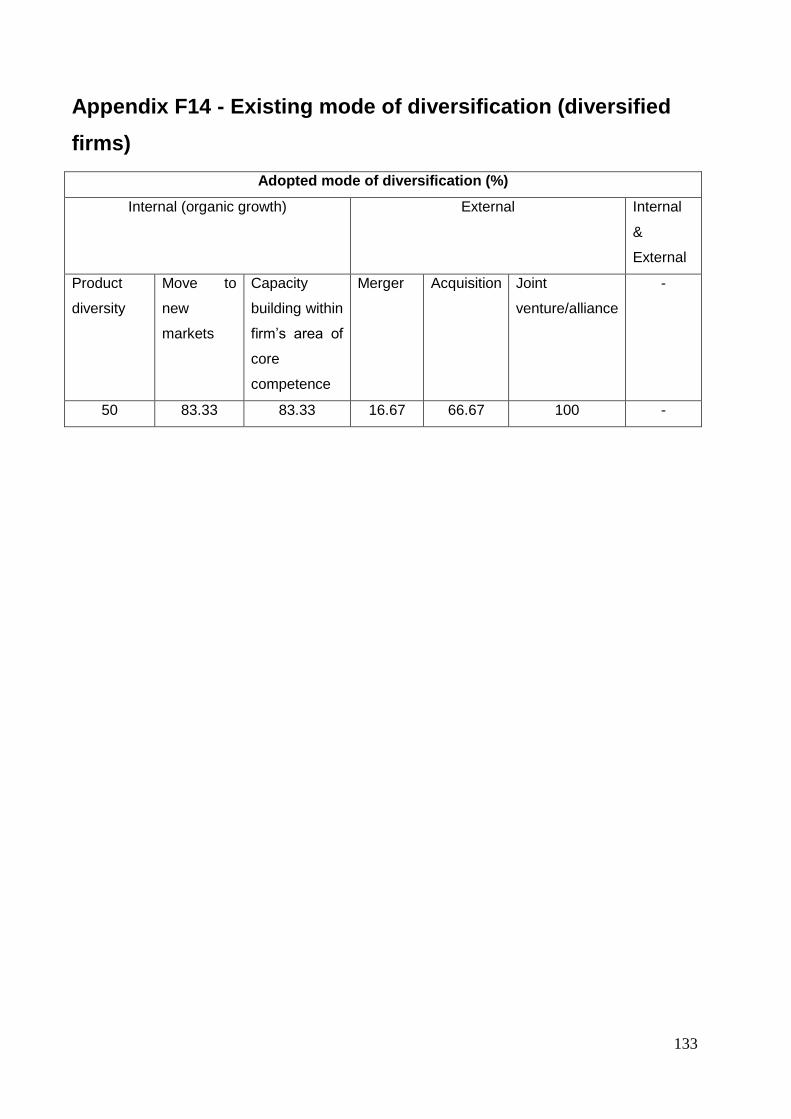
133
Appendix F14 - Existing mode of diversification (diversified
firms)
Adopted mode of diversification (%)
Internal (organic growth) External Internal
&
External
Product
diversity
Move to
new
markets
Capacity
building within
firm’s area of
core
competence
Merger Acquisition Joint
venture/alliance
-
50 83.33 83.33 16.67 66.67 100 -

134
Appendix F15 - How diversification was achieved (diversified
firms)
How diversification processes were
achieved
Percentage of total response (%)
Company’s management staff only 50
External professional staff only -
Both internal and external 50
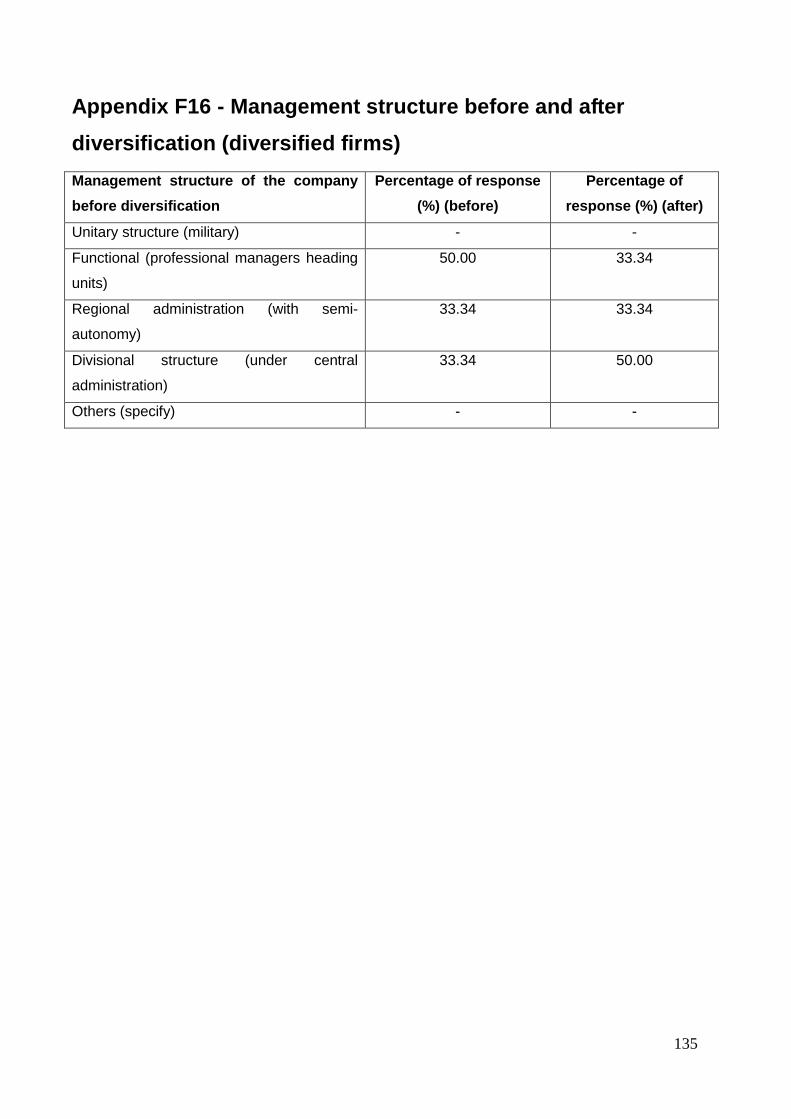
135
Appendix F16 - Management structure before and after
diversification (diversified firms)
Management structure of the company
before diversification
Percentage of response
(%) (before)
Percentage of
response (%) (after)
Unitary structure (military) - -
Functional (professional managers heading
units)
50.00 33.34
Regional administration (with semi-
autonomy)
33.34 33.34
Divisional structure (under central
administration)
33.34 50.00
Others (specify) - -

136
Appendix F17 – Centralized financial reporting structure in
the firm (diversified firms)
Does the company operate a centralized financial reporting system (i.e. a
single end-of-year financial statement)
Response Percentage of total
response (%)
Yes 100
No -

137
Appendix F18 – Post diversification experience (diversified
firms)
Variables
Percentage (%) response
Strongly
Agree Agree
Neither
agree nor
disagree
Disagree
Strongly
disagree
The company experienced steady growth in sale
(turnover) volume 33.33 50 16.67 - -
There was a steady growth in overall profitability 16.67 50 16.67 16.67 -
Asset turnover for the company increased 16.67 16.67 66.67 - -
Improvement in the utilization of resources
(human, technical and financial) was realized 16.67 16.67 50 16.67 -
A boost in the corporate image of the company
was achieved 33.33 16.67 50 - -
The company achieved an edge over competitors 16.67 33.33 16.67 33.33 -
The company’s management structure had to
change 33.33 33.33 16.67 16.67 -
More professionals and skilled staff have to be
employed 16.67 16.67 50 16.67 -
At a point, the company had to divest its interest
in some business to refocus its operation – due
to failure in such businesses
- 33.33 16.67 33.33 16.67
The company did not enjoy economy of scope –
build synergies in asset utilization - 16.67 33.33 33.33 16.67
It was not possible to achieve economy of scale
because of production type – usually customized
products
- 16.67 16.67 33.33 16.67
Unable to create monopoly in the market - 33.33 16.67 16.67 33.33

138
Appendix F19 - Factors influencing decision not to diversify
(undiversified)
Factors influencing decisions
not to diversify
Rankings (% of response)
5 4 3 2 1
Strongly agree
Agree Neither agree nor disagree
Disagree Strongly disagree
Satisfied with the present level
of growth
66.67 - - - -
Insufficient knowledge of other
types of businesses
- - - 33.34 33.34
Consider diversification process
too difficult/involving
- 33.34 - - 33.34
Inadequate resources (human,
technical and financial)
- 33.34 - - 33.34
Present market not saturated –
more opportunities exist here
- 33.34 - 33.34 -
High cost involved in
diversification
- 33.34 - 33.34 -
Prefer to be focused and
specialized in present business
- 33.34 - 33.34 -
Diversified companies are not
doing better than us
- 33.34 - 33.34 -

139
Appendix G – Results of factor analysis
Appendix G1 – Communalities of variables for subsection C 1
(firm’s current strengths/weaknesses)
Variable Initial Extraction
Skilled and competent management staff 1.000 .998
Skilled and competent technical staff 1.000 .973
Highly trained operatives 1.000 .989
Fixed asset base 1.000 .932
Adequate plant and equipment 1.000 .851
Financial base and ability to support client financially 1.000 .994
Flexibility in operation and company organisation structure 1.000 1.000
High overhead costs 1.000 .975
Sound financial management practices 1.000 .955
Access to credit/finance (suppliers, banks, stock market, subcontractors etc} 1.000 .934
Ability to access and retain highly qualified subcontractors and specialist
labour 1.000 .897
High quality of products and services 1.000 .989
Age of company and experience 1.000 .861
Goodwill and brand name of the enterprise 1.000 .957
Ability to build long term relationships with customers 1.000 .972
Provision of after sale services /support to clients 1.000 .996
Project delivery to budget and time 1.000 .974
Creativity/ innovation in project delivery process 1.000 .996
Avoidance of adversarial postures during contract execution 1.000 .960
Professionalism (ethical practices) and reputation 1.000 .847
Use information and communication technologies 1.000 .991
Adoption of Black Economic Empowerment (BEE) policy 1.000 .975

140
Appendix G2 – Total variance explained by components for
subsection C 1 (firm’s current strengths/weaknesses)
Component
Initial Eigenvalues Extraction Sums of Squared
Loadings Rotation Sums of Squared
Loadings
Total % of
Variance Cumulative
% Total
% of Variance
Cumulative %
Total % of
Variance Cumulative
%
1 8.352 37.962 37.962 8.352 37.962 37.962 4.344 19.746 19.746
2 4.478 20.355 58.318 4.478 20.355 58.318 4.328 19.672 39.418
3 2.788 12.674 70.992 2.788 12.674 70.992 3.631 16.506 55.924
4 2.305 10.479 81.470 2.305 10.479 81.470 2.964 13.474 69.398
5 1.833 8.330 89.801 1.833 8.330 89.801 2.902 13.189 82.588
6 1.259 5.722 95.523 1.259 5.722 95.523 2.846 12.935 95.523
7 .985 4.477 100.000 - - - - - -

141
Appendix G3 – Initial component matrix for subsection C 1
(firm’s current strengths/weaknesses)
Variable
Component
1 2 3 4 5 6
Ability to access and retain highly qualified subcontractors
and specialist labour .856 -.036 .117 .249 -.243 -.168
Highly trained operatives .800 .071 -.230 -.310 .298 .326
Adoption of Black Economic Empowerment (BEE) policy -.785 .242 -.197 .401 .173 .266
Provision of after sale services /support to clients .773 -.291 .109 .207 -.290 .419
Creativity/ innovation in project delivery process .773 -.291 .109 .207 -.290 .419
Skilled and competent management staff .747 .008 .478 -.383 .252 .040
Sound financial management practices .726 .565 -.157 -.077 -.210 .182
Professionalism (ethical practices) and reputation .717 .227 -.478 .130 -.050 -.182
Fixed asset base .710 .415 -.007 .106 -.146 -.473
Age of company and experience .620 -.316 -.082 -.192 .526 -.237
Ability to build long term relationships with customers .606 -.592 -.293 .396 -.045 -.094
High quality of products and services .589 -.461 .495 -.357 -.238 .025
Adequate plant and equipment .567 .554 -.367 -.095 -.091 .266
High overhead costs -.120 .852 .215 .363 .211 -.114
Use information and communication technologies -.541 .743 -.106 .107 .054 .347
Flexibility in operation and company organisation structure -.041 .706 .604 -.299 -.200 -.069
Avoidance of adversarial postures during contract
execution .515 .663 .469 -.103 .100 -.121
Goodwill and brand name of the enterprise .600 .241 -.716 .114 .064 -.095
Access to credit/finance (suppliers, banks, stock market,
subcontractors etc} .504 .023 .161 .728 .310 -.162
Financial base and ability to support client financially .506 .355 .503 .540 .162 .202
Project delivery to budget and time .032 -.503 .389 .227 .696 .178
Skilled and competent technical staff .448 .277 -.348 -.509 .550 .114

142
Appendix G4 – Rotated component matrix for subsection C 1
(firm’s current strengths/weaknesses)
Total % of variance explained: 95.5%
Component
1 2 3 4 5 6
Use information and communication technologies -.897 .009 .399 -.106 -.011 -.122
Adoption of Black Economic Empowerment (BEE)
policy -.891 -.273 -.119 -.217 -.212 .033
High quality of products and services .854 -.157 .131 .456 .068 -.074
Skilled and competent management staff .634 -.024 .421 .282 .544 .206
Ability to access and retain highly qualified
subcontractors and specialist labour .533 .509 .054 .425 -.039 .410
Goodwill and brand name of the enterprise -.051 .843 -.284 .055 .378 .132
Professionalism (ethical practices) and reputation .150 .826 -.129 .128 .254 .213
Fixed asset base .369 .753 .325 -.017 .025 .349
Sound financial management practices .021 .722 .383 .434 .312 .032
Project delivery to budget and time .139 -.694 -.249 .056 .312 .557
Adequate plant and equipment -.178 .689 .224 .345 .414 -.054
Flexibility in operation and company organization
structure -.003 .008 .989 -.053 -.098 -.100
Avoidance of adversarial postures during contract
execution .180 .286 .818 .069 .245 .334
Ability to build long term relationships with
customers .425 .293 -.679 .331 -.009 .367
High overhead costs -.517 .201 .626 -.242 -.053 .463
Provision of after sale services /support to clients .361 .192 -.134 .875 .062 .206
Creativity/ innovation in project delivery process .361 .192 -.134 .875 .062 .206
Skilled and competent technical staff .032 .284 .079 -.099 .932 -.083
Highly trained operatives .225 .343 -.008 .400 .811 .044

143
Age of company and experience .562 .098 -.246 -.097 .609- .306
Access to credit/finance (suppliers, banks, stock
market, subcontractors etc} .085 .196 -.078 .142 -.004 .928
Financial base and ability to support client
financially -.046 .071 .435 .448 .046 .771

144
Appendix G5 – Communalities of variables for subsection C 2
(factors that influence firm growth)
Variable Initial Extraction
Skilled and competent management staff 1.000 .843
Skilled and competent technical staff 1.000 .982
Highly trained operatives 1.000 .993
Fixed asset base 1.000 .946
Adequate plant and equipment 1.000 .926
Financial base and ability to support client financially 1.000 .989
Flexibility in operation and company organisation structure 1.000 .974
High overhead costs 1.000 .953
Sound financial management practices 1.000 .981
Access to credit/finance (suppliers, banks, stock market, subcontractors etc} 1.000 .883
Ability to access and retain highly qualified subcontractors and specialist
labour 1.000 .944
High quality of products and services 1.000 .981
Age of company and experience 1.000 .887
Goodwill and brand name of the enterprise 1.000 .909
Ability to build long term relationships with customers 1.000 .976
Provision of after sale services /support to clients 1.000 .951
Project delivery to budget and time 1.000 .998
Adoption of Black Economic Empowerment (BEE) policy 1.000 .926
Adoption of Joint Venture/Alliances with other companies 1.000 .886
Creativity/ innovation in project delivery process 1.000 .901
Avoidance of adversarial postures during contract execution 1.000 .952
Professionalism (ethical practices) and reputation 1.000 .926
Use information and communication technologies 1.000 .989

145
Appendix G6 – Total variance explained by components
created for subsection C 2 (firm’s current
strengths/weaknesses)
Component
Initial Eigenvalues Extraction Sums of
Squared Loadings
Rotation Sums of Squared
Loadings
Total % of
Variance
Cumulative
% Total
% of
Variance
Cumulative
% Total
% of
Variance
Cumulative
%
1 8.830 38.390 38.390 8.830 38.390 38.390 5.426 23.592 23.592
2 4.931 21.440 59.830 4.931 21.440 59.830 4.752 20.661 44.252
3 2.705 11.762 71.592 2.705 11.762 71.592 3.587 15.596 59.848
4 2.207 9.598 81.189 2.207 9.598 81.189 3.174 13.799 73.647
5 1.848 8.033 89.222 1.848 8.033 89.222 2.492 10.837 84.484
6 1.175 5.109 94.332 1.175 5.109 94.332 2.265 9.848 94.332
7 .733 3.185 97.517 - - - - - -
8 .571 2.483 100.000 - - - - - -

146
Appendix G7 – Initial component matrix for subsection C 2
(firm’s current strengths/weaknesses)
Variable Component
1 2 3 4 5 6
Financial base and ability to support client financially .953 .139 -.221 .053 .071 -.067
Creativity/ innovation in project delivery process .913 .087 -.060 .207 -.112 -.043
Ability to build long term relationships with customers .774 -.101 .333 -.495 .074 -.067
Skilled and competent technical staff .774 .112 .318 .036 -.517 -.020
Skilled and competent management staff .752 -.146 -.184 .068 -.335 .325
Professionalism (ethical practices) and reputation .751 .475 .146 -.199 .213 -.172
Adequate plant and equipment .743 .113 -.575 .085 -.121 .094
Sound financial management practices .729 -.253 .201 .056 .473 -.344
Fixed asset base .725 -.272 -.103 .515 .257 .065
Provision of after sale services /support to clients .719 .489 -.249 -.149 -.075 .326
Ability to access and retain highly qualified subcontractors
and specialist labour .688 -.351 .205 -.287 .191 -.433
Access to credit/finance (suppliers, banks, stock market,
subcontractors etc} .684 .048 -.419 .325 .047 -.360
Goodwill and brand name of the enterprise .662 -.224 .255 -.336 .271 .411
Use information and communication technologies .044 .880 .219 .199 .344 .081
Adoption of Joint Venture/Alliances with other companies .320 .838 .126 -.229 .026 .109
Adoption of Black Economic Empowerment (BEE) policy .111 .809 .384 -.270 -.132 -.142
High quality of products and services .222 -.808 .188 .329 .213 .302
Age of company and experience .404 -.714 .002 -.290 .306 .189
Avoidance of adversarial postures during contract
execution .347 .673 .231 .333 .319 .336
Project delivery to budget and time .551 .007 -.811 -.102 -.135 -.089
Flexibility in operation and company organisation structure .513 -.516 .617 .035 -.248 .039
High overhead costs .020 .188 .371 .872 .056 -.123

147
Highly trained operatives .487 -.141 .428 .179 -.720 -.049
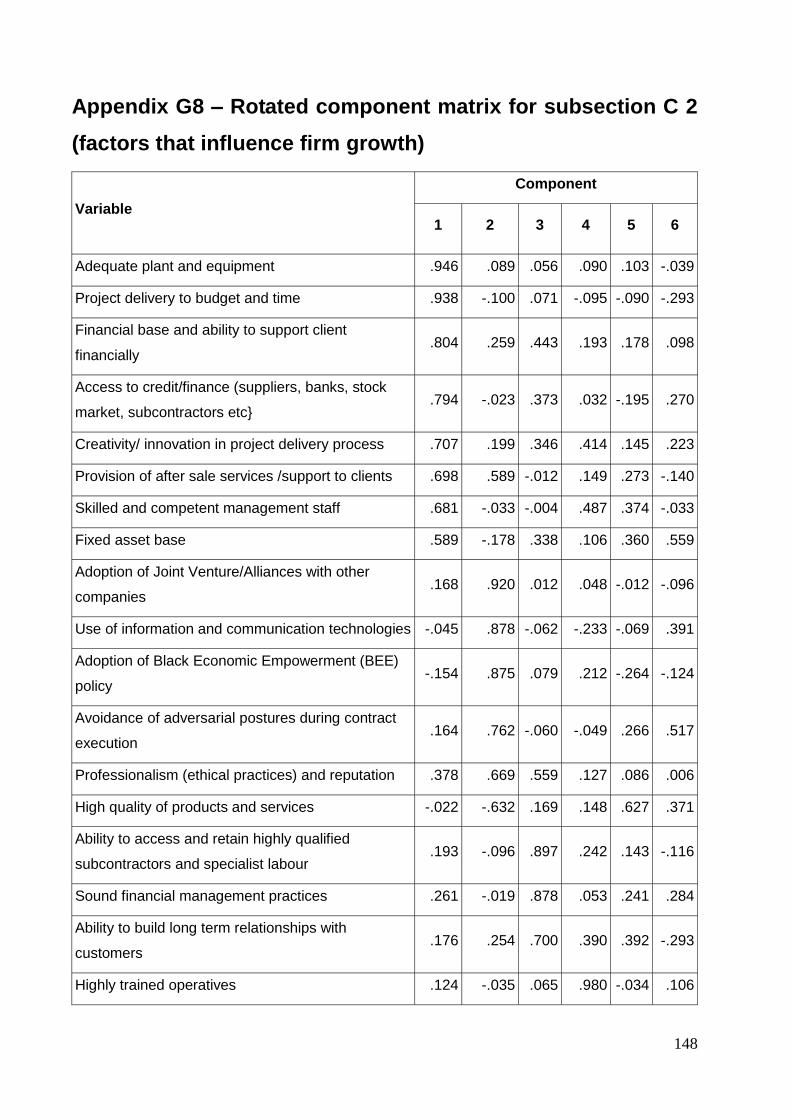
148
Appendix G8 – Rotated component matrix for subsection C 2
(factors that influence firm growth)
Variable
Component
1 2 3 4 5 6
Adequate plant and equipment .946 .089 .056 .090 .103 -.039
Project delivery to budget and time .938 -.100 .071 -.095 -.090 -.293
Financial base and ability to support client
financially .804 .259 .443 .193 .178 .098
Access to credit/finance (suppliers, banks, stock
market, subcontractors etc} .794 -.023 .373 .032 -.195 .270
Creativity/ innovation in project delivery process .707 .199 .346 .414 .145 .223
Provision of after sale services /support to clients .698 .589 -.012 .149 .273 -.140
Skilled and competent management staff .681 -.033 -.004 .487 .374 -.033
Fixed asset base .589 -.178 .338 .106 .360 .559
Adoption of Joint Venture/Alliances with other
companies .168 .920 .012 .048 -.012 -.096
Use of information and communication technologies -.045 .878 -.062 -.233 -.069 .391
Adoption of Black Economic Empowerment (BEE)
policy -.154 .875 .079 .212 -.264 -.124
Avoidance of adversarial postures during contract
execution .164 .762 -.060 -.049 .266 .517
Professionalism (ethical practices) and reputation .378 .669 .559 .127 .086 .006
High quality of products and services -.022 -.632 .169 .148 .627 .371
Ability to access and retain highly qualified
subcontractors and specialist labour .193 -.096 .897 .242 .143 -.116
Sound financial management practices .261 -.019 .878 .053 .241 .284
Ability to build long term relationships with
customers .176 .254 .700 .390 .392 -.293
Highly trained operatives .124 -.035 .065 .980 -.034 .106

149
Skilled and competent technical staff .369 .279 .228 .842 .070 .040
Flexibility in operation and company organizational
structure -.108 -.226 .402 .764 .387 .129
Goodwill and brand name of the enterprise .165 .152 .404 .193 .800 -.138
Age of company and experience .121 -.447 .452 .000 .656 -.197
High overhead costs -.094 .101 -.049 .181 -.188 .929
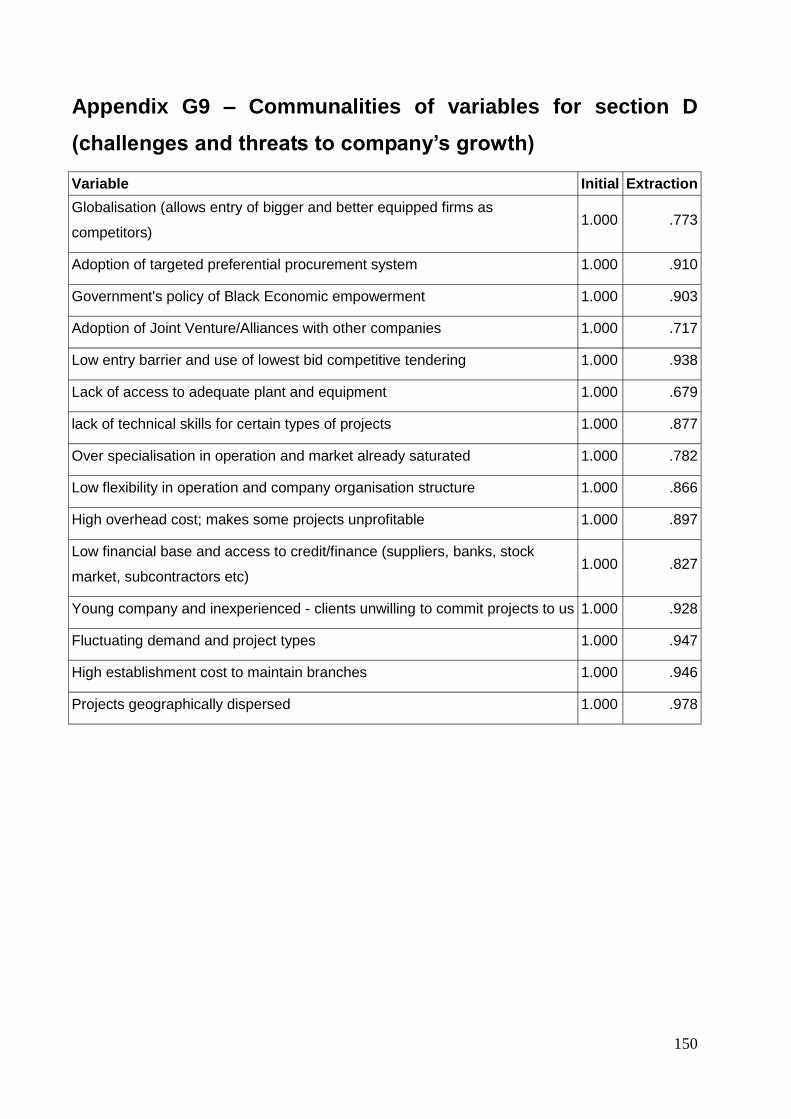
150
Appendix G9 – Communalities of variables for section D
(challenges and threats to company’s growth)
Variable Initial Extraction
Globalisation (allows entry of bigger and better equipped firms as
competitors) 1.000 .773
Adoption of targeted preferential procurement system 1.000 .910
Government's policy of Black Economic empowerment 1.000 .903
Adoption of Joint Venture/Alliances with other companies 1.000 .717
Low entry barrier and use of lowest bid competitive tendering 1.000 .938
Lack of access to adequate plant and equipment 1.000 .679
lack of technical skills for certain types of projects 1.000 .877
Over specialisation in operation and market already saturated 1.000 .782
Low flexibility in operation and company organisation structure 1.000 .866
High overhead cost; makes some projects unprofitable 1.000 .897
Low financial base and access to credit/finance (suppliers, banks, stock
market, subcontractors etc) 1.000 .827
Young company and inexperienced - clients unwilling to commit projects to us 1.000 .928
Fluctuating demand and project types 1.000 .947
High establishment cost to maintain branches 1.000 .946
Projects geographically dispersed 1.000 .978

151
Appendix G10 – Total variance explained by components
created for section D (challenges and threats to company’s
growth)
Component
Initial Eigenvalues Extraction Sums of Squared Loadings
Rotation Sums of Squared Loadings
Total % of Variance
Cumulative %
Total % of Variance
Cumulative %
Total % of Variance
Cumulative %
1 9.033 60.221 60.221 9.033 60.221 60.221 6.886 45.904 45.904
2 2.456 16.374 76.595 2.456 16.374 76.595 3.781 25.209 71.112
3 1.480 9.865 86.460 1.480 9.865 86.460 2.302 15.348 86.460
4 .857 5.712 92.172 - - - - - -
5 .699 4.659 96.831 - - - - - -
6 .304 2.028 98.859 - - - - - -
7 .171 1.141 100.000 - - - - - -

152
Appendix G11 – Initial component matrix for section D
(challenges and threats to company’s growth)
Variable
Component
1 2 3
Projects geographically dispersed .967 -.184 .094
Fluctuating demand and project types .957 -.106 .143
High establishment cost to maintain branches .931 .126 .251
Low financial base and access to credit/finance (suppliers, banks, stock
market, subcontractors etc) .903 .098 .041
Young company and inexperienced - clients unwilling to commit projects to us .888 .340 .156
Over specialisation in operation and market already saturated .865 -.011 .185
Adoption of targeted preferential procurement system .825 -.476 .057
Low flexibility in operation and company organisation structure .811 .007 -
.455
Government's policy of Black Economic empowerment .791 -.447 -
.277
Adoption of Joint Venture/Alliances with other companies .766 -.272 -
.237
High overhead cost; makes some projects unprofitable .692 .635 -
.122
Globalisation (allows entry of bigger and better equipped firms as competitors) .682 -.541 -
.125
lack of technical skills for certain types of projects .358 .781 -
.372
Lack of access to adequate plant and equipment .486 .654 -
.122
Low entry barrier and use of lowest bid competitive tendering .321 .188 .894

153
Appendix G12 - Rotated component matrix for section D
(challenges and threats to company’s growth)
Variable Component
1 2 3
Government's policy of Black Economic empowerment .944 .079 -.072
Adoption of targeted preferential procurement system .921 -
.031 .246
Projects geographically dispersed .876 .267 .373
Globalisation (allows entry of bigger and better equipped firms as competitors) .874 -
.096 .019
Adoption of Joint Venture/Alliances with other companies .822 .200 -.015
Fluctuating demand and project types .816 .312 .427
Low flexibility in operation and company organisation structure .754 .521 -.160
Low financial base and access to credit/finance (suppliers, banks, stock
market, subcontractors etc) .684 .488 .348
Over specialisation in operation and market already saturated .682 .336 .452
High establishment cost to maintain branches .651 .461 .557
lack of technical skills for certain types of projects -.046 .929 -.106
High overhead cost; makes some projects unprofitable .257 .887 .212
Lack of access to adequate plant and equipment .077 .807 .148
Young company and inexperienced - clients unwilling to commit projects to us .520 .647 .488
Low entry barrier and use of lowest bid competitive tendering -.011 .034 .968

154
Appendix G13 – Communalities of variables for section E 7
(motivation of diversification strategy)
Variable Initial Extraction
The need to spread risk-risk aversion 1.000 .889
Present market is saturated-stiff competition 1.000 .444
Need for growth (increase turnover and profit) 1.000 .896
Need to engage unutilised resources 1.000 .963
Attracted to more profitable business(es) 1.000 .916
"Bandwagon effect"-others are doing it 1.000 .842
Cyclical/fluctuating demand in present market 1.000 .989
Diversified companies appear to be doing better than us 1.000 .692
Improve the stability/survival of the company 1.000 .920
Hope to enjoy economy of scope-build synergies in asset utilisation 1.000 .892
Hope to enjoy economy of scale through operational efficiencies 1.000 .897
Desire to create a monopoly in the market 1.000 .838

155
Appendix G14 – Total variance explained by components
created for section E 7 (motivation of diversification strategy)
Component
Initial Eigenvalues Extraction Sums of Squared Loadings
Rotation Sums of Squared Loadings
Total % of
Variance Cumulative
% Total
% of Variance
Cumulative %
Total % of
Variance Cumulative
%
1 5.940 49.499 49.499 5.940 49.499 49.499 4.685 39.042 39.042
2 2.887 24.055 73.554 2.887 24.055 73.554 2.904 24.197 63.239
3 1.351 11.256 84.811 1.351 11.256 84.811 2.589 21.572 84.811
4 .988 8.231 93.041 - - - - - -
5 .668 5.567 98.608 - - - - - -
6 .167 1.392 100.000 - - - - - -

156
Appendix G15 – Initial component matrix for section E 7
(motivation of diversification strategy)
Variable
Component
1 2 3
Need to engage unutilised resources .970 -.021 -.148
Attracted to more profitable business(es) .920 -.101 -.244
Hope to enjoy economy of scope-build synergies in asset
utilisation .894 .063 -.298
Hope to enjoy economy of scale through operational
efficiencies .819 -.036 -.474
Desire to create a monopoly in the market .808 .424 .066
The need to spread risk-risk aversion .768 .034 .547
Present market is saturated-stiff competition .650 .128 -.071
Need for growth (increase turnover and profit) .642 -.608 .338
Cyclical/fluctuating demand in present market -.281 .952 .063
"Bandwagon effect"-others are doing it .323 .847 -.141
Diversified companies appear to be doing better than us -.072 .816 .145
Improve the stability/survival of the company .646 .119 .699

157
Appendix G16 – Rotated component matrix for section E 7
(motivation of diversification strategy)
Total % of variance explained: 84.8%
Component
1 2 3
Hope to enjoy economy of scale through operational efficiencies .941 -.105 .020
Hope to enjoy economy of scope-build synergies in asset utilization .921 -.009 .211
Attracted to more profitable business(es) .903 -.173 .267
Need to engage unutilized resources .901 -.097 .377
Desire to create a monopoly in the market .684 .363 .487
Present market is saturated-stiff competition .600 .078 .280
Cyclical/fluctuating demand in present market -.203 .971 -.066
Diversified companies appear to be doing better than us -.078 .821 .108
"Bandwagon effect"-others are doing it .410 .818 .070
Need for growth (increase turnover and profit) .327 -.650 .606
Improve the stability/survival of the company .195 .080 .936
The need to spread risk-risk aversion .372 -.016 .866

158
Appendix G17 - Communalities of variables for section E 9
(diversification barrier)
Variable Initial Extraction
Management has poor knowledge of new business environment 1.000 .745
Too many periphical activities unrelated to main business 1.000 .867
There was not enough attention/investment to new business(es) 1.000 .946
Inadequate planning before diversification was implemented 1.000 .945
Lack of transferable knowledge/technology and skills 1.000 .935
Stiff competition in the new market/product 1.000 .679
Customers were reluctant to try out new products 1.000 .893
Insufficient information about new market/customer preferences 1.000 .893
Business was acquired by mistake 1.000 .637
Unware of market restrictions through legislations against foreign firms 1.000 .885
Need of services of professional consultants to help with the development of
the strategy plan 1.000 .921
Unable to build sufficient synergy for profitable growth 1.000 .795

159
Appendix G18 - Total variance explained by components
created for section E 9 (diversification barrier)
Component
Initial Eigenvalues Extraction Sums of
Squared Loadings
Rotation Sums of Squared
Loadings
Total % of
Variance
Cumulative
% Total
% of
Variance
Cumulative
% Total
% of
Variance
Cumulative
%
1 4.907 40.888 40.888 4.907 40.888 40.888 4.349 36.240 36.240
2 3.860 32.165 73.053 3.860 32.165 73.053 3.984 33.197 69.437
3 1.374 11.449 84.502 1.374 11.449 84.502 1.808 15.066 84.502
4 .767 6.393 90.896 - - - - - -
5 .695 5.795 96.690 - - - - - -
6 .262 2.180 98.870 - - - - - -
7 .136 1.130 100.000 - - - - - -

160
Appendix G19 - Initial component matrix for section E 9
(diversification barrier)
Variable Component
1 2 3
Too many periphical activities unrelated to main business .922 .127 -.038
Inadequate planning before diversification was implemented .907 .301 .177
There was not enough attention/investment to new business(es) .903 .283 .227
Management has poor knowledge of new business environment .782 .269 .245
Unable to build sufficient synergy for profitable growth .743 .409 .276
Business was acquired by mistake -.639 .289 .380
Insufficient information about new market/customer preferences -.346 .879 .023
Customers were reluctant to try out new products -.346 .879 .023
Lack of transferable knowledge/technology and skills -.387 .816 -.346
Stiff competition in the new market/product .204 .745 -.287
Unware of market restrictions through legislations against foreign firms -.469 .706 .407
Need of services of professional consultants to help with the development of
the strategy plan -.442 -.292 .800
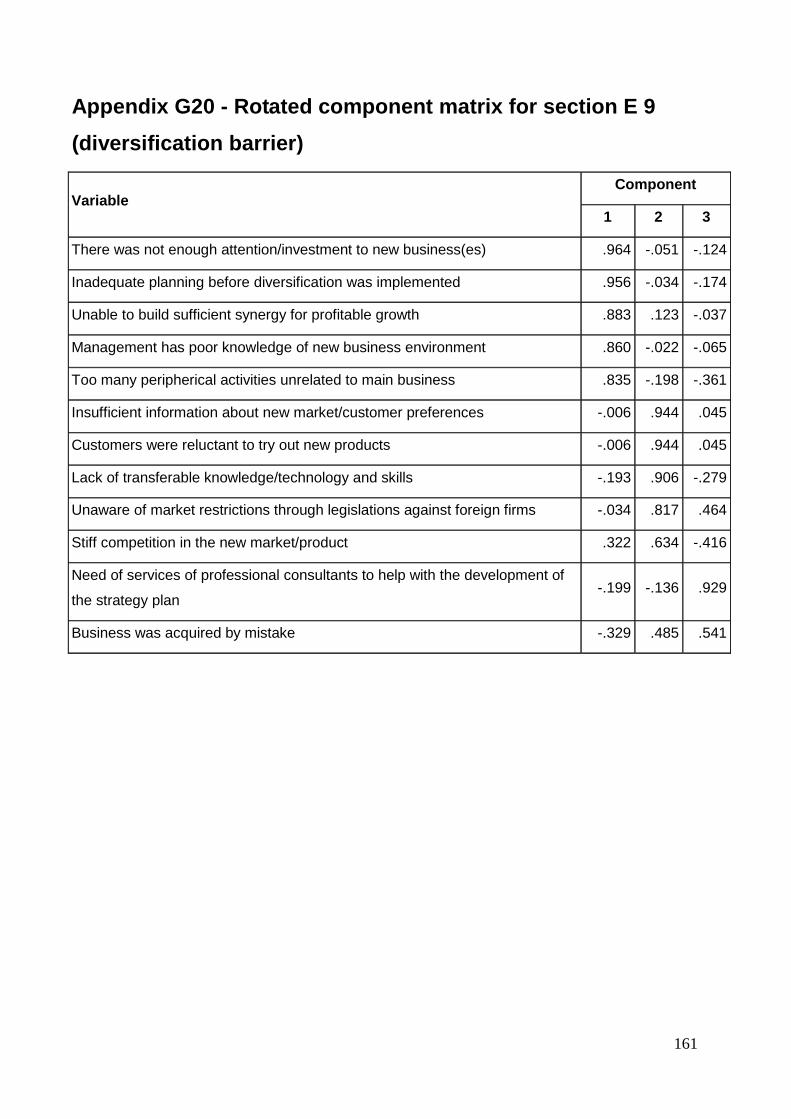
161
Appendix G20 - Rotated component matrix for section E 9
(diversification barrier)
Variable Component
1 2 3
There was not enough attention/investment to new business(es) .964 -.051 -.124
Inadequate planning before diversification was implemented .956 -.034 -.174
Unable to build sufficient synergy for profitable growth .883 .123 -.037
Management has poor knowledge of new business environment .860 -.022 -.065
Too many peripherical activities unrelated to main business .835 -.198 -.361
Insufficient information about new market/customer preferences -.006 .944 .045
Customers were reluctant to try out new products -.006 .944 .045
Lack of transferable knowledge/technology and skills -.193 .906 -.279
Unaware of market restrictions through legislations against foreign firms -.034 .817 .464
Stiff competition in the new market/product .322 .634 -.416
Need of services of professional consultants to help with the development of
the strategy plan -.199 -.136 .929
Business was acquired by mistake -.329 .485 .541
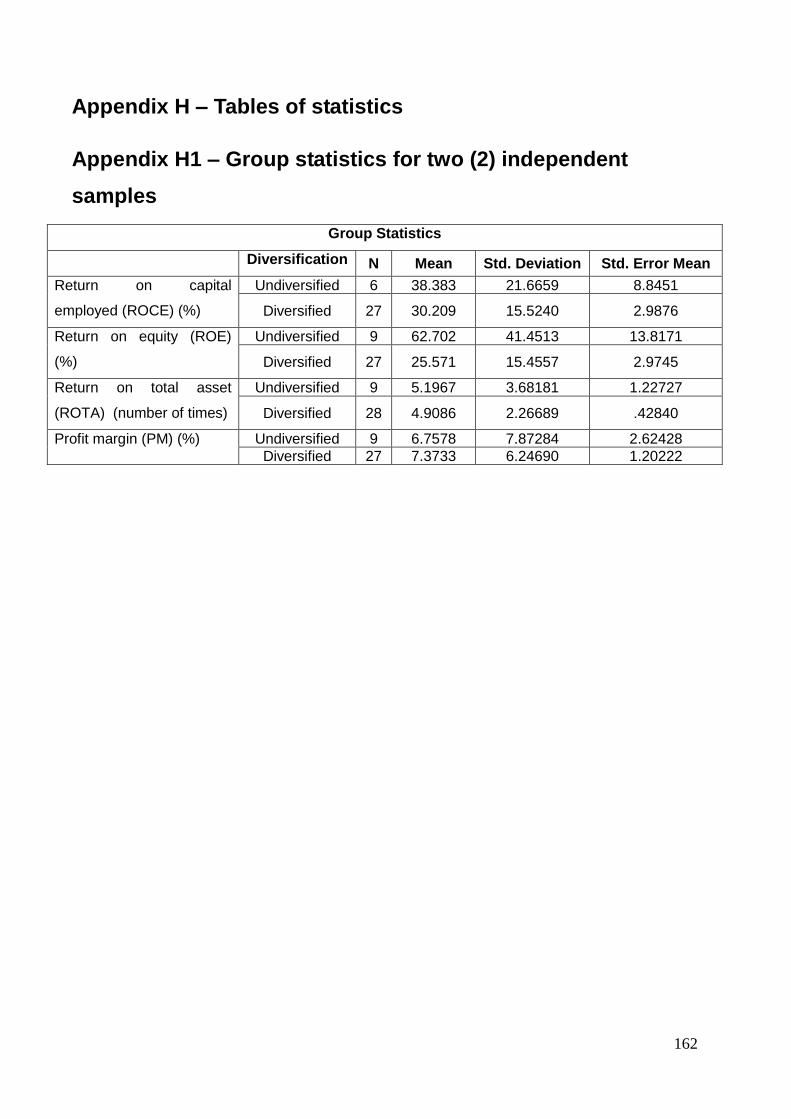
162
Appendix H – Tables of statistics
Appendix H1 – Group statistics for two (2) independent
samples
Group Statistics
Diversification N Mean Std. Deviation Std. Error Mean
Return on capital
employed (ROCE) (%)
Undiversified 6 38.383 21.6659 8.8451
Diversified 27 30.209 15.5240 2.9876
Return on equity (ROE)
(%)
Undiversified 9 62.702 41.4513 13.8171
Diversified 27 25.571 15.4557 2.9745
Return on total asset
(ROTA) (number of times)
Undiversified 9 5.1967 3.68181 1.22727
Diversified 28 4.9086 2.26689 .42840
Profit margin (PM) (%) Undiversified 9 6.7578 7.87284 2.62428
Diversified 27 7.3733 6.24690 1.20222

163
Appendix H2 – Group statistics for three (3) independent
samples
Group Statistics
Diversification N Mean Std. Deviation Std. Error Mean
Return on capital
employed (ROCE) (%)
Undiversified 6 38.383 21.6659 8.8451
Moderately diversified
12 36.978 13.7209 3.9609
Highly diversified
15 24.793 15.1310 3.9068
Return on equity (ROE)
(%)
Undiversified 9 62.702 41.4513 13.8171
Moderately diversified
12 31.019 15.5649 4.4932
Highly diversified
15 21.212 14.4042 3.7191
Return on total asset
(ROTA) (number of
times)
Undiversified 9 5.1967 3.68181 1.22727
Moderately diversified
13 6.2800 2.45050 0.67965
Highly diversified
15 3.7200 1.22610 0.31658
Profit margin (PM) (%) Undiversified 9 6.7578 7.87284 2.62428
Moderately diversified
12 6.5542 2.05601 0.59352
Highly diversified
15 8.0287 8.25325 2.13098
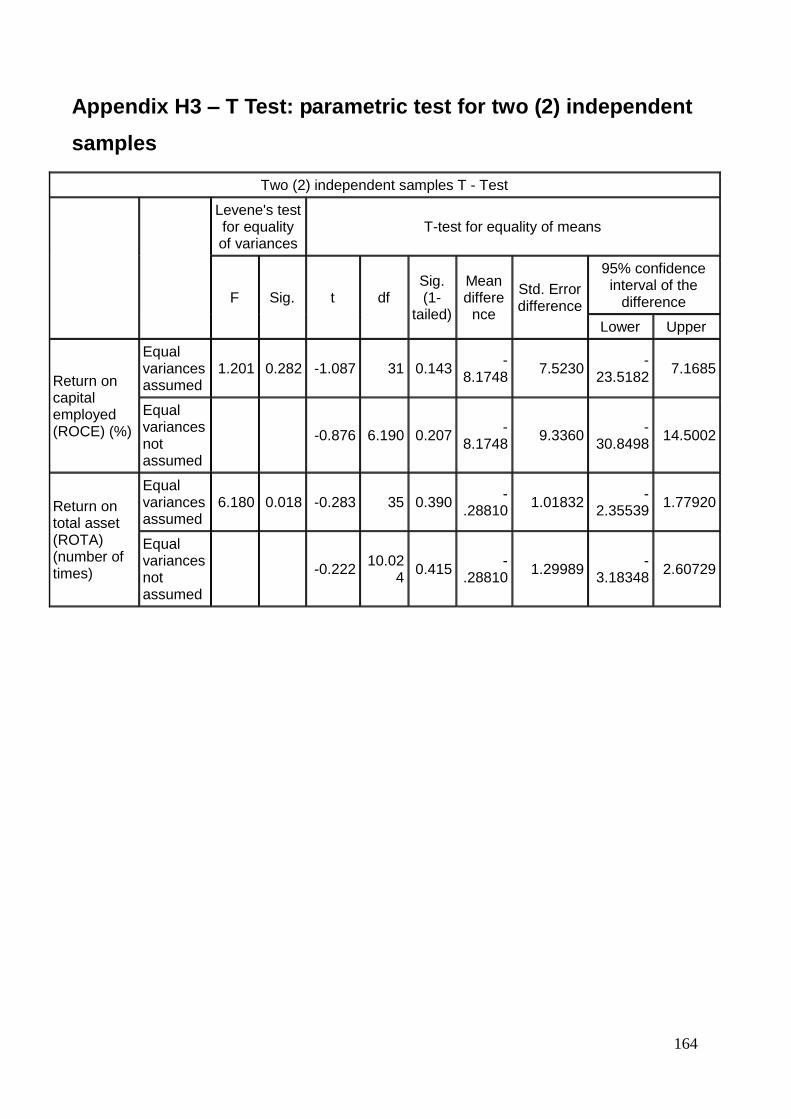
164
Appendix H3 – T Test: parametric test for two (2) independent
samples
Two (2) independent samples T - Test
Levene's test for equality of variances
T-test for equality of means
F Sig. t df Sig. (1-
tailed)
Mean differe
nce
Std. Error difference
95% confidence interval of the
difference
Lower Upper
Return on capital employed (ROCE) (%)
Equal variances assumed
1.201 0.282 -1.087 31 0.143 -
8.1748 7.5230
-23.5182
7.1685
Equal variances not assumed
-0.876 6.190 0.207 -
8.1748 9.3360
-30.8498
14.5002
Return on total asset (ROTA) (number of times)
Equal variances assumed
6.180 0.018 -0.283 35 0.390 -
.28810 1.01832
-2.35539
1.77920
Equal variances not assumed
-0.222 10.02
4 0.415
-.28810
1.29989 -
3.18348 2.60729

165
Appendix H4 – Sum of Ranks
Diversification N Mean Rank Sum of Ranks
Return on equity (ROE) (%)
Undiversified 9 26.89 242.00
Diversified 27 15.70 424.00
Total 36
Profit margin (PM)
Undiversified 9 16.11 145.00
Diversified 27 19.30 521.00
Total 36

166
Appendix H5 – Mann-Whitney: non parametric test of two
independent samples
Test Statistics
Return on equity (ROE) (%) Profit margin (PM)
Mann-Whitney U 46.000 100.000
Wilcoxon W 424.000 145.000
Z -2.758 -.786
Sig. (1-tailed) 0.003 0.216

167
Appendix H6 - One way analysis of variance (ANOVA):
parametric test for three independent samples
Descriptive
N Mean Std.
Deviation Std. Error
95% Confidence Interval for
Mean Minimum Maximum
Lower Bound
Upper Bound
Return on capital employed (ROCE) (%)
Undiversified 6 38.383 21.6659 8.8451 15.646 61.120 11.6 68.8
Moderately diversified
12 36.978 13.7209 3.9609 28.260 45.695 21.1 65.2
Highly diversified
15 24.793 15.1310 3.9068 16.414 33.173 11.9 73.8
Total 33 31.695 16.7154 2.9098 25.768 37.622 11.6 73.8
Return on total asset (ROTA) (number of times)
Undiversified 9 5.1967 3.68181 1.22727 2.3666 8.0268 .36 9.76
Moderately diversified
13 6.2800 2.45050 .67965 4.7992 7.7608 3.44 11.71
Highly diversified
15 3.7200 1.22610 .31658 3.0410 4.3990 2.01 5.91
Total 37 4.9786 2.62339 .43128 4.1040 5.8533 .36 11.71

168
Appendix H7 – Result of test of homogeneity of variances
Test of homogeneity of variances
Levene statistic df1 df2 Sig.
Return on capital employed (ROCE) (%) 1.025 2 30 .371
Return on total asset (ROTA) (number of times) 6.839 2 34 .003

169
Appendix H8 – Result of analysis of variance
ANOVA
Sum of Squares
df Mean
Square F Sig.
Return on capital employed (ROCE) (%)
Between Groups
1317.756 2 658.878 2.593 .091
Within Groups 7623.232 30 254.108
Total 8940.988 32
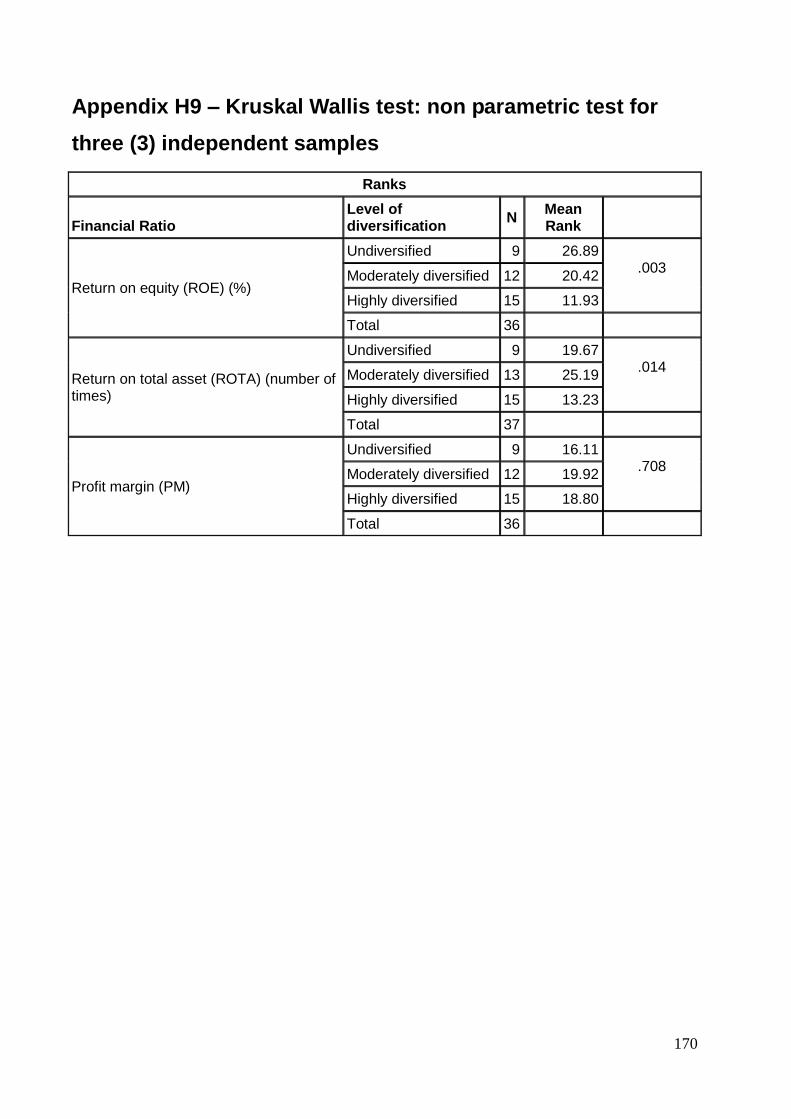
170
Appendix H9 – Kruskal Wallis test: non parametric test for
three (3) independent samples
Ranks
Financial Ratio
Level of diversification
N Mean Rank
Return on equity (ROE) (%)
Undiversified 9 26.89 .003
Moderately diversified 12 20.42
Highly diversified 15 11.93
Total 36
Return on total asset (ROTA) (number of times)
Undiversified 9 19.67 .014
Moderately diversified 13 25.19
Highly diversified 15 13.23
Total 37
Profit margin (PM)
Undiversified 9 16.11 .708
Moderately diversified 12 19.92
Highly diversified 15 18.80
Total 36