investigation of gpx1 in chondrogenesis and its …...drift, thus also lacking a contribution of the...
TRANSCRIPT

AUS DEM LEHRSTUHL
FÜR KIEFERORTHOPÄDIE
PROF. DR. DR. P. PROFF
DER FAKULTÄT FÜR MEDIZIN
DER UNIVERSITÄT REGENSBURG
Investigation of Gpx1 in chondrogenesis and its role on redox regulation in
chondrocytes
Inaugural – Dissertation
zur Erlangung des Doktorgrades
der Zahnmedizin
der
Fakultät für Medizin
der Universität Regensburg
vorgelegt von
Vasiliki Koretsi
2015

- 1 -
AUS DEM LEHRSTUHL
FÜR KIEFERORTHOPÄDIE
PROF. DR. DR. P. PROFF
DER FAKULTÄT FÜR MEDIZIN
DER UNIVERSITÄT REGENSBURG
Investigation of Gpx1 in chondrogenesis and its role on redox regulation in
chondrocytes
Inaugural – Dissertation
zur Erlangung des Doktorgrades
der Zahnmedizin
der
Fakultät für Medizin
der Universität Regensburg
vorgelegt von
Vasiliki Koretsi
2015

- 2 -
Dekan: Prof. Dr. Dr. Torsten Reichert
1. Berichterstatter: Prof. Dr. Dr. Peter Proff
2. Berichterstatter: Prof. Dr. Michael Behr
Tag der mündlichen Prüfung: 05.07.2016
- 3 -
Table of contents
1. Statement of the problem and objectives 5
2. Review of the literature 6
2.1. The cranial base 6
2.1.1. Developmental and anatomical aspects 6
2.1.2. The growth of the cranial base and its implications in facial shape 8
2.1.3. Angulation of cranial base and occlusal type 12
2.2. The process of endochondral ossification 13
2.2.1. Early differentiation of chondrocytes 13
2.2.2. Terminal differentiation of chondrocytes and endochondral ossification 17
2.3. The role of reactive oxygen species and antioxidants on endochondral
ossification 19
2.4. Glutathione peroxidase 1 22
3. Materials and methods 24
3.1. Materials 24
3.2. Methods 33
3.2.1. Culture conditions 33
3.2.2. Isolation of RNA 35
3.2.3. Reverse transcription 36
3.2.4. Quantitative Real Time-PCR 36
3.2.5. Stains 39
3.2.6. Immunohistochemistry 39
3.2.7. Overexpression and silencing of Gpx1 41

- 4 -
3.2.8. Western blotting 43
3.2.9. Exposure to H2O2 and apoptosis assay 46
3.2.10. Statistical analysis 46
4. Results 48
4.1. Chondrogenic differentiation of the ATDC5 cell line 48
4.1.1. Stains 48
4.1.2. Expression of biological markers of chondrogenic differentiation 49
4.2. Expression pattern of Gpx1 in vitro 50
4.3. Localization of Gpx1 expression at the spheno-occipital synchondrosis 51
4.4. Apoptosis assay after exogenous exposure to H2O2 53
5. Discussion 55
5.1. Expression of Gpx1 during chondrogenic differentiation 55
5.2. Hypertrophic chondrocytes have the lowest Gpx1-immunoreactivity 57
5.3. Gpx1 plays a vital role on H2O2-induced apoptosis in chondrocytes 58
6. Summary 60
7. Zusammenfassung 62
8. References 64
List of figures
List of tables
List of abbreviations
Declaration of academic honesty / Eidesstattliche Erklärung
Acknowledgements
- 5 -
1. Statement of the problem and objectives
The development of cranial base exerts a great influence on the overall facial shape. In the
vertical plane, the inclination of the middle cranial fossa affects the position of the
nasomaxillary complex in relation to the mandible, thus; influencing the vertical growth of the
face. A hypodivergent growth pattern may be due to a forward-downward inclination of the
middle cranial fossa, whereas a hyperdivergent growth pattern may be a resultant of
posterosuperior inclination of it. Sagittally, Class II skeletal malocclusion is often
characterized by one or more of the following: an elongated posterior cranial fossa, a forward
and downward position of it, a short composite of ramus and the vertical dimension of
posterior cranial fossa, and a more open cranial base flexure. By contrast, Class III skeletal
malocclusions often demonstrate a size reduction in the posterior cranial base, a backward
alignment of it, a long composite of ramus and the vertical dimension of the posterior cranial
fossa, and a relative acute cranial base angle (Enlow and Hans, 1996; Premkumar, 2011).
The process of endochondral ossification characterizes both the development and growth of
the cranial base. It is the mechanism by which the cranial base develops from the
chondrocranium to the basicranium and also grows at the midline axis postnatally. The
midline axis of the cranial base is the region where all the synchondroses are located. It
contributes significantly both to elongation and angulation of the cranial base (Sperber, 1989;
Proffit et al., 2007). The process of endochondral ossification has been studied extensively.
However, it was not until recently that the fundamental role of reactive oxygen species (ROS)
was revealed and documented. In particular, hydrogen peroxide (H2O2) causes inhibition of
proliferating chondrocytes and is required for the normal differentiation of proliferating to
hypertrophic chondrocytes (Morita et al., 2007).
The antioxidant enzyme glutathione peroxidase 1 (Gpx1) can efficiently reduce H2O2 (Mills,
1957). Provided that no previous research has been undertaken to elucidate the role of Gpx1
on chondrogenic differentiation, the objectives of this study (Koretsi et al., 2015) were:
Observation and definition of the temporal expression pattern of Gpx1 during
chondrogenic differentiation in vitro.
Identification of Gpx1 expression according to the different stages of chondrogenic
differentiation.

- 6 -
Determination of Gpx1 as an antioxidant enzyme capable of regulating redox state in
chondrocytes.
2. Review of the literature
2.1. The cranial base
Cranial base is the oldest part of the human skull phylogenetically. It is an integrative
component of the skull that serves several functions (Enlow, 1968; Stark, 1975; Knußmann,
1988; Sperber, 2001). It serves as a platform, upon which the brain grows, and provides a
thrust for the anterior growth of the facial skeleton. In addition, the cranial base connects the
cranium with the rest of the body (articulation with the vertebral column, maxillary region
and the mandible, provision of conduits for all the vital neural and circulatory connections,
formation of the roof of the nasopharynx) (Premkumar, 2011).
2.1.1. Developmental and anatomical aspects
The human cranial base first appears in the second month of embryonic life as an irregular
cartilaginous shape, the chondrocranium. The chondrocranium develops as condensations of
the neural crest cells and paraxial mesoderm in the ectomeninx (Sperber, 1989). Nine groups
of paired cartilaginous precursors are subsequently formed by the growth and differentiation
of the ectomeninx (Kjaer, 1990; Fig. 1).
The cartilaginous precursors anterior to the notochord derive solely from segmented neural
crest tissue, similar to other facial bones; while the posterior precursors derive from
segmented mesodermal tissue. By this means, the middle of the sphenoid body marks the
division between the anterior and posterior portions of the cranial base, which have distinct
embryologic origins; the anterior cranial base stemming from the neural crest and the
posterior from the paraxial mesoderm (Noden, 1991; Couly et al., 1993; Le Douarin et al.,
1993).
- 7 -
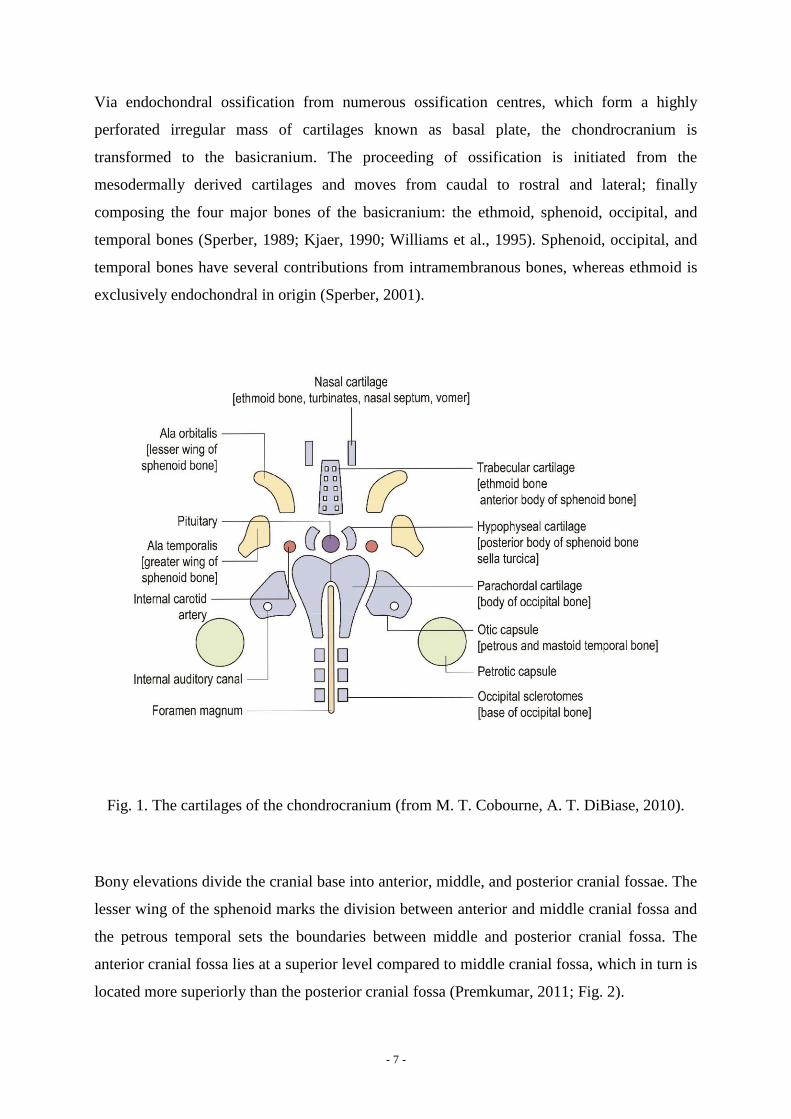
Via endochondral ossification from numerous ossification centres, which form a highly
perforated irregular mass of cartilages known as basal plate, the chondrocranium is
transformed to the basicranium. The proceeding of ossification is initiated from the
mesodermally derived cartilages and moves from caudal to rostral and lateral; finally
composing the four major bones of the basicranium: the ethmoid, sphenoid, occipital, and
temporal bones (Sperber, 1989; Kjaer, 1990; Williams et al., 1995). Sphenoid, occipital, and
temporal bones have several contributions from intramembranous bones, whereas ethmoid is
exclusively endochondral in origin (Sperber, 2001).
Fig. 1. The cartilages of the chondrocranium (from M. T. Cobourne, A. T. DiBiase, 2010).
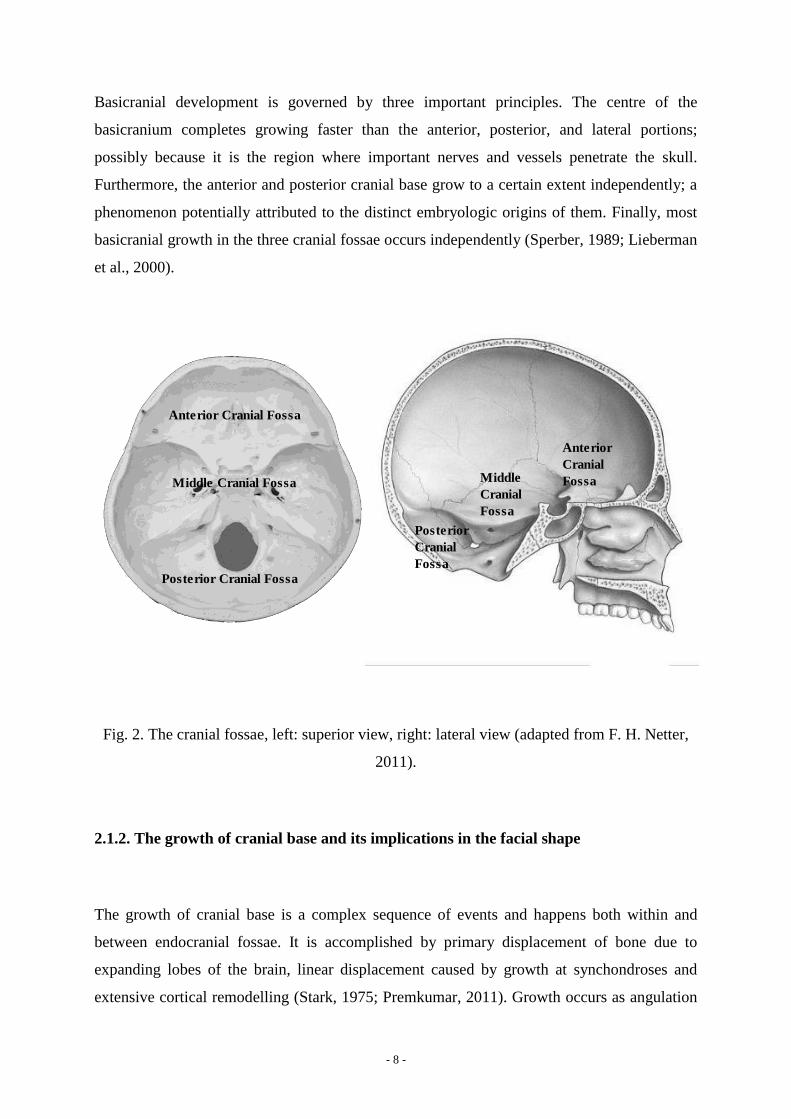
Bony elevations divide the cranial base into anterior, middle, and posterior cranial fossae. The
lesser wing of the sphenoid marks the division between anterior and middle cranial fossa and
the petrous temporal sets the boundaries between middle and posterior cranial fossa. The
anterior cranial fossa lies at a superior level compared to middle cranial fossa, which in turn is
located more superiorly than the posterior cranial fossa (Premkumar, 2011; Fig. 2).
- 8 -
Basicranial development is governed by three important principles. The centre of the
basicranium completes growing faster than the anterior, posterior, and lateral portions;
possibly because it is the region where important nerves and vessels penetrate the skull.
Furthermore, the anterior and posterior cranial base grow to a certain extent independently; a
phenomenon potentially attributed to the distinct embryologic origins of them. Finally, most
basicranial growth in the three cranial fossae occurs independently (Sperber, 1989; Lieberman
et al., 2000).
Posterior
Cranial
Fossa
Middle
Cranial
Fossa
Anterior
Cranial
Fossa
Anterior Cranial Fossa
Middle Cranial Fossa
Posterior Cranial Fossa
Fig. 2. The cranial fossae, left: superior view, right: lateral view (adapted from F. H. Netter,
2011).
2.1.2. The growth of cranial base and its implications in the facial shape
The growth of cranial base is a complex sequence of events and happens both within and
between endocranial fossae. It is accomplished by primary displacement of bone due to
expanding lobes of the brain, linear displacement caused by growth at synchondroses and
extensive cortical remodelling (Stark, 1975; Premkumar, 2011). Growth occurs as angulation
- 9 -
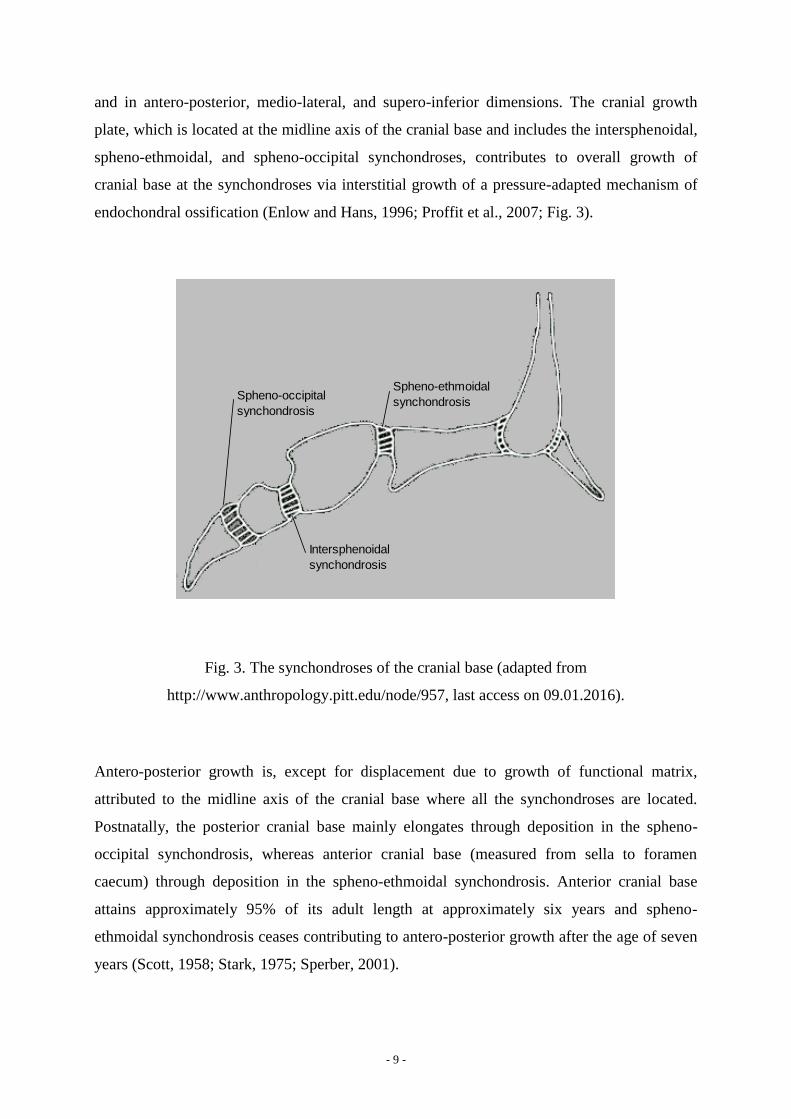
and in antero-posterior, medio-lateral, and supero-inferior dimensions. The cranial growth
plate, which is located at the midline axis of the cranial base and includes the intersphenoidal,
spheno-ethmoidal, and spheno-occipital synchondroses, contributes to overall growth of
cranial base at the synchondroses via interstitial growth of a pressure-adapted mechanism of
endochondral ossification (Enlow and Hans, 1996; Proffit et al., 2007; Fig. 3).
Spheno-occipital
synchondrosis
Spheno-ethmoidal
synchondrosis
Intersphenoidal
synchondrosis
Fig. 3. The synchondroses of the cranial base (adapted from
http://www.anthropology.pitt.edu/node/957, last access on 09.01.2016).
Antero-posterior growth is, except for displacement due to growth of functional matrix,
attributed to the midline axis of the cranial base where all the synchondroses are located.
Postnatally, the posterior cranial base mainly elongates through deposition in the spheno-
occipital synchondrosis, whereas anterior cranial base (measured from sella to foramen
caecum) through deposition in the spheno-ethmoidal synchondrosis. Anterior cranial base
attains approximately 95% of its adult length at approximately six years and spheno-
ethmoidal synchondrosis ceases contributing to antero-posterior growth after the age of seven
years (Scott, 1958; Stark, 1975; Sperber, 2001).
- 10 -
Medio-lateral growth is not attributed to the cranial growth plate, instead it happens primarily
through drift and intramembranous bone growth in sutures with regard to anterior and
posterior cranial fossae and through lateral drift of the squamous portions of the sphenoid
with regard to the middle cranial fossa. Furthermore, supero-inferior growth occurs through
drift, thus also lacking a contribution of the cranial growth plate to growth (Sperber, 1989).
Angulation of cranial base is a unique characteristic of humans and happens as an aftermath
of bone or cartilage deposition in the midline axis of the cranial base that changes the angle
between intersecting anterior and posterior cranial base. This causes the inferior cranial base
angle to become more acute (flexion) or more obtuse (extension) (Lieberman et al., 2000).
Cranial base angulation is a resultant of different growth processes at different locations of the
cranial base.
All the synchondroses of the cranial base play, among others, a role on angulation of the
cranial base via interstitial growth (Bjork, 1955; Scott, 1958; Giles et al., 1981; Enlow, 1990).
The prenatal involvement of them in flexion or extension lies on the decreased chondrogenic
activity in the inferior vs. superior part of the synchondrosis causing flexion, whereas
extension results from a decreased chondrogenic activity in the superior compared to inferior
part of the synchondrosis (Hofer, 1960; Hofer and Spatz, 1963; Stark, 1975; Diewert, 1985
Anagastopolou et al., 1988; Sperber, 1989). However, only the spheno-occipital
synchondrosis seems to play an important role on cranial base angulation postnatally. It
remains an active site until the age of 20 years, while spheno-ethmoidal fuses at six to eight
years and intersphenoidal prior to birth (Bjork, 1955; Scott, 1958; Premkumar, 2011).
The fact that cranial base is not flat causes the foramen magnum to have a relatively more
anterior position and ventral orientation, which in turn reduces the lever arm between the
centre of mass of the head and the atlanto-occipital joint, thereby the magnitude of the force
required to hold up the head is reduced (Schultz, 1942). The flexure of human cranial base; it
demonstrates an angulation of 65 ° at clivus, between the middle and posterior cranial fossa,
contributes to the orthograde posture of man, redirection of the face from forward to
downward direction, and anterior and inferior movement of the middle face (Premkumar,
2011).
According to Enlow’s (Enlow and Hans, 1996) counterpart principle of craniofacial growth,
there are regional relationships throughout the whole face and cranium, which consist of
anatomical parts that are directly related to their specific anatomical counterparts. If both parts
- 11 -
and their corresponding counterparts enlarge to the same extent, then balanced growth
between them is the result. Imbalances are caused by differences in the amount or direction of
growth between parts and their particular counterparts. The upper part of the nasomaxillary
complex, the anterior cranial fossa, the palate, and the mandibular corpus are considered by
Enlow (Enlow and Hans, 1996) to be the counterparts of bony maxillary arch, while the
ramus of the mandible is the structural counterpart of the middle cranial fossa.
Anterior cranial fossa comprises the orbital plates of frontal bone and crista galli. After eight
years of age, its lengthening is directly due to growth of functional matrix (Premkumar,
2011). The upper face shares same bony elements with the anterior cranial base resulting in a
high degree of integration between these two regions. It seems that anterior cranial base
affects the orientation of the upper face directly, but that it only not immediately affects palate
orientation through the integration of palate and orbits (Lieberman et al., 2000).
The middle cranial fossa and the ethmomaxillary complex, although they do not demonstrate
as tight anatomical relationship as this of anterior cranial base and upper face, interact in a
way that the shape of the former seems to influence not only the orientation of the posterior
border of the later but also its location in relation to the rest of the cranial base (Hoyte, 1991).
Expansion of the middle cranial fossa due to growth of temporal lobe has a secondary
displacement effect on anterior cranial fossa, ethmomaxillary complex, and mandible.
Because of the position of posterior border of maxillary complex at the intersection between
the anterior and middle cranial fossae, the growth of middle cranial fossa displaces forward
the anterior cranial fossa and the ethmomaxillary complex suspended beneath it (Enlow and
Hans, 1996; Premkumar, 2011). The forward displacement of the mandible is less than this of
anterior cranial fossa and ethmomaxillary complex because most of the growth of the middle
cranial fossa occurs anterior to mandibular condyles. Additionally, according to Enlow’s
(Enlow and Hans, 1996) counterpart principle of growth the ramus of the mandible elongates
in a matched way to the elongation of the middle cranial fossa resulting in placing the
mandibular arch in a more anterior position.
Posterior cranial fossa through the inclination of clivus, where the spheno-occipital
synchondrosis is located, is responsible for the anterior and forward growth of the cranial
base. Among others, growth of spheno-occipital synchondrosis results in an anterior and
inferior displacement through the lengthening of clivus, which orients the nasomaxillary
complex downward and forward. In turn, the downward and forward orientation of
- 12 -
nasomaxillary complex affects the vertical dimensions of the middle and lower face
(Premkumar, 2011).
2.1.3. Angulation of cranial base and occlusal type
Because of its position, cranial base is difficult to be directly measured. In orthodontics,
cranial base is traditionally measured through lateral cephalometric radiographs. A commonly
used measurement is the angle nasion-sella-basion. Nasion however is not a satisfactory point
because of its position outside the limits of the cranial base and the change in its position with
age (Scott, 1958). Alternatively, nasion can be replaced with the foramen caecum or the
intersection of the orbital roof and the inner surface of the frontal bone (Lieberman and
McCarthy, 1999). Posteriorly, basion is often replaced by articulare and Bolton points
(Dhopatkar et al., 2002).
There is an abundance of studies supporting the relationship between cranial base angulation
and type of malocclusion. In studies comparing Class II and Class III not only with Class I but
also with each other, a progressive increase was found in cranial base angulation from Class
III, via Class I, to Class II individuals (Hopkin et al., 1968; Dibbets, 1996). Furthermore,
studies comparing Class II with Class I individuals reported a larger cranial base angulation in
Class II than Class I individuals (Anderson and Popovich, 1983; Bacon et al., 1992). This
feature was found to be related with the prepubertal developmental stage (Kerr and Hirst,
1987; Franchi et al., 2007). As far as Class III malocclusion is concerned, the basicranial
angulation was reported more decreased in Class III sample compared with a mixed Class I
and II control sample (Proff et al., 2008). Moreover, compared with Class I, Class III
malocclusion showed a more prominent cranial base flexure (Mouakeh, 2001; Chang et al.,
2005). The alteration in basicranial angulation in Class III malocclusion was related with
changes occurring in posterior leg of the cranial base (Chang et al., 2005; Proff et al., 2008),
supporting the theory of deficient orthocephalization (Singh et al., 1997).
- 13 -
2.2. The process of endochondral ossification
Endochondral ossification is a mechanism of bone formation defined by the presence of a pre-
existing hyaline cartilaginous model of the developing bone. Endochondral ossification is
distinguished from intramembranous ossification because of the presence of a hyaline
cartilaginous model and the simultaneous presence of cartilage and bone during the
ossification process (Henrikson et al., 1997).
2.2.1. Early differentiation of chondrocytes
Chondrogenesis is the process of producing cartilage intermediate that induces endochondral
ossification during skeletal development. It includes distinct stages and is initiated by the
mesenchymal cell recruitment, migration, proliferation, and condensation. Commitment of
mesenchymal cells is strongly dependent on their interactions with the overlying epithelium,
which activates signalling pathways and transcription factors (Olsen et al., 2000). Before
mesenchymal cells condensate, they produce extracellular matrix containing hyaluronan,
collagen type I and IIA (Goldring et al., 2006). Collagen type IIA belongs to non-cartilage
collagens, as it is expressed not only by chondroprogenitor cells but somites or epithelial cells
as well (Sandell et al., 1994; Fig. 4).
Precartilaginous condensations of chondroprogenitor cells are characterised by increased cell
adhesion and formation of gap junctions, and changes in the cytoskeleton (Goldring et al.,
2006). An escalation in hyaluronidase activity together with the appearance of cell adhesion
molecules, N-cadherin and neural cell adhesion molecule (N-CAM), are evident during this
phase. Transforming growth factor (TGF-β), which is an early signal of condensation, triggers
the production of fibronectin. The connection of Syndecan to fibronectin reduces N-CAM
secretion, thus drawing the boundaries of the condensation (Goldring et al., 2006).
The transition of chondroprogenitors to chondrocytes is commenced by intracellular
signalling pathways such as fibroblast growth factors (FGFs), hedgehog , bone morphogenetic
proteins (BMPs), and Wnt. Wnt signals are required to induce the production of FGFs, which
act in positive feedback loops (Niswander, 2003). The homeodomain (Hox) transcription
factors coordinate proliferation of cells within the condensations and they are required for the

- 14 -
FGF-8 and sonic hedgehog (Shh) expression (Goldring et al., 2006). BMPs are vital not only
for the formation of precartilaginous condensations but also for the differentiation of
chondroprogenitors into chondrocytes (Yoon and Lyons, 2004).
Fig. 4. Early and terminal chondrogenic differentiation. Growth factors and signalling for
each differentiation stage are presented on the left and biological markers on the right; MSCs:
mesenchymal stem cells (from S. Grassel, N. Ahmed, 2007).
During the differentiation of chondroprogenitors to chondrocytes, BMPs signalling induces
the expression of Sox proteins (Yoon et al., 2005). The Sox9 transcription factor is co-
expressed with two additional Sox family members and is needed for the collagen II gene to
be expressed along with other cartilage-specific matrix proteins (Ng et al., 1997; Lefebvre et
al., 2001). BMPs not only induce the expression of various transcription factors but via
activation of TGF-β activated kinase 1 (Tak1) can trigger the p38 and JNK cascades (Yoon
and Lyons, 2004). The stimulation of chondrogenic cellular condensation is provoked by the

- 15 -
p38 pathway and followed by cartilage nodule formation (Nakamura et al., 1999). During this
stage, chondrocytes produce collagens II, IX and XI, and aggrecan.
Subsequently, the differentiated chondrocytes begin to proliferate and form the proliferating
zones. Proliferative zones are characterized by the existence of pairs of chondrocytes in a
single lacuna within the cartilage matrix (Mackie et al., 2011). Proliferative chondrocytes
subsequently separate from each other by an escalation in their secretion activity that features
the following late hypertrophic stage (Mackie et al., 2011). The structure of synchondroses is
bipolar: a central layer of small cartilaginous cells, with proliferative zone, hypertrophic zone,
and zone of endochondral ossification on either side (Premkumar, 2011; Fig. 5).
Bone marrow
Trabecular bone
Invading blood vessels
Hypertrophic zone
Proliferating zone
Proliferating zone
Hypertrophic zone
Resting zone
Fig. 5. The bipolar structure of the spheno-occipital synchondrosis of a rat stained with
Movat's pentachrome staining, Magn. ×100 (from V. Koretsi et al., 2015).
The systemic regulator growth hormone (GH) stimulates the secretion of insulin-like growth
factor 1 (IGF1) and the GH/IGF1 axis plays a key role on promoting chondrocyte
proliferation (Nilsson et al., 2005; Pass et al., 2009). Locally, the binding of Wnt family
proteins to their receptor can activate either the canonical Wnt signalling pathway or the non-
canonical one. The former involves the accumulation of β-catenin, a cytoplasmic protein that
- 16 -
functions in cell to cell adhesion by interacting with cadherins, whereas the latter the
degradation of β-catenin. At this stage, Wnt signalling pathways stimulate chondrocyte
proliferation (Akiyama et al., 2004; Andrade et al., 2007).
Indian hedgehog (Ihh) is required for normal chondrocyte proliferation throughout the growth
plate during both embryonic and postnatal growth and secreted by prehypertrophic
chondrocytes, a transitional phenotype between proliferation and hypertrophy (St-Jacques et
al., 1999; Koyama et al., 2007; Maeda et al., 2007). Additionally, Ihh represses the onset of
hypertrophic differentiation by activation of parathyroid hormone-related peptide (PTHrP)
expression, thus maintaining chondrocytes in the proliferative stage (Vortkamp et al., 1996).
The Gli family of transcriptional factors plays an essential role on regulating responses of
chondrocytes to Ihh (Wuelling and Vortkamp, 2010). These responses rely upon the unique
contributions of primary cilia (Koyama et al., 2007). Ihh, through PTHrP, prevents premature
differentiation into prehypertrophic and hypertrophic phenotypes and define the number of
cells that will exit the proliferative phase and differentiate further accordingly proceeding to
the endochondral ossification pathway (Kobayashi et al., 2005).
FGFs acting through FGF receptor 3 (FGFR3), a tyrosine kinase receptor, serve as inhibitors
of the proliferation of chondrocytes and stimulate factors of chondrocyte hypertrophy (Minina
et al., 2002; Yoon et al., 2006). FGFR3 signalling can also restrain Ihh expression (Liu et al.,
2002). FGFs activity is modulated by glycosaminoglycans and desulphation of
glycosaminoglycans appears to limit the FGFs-induced repression of chondrocyte
proliferation (Ornitz, 2005; Chuang et al., 2010). Contrary, binding of BMPs to their receptors
leads to stimulation of chondrocyte proliferation and inhibition of hypertrophic
differentiation. BMPs also induce the secretion of Ihh and reversely Ihh induces the secretion
of various BMPs, but their interaction is not in an absolute dependent manner (Minina et al.,
2001). The rate of proliferation is determined by the balance of signalling between BMPs and
FGFs, which also conform the sequential transition to the hypertrophic phenotype with the
proliferation rate (Minina et al., 2002).
The cartilage matrix principally consists of aggrecan and hyaluronan arranged in the fibrillar
network of collagen type II, which serves as the framework for the tissue. The collagenous
network provides tensile strength, while the proteoglycans contribute to the elastic properties
of the tissue (Gentili and Cancedda, 2009). Cartilage matrix also involves other types of
collagen to a lesser extent and other non-collagenous matrix proteins. All the components of

- 17 -
the cartilage matrix build an intricate network of interacting molecules, thus regulating the
behaviour of chondrocytes (Heinegard, 2009). Numerous factors, such as IGF1, BMPs or
TGF-β, stimulate expression and secretion of the components of the extracellular matrix, yet
the role of the transcription factor Sox9 is definitely critical (Ng et al., 1997; Lefebvre et al.,
2001; Yoon et al., 2005).
2.2.2. Terminal differentiation of chondrocytes and endochondral ossification
The process of endochondral ossification involves the terminal differentiation of chondrocytes
to the hypertrophic phenotype, calcification of the cartilage matrix, vascular invasion, and
finally ossification (Goldring et al., 2006; Fig. 4). In order to undergo hypertrophy,
chondrocytes have to increase their cellular fluid volume by almost 20 times. They then stop
dividing and they create hypertrophic zones, in which they are arranged in multicellular
clusters, often forming a columnar structure (Mackie et al., 2011). Hypertrophic chondrocytes
are present in two forms depending on their appearance: light and dark cells (Anderson, 1964;
Ahmed et al., 2007).
Hypertrophic chondrocytes begin to alter the cartilage matrix and this is abetted by a shift in
their secretion activity. A specific biological marker of this stage include collagen type X, a
non-fibrillar collagen type, and this is accompanied by the secretion of alkaline phosphatase
(ALP), matrix metalloproteinases (MMPs), and vascular endothelial growth factors (VEGFs)
(Colnot and Helms, 2001; Inada et al., 2004). MMPs degrade collagen type II, which is
downregulated during hypertrophy (Ortega et al., 2004). VEGFs promote the vascular
invasion, which is needed in order the cartilage to be replaced by bone (Colnot and Helms,
2001; Colnot et al., 2004).
The critical transition of chondrocytes to the hypertrophic phenotype is regulated by systemic
factors, such as thyroid hormones, as well (Shao et al., 2006; Wang et al., 2007). The
canonical Wnt signalling pathway (Enomoto-Iwamoto et al., 2002; Chen et al., 2008), IGF1
(Wang et al., 2010) and FGFR3 (Minina et al., 2002; Ornitz, 2005) appear to be mediators of
the triiodothyronine hormone (T3)-induced chondrocyte hypertrophy. Furthermore, thyroid
hormones abolish expression of PTHrP and PTHrP-R, which could be another either direct or
indirect way for facilitating chondrocyte hypertrophy (Stevens et al., 2000).

- 18 -
Runx2 is a key transcription factor inducing hypertrophy (Otto et al., 1997; Enomoto et al.,
2000; Komori, 2005). As mentioned above, PTHrP is activated by Ihh and inhibits
hypertrophy of chondrocytes. PTHrP exerts its effects via suppression of expression of the
Runx2 transcriptional factor (Lefebvre and Smits, 2005) and probably by Sox9, which is
activated by PTHrP and indirectly reduces Runx2 expression (Huang et al., 2000). Although
Ihh is considered to inhibit hypertrophy, it has been shown that in the absence of PTHrP, Ihh
appears to promote chondrocyte hypertrophy (Mak et al., 2008).
Late hypertrophic chondrocytes produce and release matrix vesicles that initiate mineral
deposition in skeletal tissues. They can qualitatively adjust the production of matrix vesicles
and release mineralization-competent matrix vesicles rich in annexin V and alkaline
phosphatase only when they are stimulated to induce mineralization (Kirsch et al., 1997;
Kirsch, 2006). PHOSPHO1 phosphatase and tissue non-specific alkaline phosphatase (TNAP)
both play a role on the mineralisation of cartilage matrix. PHOSPHO1 initiates mineralisation
within the matrix vesicle, while TNAP progresses the mineralisation outside the boundaries of
the matrix vesicle (Fedde et al., 1999; Anderson et al., 2004; Yadav et al., 2011).
The cartilage matrix remodelling and the angiogenesis induced by the activity of hypertrophic
chondrocytes change the environmental stress experienced by hypertrophic chondrocytes,
which eventually undergo physiological death (Goldring et al., 2006). Most hypertrophic
chondrocytes seem to undergo rapid death before the ossification front (Mackie et al., 2011).
Their rapid death is attributed to the apoptotic pathway, since features pertinent to apoptotic
cell death were identified. Further, the apoptogenic activity of some peptides of extracellular
matrix proteins was found to be powerful (Adams and Shapiro, 2002). Following apoptosis of
chondrocytes, the transverse septa of the cartilage matrix enclosing them are broken down,
prompting the invasion and differentiation of the cells that extend the ossification centre.
Many of the vertical septa are maintained as a scaffold for bone matrix deposition (Mackie et
al., 2011).
Endochondral ossification starts from all the corners of the synchondrosis (Premkumar,
2011). MMP13 and MMP9 work synergistically in a coordinated process to cleave the two
major components of the cartilage matrix, collagen type II and aggrecan (Stickens et al.,
2004); with cleaving of collagens being of superior importance compared to cleaving of
aggrecan in regard to the normal development of the growth plate (Little et al., 2005).

- 19 -
Vascular invasion takes place without preceding osteoclastic activity, since angiogenesis and
osteoclastogenesis were found to be dissociated in vivo (Deckers et al., 2002). A specialized
cell type called septoclast facilitates the invading capillaries by breaking down the terminal
transverse septum and providing the invasive path (Gartland et al., 2009). Osteoclasts are
responsible for cartilage matrix degradation promoting the invasion of bone marrow cells or
the deposition of bone matrix by osteoblasts (Mackie et al., 2008).
Factors produced by hypertrophic chondrocytes adjust the replacement of cartilage matrix by
bone to the preparation of growth plate for invasion. By this means, hypertrophic
chondrocytes regulate the behaviour of the invading cells. The chemoattractant high-mobility
group box 1 protein (HMGB1) produced by hypertrophic chondrocytes attracts endothelial
cells, osteoclasts, and osteoblasts (Taniguchi et al., 2007). Moreover, the receptor activator of
NFkB ligand (RANKL) is a factor also produced by hypertrophic chondrocytes and is
required for osteoclast invasion and differentiation (Kishimoto et al., 2006). RANKL
production by hypertrophic chondrocytes induces formation of osteoclasts through BMP2 and
Runx2 and could therefore regulate resorption of calcified matrix by osteoclasts (Usui et al.,
2008).
When the proliferative potential of chondrocytes at the growth plate is exhausted, growth
plate closure is initiated. Oestrogen acts indirectly by accelerating the programmed
senescence of the growth plate, thus exhausting the proliferative potential of chondrocytes.
Ossification of the growth plate then occurs as an aftermath (Weise et al. 2001).
2.3. The role of reactive oxygen species and antioxidants on endochondral ossification
Reactive oxygen species (ROS) are derivatives of aerobic metabolism and exposure to various
natural and synthetic toxicants. Failure of cellular mechanisms to cope with elevated ROS
levels can cause oxidative stress, which can lead to various deleterious phenomena, such as
apoptosis, inflammatory response or ischemia. The cellular armamentarium against such a
challenge includes multiple layers of antioxidant defences (Davies, 2000; Fig. 6).

- 20 -
Fig. 6. Redox regulation from antioxidant enzymes (from R. J. Aitken, S. D. Roman, 2008).
However, although ROS had been better studied in regard to their cytotoxic effects, their
semantic involvement in eukaryotic signal transduction is well established nowadays
(Sundaresan et al., 1995; Lander, 1997; Rhee, 1999; Rhee et al., 2000; Forman et al., 2004).
ROS are generally thought to act as signalling molecules through the following sequence of
events: (1) in response to various stimuli they can be generated on the surface of the cells or
within intracellular compartments of them, (2) after their entrance into the cytoplasm, they
can react with various proteins and modulate their function, (3) the changes in protein activity
induced by ROS define specific cellular responses, and (4) once the stimulus disappears, ROS
are degraded and the system returns to its original state (Hurd et al., 2012).
Hydrogen peroxide (H2O2) can trigger various biological responses. Biological responses
caused by H2O2 depend both on the cell type and the concentration of H2O2 within a cell
(Chen et al., 2005; Choi et al., 2005; Sablina et al., 2005). In other words, in order the same
biological response to be induced, different H2O2 levels are required among different types of
cells, and distinct biological responses can be induced in response to low compared with high
levels of H2O2 within a cell. Additionally, the detoxifying effect of antioxidant enzymes on

- 21 -
H2O2 seems to influence the biological response by controlling the local levels of H2O2
(Chang et al., 2004).
Thus, the role of antioxidant enzymes is of dual nature. It is not only restricted to the survival
of cells by preventing cellular damage caused by increased H2O2 levels but it is also extended
to the adjustment of biological response by regulating local H2O2 levels. In combination with
the regulatory action of antioxidant enzymes, H2O2 can trigger various biological responses
such as cell division, apoptosis, differentiation or migration (Sauer et al., 2000; Arnold et al.,
2001; Cai, 2005; Li et al., 2006; Ushio-Fukai, 2006).
The involvement of ROS in regulation of cellular processes, which are vital during
developmental stages, suggests that redox regulation is essential during development. Indeed,
ROS have been implicated in several developmental processes such as spermatogenesis,
oogenesis, and angiogenesis (Covarrubias et al., 2008). The effect of ROS on the process of
endochondral ossification needs further elucidation; however, there is recent evidence
supporting the crucial role of ROS during endochondral ossification.
In particular, Fragonas et al. (1998) tested the impact of ROS both on resting and
hypertrophic chondrocytes, the antioxidant activity of them and the ability of ROS to induce
the production of alkaline phosphatase-enriched matrix vesicles by hypertrophic
chondrocytes. The extent of cell damage due to ROS treatment was estimated from free LDH
activity as percent of total LDH activity of the culture. ROS promoted the damage of
approximately 25% of hypertrophic chondrocytes compared with approximately 46% damage
of resting chondrocytes. Catalase activity was higher in hypertrophic than resting
chondrocytes but superoxide dismutase (SOD) activity was less in hypertrophic compared
with resting chondrocytes. The phospholipid hydroperoxide glutathione peroxidase (Gpx4)
was identified at a higher level in resting rather than hypertrophic chondrocytes. Finally, the
release of matrix vesicles by hypertrophic chondrocytes demonstrated a significant increase
after the treatment of chondrocytes with ROS.
Morita et al. (2007) investigated the levels of ROS in hypertrophic chondrocytes, the effect of
ROS in chondrocyte differentiation process and the pathways activated by ROS during the
process. It was revealed that hypertrophic chondrocytes demonstrate high levels of ROS.
Furthermore, ROS initiated the inhibition of proliferating chondrocytes, while they stimulated
the differentiation of proliferating to hypertrophic chondrocytes. The induction of
- 22 -
differentiation from proliferating to hypertrophic chondrocytes involved the activation of
ERK and p38 MAPK pathways.
Kim et al. (2010) studied the contribution of several NADPH oxidases (Nox) as ROS
generating sources in chondrogenesis. It was found that Nox were essential for chondrocyte
differentiation as contributing to the elevation of intracellular ROS levels. Nox1 and Nox2
were increased during the time course of differentiation, whereas Nox4, although relative high
initially, was decreased afterwards. The depletion of both Nox2 and Nox4, but not Nox1,
resulted in a cessation of ROS generation and chondrocyte differentiation. Additionally, the
depletion of Nox2 and Nox4 induced apoptosis and inhibited the accumulation of
proteoglycans.
2.4. Glutathione peroxidase 1
Glutathione peroxidases (Gpxs) belong to the broad family of selenium- or cysteine-
containing proteins. Glutathione peroxidase 1 (Gpx1) was the first to be described in 1957, as
an enzyme that protects hemoglobin of erythrocytes from oxidative breakdown (Mills, 1957).
Later much more types of Gpxs were discovered not only in mammalian vertebrates, but in
non-mammalian vertebrates as well. Under the general term “glutathione peroxidases” is
considered to be a wide range of proteins that demonstrate sequence homology; such as Gpx1,
Gpx2, Gpx3, Gpx4, and Gpx5. Although selenium-containing Gpxs were detected in non-
mammalian vertebrates as well, the vast majority of Gpxs are cysteine-dependent in the
former form of life (Tosatto et al., 2008), whereas mammalian Gpxs contain selenocysteine,
which is the main form of selenium metabolism in vivo (Sun et al., 2011).
Gpx1 is a widely distributed intracellular protein; ubiquitously present in all tissues. It
functions both in cytosol and mitochondria and its expression is higher in cytosol (70%) than
in mitochondria (20-30%). It demonstrates a tetrameric structure with four identical subunits,
each of which containing one atom of selenium (Se) bound as selenocysteine (Sec) moiety at
the active site of the enzyme (Ursini and Maiorino, 2004; Rahman and Biswas, 2006). The
Sec moiety is surrounded by the Gln, Asn, and Trp residues forming the catalytic tetrad that is
conserved for Gpxs and normally located at the N-terminal end (Lu and Holmgren, 2009;
Flohé and Brigelius-Flohé, 2012).

- 23 -
Sec is the redox-active moiety (peroxidatic Sec, UP) because in catalysis undergoes
sequential conversions from reduced into oxidized form and then to a mixed selenodisulfide,
and finally to the reduced form again (Rocher et al., 1992; Kulinsky and Kolesnichenko,
2009). Oxidized and reduced substrates bind sequentially at the active site of Gpx1 in order
the general reactions to occur: 2GSH + H2O2 → GSSG + 2H2O and 2GSH + ROOH → GSSG
+ ROH + H2O (Kulinsky and Kolesnichenko, 2009; Fig. 7).
Fig. 7. Reduction cycle of Gpx1 (adapted from W. Dröge, 2002).
Specificity towards oxidized substrates for Gpx1 includes a wide range of organic
hydroperoxides, such as H2O2, almost all aliphatic and cyclic organic peroxides (ROOH),
polyunsaturated fatty acids, certain steroids, prostaglandin F2α (PGF2α), and prostaglandin
G2 (PGG2) (Kulinsky and Kolesnichenko, 2009). Lipid hydroperoxides cannot be reduced
from Gpx1 unless they are soluble; thus, they have to be pre-treated with phospholipase A2.
This substrate specificity might be explained by the structure of the enzyme due to which the
access of large substrates appears to be limited to the peroxidatic moiety at the active site
(Toppo et al., 2009). On the other hand, Gpx1 demonstrates high specificity towards reduced
substrates. Glutathione (GSH) is the only naturally occurring thiol that predominates in the
cell and efficiently reduces Gpx1 (Kulinsky and Kolesnichenko, 2009; Toppo et al., 2009).

- 24 -
3. Materials and methods
3.1. Materials
The materials used in this study and their providers are listed in Tables 1-11 according to
experimental procedure.
Table 1. Consumables and their providers.
Product Provider
6-well culture plates Sarstedt AG & Co
96-well qRT-PCR plates Biozym Scientific GmbH
75-ml tissue culture flasks Sarstedt AG & Co
Gloves Bio World Medical AG
Cryotubes Carl Roth GmbH & Co KG
Pasteur pipettes (5, 10, and 25 ml) (glass) VWR International
Pasteur pipettes (5, 10, and 25 ml) (plastic) Sarstedt AG & Co
Cell-culture dishes BD Falcon
Forceps Carl Roth GmbH & Co KG
Pipettes „Eppendorf Research Plus“
0,1-2,5 μl
Eppendorf AG, Hamburg
Pipettes „Eppendorf Research Plus“
0,5-10 μl
Eppendorf AG, Hamburg
Pipettes „Eppendorf Research Plus“
2-20 μl
Eppendorf AG, Hamburg

- 25 -
Pipettes „Eppendorf Research Plus“
10-100 μl
Eppendorf AG, Hamburg
Pipettes „Eppendorf Research Plus“
100-1000 μl
Eppendorf AG, Hamburg
Electronic pipette „Easypet“ Eppendorf AG, Hamburg
Pipet tips Kisker Biotech GmbH & Co KG
Reaction vessels (0.2, 0.5, 1, 1.5, and 2 ml) Kisker Biotech GmbH & Co KG
Reaction vessels (25 and 50 ml) Sarstedt AG & Co
Optical adhesive films „BZO Seal Film” Biozym Scientific GmbH
Scalpels Aesculap AG
Centrifuge tubes (50 ml) Sarstedt AG & Co
Microscope slides Thermo Scientific
Slide Staining System „EasyDip” Ted Pella, Inc.
Cover slips Engelbrecht Medizin- und Labortechnik
GmbH
Syringe filters Sartorius
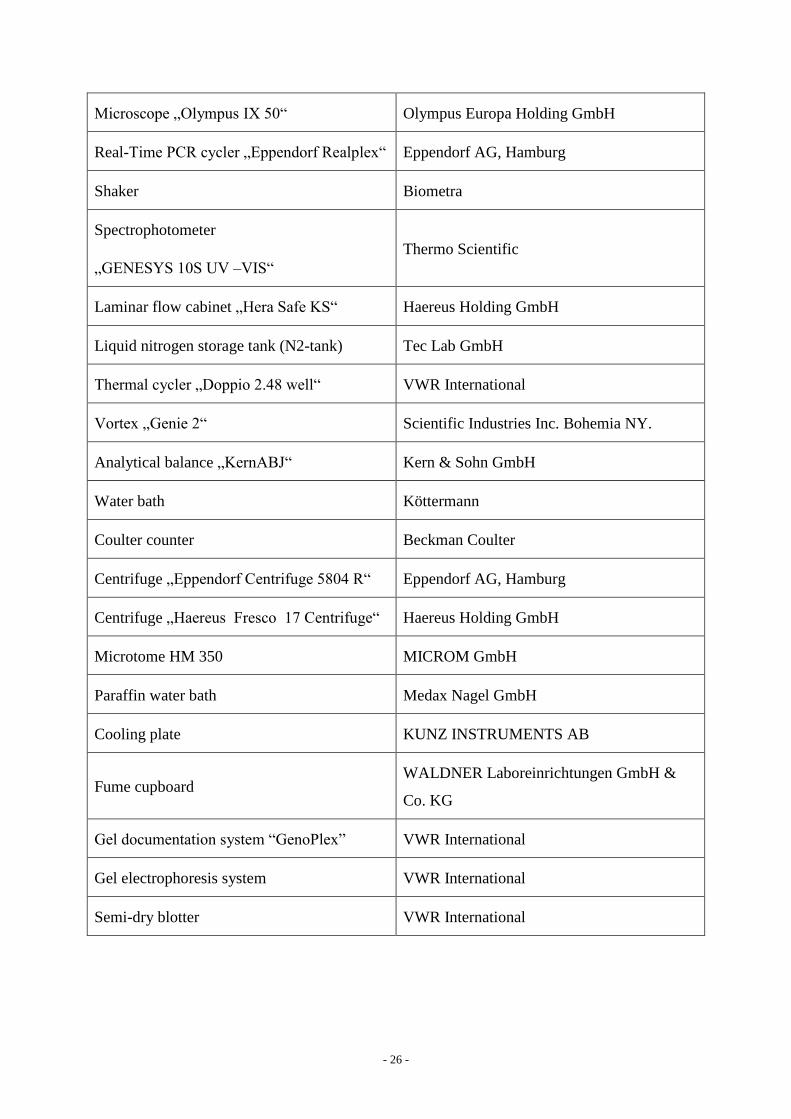
Table 2. Laboratory equipment and corresponding manufacturers.
Name Manufacturer
Autoclave „SystecVX-150“ Systec GmbH
CO2-Incubator Binder
Ice machine „ZBE 30-10“ ZIEGRA Eismaschinen GmbH
Freezer Robert Bosch GmbH
Fridge „Liebherr CN 3556“ Liebherr
- 26 -
Microscope „Olympus IX 50“ Olympus Europa Holding GmbH
Real-Time PCR cycler „Eppendorf Realplex“ Eppendorf AG, Hamburg
Shaker Biometra
Spectrophotometer
„GENESYS 10S UV –VIS“
Thermo Scientific
Laminar flow cabinet „Hera Safe KS“ Haereus Holding GmbH
Liquid nitrogen storage tank (N2-tank) Tec Lab GmbH
Thermal cycler „Doppio 2.48 well“ VWR International
Vortex „Genie 2“ Scientific Industries Inc. Bohemia NY.
Analytical balance „KernABJ“ Kern & Sohn GmbH
Water bath Köttermann
Coulter counter Beckman Coulter
Centrifuge „Eppendorf Centrifuge 5804 R“ Eppendorf AG, Hamburg
Centrifuge „Haereus Fresco 17 Centrifuge“ Haereus Holding GmbH
Microtome HM 350 MICROM GmbH
Paraffin water bath Medax Nagel GmbH
Cooling plate KUNZ INSTRUMENTS AB
Fume cupboard WALDNER Laboreinrichtungen GmbH &
Co. KG
Gel documentation system “GenoPlex” VWR International
Gel electrophoresis system VWR International
Semi-dry blotter VWR International

- 27 -
Table 3. Materials for the cell culture.
Product Provider
ATDC5 cell line Sigma-Aldrich
1:1 DMEM and Ham’s F-12 medium Sigma-Aldrich
Fetal calf serum PAN-Biotech GmbH
Antibiotics and antimycotics PAA Laboratories GmbH
Human transferrin Sigma-Aldrich
Sodium selenite Sigma-Aldrich
Human insulin PromoCell GmbH
Ascorbic acid Sigma-Aldrich
Trypsin-EDTA Gibco
PBS buffer Sigma-Aldrich
Isotonic-II Carl Roth GmbH & Co KG
Table 4. Materials for the RNA isolation.
Product Provider
peqGOLD TriFast reagent PEQLAB Biotechnologie GmbH
Chloroform Merck Chemicals GmbH
Isopropanol Merck Chemicals GmbH
Ethanol Carl Roth GmbH & Co KG
DEPC-water Carl Roth GmbH & Co KG
- 28 -
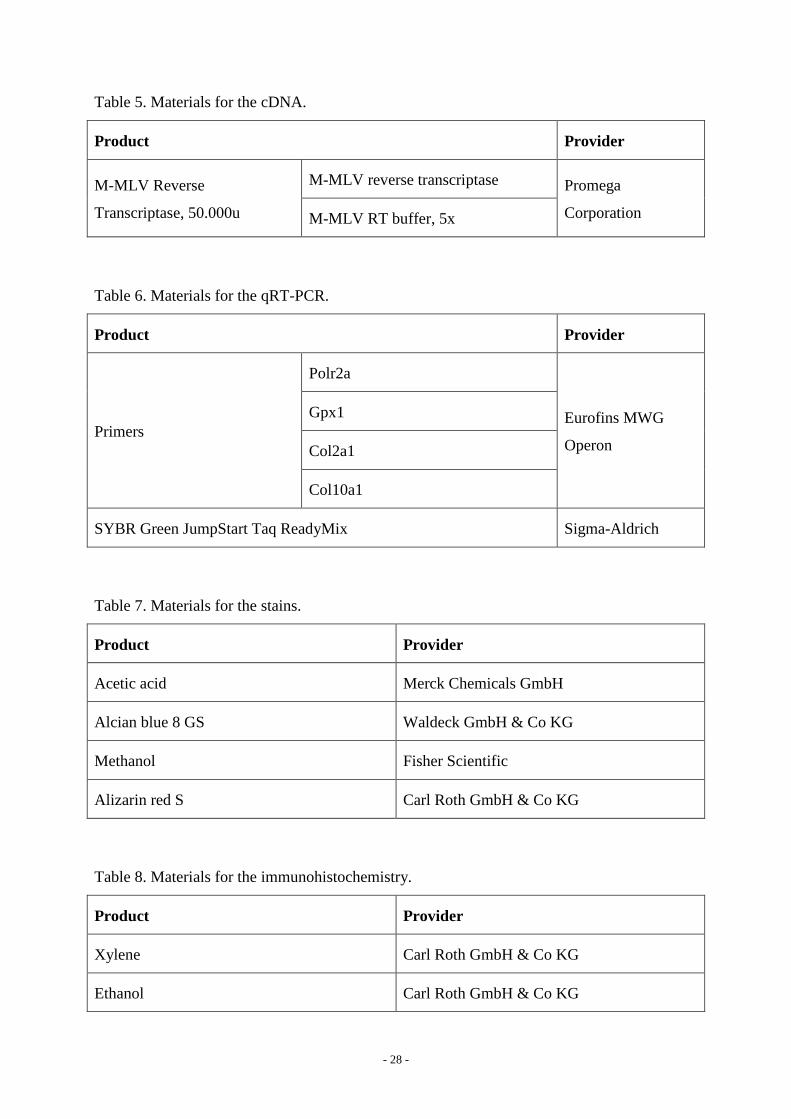
Table 5. Materials for the cDNA.
Product Provider
M-MLV Reverse
Transcriptase, 50.000u
M-MLV reverse transcriptase Promega
Corporation M-MLV RT buffer, 5x
Table 6. Materials for the qRT-PCR.
Product Provider
Primers
Polr2a
Eurofins MWG
Operon
Gpx1
Col2a1
Col10a1
SYBR Green JumpStart Taq ReadyMix Sigma-Aldrich
Table 7. Materials for the stains.
Product Provider
Acetic acid Merck Chemicals GmbH
Alcian blue 8 GS Waldeck GmbH & Co KG
Methanol Fisher Scientific
Alizarin red S Carl Roth GmbH & Co KG
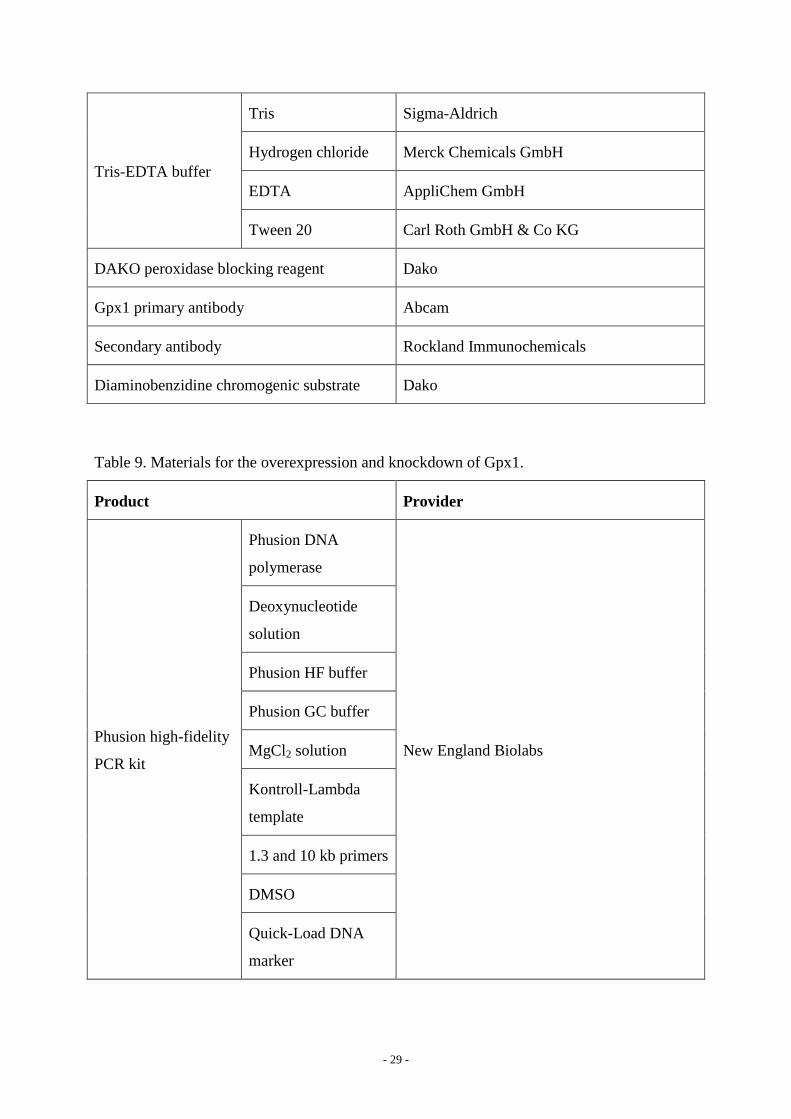
Table 8. Materials for the immunohistochemistry.
Product Provider
Xylene Carl Roth GmbH & Co KG
Ethanol Carl Roth GmbH & Co KG
- 29 -
Tris-EDTA buffer
Tris Sigma-Aldrich
Hydrogen chloride Merck Chemicals GmbH
EDTA AppliChem GmbH
Tween 20 Carl Roth GmbH & Co KG
DAKO peroxidase blocking reagent Dako
Gpx1 primary antibody Abcam
Secondary antibody Rockland Immunochemicals
Diaminobenzidine chromogenic substrate Dako
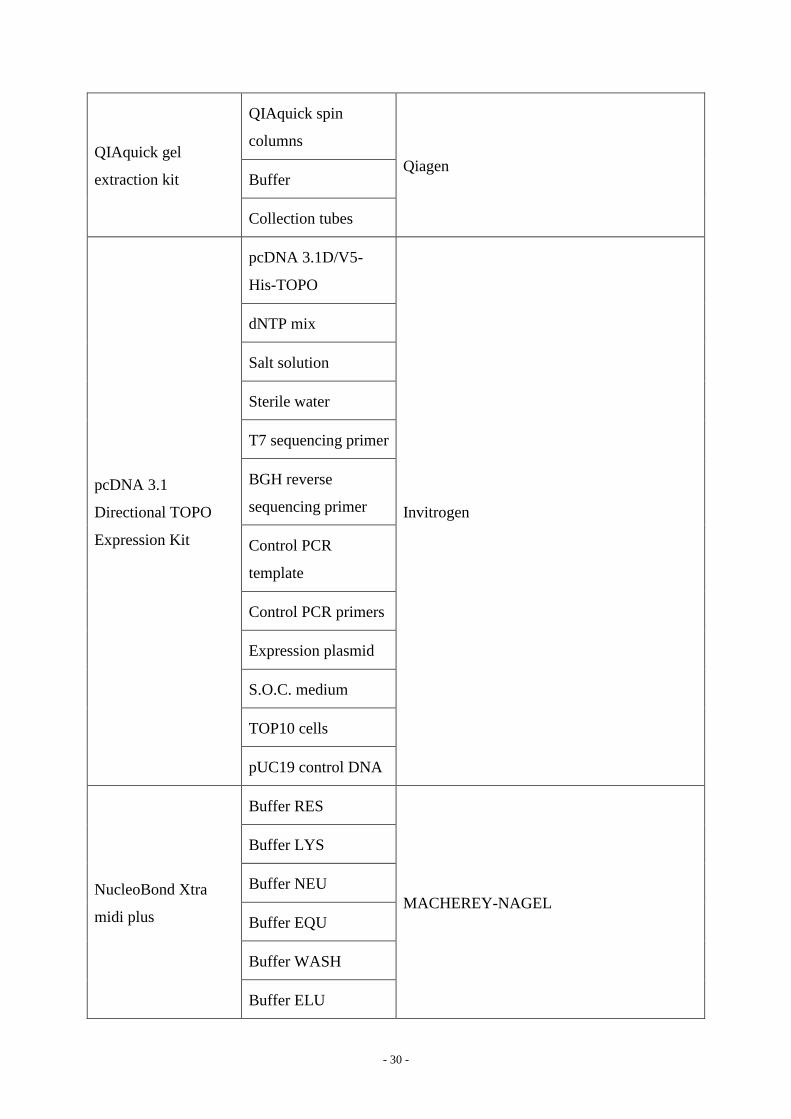
Table 9. Materials for the overexpression and knockdown of Gpx1.
Product Provider
Phusion high-fidelity
PCR kit
Phusion DNA
polymerase
New England Biolabs
Deoxynucleotide
solution
Phusion HF buffer
Phusion GC buffer
MgCl2 solution
Kontroll-Lambda
template
1.3 and 10 kb primers
DMSO
Quick-Load DNA
marker
- 30 -
QIAquick gel
extraction kit
QIAquick spin
columns
Qiagen Buffer
Collection tubes
pcDNA 3.1
Directional TOPO
Expression Kit
pcDNA 3.1D/V5-
His-TOPO
Invitrogen
dNTP mix
Salt solution
Sterile water
T7 sequencing primer
BGH reverse
sequencing primer
Control PCR
template
Control PCR primers
Expression plasmid
S.O.C. medium
TOP10 cells
pUC19 control DNA
NucleoBond Xtra
midi plus
Buffer RES
MACHEREY-NAGEL
Buffer LYS
Buffer NEU
Buffer EQU
Buffer WASH
Buffer ELU

- 31 -
RNase A
NucleoBond Xtra
midi columns and
column filters
NucleoBond
finalizers
30 ml syringes
1 ml syringes
Buffer TRIS
LB medium Carl Roth GmbH & Co KG
Serum-free medium Sigma-Aldrich
TurboFect transfection reagent Thermo Scientific
Trilencer-27 siRNA
kit
Gene-specific siRNA
duplexes
OriGene
Universal scrambled
negative control
siRNA duplex
Rnase free siRNA
duplex re-suspension
buffer
Table 10. Materials for western blotting.
Product Provider
CelLytic M reagent Sigma-Aldrich
Stacking and running
SDS-gel
Acrylamide mix Carl Roth GmbH & Co KG
Tris Sigma-Aldrich

- 32 -
SDS Carl Roth GmbH & Co KG
APS Carl Roth GmbH & Co KG
TEMED Carl Roth GmbH & Co KG
Bromophenol blue Sigma-Aldrich
SDS-running buffer
Tris Sigma-Aldrich
SDS Carl Roth GmbH & Co KG
Glycine Carl Roth GmbH & Co KG
Transfer buffer
Tris Sigma-Aldrich
Glycine Carl Roth GmbH & Co KG
Methanol Fisher Scientific
SDS Carl Roth GmbH & Co KG
TBS-T buffer
Tris Sigma-Aldrich
NaCl Carl Roth GmbH & Co KG
HCl Fisher Scientific
Tween 20 Carl Roth GmbH & Co KG
Roti-Load 1, 4x Carl Roth GmbH & Co KG
PVDF membrane Carl Roth GmbH & Co KG
Filter papers GE Healthcare Europe GmbH
Gpx1 primary antibody Abcam
Secondary antibody Rockland Immunochemicals
Powdered milk Carl Roth GmbH & Co KG
- 33 -
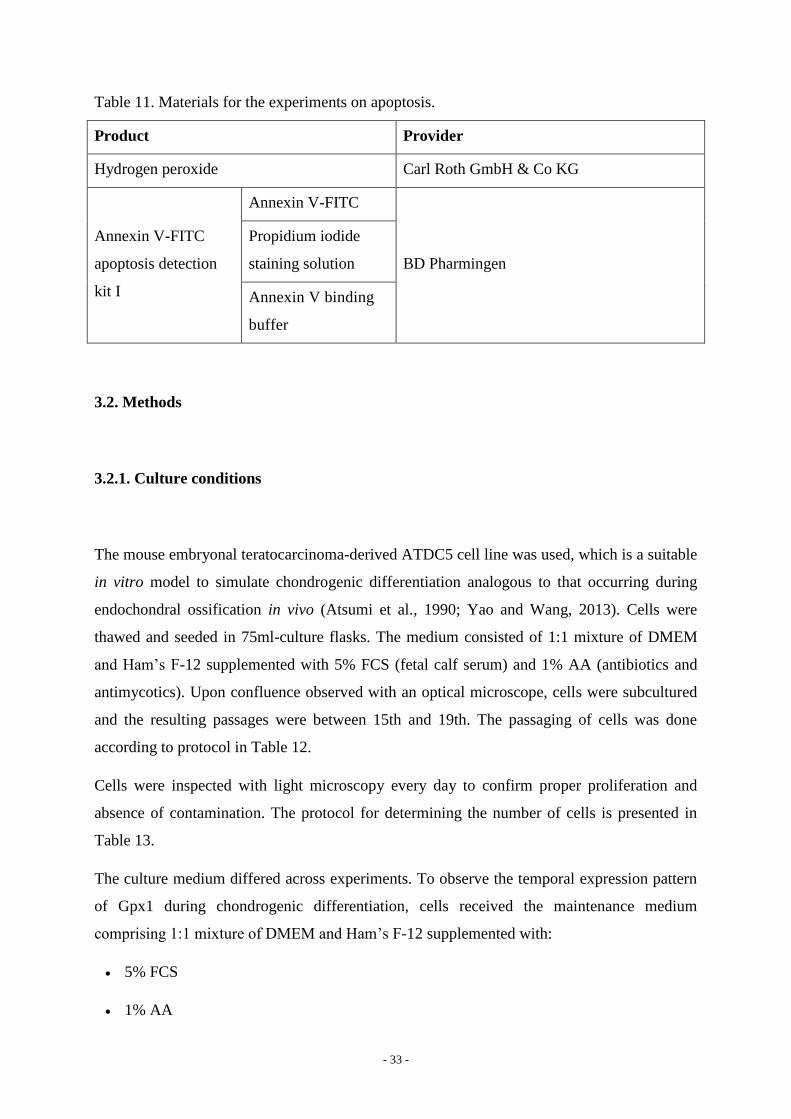
Table 11. Materials for the experiments on apoptosis.
Product Provider
Hydrogen peroxide Carl Roth GmbH & Co KG
Annexin V-FITC
apoptosis detection
kit I
Annexin V-FITC
BD Pharmingen
Propidium iodide
staining solution
Annexin V binding
buffer
3.2. Methods
3.2.1. Culture conditions
The mouse embryonal teratocarcinoma-derived ATDC5 cell line was used, which is a suitable
in vitro model to simulate chondrogenic differentiation analogous to that occurring during
endochondral ossification in vivo (Atsumi et al., 1990; Yao and Wang, 2013). Cells were
thawed and seeded in 75ml-culture flasks. The medium consisted of 1:1 mixture of DMEM
and Ham’s F-12 supplemented with 5% FCS (fetal calf serum) and 1% AA (antibiotics and
antimycotics). Upon confluence observed with an optical microscope, cells were subcultured
and the resulting passages were between 15th and 19th. The passaging of cells was done
according to protocol in Table 12.
Cells were inspected with light microscopy every day to confirm proper proliferation and
absence of contamination. The protocol for determining the number of cells is presented in
Table 13.
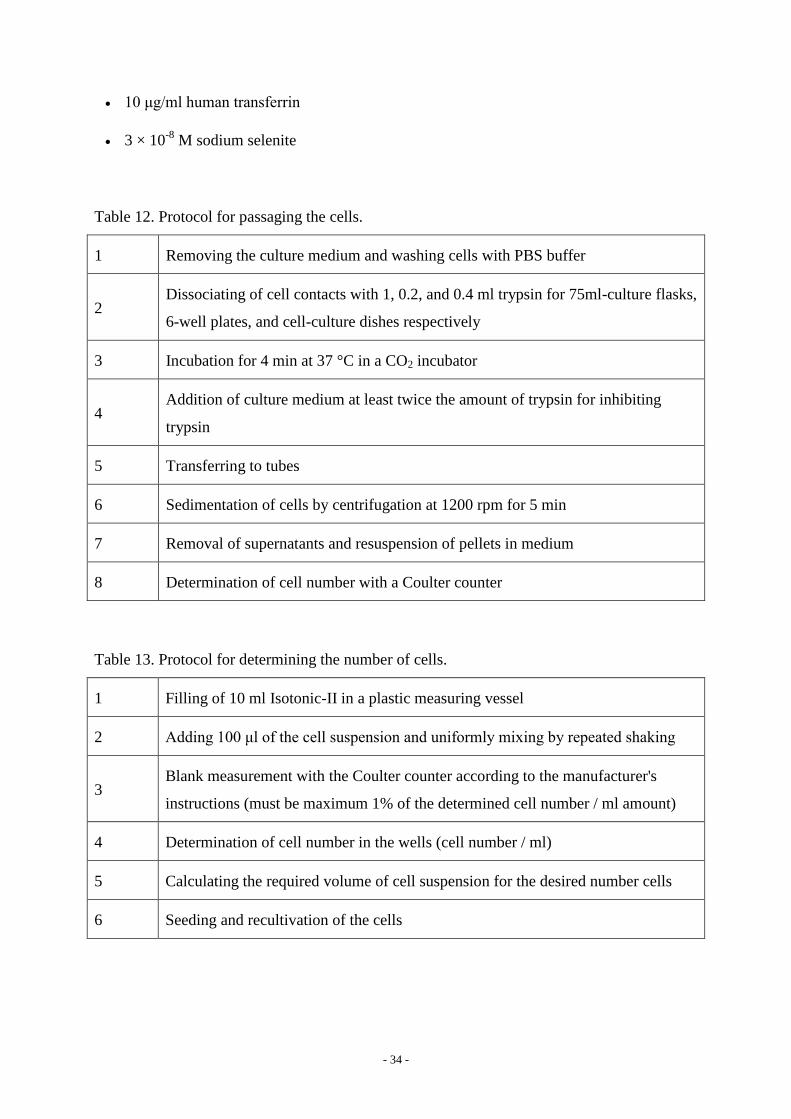
The culture medium differed across experiments. To observe the temporal expression pattern
of Gpx1 during chondrogenic differentiation, cells received the maintenance medium
comprising 1:1 mixture of DMEM and Ham’s F-12 supplemented with:
5% FCS
1% AA
- 34 -
10 μg/ml human transferrin
3 × 10⁻⁸
M sodium selenite
Table 12. Protocol for passaging the cells.
1 Removing the culture medium and washing cells with PBS buffer
2 Dissociating of cell contacts with 1, 0.2, and 0.4 ml trypsin for 75ml-culture flasks,
6-well plates, and cell-culture dishes respectively
3 Incubation for 4 min at 37 °C in a CO2 incubator
4 Addition of culture medium at least twice the amount of trypsin for inhibiting
trypsin
5 Transferring to tubes
6 Sedimentation of cells by centrifugation at 1200 rpm for 5 min
7 Removal of supernatants and resuspension of pellets in medium
8 Determination of cell number with a Coulter counter
Table 13. Protocol for determining the number of cells.
1 Filling of 10 ml Isotonic-II in a plastic measuring vessel
2 Adding 100 μl of the cell suspension and uniformly mixing by repeated shaking
3 Blank measurement with the Coulter counter according to the manufacturer's
instructions (must be maximum 1% of the determined cell number / ml amount)
4 Determination of cell number in the wells (cell number / ml)
5 Calculating the required volume of cell suspension for the desired number cells
6 Seeding and recultivation of the cells

- 35 -
For inducing chondrogenesis from the fifth day of culture (corresponding to day 0 of the
measurements) and over the following 21 days, the differentiation medium was prepared by
additionally supplementing the maintenance medium with (Altaf et al., 2006):
10 μg/ml human insulin
20 mg/ml ascorbic acid
The aforementioned differentiation medium was also used for the knockdown experiments.
For the overexpression experiments the medium was:
5% FCS
1% AA
10 μg/ml human transferrin
100 nM sodium selenite
The medium was replaced every other day, unless otherwise stated, and cell cultures were
maintained at 37 °C under a humidified atmosphere of 5% CO2.
3.2.2. Isolation of RNA
After washing cells with PBS buffer, 1 ml peqGOLD TriFast reagent was applied per well
and left for 5 min. The solution was transferred to tubes, where 200 µl chloroform were
added. The mixture was well vibrated and left until the separation of aqueous and organic
phase. The mixture was then centrifuged at 4 °C and 14000 rpm for 10 min. The aqueous
phase was removed to new tubes, where 400 μl isopropanol was pipetted. Samples were
incubated at 4 °C for 10 min, followed by centrifugation at 4 °C and 14000 rpm for 15 min.
Supernatants were removed and pellets were washed twice with 1 ml of 70% ethanol followed
by centrifugation at 4 °C and 7500 g for 5 min. Pellets were left to dry for 10 min and RNA
was dissolved in 25 μl DEPC-water. Samples were immediately placed on ice for subsequent
quantification of RNA.
A spectrophotometer was used for quantifying RNA at wavelengths of 260 nm and 280 nm.
Whenever the concentration of nucleic acid in the samples was above 600 ng/μl, additional
amount of DEPC-water was added. The purity of the samples was defined by the
- 36 -
OD260/OD280 ratio and samples were admissible whenever the ratio was above 1.8. After
determining RNA concentration and purity, samples were stored at -80 °C until further
handling.
3.2.3. Reverse transcription
RNA was transcribed to cDNA with the M-MLV Reverse Transcriptase. All the tubes were
kept on ice throughout the process. Samples contained the following:
1 μg RNA template
4 μl M-MLV Reaction Buffer, 5x
1 μl Oligo(dT)
1 μl Random Hexamer
1 μl dNTP Mix, 10 mM
RNase-free H2O, summing up to a volume of 20 μl
Samples were then incubated at 70 °C for 3 min. Afterwards, the following were added:
1 μl RNase Inhibitor
1 μl M-MLV Reverse Transcriptase
Samples were finally incubated at 37 °C for 60 min and at 95 °C for 2 min. They were then
kept at -20 °C until further use.
3.2.4. Quantitative Real-Time PCR
Four primers were used for this study: polymerase II (Polr2a), glutathione peroxidase 1
(Gpx1), Collagen type II (Col2a1), and collagen type X (Col10a1). The expression of Polr2a
was set as the endogenous control, while Col2a1 and Col10a1 were chondrogenic gene
markers corresponding to different stages of differentiation. Col2a1 is a well-established
marker for the initial differentiation of chondrocytes, while Col10a1 is a marker for the
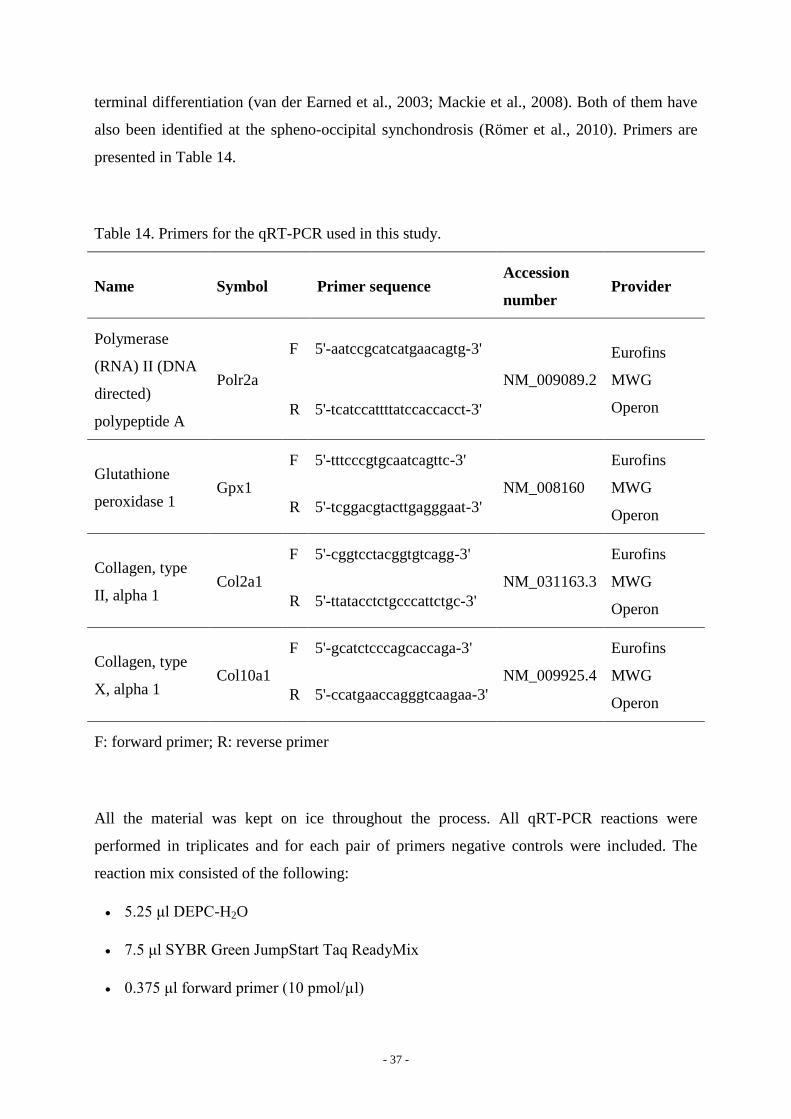
- 37 -
terminal differentiation (van der Earned et al., 2003; Mackie et al., 2008). Both of them have
also been identified at the spheno-occipital synchondrosis (Römer et al., 2010). Primers are
presented in Table 14.
Table 14. Primers for the qRT-PCR used in this study.
Name Symbol Primer sequence Accession
number Provider
Polymerase
(RNA) II (DNA
directed)
polypeptide A
Polr2a
F 5'-aatccgcatcatgaacagtg-3'
NM_009089.2
Eurofins
MWG
Operon R 5'-tcatccattttatccaccacct-3'
Glutathione
peroxidase 1 Gpx1
F 5'-tttcccgtgcaatcagttc-3'
NM_008160
Eurofins
MWG
Operon R 5'-tcggacgtacttgagggaat-3'
Collagen, type
II, alpha 1 Col2a1
F 5'-cggtcctacggtgtcagg-3'
NM_031163.3
Eurofins
MWG
Operon R 5'-ttatacctctgcccattctgc-3'
Collagen, type
X, alpha 1 Col10a1
F 5'-gcatctcccagcaccaga-3'
NM_009925.4
Eurofins
MWG
Operon R 5'-ccatgaaccagggtcaagaa-3'
F: forward primer; R: reverse primer
All the material was kept on ice throughout the process. All qRT-PCR reactions were
performed in triplicates and for each pair of primers negative controls were included. The
reaction mix consisted of the following:
5.25 μl DEPC-H2O
7.5 μl SYBR Green JumpStart Taq ReadyMix
0.375 μl forward primer (10 pmol/µl)

- 38 -
0.375 μl reverse primer (10 pmol/µl)
1.5 μl cDNA (10x diluted)
The reaction mix was pipetted in 96-well plates, which were covered with an optical adhesive
film. Cycling conditions were as follows:
Heat up and initial denaturation at 95 °C for 5 min
Denaturation of the double stranded DNA at 95 °C for 10 sec
Annealing of primers at 60 °C for 8 sec
Elongation and fluorescence-point measurement at 72 °C for 8 sec
The amplification reaction was repeated for 45 cycles and an extra step of melting curve was
always included, to insure the specificity of primers. The melting curve step consisted of the
following:
Initial denaturation at 95 °C for 15 sec
Annealing of primers at 60 °C for 15 sec
Rise of the temperature from 60 °C to 95 °C within 20 min with ongoing measurement of
the fluorescence
Maintenance of the temperature at 95 °C for 15 sec
In order to be statistically analysed, data were normalized against the endogenous control
according to the formula:
ΔCt = Ct endogenous control - Ct gene of interest
For this purpose, the mean of the triplicates was always considered, if the standard deviation
did not exceed 0.60. Otherwise, the outlier was excluded and the mean of the two remaining
identical wells was taken into account. For presenting the data, the mRNA levels were
normalized against the endogenous control and logarithmic scaled on the base of 2. They are
presented as individual data points (Schmittgen and Livak, 2008): 2ΔCt
.
- 39 -
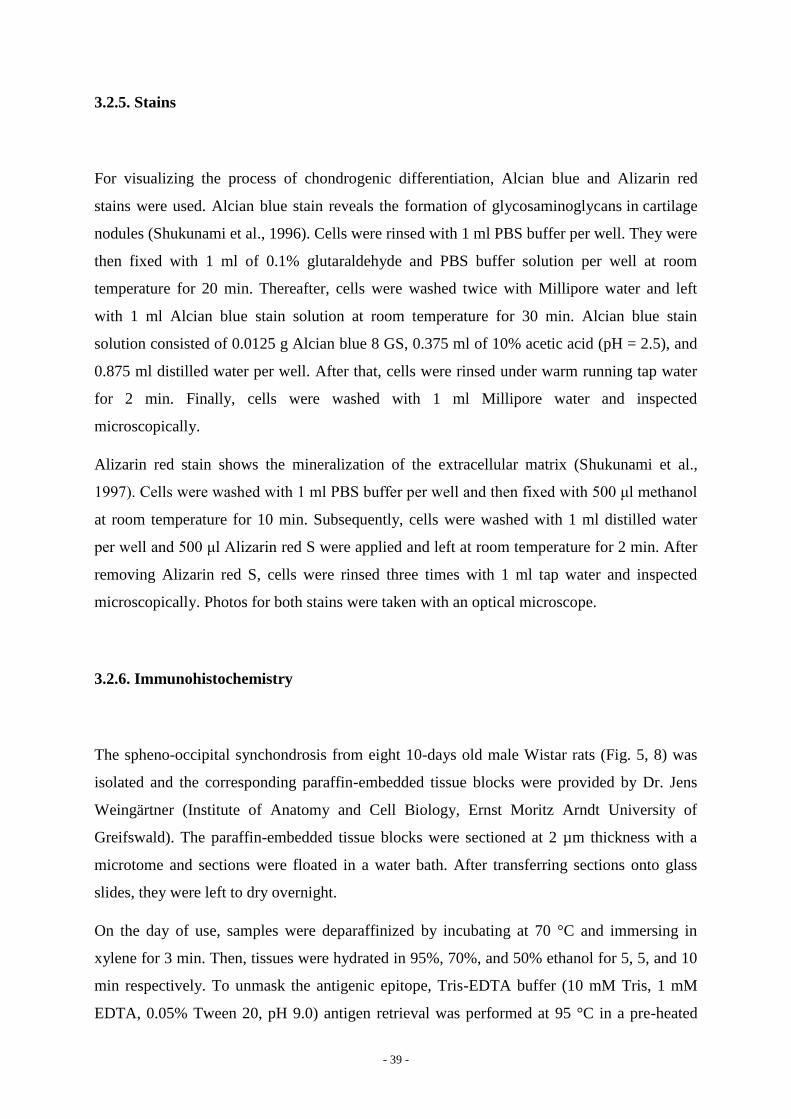
3.2.5. Stains
For visualizing the process of chondrogenic differentiation, Alcian blue and Alizarin red
stains were used. Alcian blue stain reveals the formation of glycosaminoglycans in cartilage
nodules (Shukunami et al., 1996). Cells were rinsed with 1 ml PBS buffer per well. They were
then fixed with 1 ml of 0.1% glutaraldehyde and PBS buffer solution per well at room
temperature for 20 min. Thereafter, cells were washed twice with Millipore water and left
with 1 ml Alcian blue stain solution at room temperature for 30 min. Alcian blue stain
solution consisted of 0.0125 g Alcian blue 8 GS, 0.375 ml of 10% acetic acid (pH = 2.5), and
0.875 ml distilled water per well. After that, cells were rinsed under warm running tap water
for 2 min. Finally, cells were washed with 1 ml Millipore water and inspected
microscopically.
Alizarin red stain shows the mineralization of the extracellular matrix (Shukunami et al.,
1997). Cells were washed with 1 ml PBS buffer per well and then fixed with 500 μl methanol
at room temperature for 10 min. Subsequently, cells were washed with 1 ml distilled water
per well and 500 μl Alizarin red S were applied and left at room temperature for 2 min. After
removing Alizarin red S, cells were rinsed three times with 1 ml tap water and inspected
microscopically. Photos for both stains were taken with an optical microscope.
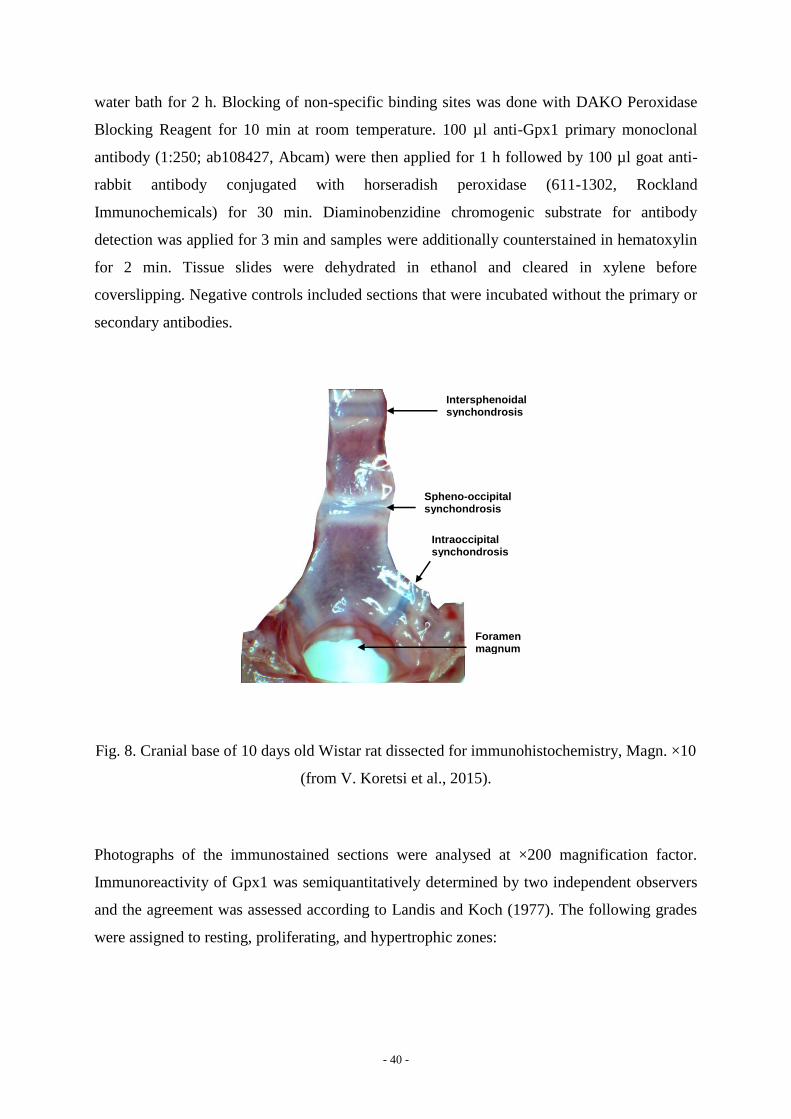
3.2.6. Immunohistochemistry
The spheno-occipital synchondrosis from eight 10-days old male Wistar rats (Fig. 5, 8) was
isolated and the corresponding paraffin-embedded tissue blocks were provided by Dr. Jens
Weingärtner (Institute of Anatomy and Cell Biology, Ernst Moritz Arndt University of
Greifswald). The paraffin-embedded tissue blocks were sectioned at 2 µm thickness with a
microtome and sections were floated in a water bath. After transferring sections onto glass
slides, they were left to dry overnight.
On the day of use, samples were deparaffinized by incubating at 70 °C and immersing in
xylene for 3 min. Then, tissues were hydrated in 95%, 70%, and 50% ethanol for 5, 5, and 10
min respectively. To unmask the antigenic epitope, Tris-EDTA buffer (10 mM Tris, 1 mM
EDTA, 0.05% Tween 20, pH 9.0) antigen retrieval was performed at 95 °C in a pre-heated
- 40 -
water bath for 2 h. Blocking of non-specific binding sites was done with DAKO Peroxidase
Blocking Reagent for 10 min at room temperature. 100 µl anti-Gpx1 primary monoclonal
antibody (1:250; ab108427, Abcam) were then applied for 1 h followed by 100 µl goat anti-
rabbit antibody conjugated with horseradish peroxidase (611-1302, Rockland
Immunochemicals) for 30 min. Diaminobenzidine chromogenic substrate for antibody
detection was applied for 3 min and samples were additionally counterstained in hematoxylin
for 2 min. Tissue slides were dehydrated in ethanol and cleared in xylene before
coverslipping. Negative controls included sections that were incubated without the primary or
secondary antibodies.
Foramen magnum
Spheno-occipital synchondrosis
Intraoccipital synchondrosis
Intersphenoidal synchondrosis
Fig. 8. Cranial base of 10 days old Wistar rat dissected for immunohistochemistry, Magn. ×10
(from V. Koretsi et al., 2015).
Photographs of the immunostained sections were analysed at ×200 magnification factor.
Immunoreactivity of Gpx1 was semiquantitatively determined by two independent observers
and the agreement was assessed according to Landis and Koch (1977). The following grades
were assigned to resting, proliferating, and hypertrophic zones:
- 41 -
Grade 0, no immunoreactivity
Grade 1, weak immunoreactivity (less than 25% of the cells)
Grade 2, moderate immunoreactivity (25-50% of the cells)
Grade 3, strong immunoreactivity (50-75% of the cells)
Grade 4, very strong immunoreactivity (more than 75% of the cells)
Multiple sections were analysed per specimen and the median of replicates was then
considered. Repeatability was assessed by analysing randomly selected photographs with an
interval of a week.
3.2.7. Overexpression and silencing of Gpx1
The expression of Gpx1 was transiently manipulated in ATDC5 chondrogenic cell line. For
the overexpression experiments, Gpx1 was amplified from the cDNA of ATDC5 cells with
the Phusion High-Fidelity PCR Kit. The reaction mixture comprised 4 µl 5xPCR-buffer, 0.4
µl dNTPs, 1 µl of 1:10 diluted cDNA containing 1 µg RNA, 1 µl of each primer, 0.2 µl DNA
polymerase, and 12.4 µl H2O. The forward and reverse primers were 5'-
caccatgtgtgctgctcggctct-3' and 5'-ccttaggagttgccagactgc-3' respectively. Cycling conditions
were 98 °C for 30 sec, followed by 30 cycles at 98 °C for 10 sec, 60 °C for 30 sec and 72 °C
for 30 sec, and a final extension of 72 °C for 5 min. Extraction and purification of the
amplificates was done with QIAquick Gel Extraction Kit. Specifically, 3 volumes of QG
buffer were mixed with 1 volume of samples and the samples were then centrifuged with the
QIAquick Spin Column for 60 sec. The flow-through was discarded and samples were
washed with 0.75 ml PE buffer. Samples were again centrifuged for 1 min at maximum speed.
The QIAquick Spin Column was placed into a clean microcentrifuge tube. Finally, 30 µl
elution buffer were added, samples were left for 1 min, and they were then centrifuged for 1
min. DNA was sequenced with Eurofins MWG Operon and the cloned sequence was found to
be identical to the murine Gpx1 (NM_008160).
- 42 -
The mammalian expression vectors pcDNA 3.1D/V5-His-TOPO were transformed in
Escherichia coli and the plasmid DNA was purified with NucleoBond Xtra Midi Plus. The
culture stemming from diluting the starter culture 1: 1000 into LB medium was left to grow
overnight. After harvesting bacterial cells, they were pelleted by centrifugation and the
supernatant was discarded. Cells were resuspended in Resuspension Buffer RES + RNase A
and the LYS buffer was added to the suspension at room temperature for 5 min. Then the
EQU buffer was applied to the NucleoBond Xtra Column followed by NEU buffer for
neutralization. After applying the lysate, the column filter and column were washed with
EQU buffer and the column filter was discarded. The column was washed with WASH buffer
and the plasmid DNA was eluted with ELU buffer. Subsequently, isopropanol for
precipitating the eluted plasmid DNA was added and the samples were centrifuged. The
supernatant was discarded and 70% ethanol was added to the DNA pellet. After centrifuging,
ethanol was removed and the pellet was left to dry. To reconstitute DNA, pellet was dissolved
in Tris-EDTA buffer. Nucleic acid concentration and purity were determined by
spectrophotometry.
ATDC5 cells were transfected with Gpx1 or LacZ (control) plasmids in TurboFect
Transfection Reagent. Twenty four hours prior to transfection, 5 × 10⁵ cells were seeded with
4 ml medium in cell-culture dishes. 8 µg of DNA were diluted in 800 μl of serum-free
DMEM medium per cell-culture dish and 12 μl of TurboFect were added to the diluted DNA
per cell-culture dish. The mixture was incubated at room temperature for 20 min and then 800
μl of it were added to each cell-culture dish dropwise. Finally, cell-culture dishes were gently
rocked and incubated at 37 °C in a CO2 incubator for the next 72 h. The overexpression of
Gpx1 in ATDC5 cells was confirmed with qRT-PCR.
To knockdown Gpx1, siRNA transfections were performed with Trilencer-27 siRNA kit. 5 ×
105 ATDC5 cells were seeded with 4 ml medium in cell-culture dishes 24 h prior to
transfection and transfected with 5 nM Gpx1-siRNA and scrambled RNA as negative control
(SR405153, OriGene). The siRNA was diluted to 5 μM using the sterilized duplex buffer
supplied with the kit. Then, 5 μl of the diluted 5 μM siRNA were mixed with 320 μl serum-
free medium in tubes. 20 μl siTran were diluted with 240 μl serum-free medium and the
dilution was added to the aforementioned siRNA solution. The mixture was incubated at room
temperature for 10 min. The mixture was finally transferred to the cell-culture dishes and
those were incubated at 37 °C in a CO2 incubator for the next 72 h. Knockdown of Gpx1 was
confirmed with qRT-PCR.
- 43 -
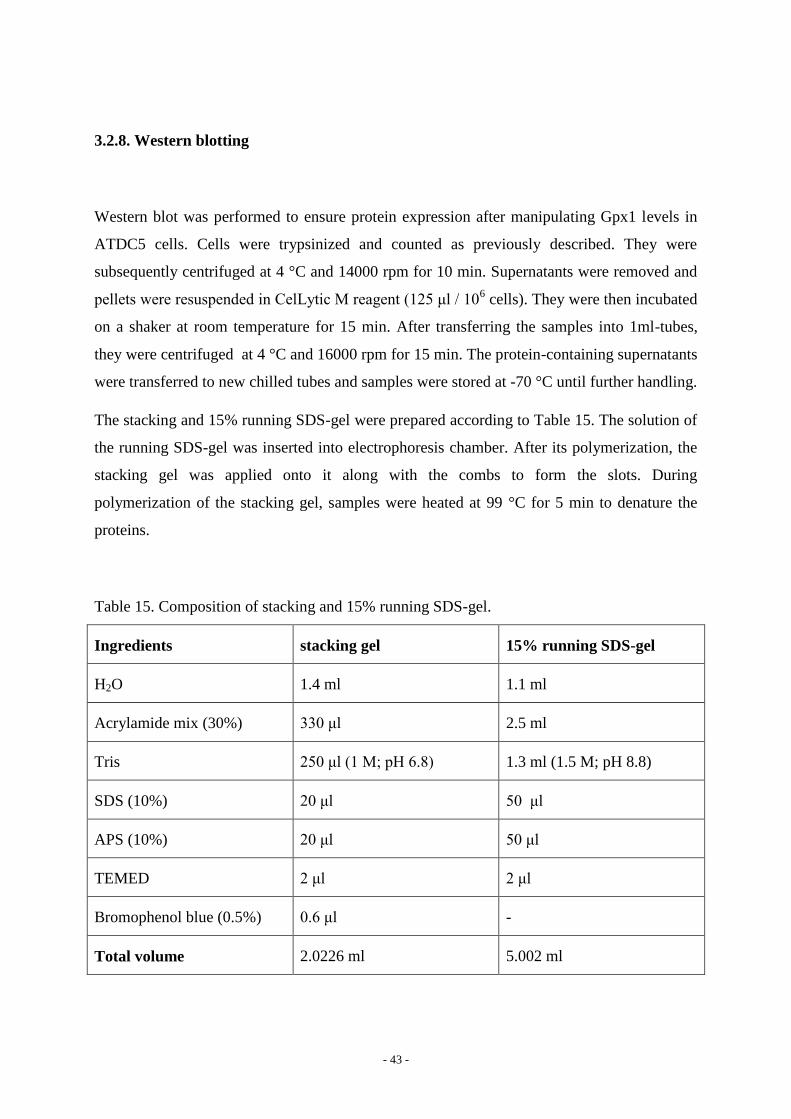
3.2.8. Western blotting
Western blot was performed to ensure protein expression after manipulating Gpx1 levels in
ATDC5 cells. Cells were trypsinized and counted as previously described. They were
subsequently centrifuged at 4 °C and 14000 rpm for 10 min. Supernatants were removed and
pellets were resuspended in CelLytic M reagent (125 μl / 106 cells). They were then incubated
on a shaker at room temperature for 15 min. After transferring the samples into 1ml-tubes,
they were centrifuged at 4 °C and 16000 rpm for 15 min. The protein-containing supernatants
were transferred to new chilled tubes and samples were stored at -70 °C until further handling.
The stacking and 15% running SDS-gel were prepared according to Table 15. The solution of
the running SDS-gel was inserted into electrophoresis chamber. After its polymerization, the
stacking gel was applied onto it along with the combs to form the slots. During
polymerization of the stacking gel, samples were heated at 99 °C for 5 min to denature the
proteins.
Table 15. Composition of stacking and 15% running SDS-gel.
Ingredients stacking gel 15% running SDS-gel
H2O 1.4 ml 1.1 ml
Acrylamide mix (30%) 330 μl 2.5 ml
Tris 250 μl (1 M; pH 6.8) 1.3 ml (1.5 M; pH 8.8)
SDS (10%) 20 μl 50 μl
APS (10%) 20 μl 50 μl
TEMED 2 μl 2 μl
Bromophenol blue (0.5%) 0.6 μl -
Total volume 2.0226 ml 5.002 ml
- 44 -
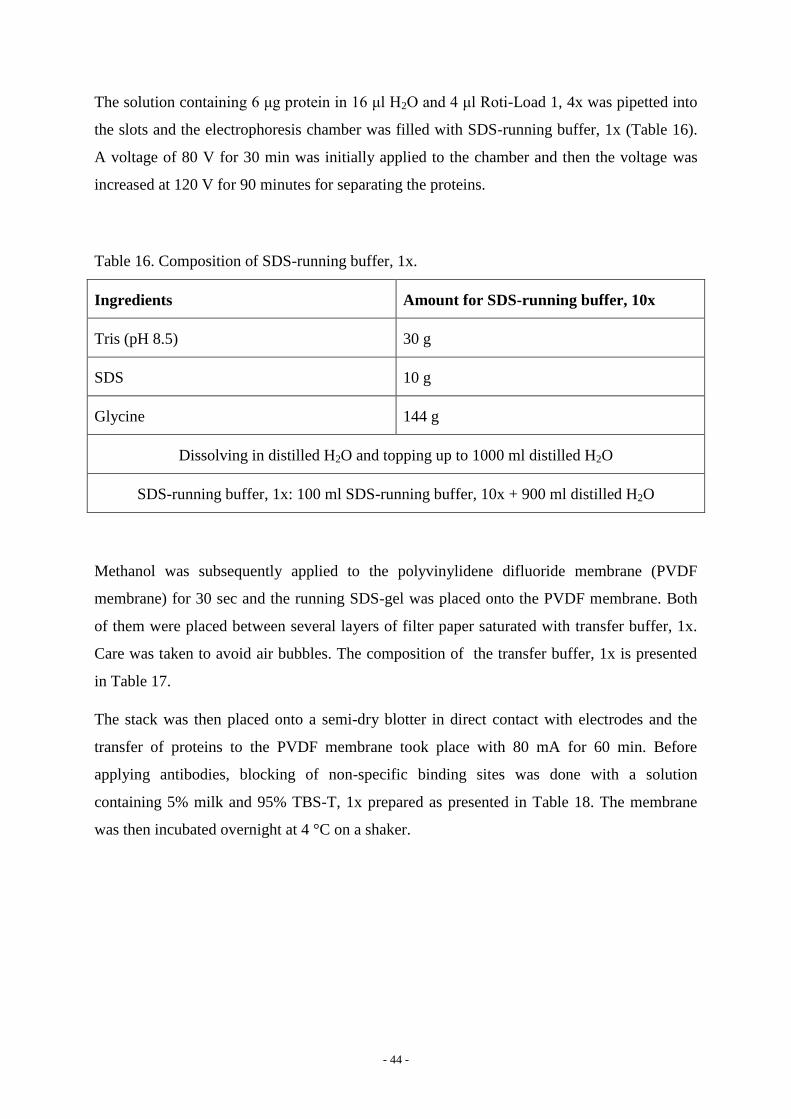
The solution containing 6 μg protein in 16 μl H2O and 4 μl Roti-Load 1, 4x was pipetted into
the slots and the electrophoresis chamber was filled with SDS-running buffer, 1x (Table 16).
A voltage of 80 V for 30 min was initially applied to the chamber and then the voltage was
increased at 120 V for 90 minutes for separating the proteins.
Table 16. Composition of SDS-running buffer, 1x.
Ingredients Amount for SDS-running buffer, 10x
Tris (pH 8.5) 30 g
SDS 10 g
Glycine 144 g
Dissolving in distilled H2O and topping up to 1000 ml distilled H2O
SDS-running buffer, 1x: 100 ml SDS-running buffer, 10x + 900 ml distilled H2O
Methanol was subsequently applied to the polyvinylidene difluoride membrane (PVDF
membrane) for 30 sec and the running SDS-gel was placed onto the PVDF membrane. Both
of them were placed between several layers of filter paper saturated with transfer buffer, 1x.
Care was taken to avoid air bubbles. The composition of the transfer buffer, 1x is presented
in Table 17.
The stack was then placed onto a semi-dry blotter in direct contact with electrodes and the
transfer of proteins to the PVDF membrane took place with 80 mA for 60 min. Before
applying antibodies, blocking of non-specific binding sites was done with a solution
containing 5% milk and 95% TBS-T, 1x prepared as presented in Table 18. The membrane
was then incubated overnight at 4 °C on a shaker.

- 45 -
Table 17. Composition of the transfer buffer, 1x.
Ingredients Amount for transfer buffer, 1x
Tris 58 g
Glycine 29 g
SDS (10%) 4 g
Dissolving in distilled H2O and topping up to 1000 ml distilled H2O, resulting in transfer
buffer, 10x
Transfer buffer, 10x 100 ml
Methanol 200 ml
Topping up to 1000 ml distilled H2O, resulting in transfer buffer, 1x
Table 18. Composition of TBS-T, 1x.
Ingredients Amount for TBS-T, 10x
Tris 24.23 g
NaCl 80.06 g
distilled H2O 800 ml
Setting the pH to 7.5 with HCl (approximately 150 ml)
Topping up to 1000 ml distilled H2O
For TBS-T, 1x: 100 ml TBS-T, 10x + 899 ml distilled H2O + 1 ml Tween 20
The Gpx1 primary antibody (1:2000, ab108427, Abcam) was applied in a solution of 0.5%
milk and 99.5% TBS-T and incubated at room temperature for 90 min on a shaker. The
membrane was then washed three times with TBS-T, each time for 10 min at room
temperature on a shaker. Secondary antibody (1:5000, 611-1302, Rockland
Immunochemicals) dissolved in the same solution was applied and incubated at room
temperature for 60 min. The membrane was finally washed twice with TBS-T for 10 min,

- 46 -
once with PBS buffer for 5 min, and once with TBS-T for 5 min. The detection through
chemiluminescence was carried out with the gel documentation system “GenoPlex” and its
corresponding software “GenoSoft”.
3.2.9. Exposure to H2O2 and apoptosis assay
After incubating for 72 h, transfected cells were treated with exogenous H2O2 and the quantity
of apoptotic cells was determined. After removing the old medium, ATDC5 cells were
provided with 4 ml of fresh medium additionally supplemented with 250 µM H2O2. Cells
were incubated at 37 °C in a CO2 incubator for 6 h, after which the percentage of cells
undergoing apoptosis was assessed by flow cytometry with the Annexin V-FITC Apoptosis
Detection Kit I. The medium was collected and centrifuged resulting in the formation of
pellets, while adherent cells were trypsinized. Both resulting pellets were then united and
quantified. For the staining, cells were initially washed twice with cold PBS buffer and then
resuspended in binding buffer, 1x. 100 µl of the solution were transferred to tubes, where 5 µl
FITC Annexin V and 5 µl PI (propidium iodide) were added. Tubes were gently vortexed and
incubated at room temperature in the dark for 15 min. Finally, 400 µl of binding buffer, 1x
were supplied to each tube and samples were analysed with a flow cytometer within an hour.
The settings were the following: FSC = 5 V, SSC = 350 V, FITC = 335 V, and PerCP-Cy5-5
= 395 V.
3.2.10. Statistical analysis
Statistical evaluation was performed using the SPSS programme, version 20.0 for Windows
(SPSS Inc., Chicago, USA). All the statistical tests were two-sided at a level of significance
p ≤ 0.05. Data on the temporal expression pattern and immunohistochemical quantification of
Gpx1 were compared for significance with the Friedman’s two-way analysis of variance by
ranks. If there was a total significance level of p ≤ 0.05, paired multiple comparisons were
undertaken with the Wilcoxon test at an adjusted p value according to the correction of
Bonferroni. Data on apoptosis were analysed with Welch’s ANOVA and multiple
comparisons were undertaken with the Games-Howell test. Descriptive statistics are presented

- 47 -
as mean and standard error for continuous data, whereas median and interquartile range are
given for ordinal data.
For the statistical analysis of the apoptosis assay, each experimental sample was calculated
relative to its control and expressed as a ratio. Specifically, the value of each control sample
was equated to 1 and the value of the corresponding experimental sample was converted
accordingly.
- 48 -
4. Results
4.1. Chondrogenic differentiation of ATDC5 cell line
4.1.1. Stains
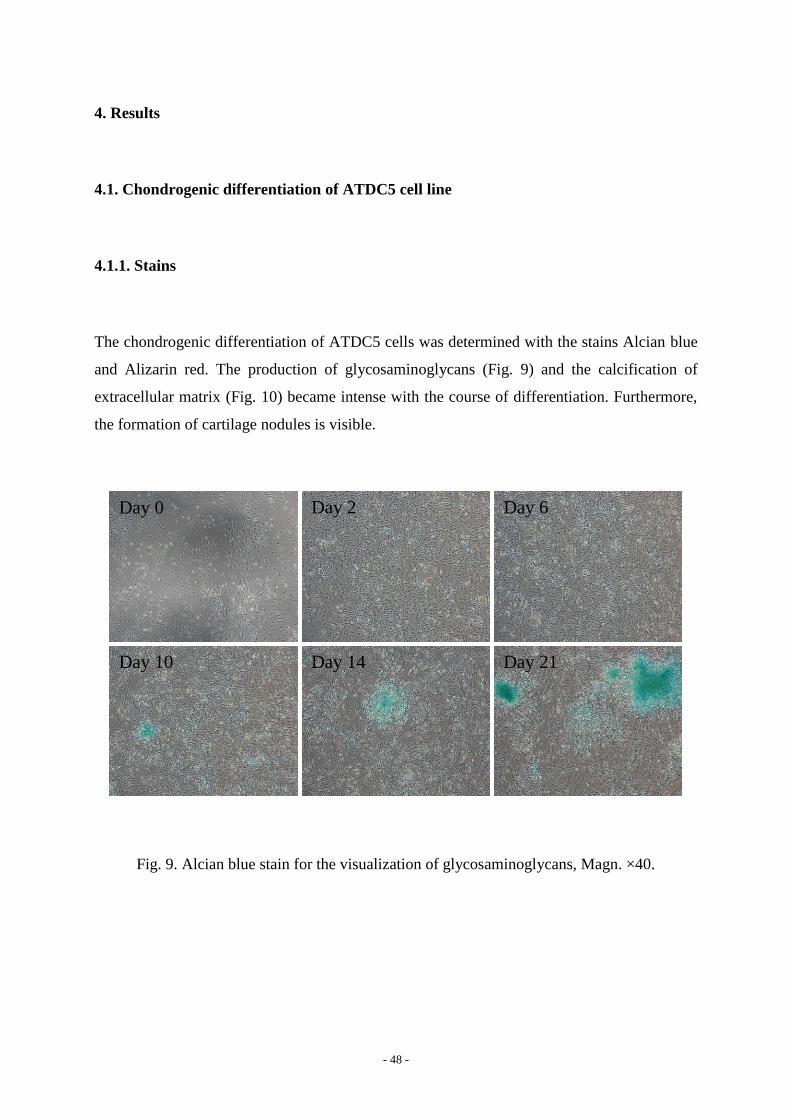
The chondrogenic differentiation of ATDC5 cells was determined with the stains Alcian blue
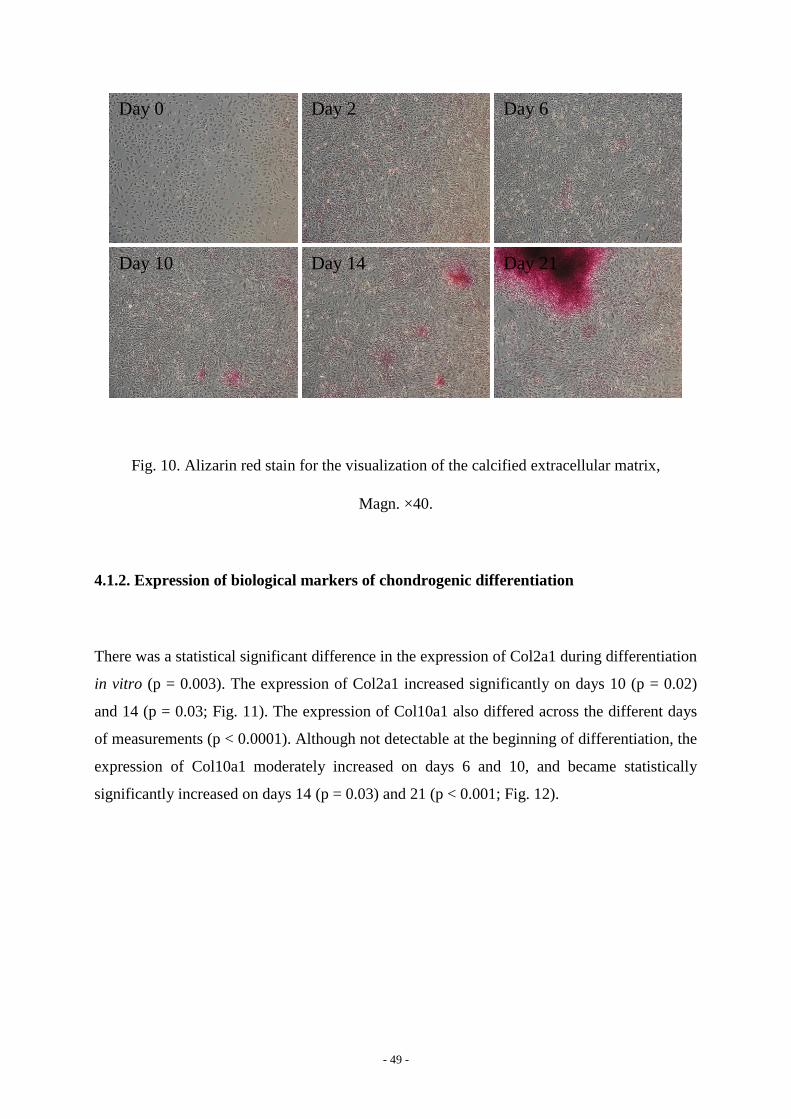
and Alizarin red. The production of glycosaminoglycans (Fig. 9) and the calcification of
extracellular matrix (Fig. 10) became intense with the course of differentiation. Furthermore,
the formation of cartilage nodules is visible.
Day 2 Day 6
Day 14 Day 10
Day 0
Day 21
Fig. 9. Alcian blue stain for the visualization of glycosaminoglycans, Magn. ×40.
- 49 -
Day 0 Day 2 Day 6
Day 10 Day 14 Day 21
Fig. 10. Alizarin red stain for the visualization of the calcified extracellular matrix,
Magn. ×40.
4.1.2. Expression of biological markers of chondrogenic differentiation
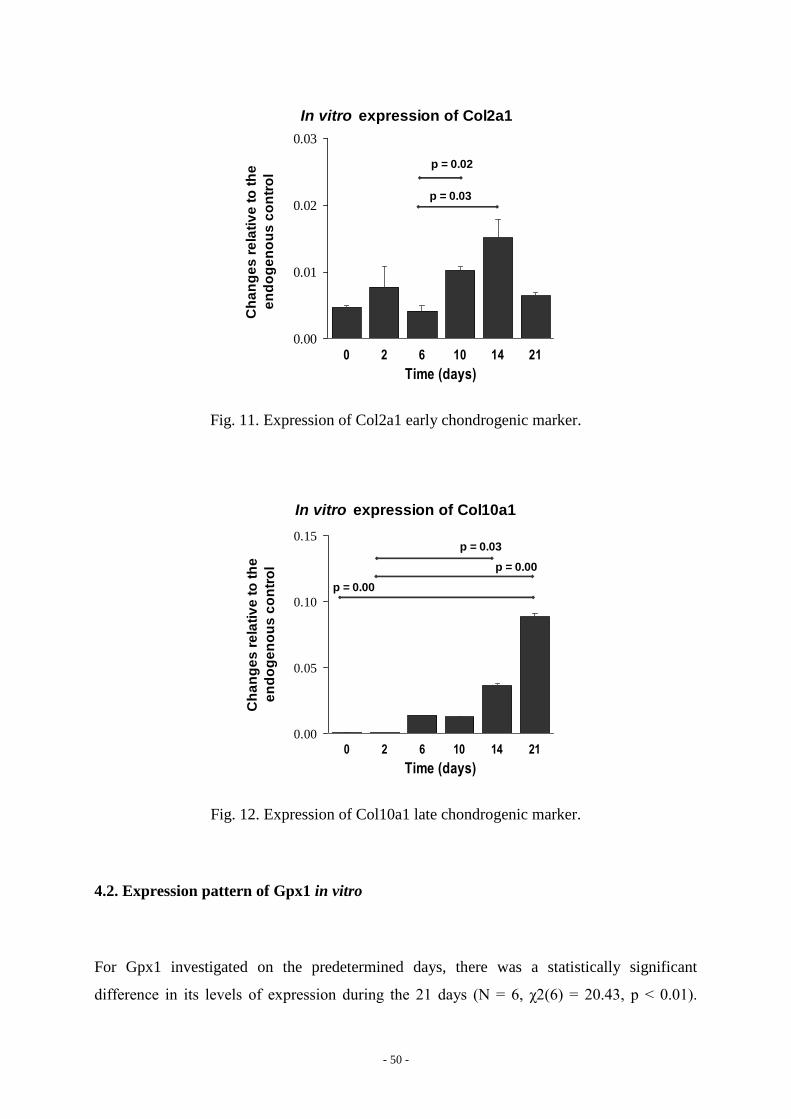
There was a statistical significant difference in the expression of Col2a1 during differentiation
in vitro (p = 0.003). The expression of Col2a1 increased significantly on days 10 (p = 0.02)
and 14 (p = 0.03; Fig. 11). The expression of Col10a1 also differed across the different days
of measurements (p < 0.0001). Although not detectable at the beginning of differentiation, the
expression of Col10a1 moderately increased on days 6 and 10, and became statistically
significantly increased on days 14 (p = 0.03) and 21 (p < 0.001; Fig. 12).
- 50 -
In vitro expression of Col2a1
0.00
0.01
0.02
0.03
0 2 6 10 14 21
Time (days)
p = 0.02
p = 0.03
Ch
an
ge
s r
ela
tiv
e t
o t
he
en
do
ge
no
us
co
ntr
ol
Fig. 11. Expression of Col2a1 early chondrogenic marker.
In vitro expression of Col10a1
0.00
0.05
0.10
0.15
0 2 6 10 14 21
Time (days)
p = 0.03
p = 0.00
p = 0.00
Ch
an
ge
s r
ela
tiv
e t
o t
he
en
do
ge
no
us
co
ntr
ol
Fig. 12. Expression of Col10a1 late chondrogenic marker.
4.2. Expression pattern of Gpx1 in vitro
For Gpx1 investigated on the predetermined days, there was a statistically significant
difference in its levels of expression during the 21 days (N = 6, χ2(6) = 20.43, p < 0.01).
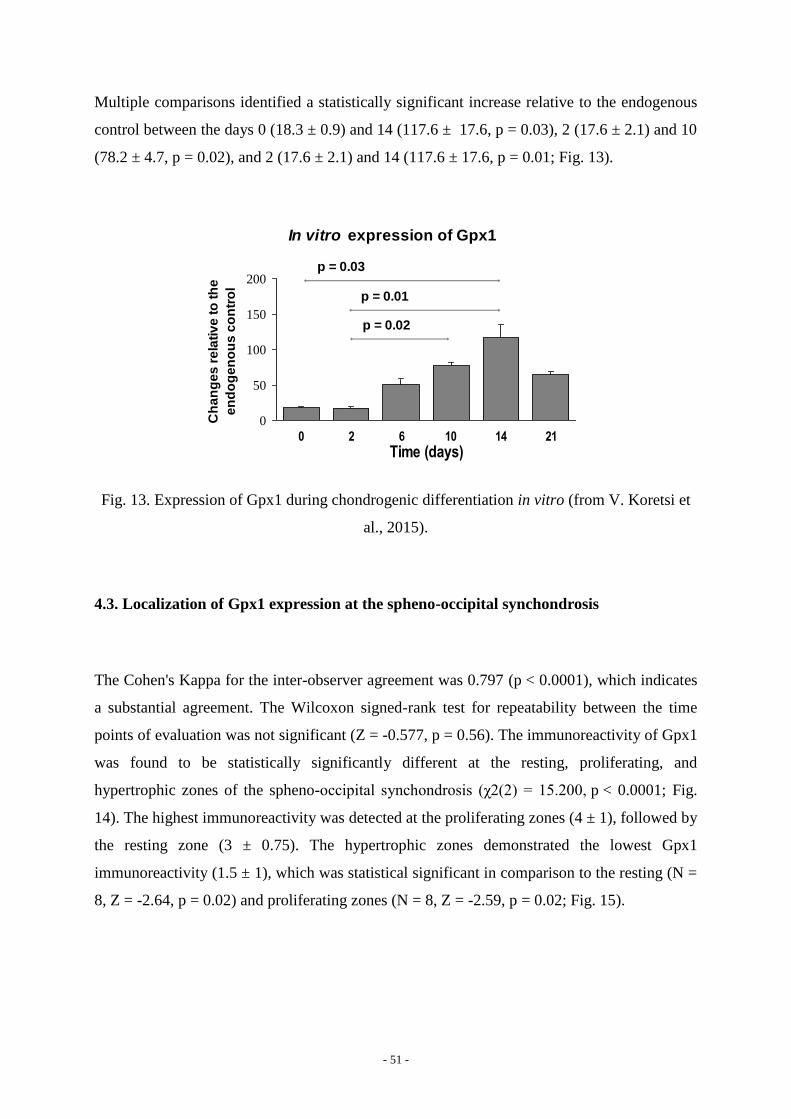
- 51 -
Multiple comparisons identified a statistically significant increase relative to the endogenous
control between the days 0 (18.3 ± 0.9) and 14 (117.6 ± 17.6, p = 0.03), 2 (17.6 ± 2.1) and 10
(78.2 ± 4.7, p = 0.02), and 2 (17.6 ± 2.1) and 14 (117.6 ± 17.6, p = 0.01; Fig. 13).
C
ha
ng
es
re
lati
ve
to
th
e
en
do
ge
no
us
co
ntr
ol
0
50
100
150
200
0 2 6 10 14 21
Time (days)
p = 0.03
p = 0.01
p = 0.02
In vitro expression of Gpx1
Fig. 13. Expression of Gpx1 during chondrogenic differentiation in vitro (from V. Koretsi et
al., 2015).
4.3. Localization of Gpx1 expression at the spheno-occipital synchondrosis
The Cohen's Kappa for the inter-observer agreement was 0.797 (p < 0.0001), which indicates
a substantial agreement. The Wilcoxon signed-rank test for repeatability between the time
points of evaluation was not significant (Z = -0.577, p = 0.56). The immunoreactivity of Gpx1
was found to be statistically significantly different at the resting, proliferating, and
hypertrophic zones of the spheno-occipital synchondrosis (χ2(2) = 15.200, p < 0.0001; Fig.
14). The highest immunoreactivity was detected at the proliferating zones (4 ± 1), followed by
the resting zone (3 ± 0.75). The hypertrophic zones demonstrated the lowest Gpx1
immunoreactivity (1.5 ± 1), which was statistical significant in comparison to the resting (N =
8, Z = -2.64, p = 0.02) and proliferating zones (N = 8, Z = -2.59, p = 0.02; Fig. 15).

- 52 -
Fig. 14. Gpx1 immunoreactivity at the spheno-occipital synchondrosis of the rat, left:
negative control, Magn. ×200 (adapted from V. Koretsi et al., 2015).
Hypertrophic
chondrocytes
Resting
chondrocytes
Proliferating
chondrocytes
Imm
unore
activity
Semiquantification of Gpx1 immunoreactivity
Fig. 15. Semiquantification of Gpx1 immunoreactivity at the spheno-occipital synchondrosis
of the rat (adapted from V. Koretsi et al., 2015).
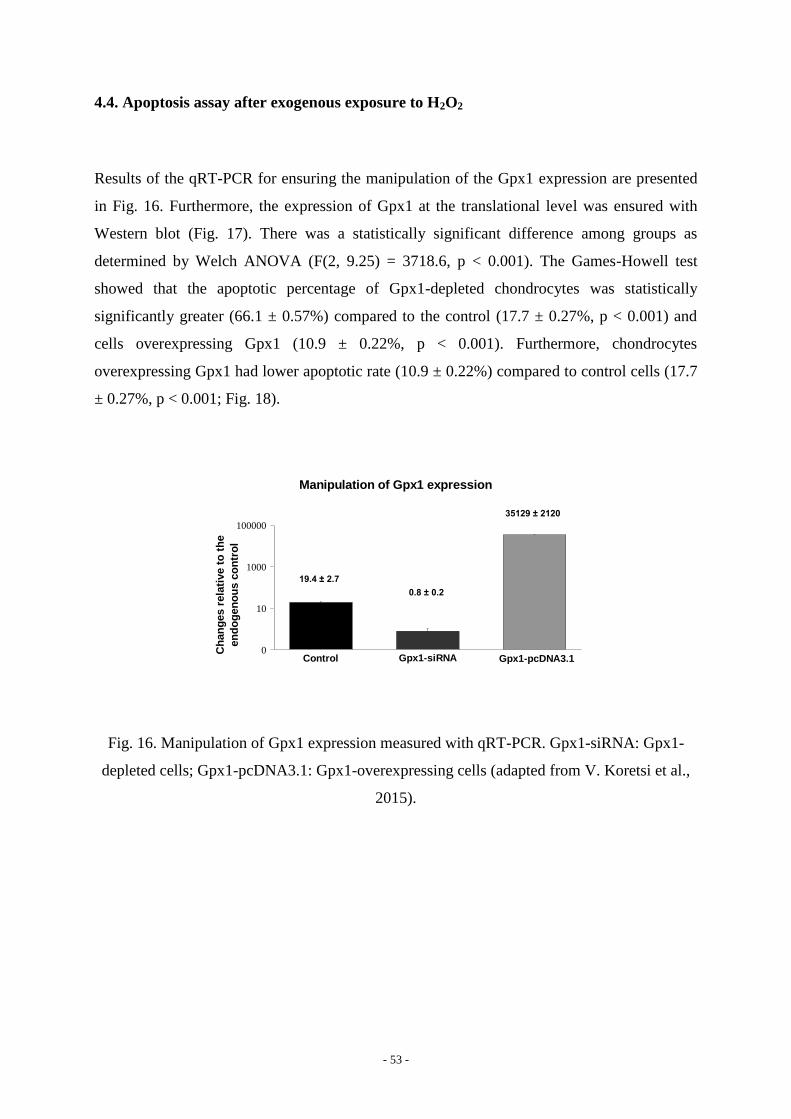
- 53 -
4.4. Apoptosis assay after exogenous exposure to H2O2
Results of the qRT-PCR for ensuring the manipulation of the Gpx1 expression are presented
in Fig. 16. Furthermore, the expression of Gpx1 at the translational level was ensured with
Western blot (Fig. 17). There was a statistically significant difference among groups as
determined by Welch ANOVA (F(2, 9.25) = 3718.6, p < 0.001). The Games-Howell test
showed that the apoptotic percentage of Gpx1-depleted chondrocytes was statistically
significantly greater (66.1 ± 0.57%) compared to the control (17.7 ± 0.27%, p < 0.001) and
cells overexpressing Gpx1 (10.9 ± 0.22%, p < 0.001). Furthermore, chondrocytes
overexpressing Gpx1 had lower apoptotic rate (10.9 ± 0.22%) compared to control cells (17.7
± 0.27%, p < 0.001; Fig. 18).
Manipulation of Gpx1 expression
0
10
1000
100000
Ch
an
ges r
ela
tive t
o t
he
en
do
gen
ou
s c
on
tro
l
35129 ± 2120
19.4 ± 2.7
Control Gpx1-siRNA Gpx1-pcDNA3.1
0.8 ± 0.2
Fig. 16. Manipulation of Gpx1 expression measured with qRT-PCR. Gpx1-siRNA: Gpx1-
depleted cells; Gpx1-pcDNA3.1: Gpx1-overexpressing cells (adapted from V. Koretsi et al.,
2015).

- 54 -
Fig. 17. Manipulation of Gpx1 expression measured with Western blot. Reference using as
loading control β-actin (above) and ATDC5 cells under depletion or overexpression of Gpx1
(below). Gpx1-siRNA: Gpx1-depleted cells; Gpx1-pcDNA3.1: Gpx1-overexpressing cells.
Pro
pid
ium
io
did
e
Annexin V
Control
+ 250 µM H2O2, 6 h
Gpx1-siRNA
+ 250 µM H2O2, 6 h
Gpx1-pcDNA3.1
+ 250 µM H2O2, 6 h
Apoptosis after manipulation of Gpx1 expression (250 μΜ
H2O2, 6 h)
0
20
40
60
80
Ap
op
toti
c c
ell
s (
%)
p < 0.001
p < 0.001
p < 0.001
Gpx1-siRNA Gpx1-pcDNA3.1 Control
Fig. 18. Apoptotic cells after exposure to H2O2. Gpx1-siRNA: Gpx1-depleted cells; Gpx1-
pcDNA3.1: Gpx1-overexpressing cells; Q1: dead cells; Q2: apoptotic cells; Q3: live cells;
Q4: early apoptotic cells (adapted from V. Koretsi et al., 2015).
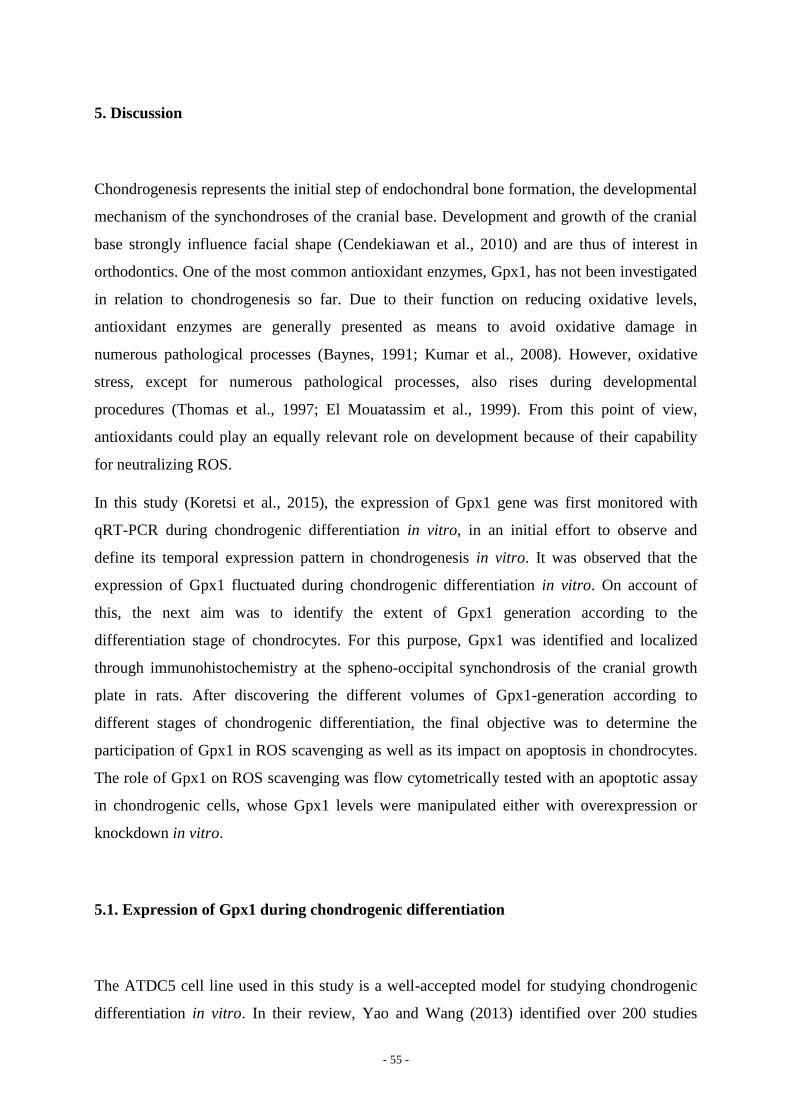
- 55 -
5. Discussion
Chondrogenesis represents the initial step of endochondral bone formation, the developmental
mechanism of the synchondroses of the cranial base. Development and growth of the cranial
base strongly influence facial shape (Cendekiawan et al., 2010) and are thus of interest in
orthodontics. One of the most common antioxidant enzymes, Gpx1, has not been investigated
in relation to chondrogenesis so far. Due to their function on reducing oxidative levels,
antioxidant enzymes are generally presented as means to avoid oxidative damage in
numerous pathological processes (Baynes, 1991; Kumar et al., 2008). However, oxidative
stress, except for numerous pathological processes, also rises during developmental
procedures (Thomas et al., 1997; El Mouatassim et al., 1999). From this point of view,
antioxidants could play an equally relevant role on development because of their capability
for neutralizing ROS.
In this study (Koretsi et al., 2015), the expression of Gpx1 gene was first monitored with
qRT-PCR during chondrogenic differentiation in vitro, in an initial effort to observe and
define its temporal expression pattern in chondrogenesis in vitro. It was observed that the
expression of Gpx1 fluctuated during chondrogenic differentiation in vitro. On account of
this, the next aim was to identify the extent of Gpx1 generation according to the
differentiation stage of chondrocytes. For this purpose, Gpx1 was identified and localized
through immunohistochemistry at the spheno-occipital synchondrosis of the cranial growth
plate in rats. After discovering the different volumes of Gpx1-generation according to
different stages of chondrogenic differentiation, the final objective was to determine the
participation of Gpx1 in ROS scavenging as well as its impact on apoptosis in chondrocytes.
The role of Gpx1 on ROS scavenging was flow cytometrically tested with an apoptotic assay
in chondrogenic cells, whose Gpx1 levels were manipulated either with overexpression or
knockdown in vitro.
5.1. Expression of Gpx1 during chondrogenic differentiation
The ATDC5 cell line used in this study is a well-accepted model for studying chondrogenic
differentiation in vitro. In their review, Yao and Wang (2013) identified over 200 studies
- 56 -
utilizing the ATDC5 cell line to investigate bone formation. According to Altaf et al. (2006),
the addition of vitamin C in the culture medium advances the differentiation of ATDC5 cells.
In particular, an increase in biological markers of hypertrophic differentiation was observed
within 7-10 days of administration of differentiation medium in experimental as compared to
the control cultures. Therefore, it was concluded that hypertrophy occurs faster in ATDC5
cells growing in media additionally supplemented with vitamin C. In fact, that was not
surprising, since vitamin C is widely recognised as a promoter of differentiation in other types
of cells as well (Franceschi et al., 1994; Takahashi et al., 2003). Hence, it was decided to
include vitamin C to medium composition in order to avoid a shift in medium and CO2
concentration previously needed for inducing differentiation in ATDC5 cells (Shukunami et
al., 1997).
The proposed mechanism of promoting differentiation through the addition of vitamin C in
the medium is the formation of collagenous matrix, which in turn activates the ERK
signalling pathway needed for differentiation (Temu et al., 2010). Except for vitamin C, the
composition of the medium was as previously described (Shukunami et al., 1997). The
differentiation of ATDC5 cells was verified with stains and expression of biological markers
in this study. The colour intensity of the stains revealing proteoglycans and calcium in the
matrix was increased during differentiation, while signs of cell aggregation were detected
from day 10. On day 21, large cell condensations (cartilage nodules) were visible. These
characteristics are consistent with cells undergoing chondrogenic differentiation (Shukunami
et al., 1996; Shukunami et al., 1997). An emphasis must be put on the simultaneous increase
in colour intensity for both stains, indicating that in vitro culture systems are difficult to be
synchronised at the same differentiation stage (Pruszak et al., 2007). This practically means
that proliferating and hypertrophic chondrocytes coexist in the same culture.
The aforementioned characteristic of the in vitro culture systems has an influence on the
expression of chondrogenic biological markers too. The expression of Col2a1 reached a peak
on day 14, while Col10a1 on day 21. These findings are similar to those of Altaf et al. (2006),
who utilised the same medium. However, the expression of Col10a1 was hardly detectable at
the beginning and became visible from day 6 onwards, possibly indicating that hypertrophy in
some cells began from that timepoint.
Hence, it could be assumed that the increase in Gpx1 expression between the days 6 and 14
coincided the hypertrophic status of some cells in the culture. However, this could serve only

- 57 -
as an estimate and not as a conclusion. On the contrary, the reliably drawn conclusion is that
Gpx1 expression is not of constitutive nature during chondrogenic differentiation.
5.2. Hypertrophic chondrocytes have the lowest Gpx1-immunoreactivity
As opposed to the aforementioned limitation of in vitro conditions, ex vivo experiments can
provide with a more realistic point of view. Therefore, the expression of Gpx1 was identified
and localized at the spheno-occipital synchondrosis of rats. The potentiality of localizing the
expression of Gpx1 at a specific differentiation stage increases with immunohistochemistry
because the clearly distinct arrangement of chondrocytes in regard to their differentiation
stage is preserved in the samples under investigation.
Moreover, the frequently occurring variation in cellular transcriptome and proteome must be
considered as a potential threat to the interpretation of gene expression data. Post-
transcriptional processing, mRNA degradation, and post-translational regulation strongly
affect the cellular concentrations of proteins. The squared Pearson correlation coefficient
between protein levels and their corresponding mRNA abundances amounted approximately
0.40 for both bacteria and eukaryotes. This finding shows that 60% of the variation in protein
levels can not be explained by knowing mRNA concentrations (Vogel and Marcotte, 2012).
In addition, a modest correlation between mRNA and protein levels was reported for mouse
(Ghazalpour et al., 2011). These data suggest that the concordance between transcriptome and
proteome must not be taken for granted. Provided that cell function is dictated by proteins,
immunohistochemistry is more reliable than the identification of genes, since it reveals the
expression of proteins.
The semiquantitative results of the Gpx1 protein expression at the spheno-occipital
synchondrosis of the rat show that proliferative chondrocytes have the highest Gpx1
immunoreactivity, followed by resting chondrocytes. The lowest levels of Gpx1
immunoreactivity were identified in hypertrophic chondrocytes. Similar to the present
findings, lower activity of SOD, Gpx4, and catalase has been reported for hypertrophic
chondrocytes compared to other stages of chondrogenic differentiation (Matsumoto et al.,
1991; Fragonas et al., 1998). The lower expression of antioxidant enzymes leads to higher
levels of ROS in hypertrophic compared to proliferating or resting chondrocytes, as

- 58 -
previously reported (Morita et al., 2007). NADPH oxidases 1 and 2 contribute to ROS levels
during hypertrophy, since they were highly expressed in prehypertrophic and hypertrophic
chondrocytes (Kim et al., 2010). Especially the depletion of NADPH oxidase 2 resulted in
abnormal chondrogenic differentiation (Kim et al., 2010). Finally, ROS elevation inhibits
proliferation and initiates hypertrophy of chondrocytes (Morita et al., 2007). This could match
the present results, as proliferating zones demonstrated the highest Gpx1 immunoreactivity
and hypertrophic zones the lowest one.
However, immunohistochemical detection is accompanied by specific limitations. It is
considered a semiquantitative method based on observer’s visual scoring and, as such, is
subjective (Taylor and Levenson, 2006), which in turn leads to inter- and intra-observer
variability. Nevertheless, although computer-assisted quantification works faster, it is not
always associated with better results (Matos et al., 2006; Ong et al., 2010). In the present
study, an effort was made to account for inter- and intra-observer variability. The inter-
observer agreement was found to be substantial and the intra-observer variability was not
statistically significant.
5.3. Gpx1 plays a vital role on H2O2-induced apoptosis in chondrocytes
After determining the distribution pattern of Gpx1 protein expression at the spheno-occipital
synchondrosis, the effect of Gpx1 on chondrocytes was investigated in vitro. Provided that
Gpx1 catalyses the reaction 2GSH + H2O2 → GSSG + 2H2O (Kulinsky and Kolesnichenko,
2009), ATDC5 cells were treated with 250 µM H2O2. To define the role of Gpx1 on H2O2
scavenging, three groups were established: Gpx1-overexpressing cells, Gpx1-knockdown
cells, and control cells. The apoptotic percentage of cells was then flow-cytometrically
measured with FITC-labelled Annexin V in conjunction with PI dye.
Annexin V as a means to detect apoptosis was first described by Koopman et al. (1994). It
demonstrates high affinity to membrane phospholipid phosphatidylserine (Andree et al.,
1990), which is translocated from the internal to the external cellular environment (Fadok et
al., 1992) in apoptotic cells. The PI dye is simultaneously used for discriminating between
dead and apoptotic cells (van Engeland et al., 1998). This procedure has certain advantages,
one of the most important being the detection of the early stages of apoptosis through changes
- 59 -
of the cell surface. DNA-associated changes occur rather late in apoptosis and assays
detecting those changes are thus less precise than Annexin V (Zhang et al., 1997). Further,
fluorescence of the samples was quantified with flow cytometry. Flow cytometry is an
accurate method for quantifying fluorescence and presents advantages over fluorescence
microscopy, namely flow cytometry is more objective, reproducible, and sensitive (Bolaños et
al., 1988; Torous et al., 2003; Muratori et al., 2008).
Results obtained with the aforementioned method revealed that Gpx1 is necessary for
chondrocytes, since Gpx1-depleted chondrocytes essentially underwent apoptosis at the
highest percentage under H2O2 exposure. On the contrary, Gpx1-overexpressing chondrocytes
had the lowest apoptotic percentage. These results are suggestive of the vital role of Gpx1 on
H2O2 scavenging and, consequently, H2O2-induced apoptosis in chondrocytes.
However, Gpx1 is not the only one source of H2O2 degradation. Catalase also belongs to the
antioxidant enzymatic defence system and reduces H2O2 according to the following reaction:
2H2O2 → 2H2O + O2 (Kalyanaraman, 2013). Therefore, the role of catalase on H2O2-induced
apoptosis needs elucidation in chondrocytes, although catalase was shown to be inactivated
(Lardinois et al., 1996; Baud et al., 2004) in the presence of high concentrations of H2O2. In
addition to this, catalase seemed to be dependent on Gpx1 activity to prevent its inactivation
at high concentrations of H2O2 (Baud et al., 2004).

- 60 -
6. Summary
Orthodontics deals with the correction of skeletal anomalies of the face occurring in the form
of jaw discrepancies. There is an abundance of findings in the literature that the development
and growth of the cranial base influence facial shape and jaw discrepancies. Cranial base
develops by the mechanism of endochondral ossification taking place at its midline axis,
where all the synchondroses are located. Chondrogenesis is the initial and indispensable part
of endochondral bone formation. In the light of evidence underlying the need of reactive
oxygen species in the regulation of chondrogenesis, this study aimed to investigate the
ubiquitously present antioxidant enzyme Gpx1 and its contribution to redox regulation in
chondrogenesis.
Provided that the levels of oxidative stress were previously found to fluctuate according to the
differentiation stage of chondrocytes, the gene expression of Gpx1 was measured with
quantitative RT-PCR during chondrogenic differentiation. For this purpose, the chondrogenic
cell line ATDC5 was utilized and cultured for 21 days. The time points of measurements were
on days 0, 2, 6, 10, 14, and 21. The chondrogenic differentiation of the utilized cell line was
determined with the stains Alcian blue and Alizarin red, and with the gene expression of
chondrogenic biological markers Col2a1 and Col10a1. The present results suggest that the
expression of Gpx1 is not of constitutive nature during chondrogenic differentiation.
Taking this as a starting point, the next step was to quantitatively assess the distribution
pattern of Gpx1 at the different differentiation stages of chondrogenesis. To examine this, the
spheno-occipital synchondrosis from eight newborn male Wistar rats was isolated and
samples were processed for formaldehyde-fixed paraffin-embedded immunohistochemistry.
Photographs of the immunostained sections were analysed by two independent observers and
a five-grade semiquantitative scale was used to assess Gpx1 immunoreactivity at the
synchondrosis. The present findings show that Gpx1 is expressed the most at the proliferative
differentiation stage and the lowest at the hypertrophic differentiation stage. Existing
literature reports that an increase in oxidative levels is needed for inhibition of proliferation
and initiation of hypertrophy. Further, chondrocytes at the hypertrophic stage have the highest
levels of ROS compared to other differentiation stages. In this context, the present results
implied that Gpx1 is involved in redox regulation in chondrogenesis.
- 61 -
To pursue this further, the expression of Gpx1 was manipulated in ATDC5 chondrogenic cells
and cells were then exposed to exogenous H2O2. The manipulation of Gpx1 expression
included overexpression and silencing. A control group was also included. The apoptotic
percentage of cells was measured flow cytometrically with FITC-labelled Annexin V in
conjunction with PI dye. The highest apoptotic percentage was observed in Gpx1-depleted
chondrocytes, followed by the control group. The lowest apoptotic percentage was presented
in Gpx1-overexpressing cells. These results indicate that Gpx1 possesses an active role on the
cellular enzymatic antioxidant system of chondrocytes and can regulate the cellular redox
state by H2O2 scavenging. Furthermore, its presence in chondrocytes can prevent H2O2-
induced apoptosis.
The contribution of cranial base growth to craniofacial morphology continues until adulthood,
since spheno-occipital synchondrosis is the last of the synchondroses to ossify and is active
until then. This study localizes the expression of Gpx1 at the spheno-occipital synchondrosis
and documents the role of Gpx1 as a redox regulator in chondrocytes.

- 62 -
7. Zusammenfassung
Die Kieferorthopädie befasst sich mit der Prävention, Diagnostik und Therapie von
Skelettanomalien des Gesichts, welche in Form von Kieferfehlstellungen auftreten. Eine Fülle
von Forschungsergebnissen besagt, dass die Entwicklung und das Wachstum der Schädelbasis
die Gesichtsform und damit Kieferfehlstellungen beeinflussen. Die Schädelbasis entwickelt
durch den Mechanismus der enchondralen Ossifikation, die an ihrer mittleren Achse
stattfindet, wo sich alle Synchondrosen befinden. Chondrogenese ist der erste und
unverzichtbare Bestandteil der enchondralen Ossifikation. Angesichts der Beweise für die
Notwendigkeit der reaktiven Sauerstoffspezies in der Regulation der Chondrogenese, sollte
diese Studie das allgegenwärtig vorhandene antioxidative Enzym Gpx1 und dessen Beitrag
zur Redoxregulation während der Chondrogenese untersuchen.
Vorausgesetzt, dass das Niveau von oxidativem Stress entsprechend dem
Differenzierungsstadium der Chondrozyten schwankt, wurde die Genexpression von Gpx1
mit quantitativer RT-PCR während der chondrogenen Differenzierung gemessen. Zu diesem
Zweck wurde die chondrogene Zelllinie ATDC5 verwendet und für 21 Tage kultiviert. Die
Messzeitpunkte wurden an den Tagen 0, 2, 6, 10, 14 und 21 ausgewählt. Die chondrogene
Differenzierung der verwendeten Zelllinie wurde mit den Färbungen Alcian-Blau und
Alizarin-Rot bestimmt und mit der Genexpression von chondrogenen biologischen Markern
Col2a1 und Col10a1 verglichen. Die vorliegenden Ergebnisse deuten darauf hin, dass die
Expression von Gpx1 nicht von konstitutiver Natur während der chondrogenen
Differenzierung ist.
Auf dieser Basis wurde das Verteilungsmuster von Gpx1 in den verschiedenen
Differenzierungsstadien der Chondrogenese näher untersucht. Die Synchondrosis spheno-
occipitalis wurde aus acht neugeborenen männlichen Wistar-Ratten isoliert. Die Proben
wurden für Formaldehyd-fixierte und Paraffin-eingebettete Immunhistochemie
weiterverarbeitet. Eine fünfstufige semiquantitative Skala wurde verwendet, um die Gpx1-
Immunreaktivität bei der Synchondrosis spheno-occipitalis zu bestimmen. Fotografien der
immungefärbten Abschnitte wurden von zwei unabhängigen Beobachtern bewertet. Die
vorliegenden Ergebnisse zeigen, dass Gpx1 am meisten bei den proliferativen Chondrozyten
und am wenigsten bei den hypertrophen Chondrozyten exprimiert wird. Existierende Literatur
berichtet, dass eine Erhöhung des oxidativen Niveaus für die Hemmung der Proliferation und
- 63 -
die Einleitung der Hypertrophie nötig ist. Weiterhin weisen Chondrozyten im hypertrophen
Stadium das höchste Niveau von ROS im Vergleich zu anderen Differenzierungsstadien auf.
In diesem Zusammenhang implizierten die vorliegenden Ergebnisse, dass Gpx1 an der
Redoxregulation während der Chondrogenese beteiligt ist.
Um dies weiter zu verfolgen, wurde die Expression von Gpx1 in ATDC5 chondrogenen
Zellen manipuliert und Zellen wurden dann exogenem H2O2 ausgesetzt. Die Manipulation der
Gpx1-Expression enthielt Überexpression und Silencing. Eine Kontrollgruppe wurde
ebenfalls eingeschlossen. Der apoptotische Prozentsatz der Zellen wurde
durchflusszytometrisch mit FITC-Annexin V und -Propidiumiodid-Färbung gemessen. Der
höchste apoptotische Prozentsatz wurde in Gpx1-ausgeschalteten Chondrozyten beobachtet,
gefolgt von der Kontrollgruppe. Der niedrigste apoptotische Prozentsatz wurde in Gpx1-
überexprimierenden Zellen präsentiert. Diese Ergebnisse zeigen, dass Gpx1 eine aktive Rolle
im zellulären enzymatischen Antioxidationssystem der Chondrozyten besitzt und den
zellulären Redoxzustand durch H2O2-Abbau regeln kann. Darüber hinaus kann seine Präsenz
in Chondrozyten H2O2-induzierte Apoptose verhindern.
Der Einfluss des Schädelbasiswachstums auf die kraniofaziale Morphologie bleibt bis ins
frühe Erwachsenenalter bestehen, da die Synchondrosis spheno-occipitalis bis dahin aktiv
bleibt. Diese Studie lokalisiert die Expression von Gpx1 an der Synchondrosis spheno-
occipitalis und dokumentiert die Rolle von Gpx1 als Redox-Regler in Chondrozyten.
- 64 -
8. References
Adams, C. S., Shapiro, I. M., 2002. The fate of the terminally differentiated chondrocyte:
evidence for microenvironmental regulation of chondrocyte apoptosis. Crit. Rev. Oral Biol.
Med. 13, 465-473.
Ahmed, Y. A., Tatarczuch, L., Pagel, C. N., Davies, H. M., Mirams, M., Mackie, E. J., 2007.
Physiological death of hypertrophic chondrocytes. Osteoarthr. Cartil. 15, 575-586.
Aitken, R. J., Roman, S. D., 2008. Antioxidant systems and oxidative stress in the testes.
Oxid. Med. Cell Longev. 1, 15-24.
Akiyama, H., Lyons, J. P., Mori-Akiyama, Y., Yang, X., Zhang, R., Zhang, Z., Deng, J. M.,
Taketo, M. M., Nakamura, T., Behringer, R. R., McCrea, P. D., de Crombrugghe, B., 2004.
Interactions between Sox9 and beta-catenin control chondrocyte differentiation. Genes Dev.
18, 1072-1087.
Altaf, F. M., Hering, T. M., Kazmi, N. H., Yoo, J. U., Johnstone, B., 2006. Ascorbate-
enhanced chondrogenesis of ATDC5 cells. Eur. Cell Mater. 12, 64-69.
Anagastopolou, S., Karamaliki, D. D., Spyropoulos, M. N., 1988. Observations on the growth
and orientation of the anterior cranial base in the human foetus. Eur. J. Orthod. 10, 143-148.
Anderson, D. R., 1964. The ultrastructure of elastic and hyaline cartilage of the rat. Am. J.
Anat. 114, 403-434.
Anderson, D., Popovich, F., 1983. Relation of cranial base flexure to cranial form and
mandibular position. Am. J. Phys. Anthropol. 61, 181-187.
Anderson, H. C., Sipe, J. B., Hessle, L., Dhanyamraju, R., Atti, E., Camacho, N. P., Millan, J.
L., 2004. Impaired calcification around matrix vesicles of growth plate and bone in alkaline
phosphatase-deficient mice. Am. J. Pathol. 164, 841-847.
Andrade, A. C., Nilsson, O., Barnes, K. M., Baron, J., 2007. Wnt gene expression in the post-
natal growth plate: regulation with chondrocyte differentiation. Bone 40, 1361-1369.
Andree, H. A., Reutelingsperger, C. P., Hauptmann, R., Hemker, H. C., Hermens, W. T.,
Willems, G. M., 1990. Binding of vascular anticoagulant alpha (VAC alpha) to planar
phospholipid bilayers. J. Biol. Chem. 265, 4923-4928.
- 65 -
Arnold, R.S., Shi, J., Murad, E., Whalen, A. M., Sun, C. Q., Polavarapu, R., Parthasarathy, S.,
Petros, J. A., Lambeth, J. D., 2001. Hydrogen peroxide mediates the cell growth and
transformation caused by the mitogenic oxidase Nox1. Proc. Natl. Acad. Sci. USA 98, 5550-
5555.
Atsumi, T., Miwa, Y., Kimata, K., Ikawa, Y., 1990. A chondrogenic cell line derived from a
differentiating culture of AT805 teratocarcinoma cells. Cell Diff. Dev. 30, 109-116.
Bacon, W., Eiller, V., Hildwein, M., Dubois, G., 1992. The cranial base in subjects with
dental and skeletal Class II. Eur. J. Orthod. 14, 224-228.
Baud, O., Greene, A. E., Li, J., Wang, H., Volpe, J. J., Rosenberg, P. A., 2004. Glutathione
peroxidase-catalase cooperativity is required for resistance to hydrogen peroxide by mature
rat oligodendrocytes. J. Neurosci. 24, 1531-1540.
Baynes, J. W., 1991. Role of oxidative stress in development of complications in
diabetes. Diabetes 40, 405-412.
Bjοrk, A., 1955. Cranial base development. Am. J. Orthod. 41, 198-225.
Bolaños, B., Bodón, Q., Jiménez, T., García-Mayol, D., Lavergne, J. A., Díaz, A. M., 1988.
Analysis by fluorescence microscopy and flow cytometry of monoclonal antibodies produced
against cell surface antigens. P. R. Health Sci. J. 7, 35-38.
Cai, H., 2005. Hydrogen peroxide regulation of endothelial function: origins, mechanisms,
and consequences. Cardiovasc. Res. 68, 26-36.
Cendekiawan, T., Wong, R. W., Rabie, A. B. M., 2010. Relationships between cranial base
synchondroses and craniofacial development: a review. Open Anat. J. 2, 67-75.
Chang, H. P., Chou, T. M., Hsieh, S. H., Tseng, Y. C., 2005. Cranial-base morphology in
children with class III malocclusion. Kaohsiung J. Med. Sci. 21, 159-165.
Chang, T. S., Cho, C. S., Park, S., Yu, S., Kang, S. W., Rhee, S. G., 2004. Peroxiredoxin III, a
mitochondrion-specific peroxidase, regulates apoptotic signaling by mitochondria. J. Biol.
Chem. 279, 41975-41984.
Chen, M., Zhu, M., Awad, H., Li, T. F., Sheu, T. J., Boyce, B. F., Chen, D., O’Keefe, R. J.,
2008. Inhibition of beta-catenin signaling causes defects in postnatal cartilage development. J.
Cell Sci. 121, 1455-1465.
- 66 -
Chen, Q., Espey, M. G., Krishna, M. C., Mitchell, J. B., Corpe, C. P., Buettner, G. R.,
Shacter, E., Levine, M., 2005. Pharmacologic ascorbic acid concentrations selectively kill
cancer cells: action as a pro-drug to deliver hydrogen peroxide to tissues. Proc. Natl. Acad.
Sci. USA 102, 13604-13609.
Choi, M. H., Lee, I. K., Kim, G. W., Kim, B. U., Han, Y. H., Yu, D. Y., Park, H. S., Kim, K.
Y., Lee, J. S., Choi, C., Bae, Y. S., Lee, B. I., Rhee, S. G., Kang, S. W., 2005. Regulation of
PDGF signalling and vascular remodelling by peroxiredoxin II. Nature 435, 347-353.
Chuang, C. Y., Lord, M. S., Melrose, J., Rees, M. D., Knox, S. M., Freeman, C., Iozzo, R. V.,
Whitelock, J. M., 2010. Heparan sulfate-dependent signaling of fibroblast growth factor 18 by
chondrocyte-derived perlecan. Biochemistry 49, 5524-5532.
Cobourne, M. T., DiBiase, A. T., 2010. Handbook of orthodontics, Mosby, Edinburgh.
Colnot, C. I., Helms, J. A., 2001. A molecular analysis of matrix remodeling and angiogenesis
during long bone development. Mech. Dev. 100, 245-250.
Colnot, C., Lu, C., Hu, D., Helms, J. A., 2004. Distinguishing the contributions of the
perichondrium, cartilage, and vascular endothelium to skeletal development. Dev. Biol. 269,
55-69.
Couly, G. F., Coltey, P. M., Le Douarin, N. M., 1993. The triple origin of skull in higher
vertebrates. Develop. 117, 409-429.
Covarrubias, L., Hernández-García, D., Schnabel, D., Salas-Vidal, E., Castro-Obregón, S.,
2008. Function of reactive oxygen species during animal development: passive or active?
Dev. Biol. 320, 1-11.
Davies, K. J., 2000. Oxidative stress, antioxidant defenses, and damage removal, repair, and
replacement systems. IUBMB Life 50, 279-289.
Deckers, M. M., Van Beek, E. R., Van Der Pluijm, G., Wetterwald, A., Van Der Wee-Pals,
L., Cecchini, M. G., Papapoulos, S. E., Lowik, C. W., 2002. Dissociation of angiogenesis and
osteoclastogenesis during endochondral bone formation in neonatal mice. J. Bone Min. Res.
17, 998-1007.
Dhopatkar, A., Bhatia, S., Rock, P., 2002. An investigation into the relationship between the
cranial base angle and malocclusion. Angle Orthod. 72, 456-463.
- 67 -
Dibbets, J. M. H., 1996. Morphological associations between the Angle classes. Eur. J.
Orthod. 18, 111-118.
Diewert, V. M., 1985. Development of human craniofacial morphology during the late
embryonic and early fetal periods. Am. J. Orthod. 88, 64-76.
Dröge, W., 2002. Free radicals in the physiological control of cell function. Physiol. Rev. 82,
47-95.
El Mouatassim, S., Guérin, P., Ménézo, Y., 1999. Expression of genes encoding antioxidant
enzymes in human and mouse oocytes during the final stages of maturation. Mol. Hum.
Reprod. 5, 720-725.
Enlow, D. H., 1968. The human face, Hoeber Medical Division, New York.
Enlow, D. H., 1990. Facial growth, Saunders, Philadelphia.
Enlow, D. H., Hans, M. G., 1996. Essentials of facial growth, Saunders, Philadelphia.
Enomoto, H., Enomoto-Iwamoto, M., Iwamoto, M., Nomura, S., Himeno, M., Kitamura, Y.,
Kishimoto, T., Komori, T., 2000. Cbfa1 is a positive regulatory factor in chondrocyte
maturation. J. Biol. Chem. 275, 8695-8702.
Enomoto-Iwamoto, M., Kitagaki, J., Koyama, E., Tamamura, Y., Wu, C., Kanatani, N.,
Koike, T., Okada, H., Komori, T., Yoneda, T., Church, V., Francis-West, P. H., Kurisu, K.,
Nohno, T., Pacifici, M., Iwamoto, M., 2002. The Wnt antagonist Frzb-1 regulates
chondrocyte maturation and long bone development during limb skeletogenesis. Dev. Biol.
251, 142-156.
Fadok, V. A., Voelker, D. R., Campbell, P. A., Cohen, J. J., Bratton, D. L., Henson, P. M.,
1992. Exposure of phosphatidylserine on the surface of apoptotic lymphocytes triggers
specific recognition and removal by macrophages. J. Immunol. 148, 2207-2216.
Fedde, K. N., Blair, L., Silverstein, J., Coburn, S. P., Ryan, L. M., Weinstein, R. S., Waymire,
K., Narisawa, S., Millan, J. L., MacGregor, G. R., Whyte, M. P., 1999. Alkaline phosphatase
knock-out mice recapitulate the metabolic and skeletal defects of infantile hypophosphatasia.
J. Bone Min. Res. 14, 2015-2026.
Flohé, L., Brigelius-Flohé, R., 2012. Selenoproteins of the Glutathione Peroxidase Family. In:
Hatfield, D. L., Berry, M. J., Gladyshev, V. N. (Ed.). Selenium. Springer, New York, 167-

- 68 -
180.
Forman, H. J., Fukuto, J. M., Torres, M., 2004. Redox signaling: thiol chemistry defines
which reactive oxygen and nitrogen species can act as second messengers. Am. J. Physiol.
Cell Physiol. 287, C246-256.
Fragonas, E., Pollesello, P., Mlinárik, V., Toffanin, R., Grando, C., Godeas, C., Vittur, F.,
1998. Sensitivity of chondrocytes of growing cartilage to reactive oxygen species. Biochim.
Biophys. Acta 1425, 103-111.
Franceschi, R. T., Iyer, B. S., Cui, Y., 1994. Effects of ascorbic acid on collagen matrix
formation and osteoblast differentiation in murine MC3T3-E1 cells. J. Bone Min. Res. 9, 843-
854.
Franchi, L., Baccetti, T., Stahl, F., McNamara Jr, J. A., 2007. Thin-plate spline analysis of
craniofacial growth in Class I and Class II subjects. Angle Orthod. 77, 595-601.
Gartland, A., Mason-Savas, A., Yang, M., MacKay, C. A., Birnbaum, M. J., Odgren, P. R.,
2009. Septoclast deficiency accompanies postnatal growth plate chondrodysplasia in the
toothless (tl) osteopetrotic, colony-stimulating factor-1 (CSF-1)-deficient rat and is partially
responsive to CSF-1 injections. Am. J. Pathol. 175, 2668-2675.
Gentili, C., Cancedda, R., 2009. Cartilage and bone extracellular matrix. Curr. Pharm. Des.
15, 1334-1348.
Ghazalpour, A., Bennett, B., Petyuk, V. A., Orozco, L., Hagopian, R., Mungrue, I. N., Farber,
C. R., Sinsheimer, J., Kang, H. M., Furlotte, N., Park, C. C., Wen, P. Z., Brewer, H., Weitz,
K., Camp, D. G. 2nd, Pan, C., Yordanova, R., Neuhaus, I., Tilford, C., Siemers, N.,
Gargalovic, P., Eskin, E., Kirchgessner, T., Smith, D. J., Smith, R. D., Lusis, A. J., 2011.
Comparative analysis of proteome and transcriptome variation in mouse. PLoS Genet. 7,
e1001393.
Giles, W. B., Philips, C. L., Joondeph, D. R., 1981. Growth in the basicranial synchondroses
of adolescent Macaca mullata. Anat. Rec. 19, 259-266.
Goldring, M. B., Tsuchimochi, K., Ijiri, K., 2006. The control of chondrogenesis. J. Cell
Biochem. 97, 33-44.
Grassel, S., Ahmed, N., 2007. Influence of cellular microenvironment and paracrine signals
on chondrogenic differentiation. Front. Biosci. 12, 4946-4956.

- 69 -
Heinegard, D., 2009. Proteoglycans and more – from molecules to biology. Int. J. Exp.
Pathol. 90, 575-586.
Henrikson, R. C., Kaye, G. I., Mazurkiewicz, J. E., 1997. Histology, Williams & Wilkins,
Baltimore.
Hofer, H., 1960. Studien zum Problem des Gestaltwandels des Schädels der Säugetiere,
insbesondere der Primaten: I. Die medianen Krümmungen des Schädels und ihre Erfassung
nach der Methode von Landzert. Z. Morphol. Anthropol. 50, 299-316.
Hofer, H., Spatz, W., 1963. Studien zum Problem des Gestaltwandels des Schädels der
Säugetiere, insbesondere der Primaten: II. Über die Kyphosen fetaler und neonater
Primatenschädel. Z. Morphol. Anthropol. 53, 29-52.
Hopkin, G. B., Houston, W. J. B., James, G. A., 1968. The cranial base as an etiological
factor in malocclusion. Angle Orthod. 38, 250-255.
Hoyte, D. A., 1991. The cranial base in normal and abnormal skull growth. Neurosurg. Clin.
N. Am. 2, 515-537.
Huang, W., Zhou, X., Lefebvre, V., de Crombrugghe, B., 2000. Phosphorylation of SOX9 by
cyclic AMP-dependent protein kinase A enhances SOX9’s ability to transactivate a Col2a1
chondrocyte-specific enhancer. Mol. Cell Biol. 20, 4149-4158.
Hurd, T. R., DeGennaro, M., Lehmann, R., 2012. Redox regulation of cell migration and
adhesion. Trends Cell Biol. 22, 107-115.
Inada, M., Wang, Y., Byrne, M. H., Rahman, M. U., Miyaura, C., Lopez-Otin, C., Krane, S.
M., 2004. Critical roles for collagenase-3 (Mmp13) in development of growth plate cartilage
and in endochondral ossification. Proc. Natl. Acad. Sci. USA 101, 17192-17197.
Kalyanaraman, B., 2013. Teaching the basics of redox biology to medical and graduate
students: Oxidants, antioxidants and disease mechanisms. Redox Biol. 1, 244-257.
Kerr, W. J. S., Hirst, D., 1987. Craniofacial characteristics of subjects with normal and
postnormal occlusions–a longitudinal study. Am. J. Orthod. Dentofac. Orthop. 92, 207-212.
Kim, K. S., Choi, H. W., Yoon, H. E., Kim, I. Y., 2010. Reactive oxygen species generated by
NADPH oxidase 2 and 4 are required for chondrogenic differentiation. J. Biol. Chem. 285,
40294-40302.
- 70 -
Kirsch, T., 2006. Determinants of pathological mineralization. Curr. Opin. Rheumatol. 18,
174-180.
Kirsch, T., Nah, H. D., Shapiro, I. M., Pacifici, M., 1997. Regulated production of
mineralization-competent matrix vesicles in hypertrophic chondrocytes. J. Cell Biol. 137,
1149-1160.
Kishimoto, K., Kitazawa, R., Kurosaka, M., Maeda, S., Kitazawa, S., 2006. Expression
profile of genes related to osteoclastogenesis in mouse growth plate and articular cartilage.
Histochem. Cell Biol. 125, 593-602.
Kjaer, I., 1990. Ossification of the human basicranium. J. Craniofac. Genet. Dev. Biol. 10, 29-
38.
Knußmann, R., 1988. Anthropologie. Handbuch der vergleichenden Biologie des Menschen.
Bd. 1/I, Fischer, Stuttgart.
Kobayashi, T., Soegiarto, D. W., Yang, Y., Lanske, B., Schipani, E., McMahon, A. P.,
Kronenberg, H. M., 2005. Indian hedgehog stimulates periarticular chondrocyte
differentiation to regulate growth plate length independently of PTHrP. J. Clin. Invest. 115,
1734-1742.
Komori, T., 2005. Regulation of skeletal development by the Runx family of transcription
factors. J. Cell Biochem. 95, 445-453.
Koopman, G., Reutelingsperger, C. P., Kuijten, G. A., Keehnen, R. M., Pals, S. T., Van Oers,
M. H., 1994. Annexin V for flow cytometric detection of phosphatidylserine expression on B
cells undergoing apoptosis. Blood 84, 1415-1420.
Koretsi, V., Kirschneck, C., Proff, P., Römer, P., 2015. Expression of glutathione peroxidase
1 in the spheno-occipital synchondrosis and its role in ROS-induced apoptosis. Eur. J. Orthod.
37, 308-313.
Koyama, E., Young, B., Nagayama, M., Shibukawa, Y., Enomoto-Iwamoto, M., Iwamoto,
M., Maeda, Y., Lanske, B., Song, B., Serra, R., Pacifici M., 2007. Conditional Kif3a ablation
causes abnormal hedgehog signaling topography, growth plate dysfunction, and excessive
bone and cartilage formation during mouse skeletogenesis. Develop. 134, 2159-2169.
Kulinsky, V. I., Kolesnichenko, L. S., 2009. The glutathione system. I. Synthesis, transport,
glutathione transferases, glutathione peroxidases. Biochem. (Mosc.) Suppl. Ser. B 3, 129-144.
- 71 -
Kumar, B., Koul, S., Khandrika, L., Meacham, R. B., Koul, H. K., 2008. Oxidative stress is
inherent in prostate cancer cells and is required for aggressive phenotype. Cancer Res. 68,
1777-1785.
Lander, H. M., 1997. An essential role for free radicals and derived species in signal
transduction. FASEB J. 11, 118-124.
Landis, J. R., Koch, G. G., 1977. The measurement of observer agreement for categorical
data. Biometrics 33, 159-174.
Lardinois, O. M., Mestdagh, M. M., Rouxhet, P. G., 1996. Reversible inhibition and
irreversible inactivation of catalase in presence of hydrogen peroxide. Biochim. Biophys.
Acta 1295, 222-238.
Le Douarin, N. M., Ziller, C., Couly, G. F., 1993. Patterning of neural crest derivatives in the
avian embryo: in vivo and in vitro studies. Dev. Biol. 159, 24-49.
Lefebvre, V., Behringer, R. R., de Crombrugghe, B., 2001. L-Sox5, Sox6 and Sox9 control
essential steps of the chondrocyte differentiation pathway. Osteoarthr. Cartil. 9 (Suppl. A),
S69-S75.
Lefebvre, V., Smits, P., 2005. Transcriptional control of chondrocyte fate and differentiation.
Birth Defects Res. C. Embryo Today 75, 200-212.
Li, J., Stouffs, M., Serrander, L., Banfi, B., Bettiol, E., Charnay, Y., Steger, K., Krause, K. H.,
Jaconi, M. E., 2006. The NADPH oxidase NOX4 drives cardiac differentiation: role in
regulating cardiac tran-scription factors and MAP kinase activation. Mol. Biol. Cell 17, 3978-
3988.
Lieberman, D. E., McCarthy, R. C., 1999. The ontogeny of cranial base angulation in humans
and chimpanzees and its implications for reconstructing pharyngeal dimensions. J. Hum.
Evol. 36, 487-517.
Lieberman, D. E., Ross, C. F., Ravosa, M. J., 2000. The primate cranial base: Ontogeny,
function, and integration. Am. J. Phys. Anthropol. 113, 117-169.
Little, C. B., Meeker, C. T., Hembry, R. M., Sims, N. A., Lawlor, K. E., Golub, S. B., Last,
K., Fosang, A. J., 2005. Matrix metalloproteinases are not essential for aggrecan turnover
during normal skeletal growth and development. Mol. Cell Biol. 25, 3388-3399.
- 72 -
Liu, Z., Xu, J., Colvin, J.S., Ornitz, D.M., 2002. Coordination of chondrogenesis and
osteogenesis by fibroblast growth factor 18. Genes Dev. 16, 859-869.
Lu, J., Holmgren, A., 2009. Selenoproteins. J. Biol. Chem. 284, 723-727.
Mackie, E. J., Ahmed, Y. A., Tatarczuch, L., Chen, K. S., Mirams, M., 2008. Endochondral
ossification: how cartilage is converted into bone in the developing skeleton. Int. J. Biochem.
Cell Biol. 40, 46-62.
Mackie, E. J., Tatarczuch, L., Mirams, M., 2011. The skeleton: A multi-functional complex
organ. The growth plate chondrocyte and endochondral ossification. J. Endocrinol. 211, 109-
121.
Maeda, Y., Nakamura, E., Nguyen, M. T., Suva, L. J., Swain, F. L., Razzaque, M. S.,
Mackem, S., Lanske, B., 2007. Indian hedgehog produced by postnatal chondrocytes is
essential for maintaining a growth plate and trabecular bone. PNAS 104, 6382-6387.
Mak, K. K., Kronenberg, H. M., Chuang, P. T., Mackem, S., Yang, Y., 2008. Indian
hedgehog signals independently of PTHrP to promote chondrocyte hypertrophy. Develop.
135, 1947-1956.
Matos, L. L. D., Stabenow, E., Tavares, M. R., Ferraz, A. R., Capelozzi, V. L., Pinhal, M. A.
D. S., 2006. Immunohistochemistry quantification by a digital computer-assisted method
compared to semiquantitative analysis. Clinics (São Paulo) 61, 417-424.
Matsumoto, H., Silverton, S. F., Debolt, K., Shapiro, I. M., 1991. Superoxide dismutase and
catalase activities in the growth cartilage: Relationship between oxidoreductase activity and
chondrocyte maturation. J. Bone Min. Res. 6, 569-574.
Mills, G. C., 1957. Hemoglobin catabolism. I. Glutathione peroxidase, an erythrocyte enzyme
which protects hemoglobin from oxidative breakdown. J. Biol. Chem. 229, 189-197.
Minina, E., Kreschel, C., Naski, M. C., Ornitz, D. M., Vortkamp, A., 2002. Interaction of
FGF, Ihh/Pthlh, and BMP signaling integrates chondrocyte proliferation and hypertrophic
differentiation. Dev. Cell 3, 439-449.
Minina, E., Wenzel, H. M., Kreschel, C., Karp, S., Gaffield, W., McMahon, A. P., Vortkamp,
A., 2001. BMP and Ihh/PTHrP signaling interact to coordinate chondrocyte proliferation and
differentiation. Develop. 128, 4523-4534.

- 73 -
Morita, K., Miyamoto, T., Fujita, N., Kubota, Y., Ito, K., Takubo, K., Miyamoto, K.,
Ninomiya, K., Suzuki, T., Iwasaki, R., Yagi, M., Takaishi, H., Toyama, Y., Suda, T., 2007.
Reactive oxygen species induce chondrocyte hypertrophy in endochondral ossification. J.
Exp. Med. 204, 1613-1623.
Mouakeh, M., 2001. Cephalometric evaluation of craniofacial pattern of Syrian children with
Class III malocclusion. Am. J. Orthod. Dentofac. Orthop. 119, 640-649.
Muratori, M., Forti, G., Baldi, E., 2008. Comparing flow cytometry and fluorescence
microscopy for analyzing human sperm DNA fragmentation by TUNEL labeling. Cytometry
73A, 785-787.
Nakamura, K., Shirai, T., Morishita, S., Uchida, S., Saeki-Miura, K., Makishima, F., 1999.
p38 mitogen-activated protein kinase functionally contributes to chondrogenesis induced by
growth/differentiation factor-5 in ATDC5 cells. Exp. Cell Res. 250, 351-363.
Netter, F. H., 2011. Atlas of human anatomy, Saunders/Elsevier, Philadelphia.
Ng, L. J., Wheatley, S., Muscat, G. E., Conway-Campbell, J., Bowles, J., Wright, E., Bell, D.
M., Tam, P. P., Cheah, K. S., Koopman, P., 1997. SOX9 binds DNA, activates transcription,
and coexpresses with type II collagen during chondrogenesis in the mouse. Dev. Biol. 183,
108-121.
Nilsson, O., Marino, R., De Luca, F., Phillip, M., Baron, J., 2005. Endocrine regulation of the
growth plate. Horm. Res. 64, 157-165.
Niswander, L., 2003. Pattern formation: Old models out on a limb. Nat. Rev. Genet. 4, 133-
143.
Noden, D. M., 1991. Cell movements and control of patterned tissue assembly during
craniofacial development. J. Craniofac. Genet. Dev. Biol. 11, 192-213.
Olsen, B. R., Reginato, A. M., Wang, W., 2000. Bone development. Ann. Rev. Cell Dev.
Biol. 16, 191-220.
Ong, C. W., Kim, L. G., Kong, H. H., Low, L. Y., Wang, T. T., Supriya, S., Kathiresan, M.,
Soong, R., Salto-Tellez, M., 2010. Computer-assisted pathological immunohistochemistry
scoring is more time-effective than conventional scoring, but provides no analytical
advantage. Histopathol. 56, 523-529.
- 74 -
Ornitz, D. M., 2005. FGF signaling in the developing endochondral skeleton. Cytokine
Growth Fac. Rev. 16, 205-213.
Ortega, N., Behonick, D. J., Werb, Z., 2004. Matrix remodeling during endochondral
ossification. Trends Cell Biol. 14, 86-93.
Otto, F., Thornell, A. P., Crompton, T., Denzel, A., Gilmour, K. C., Rosewell, I. R., Stamp,
G. W., Beddington, R. S., Mundlos, S., Olsen, B. R., Selby, P. B., Owen, M. J., 1997. Cbfa1,
a candidate gene for cleidocranial dysplasia syndrome, is essential for osteoblast
differentiation and bone development. Cell 89, 765-771.
Pass, C., MacRae, V. E., Ahmed, S. F., Farquharson, C., 2009. Inflammatory cytokines and
the GH/IGF-I axis: novel actions on bone growth. Cell Biochem. Funct. 27, 119-127.
Premkumar, S., 2011. Textbook of craniofacial growth, 1st ed., Jaypee Brothers Medical
Publishers, New Delhi.
Proff, P., Will, F., Bokan, I., Fanghänel, J., Gedrange, T., 2008. Cranial base features in
skeletal Class III patients. Angle Orthod. 78, 433-439.
Proffit, W. R., Fields, H. W., Sarver, D. M., 2007. Contemporary Orthodontics, Mosby
Elsevier, St. Louis.
Pruszak, J., Sonntag, K.-C., Aung, M. H., Sanchez-Pernaute, R., Isacson, O., 2007. Markers
and methods for cell sorting of human embryonic stem cell-derived neural cell populations.
Stem Cells 25, 2257-2268.
Rahman, I., Biswas, S. K., 2006. OXIDANTS AND ANTIOXIDANTS / Antioxidants,
Enzymatic. In: Laurent, G. J., Shapiro, S. D. (Ed.). Encyclopedia of Respiratory Medicine.
Academic Press, Oxford, 258-266.
Rhee, S. G., 1999. Redox signaling: hydrogen peroxide as intracellular messenger. Exp. Mol.
Med. 31, 53-59.
Rhee, S. G., Bae, Y. S., Lee, S. R., Kwon, J., 2000. Hydrogen peroxide: a key messenger that
modulates protein phosphorylation through cysteine oxidation. Sci. STKE 2000, pe1.
Rocher, C., Lalanne, J. L., Chaudière, J., 1992. Purification and properties of a recombinant
sulfur analog of murine selenium-glutathione peroxidase. Eur. J. Biochem. 205, 955-960.
Römer, P., Weingärtner, J., Roldán, J. C., Proff, P., Reicheneder, C., 2010. Development

- 75 -
dependent collagen gene expression in the rat cranial base growth plate. Ann. Anat. 192, 205-
209.
Sablina, A. A., Budanov, A. V., Ilyinskaya, G. V., Agapova, L. S., Kravchenko, J. E.,
Chumakov, P. M., 2005. The antioxidant function of the p53 tumor suppressor. Nat. Med. 11,
1306-1313.
Sandell, L. J., Nalin, A. M., Reife, R. A., 1994. Alternative splice form of type II procollagen
mRNA (IIA) is predominant in skeletal precursors and non-cartilaginous tissues during early
mouse development. Dev. Dyn. 199, 129-140.
Sauer, H., Rahimi, G., Hescheler, J., Wartenberg, M., 2000. Role of reactive oxygen species
and phosphatidylinositol 3-kinase in cardiomyocyte differentiation of embryonic stem cells.
FEBS Lett. 476, 218-223.
Schmittgen, T. D., Livak, K. J., 2008. Analyzing real-time PCR data by the comparative C(T)
method. Nat. Protoc. 3, 1101-1108.
Schultz, A. H., 1942. Conditions for balancing the head in primates. Am. J. Phys. Anthropol.
29, 483-497.
Scott, J. H., 1958. The cranial base. Am. J. Phys. Anthropol. 16, 319-348.
Shao, Y. Y., Wang, L., Ballock, R. T., 2006. Thyroid hormone and the growth plate. Rev.
Endocr. Metab. Disord. 7, 265-271.
Shukunami, C., Ishizeki, K., Atsumi, T., Ohta, Y., Suzuki, F., Hiraki, Y., 1997. Cellular
hypertrophy and calcification of embryonal carcinoma-derived chondrogenic cell line ATDC5
in vitro. J. Bone Min. Res. 12, 1174-1188.
Shukunami, C., Shigeno, C., Atsumi, T., Ishizeki, K., Suzuki, F., Hiraki, Y., 1996.
Chondrogenic differentiation of clonal mouse embryonic cell line ATDC5 in vitro:
Differentiation-dependent gene expression of parathyroid hormone (PTH)/PTH-related
peptide receptor. J. Cell Biol. 133, 457-468.
Singh, G. D., McNamara, J. A., Lozanoff, S., 1997. Finite element analysis of the cranial base
in subjects with Class III malocclusion. Br. J. Orthod. 24, 103-112.
Sperber, G. H., 1989. Craniofacial embryology, Wright, London.
Sperber, G. H., 2001. Craniofacial Development, B. C. Decker, Hamilton, Ont.
- 76 -
Stark, D., 1975. Embryologie, 3. Aufl. Thieme, Stuttgart.
Stevens, D. A., Hasserjian, R. P., Robson, H., Siebler, T., Shalet, S. M., Williams, G. R.,
2000. Thyroid hormones regulate hypertrophic chondrocyte differentiation and expression of
parathyroid hormone-related peptide and its receptor during endochondral bone formation. J.
Bone Min. Res. 15, 2431-2442.
Stickens, D., Behonick, D. J., Ortega, N., Heyer, B., Hartenstein, B., Yu, Y., Fosang, A. J.,
Schorpp-Kistner, M., Angel, P., Werb, Z., 2004. Altered endochondral bone development in
matrix metalloproteinase 13-deficient mice. Develop. 131, 5883-5895.
St-Jacques, B., Hammerschmidt, M., McMahon, A. P., 1999. Indian hedgehog signaling
regulates proliferation and differentiation of chondrocytes and is essential for bone formation.
Genes Dev. 13, 2072-2086.
Sun, J., Sun, Q., Lu, S., 2011. From selenoprotein to endochondral ossification: a novel
mechanism with microRNAs potential in bone related diseases? Med. Hypotheses 77, 807-
811.
Sundaresan, M., Yu, Z. X., Ferrans, V. J., Irani, K., Finkel, T., 1995. Requirement for
generation of H2O2 for platelet-derived growth factor signal transduction. Science 270, 296-
299.
Takahashi, T., Lord, B., Schulze, P. C., Fryer, R. M., Sarang, S. S., Gullans, S. R., Lee, R. T.,
2003. Ascorbic acid enhances differentiation of embryonic stem cells into cardiac
myocytes. Circulation 107, 1912-1916.
Taniguchi, N., Yoshida, K., Ito, T., Tsuda, M., Mishima, Y., Furumatsu, T., Ronfani, L.,
Abeyama, K., Kawahara, K., Komiya, S., Maruyama, I., Lotz, M., Bianchi, M. E., Asahara,
H., 2007. Stage-specific secretion of HMGB1 in cartilage regulates endochondral ossification.
Mol. Cell Biol. 27, 5650-5663.
Taylor, C. R., Levenson, R. M., 2006. Quantification of immunohistochemistry-issues
concerning methods, utility and semiquantitative assessment II. Histopathol. 49, 411-424.
Temu, T. M., Wu, K. Y., Gruppuso, P. A., Phornphutkul, C., 2010. The mechanism of
ascorbic acid-induced differentiation of ATDC5 chondrogenic cells. Am. J. Physiol.
Endocrinol. Metab. 299, E325-E334.
Thomas, M., Jain, S., Kumar, G. P., Laloraya, M., 1997. A programmed oxyradical burst

- 77 -
causes hatching of mouse blastocysts. J. Cell Sci. 110 (Pt 14), 1597-1602.
Toppo, S., Flohé, L., Ursini, F., Vanin, S., Maiorino, M., 2009. Catalytic mechanisms and
specificities of glutathione peroxidases: variations of a basic scheme. Biochim. Biophys. Acta
1790, 1486-1500.
Torous, D. K., Hall, N. E., Murante, F. G., Gleason, S. E., Tometsko, C. R., Dertinger, S. D.,
2003. Comparative scoring of micronucleated reticulocytes in rat peripheral blood by flow
cytometry and microscopy. Toxicol. Sci. 74, 309-314.
Tosatto, S. C., Bosello, V., Fogolari, F., Mauri, P., Roveri, A., Toppo, S., Flohé, L., Ursini, F.,
Maiorino, M., 2008. The catalytic site of glutathione peroxidases. Antioxid. Redox Signal. 10,
1515-1526.
Ursini, F., Maiorino, M., 2004. Glutathione Peroxidases. In: Lennarz, W. J., Lane, M. D.
(Ed.). Encyclopedia of Biological Chemistry. Elsevier, New York, 224-228.
Ushio-Fukai, M., 2006. Redox signaling in angiogenesis: role of NADPH oxidase.
Cardiovasc. Res. 71, 226-235.
Usui, M., Xing, L., Drissi, H., Zuscik, M., O’Keefe, R., Chen, D., Boyce, B. F., 2008. Murine
and chicken chondrocytes regulate osteoclastogenesis by producing RANKL in response to
BMP2. J. Bone Min. Res. 23, 314-325.
van der Earned, B. C., Karperien, M., Wit, J. M., 2003. Systemic and local regulation of the
growth plate. Endocr. Rev. 24, 782-801.
van Engeland, M., Nieland, L. J., Ramaekers, F. C., Schutte, B., Reutelingsperger, C. P.,
1998. Annexin V-affinity assay: a review on an apoptosis detection system based on
phosphatidylserine exposure. Cytometry 31, 1-9.
Vogel, C., Marcotte, E. M., 2012. Insights into the regulation of protein abundance from
proteomic and transcriptomic analyses. Nat. Rev. Genet. 13, 227-232.
Vortkamp, A., Lee, K., Lanske, B., Segre, G. V., Kronenberg, H. M., Tabin, C. J., 1996.
Regulation of rate of cartilage differentiation by Indian hedgehog and PTH-related protein.
Science 273, 613-622.
Wang, L., Shao, Y. Y., Ballock, R. T., 2007. Thyroid hormone interacts with the Wnt/beta–
catenin signaling pathway in the terminal differentiation of growth plate chondrocytes. J.
- 78 -
Bone Min. Res. 22, 1988-1995.
Wang, L., Shao, Y. Y., Ballock, R. T., 2010. Thyroid hormone-mediated growth and
differentiation of growth plate chondrocytes involves IGF-1 modulation of beta-catenin
signaling. J. Bone Min. Res. 25, 1138-1146.
Weise, M., De-Levi, S., Barnes, K. M., Gafni, R. I., Abad, V., Baron, J., 2001. Effects of
estrogen on growth plate senescence and epiphyseal fusion. PNAS 98, 6871-6876.
Williams, P. L., Bannister, L. H., Berry, M. M., Collins, P., Dyson, M., Dussek, J. E.,
Ferguson, M. W. J., 1995. Gray’s anatomy, Churchill Livingstone, Edinburgh.
Wuelling, M., Vortkamp, A., 2010. Transcriptional networks controlling chondrocyte
proliferation and differentiation during endochondral ossification. Pediatr. Nephrol. 25, 625-
631.
Yadav, M. C., Simao, A. M., Narisawa, S., Huesa, C., McKee, M. D., Farquharson, C.,
Millan, J. L., 2011. Loss of skeletal mineralization by the simultaneous ablation of
PHOSPHO1 and alkaline phosphatase function: a unified model of the mechanisms of
initiation of skeletal calcification. J. Bone Min. Res. 26, 286-297.
Yao, Y., Wang, Y., 2013. ATDC5: An excellent in vitro model cell line for skeletal
development. J. Cell Biochem. 114, 1223-1229.
Yoon, B. S., Lyons, K.M., 2004. Multiple functions of BMPs in chondrogenesis. J. Cell
Biochem. 93, 93-103.
Yoon, B. S., Ovchinnikov, D. A., Yoshii, I., Mishina, Y., Behringer, R. R., Lyons, K. M.,
2005. Bmpr1a and Bmpr1b have overlapping functions and are essential for chondrogenesis
in vivo. Proc. Natl. Acad. Sci. USA 102, 5062-5067.
Yoon, B. S., Pogue, R., Ovchinnikov, D. A., Yoshii, I., Mishina, Y., Behringer, R. R., Lyons,
K. M., 2006. BMPs regulate multiple aspects of growth-plate chondrogenesis through
opposing actions on FGF pathways. Develop. 133, 4667-4678.
Zhang, G., Gurtu, V., Kain, S. R., Yan, G., 1997. Early detection of apoptosis using a
fluorescent conjugate of annexin V. Biotechniques 23, 525-531.
List of figures
Fig. 1 The cartilages of the chondrocranium. 7
Fig. 2 The cranial fossae. 8
Fig. 3 The synchondroses of the cranial base. 9
Fig. 4 Early and terminal chondrogenic differentiation. 14
Fig. 5 The bipolar structure of the spheno-occipital synchondrosis of a rat. 15
Fig. 6 Redox regulation from antioxidant enzymes. 20
Fig. 7 Reduction cycle of Gpx1. 23
Fig. 8 Cranial base of 10 days old Wistar rat dissected for
immunohistochemistry. 40
Fig. 9 Alcian blue stain for the visualization of glycosaminoglycans. 48
Fig. 10 Alizarin red stain for the visualization of the calcified extracellular
matrix. 49
Fig. 11 Expression of Col2a1 early chondrogenic marker. 50
Fig. 12 Expression of Col10a1 late chondrogenic marker. 50
Fig. 13 Expression of Gpx1 during chondrogenic differentiation in vitro. 51
Fig. 14 Gpx1 immunoreactivity at the spheno-occipital synchondrosis of
the rat. 52
Fig. 15 Semiquantification of Gpx1 immunoreactivity at the spheno-
occipital synchondrosis of the rat. 52
Fig. 16 Manipulation of Gpx1 expression measured with qRT-PCR. 53
Fig. 17 Manipulation of Gpx1 expression measured with Western blot. 54
Fig. 18 Apoptotic cells after exposure to H2O2. 54

List of tables
Table 1 Consumables and their providers. 24
Table 2 Laboratory equipment and corresponding manufacturers. 25
Table 3 Materials for the cell culture. 27
Table 4 Materials for the RNA isolation. 27
Table 5 Materials for the cDNA. 28
Table 6 Materials for the qRT-PCR. 28
Table 7 Materials for the stains. 28
Table 8 Materials for the immunohistochemistry. 28
Table 9 Materials for the overexpression and knockdown of Gpx1. 29
Table 10 Materials for western blotting. 31
Table 11 Materials for the experiments on apoptosis. 33
Table 12 Protocol for passaging the cells. 34
Table 13 Protocol for determining the number of cells. 34
Table 14 Primers for the qRT-PCR used in this study. 37
Table 15 Composition of stacking and 15% running SDS-gel. 43
Table 16 Composition of SDS-running buffer, 1x. 44
Table 17 Composition of the transfer buffer, 1x. 45
Table 18 Composition of TBS-T, 1x. 45
List of abbreviations
°C Degree Celsius; temperature
AA Antibiotics and antimycotics
ALP Alkaline phosphatase
APS Ammonium persulfate
Asn Asparagine amino acid
BMP2 Bone morphogenetic protein-2
BMPs Bone morphogenetic proteins
cDNA Complementary DNA
CO2 Carbon dioxide
Col10a1 Collagen, type X, alpha 1
Col2a1 Collagen, type II, alpha 1
DNA Deoxyribonucleic acid
EDTA Ethylenediaminetetraacetic acid
ERKs Extracellular-signal-regulated kinases
FCS Fetal calf serum
FGFR3 Fibroblast growth factor receptor-3
FGFs Fibroblast growth factors
FITC Fluorescein isothiocyanate
g Gram; mass
GH Growth hormone / somatotropin
Gli Gli family of transcription factors
Gln Glutamine amino acid
Gpx1 Glutathione peroxidase-1
Gpx2 Glutathione peroxidase-2 (gastrointestinal)
Gpx3 Glutathione peroxidase-3 (plasma)
Gpx4 Glutathione peroxidase-4 (phospholipid hydroperoxidase)
Gpx5 Glutathione peroxidase-5 (epididymal androgen-related protein)
Gpxs Glutathione peroxidases
GSH Glutathione
GSSG Glutathione disulfide
h Hour; time
H2O Water
H2O2 Hydrogen peroxide
HCl Hydrogen chloride
HMGB1 High-mobility group protein B1
Hox Homeodomain
IGF1 Insulin-like growth factor-1
Ihh Indian hedgehog
JNKs c-Jun N-terminal kinases
LacZ β-galactosidase
LB medium Lysogeny broth medium
LDH Lactate dehydrogenase
M Molar; concentration
mA Milliampere; electric current
mg/ml Milligrams per millilitre; density
min Minute; time
ml Millilitre; volume
mM Millimolar; concentration
M-MLV Moloney murine leukemia virus
MMP13 Matrix metalloproteinase-13
MMP9 Matrix metalloproteinase-9
MMPs Matrix metalloproteinases
mRNA Messenger RNA
NaCl Sodium chloride
N-CAM Neural cell adhesion molecule
ng/μl Nanograms per microlitre; density
nM Nanomolar; concentration
nm Nanometre; wavelength
Nox4/1/2 Genes encoding NADPH oxidases
p38 p38 mitogen-activated protein kinases
PGF2a Prostaglandin-F2a
PGG2 Prostaglandin-G2
pH Measure of acidity or alkalinity
PHOSPHO1 Phosphatase, orphan-1
PI Propidium iodide
pmol/μl Picomoles per microlitre
Polr2a Polymerase (RNA) II (DNA directed) polypeptide A
PTHrP Parathyroid hormone-related protein
PTHrP-R Receptor of parathyroid hormone-related protein
PVDF Polyvinylidene fluoride
qRT-PCR Real time quantitative reverse transcription polymerase chain reaction
RANKL Receptor activator of nuclear factor kappa-B ligand
RNA Ribonucleic acid
ROOH Alkyl hydroperoxides
ROS Reactive oxygen species
rpm Revolutions per minute; frequency of rotation
Runx2 Runt-related transcription factor-2
SDS Sodium dodecyl sulfate
Se Selenium
Sec Selenocysteine
sec Second; time
Shh Sonic hedgehog
SOD Superoxide dismutases
Sox9 Transcription factor Sox9
T3 Triiodothyronine
Tak1 Transforming growth factor-β activated kinase-1
TBS-T Tris-buffered saline additionally containing Tween 20
TEMED Tetramethylethylenediamine
TGF-β Transforming growth factor-β
TNAP Tissue-nonspecific alkaline phosphatase
Tris Tris(hydroxymethyl)aminomethane
Trp Tryptophan amino acid
V Volt; voltage
VEGFs Vascular endothelial growth factors
Wnt Wnt signalling pathway
μg Microgram; mass
μg/ml Micrograms per millilitre; density
μl Microlitre; volume
μm Micrometre; length
μM Micromolar; concentration

Declaration of academic honesty / Eidesstattliche Erklärung
I herewith declare that the submitted dissertation has been composed by myself without any
inadmissible help and without the use of sources other than those given due reference in the
text and listed in the list of references. I further declare that all persons and institutions that
have directly or indirectly helped me with the preparation of the dissertation have been
acknowledged and that this dissertation has not been submitted, wholly or substantially, as an
examination document at any other institution.
Freiberg, 09.01.2016
Vasiliki Koretsi
Hiermit erkläre ich, dass ich die hier vorliegende Dissertation selbstständig verfasst und keine
anderen als die angegebenen Hilfsmittel benutzt habe. Die Dissertation ist bisher keiner
anderen Fakultät vorgelegt worden. Ich erkläre, dass ich bisher kein Promotionsverfahren
erfolglos beendet habe und dass eine Aberkennung eines bereits erworbenen Doktorgrades
nicht vorliegt.
Freiberg, 09.01.2016
Vasiliki Koretsi

Acknowledgements
I am very thankful to the director of the department, Professor Dr. Dr. Peter Proff, for offering
me the opportunity to conduct research at his department.
In addition, I would like to thank Priv. - Doz. Dr. Piero Römer for his scientific guidance,
which made this work possible.
A very special thanks to Professor Dr. Jochen Fanghänel for revising the manuscript and
providing vital advice.
I also wish to express my sincere gratitude to Mrs. Kathrin Bauer, who was generously
helpful and offered me valuable assistance, support, and guidance.
I thank Dr. Christian Kirschneck for providing statistical advice.
Last but not least, I would like to thank the members of my family for their invaluable support
and encouragement in every step of my life, without which I could not have been able to fulfil
my dreams.
Freiberg, 09.01.2016
Vasiliki Koretsi