investigation of flow control over the …€¦ · fluidic ted was different, ... thickness of 15%...
TRANSCRIPT

1
Abstract
The results of calculation and experimental
studies of efficiency of the compressed air jet
tangential blowing through a slot nozzle over
the supercritical airfoil upper surface to
suppress the shock-induced boundary layer
separation and the buffet at transonic speeds
are presented. Numerical simulations were
carried out on the basis of the unsteady
Reynolds averaged Navier-Stokes (URANS)
equations. Experimental studies of the
tangential jet blowing were performed in the
transonic wind tunnel T-112 of TsAGI. Results
show that the jet blowing moves the shock
downstream, increases lift, suppresses flow
separation under shock foot and delays buffet
onset.
1 Introduction
One of the most important and
complicated problems of the modern
aerodynamics is the problem of increasing flight
cruise speeds of subsonic civil transport aircraft.
The main obstacle on this way is an abrupt rise
of the wave drag and intensification of shock-
induced flow separation. Moreover, unsteady
interference of shock-wave with the separated
flow leads to the aircraft buffeting.
As a consequence, a delay in buffeting onset
could potentially lead to improved aerodynamic
performance characteristics. One of the ways to
delay buffet is the concept of flow control.
Different devices were investigated as the
means of buffet control. Mechanical vortex
generators (VGs) and special mechanical
trailing edge device (TED) which can change
rear loading of the airfoil were studied in [1].
Fluidic VGs (air-jet VGs) as well as fluidic
TED (jet near the trailing edge blown normally
to the airfoil pressure side) were studied in [2].
It was shown that mechanical and fluidic VGs
were able to delay buffet onset in the angle-of-
attack domain by suppressing separation
downstream of the shock. The effect of the
fluidic TED was different, the separation was
not suppressed. In this case, the buffet onset was
not delayed in the angle-of-attack domain, but
only in the lift domain.
The effective way to overcome the
problem is the concept of active flow control at
high subsonic Mach numbers by means of the
tangential jet blowing over the wing [3, 4]. To
suppress shock-induced flow separation the jet
of compressed air is blown from a slot nozzle
tangentially to the upper surface of the wing in
the area of the shock-wave position in front of
the expected flow separation.
In the present study, buffet control method
by tangential jet blowing is investigated. The jet
of compressed air is blown continuously from
the small slot nozzle tangentially to the upper
surface of the wing in the region of shock
location to reduce the shock-induced separation.
Experimental studies of the flow over transonic
supercritical airfoil with active flow control by
tangential jet blowing was carried out in the
transonic wind tunnel T-112 TsAGI with the
square test cross-section of 0.6x0.6 m2 and the
length of 2.59 m.
Numerical simulations were carried out
using the unsteady Reynolds averaged Navier-
Stokes (URANS) equations.
INVESTIGATION OF FLOW CONTROL OVER THE SUPERCRITICAL AIRFOIL BY TANGENTIAL JET
BLOWING AT TRANSONIC SPEEDS
Petrov A.V., Potapchik A.V., Soudakov V.G.*
* TsAGI, Russia
Keywords: active flow control, buffet, jet

PETROV A.V., POTAPCHIK A.V., SOUDAKOV V.G.
2
2 Numerical simulation
Supercritical airfoil P-184-15SR with the
thickness of 15% and chord length of c=0.2 m is
chosen for investigations as a baseline
configuration (Fig. 1). Reynolds number based
on free-stream parameters and chord length is
equal to Re=2.6×10⁶. To simulate the jet
blowing, slot is added at x-coordinate Xj=60%
of the chord with height of h=0.15 mm. This
slot is generated by removing small part of the
airfoil (Fig. 2).
RANS and URANS equations are used for
simulations. The calculations are carried out for
the ideal compressible gas with laminar Prandtl
number Pr=0.72. Laminar viscosity-temperature
dependence is approximated by Sutherland law
with Sutherland constant 110.4 K. Laminar-
turbulent transition was fixed at x/c=0.15. In
URANS simulations, SST model showed no
buffet at all considered regimes so that Spalart-
Allmaras (SA) model was used for simulations.
Fig. 1. Airfoil P-184-15SR and grid near the airfoil.
Fig. 2. Slot geometry at Xj=0.6.
Fig. 3. Grid near slot nozzle.
Computational grid consists of
approximately 200 000 cells. Grid nodes are
clustered normal to the surface inside the
boundary layer so that Y+1<1. Grid near the slot
nozzle is shown in Fig. 3. Grid convergence
study showed that the grid size is sufficient for
numerical simulations [3].
Numerical solutions are obtained using an
implicit finite-volume method. The equations
are approximated by a second-order shock-
capturing scheme. Second order upwind scheme
is used for spatial discretization of convective
terms. Central-differencing scheme is used for
diffusion terms. The second order time
discretization is used for transient simulations.
Dual time stepping scheme is used. Time step
equals to 2x10⁻⁶
s with internal iterations
converging up to the error ~10-6
. Calculations
with time step 1x10⁻⁶
s show that the results are
independent on time step in this range.
0.62
0.64
0.66
0.68
0.7
0.72
0.74
0.76
0.78
0 0.1 0.2 0.3 0.4 0.5 0.6
Cl
Flow Time
0.35
0.4
0.45
0.5
0.55
0.6
0.65
0.7
0.75
0.8
0 0.05 0.1 0.15 0.2 0.25 0.3
Cl
Flow Time Fig. 4. CL convergence history for regimes without (upper
M=0.73, AoA=4º) and with buffet (lower, M=0.73,
AoA=4.5º).
Examples of lift coefficient CL
convergence history for the case without and
with buffet are shown in Fig. 4. It is seen that
there is buffet at t =4.5°. Buffet frequency
varies from 99 Hz for M=0.72 and AoA=5o to
118 for M=0.74 and AoA=4.5o. Pressure
coefficient Cp and root-mean-square (RMS)
values of Cp pulsations are presented in Fig. 5
for M=0.73 and =5°. Blue line corresponds to
the time-averaged value of Cp while red line
corresponds to the instantaneous Cp at the
moment when CL equals to the mean value of
CL. It should be noted that there is an essential
difference between them. RMS values of Cp
show that the shock wave oscillates
3
INVESTIGATION OF FLOW CONTROL OVER THE SUPERCRITICAL
AIRFOIL BY TANGENTIAL JET BLOWING AT TRANSONIC SPEEDS
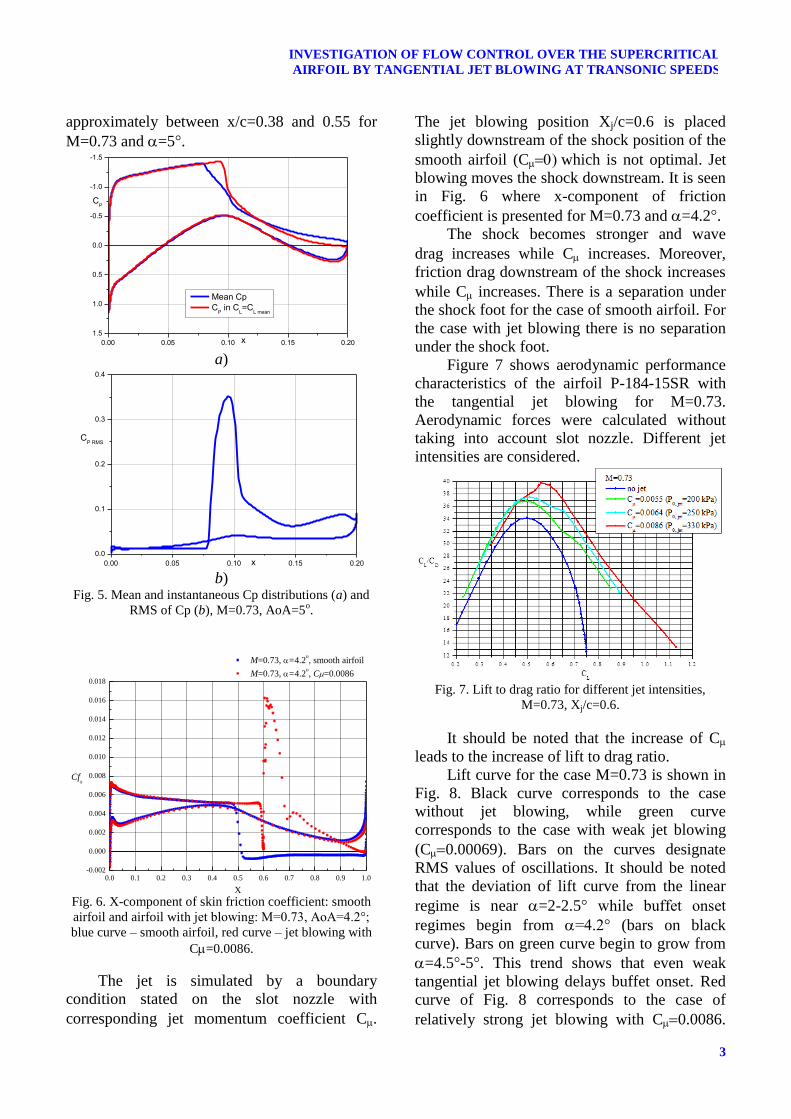
approximately between x/c=0.38 and 0.55 for
M=0.73 and =5°.
0.00 0.05 0.10 0.15 0.20
1.5
1.0
0.5
0.0
-0.5
-1.0
-1.5
Mean Cp
CP in C
L=C
L mean
CP
x a)
0.00 0.05 0.10 0.15 0.20
0.0
0.1
0.2
0.3
0.4
CP RMS
x b)
Fig. 5. Mean and instantaneous Cp distributions (a) and
RMS of Cp (b), M=0.73, AoA=5o.
0.0 0.1 0.2 0.3 0.4 0.5 0.6 0.7 0.8 0.9 1.0-0.002
0.000
0.002
0.004
0.006
0.008
0.010
0.012
0.014
0.016
0.018
M=0.73, =4.2o, smooth airfoil
M=0.73, =4.2o, C=0.0086
Cfx
X Fig. 6. X-component of skin friction coefficient: smooth
airfoil and airfoil with jet blowing: M=0.73, AoA=4.2°;
blue curve – smooth airfoil, red curve – jet blowing with
C=0.0086.
The jet is simulated by a boundary
condition stated on the slot nozzle with
corresponding jet momentum coefficient C.
The jet blowing position Xj/c=0.6 is placed
slightly downstream of the shock position of the
smooth airfoil (Cwhich is not optimal. Jet
blowing moves the shock downstream. It is seen
in Fig. 6 where x-component of friction
coefficient is presented for M=0.73 and =4.2°.
The shock becomes stronger and wave
drag increases while C increases. Moreover,
friction drag downstream of the shock increases
while C increases. There is a separation under
the shock foot for the case of smooth airfoil. For
the case with jet blowing there is no separation
under the shock foot.
Figure 7 shows aerodynamic performance
characteristics of the airfoil P-184-15SR with
the tangential jet blowing for M=0.73.
Aerodynamic forces were calculated without
taking into account slot nozzle. Different jet
intensities are considered.
Fig. 7. Lift to drag ratio for different jet intensities,
M=0.73, Xj/c=0.6.
It should be noted that the increase of C
leads to the increase of lift to drag ratio.
Lift curve for the case M=0.73 is shown in
Fig. 8. Black curve corresponds to the case
without jet blowing, while green curve
corresponds to the case with weak jet blowing
(C0.00069). Bars on the curves designate
RMS values of oscillations. It should be noted
that the deviation of lift curve from the linear
regime is near =2-2.5° while buffet onset
regimes begin from =4.2° (bars on black
curve). Bars on green curve begin to grow from
=4.5°-5°. This trend shows that even weak
tangential jet blowing delays buffet onset. Red
curve of Fig. 8 corresponds to the case of
relatively strong jet blowing with C0.0086.

PETROV A.V., POTAPCHIK A.V., SOUDAKOV V.G.
4
There are no oscillations of CL in this case and
there is no buffet. One can conclude that
tangential jet blowing delays buffet.
0.0 0.5 1.0 1.5 2.0 2.5 3.0 3.5 4.0 4.5 5.0 5.5 6.0
0.1
0.2
0.3
0.4
0.5
0.6
0.7
0.8
0.9
1.0
1.1
1.2
CL
AoA
no jet
jet, C=0.00069
jet, C=0.0086
Fig. 8. Lift curve for M=0.73 with and without tangential
jet blowing
3 Experimental investigations
The experiments were carried out in the
transonic wind tunnel T-112 TsAGI. T-112 has
the following characteristics: square test cross-
section – 0.6x0.6 m2; length of test section –
2.59 m; side walls are solid; top and bottom
walls were with the perforation of 23%;
stagnation temperature – environmental
temperature T0=287 K; stagnation pressure – 1
atmosphere; Reynolds number based on free-
stream parameters and chord length (200 mm) –
~2.6×10⁶; standard run duration – 300 s.
A model of the airfoil is performed in the
form of rectangular wing with the same cross
section (Fig. 9) and located between the side
walls of the test section. The side walls in the
region of the model installation have optical
windows, which enable optical measurements of
the flow around the model by means of
Schlieren-type images.
The model contains the equipment for the
tangential jet blowing and various
measurements performed during WT tests. The
following measurements were carried out:
shadow-type visualization of flow over the
upper surface; pressure taps on the upper (20
points) and bottom surfaces (15 points);
unsteady pressure pulsations measurements on
the upper surface (10 points); wake
investigations using the rake to measure
stagnation pressure profile; pressure (16 points)
and pressure fluctuations (3 points)
measurements on wind tunnel walls.
Fig. 9. T-112 TsAGI transonic wind tunnel with the
model; view from the leading edge.
P-184-15SR airfoil was chosen as the
baseline configuration as in the numerical
simulations. The wing model has the thickness
of 15%, chord length – 200 mm, span –
600 mm. For these tests, the model was
equipped with a slot nozzle for tangential jet
blowing. The slot was located at 60% of chord
and had height of 0.15 mm. Range of total
pressure of the blown jet is P0jet=1.5; 2; 2.5; 3
atm. Special pylons for compressed air supply
was developed near side walls (Fig. 9).
Boundary layer transition was triggered at
15% of the chord on the upper and bottom
airfoil surfaces.
The typical dependency of pressure
coefficient Cp on the model surface
corresponding to the different jet intensities is
shown in Fig. 10. Figure 11 presents RMS
values of Cp pulsations while Fig. 12 shows
total pressure distribution in the wake
downstream of the model in the central cross
section in vertical direction. One can see that the
increase of a jet stagnation pressure moves the
shock wave downstream and leads to a better
trailing edge Cp recovery.
It should be noted that there are no
pressure pulsation sensors at 0.5<x/c<0.65. The
maximal value of RMS Cp can be in this region
and thus it is impossible to estimate the
maximal values of RMS Cp and the region of
high pulsations. The increase of RMS Cp
appears due to the shock wave generation. Peak
of pulsations follows the shock wave. In the
5
INVESTIGATION OF FLOW CONTROL OVER THE SUPERCRITICAL
AIRFOIL BY TANGENTIAL JET BLOWING AT TRANSONIC SPEEDS
case with jet blowing, P0jet=2.5-3 atm, Cp at
trailing edge shows that there are no flow
separations. In these cases peaks of RMS values
can relate to the unsteadiness in the region of
the slot location due to the jet blowing.
Fig. 10. Pressure coefficient distributions for M=0.76,
=6º.
Fig. 11. Root-mean-square values of pressure coefficient
pulsations for M=0.76, =6º.
-0.25 -0.20 -0.15 -0.10 -0.05 0.00 0.05 0.10 0.15 0.20 0.2591000
91500
92000
92500
93000
93500
94000
94500
95000
95500
96000
96500
97000
97500
98000
98500
99000
99500
100000
100500
101000
M=0.76, =6o, P0
jet=var
P, Pa
Y, m
P0jet
=0
P0jet
=1.5 atm
P0jet
=2 atm
P0jet
=2.5 atm
P0jet
=3 atm
Fig. 12. Total pressure distribution in the wake
downstream of the model for M=0.76, =6º.
Figure 12 shows that the wake is wider for
the baseline case without jet blowing. For the
cases with jet blowing, the wake is more thin.
This trend increases with the increase of jet
intensity. It correlates with lift-to-drag ratio
increase obtained in numerical simulation.
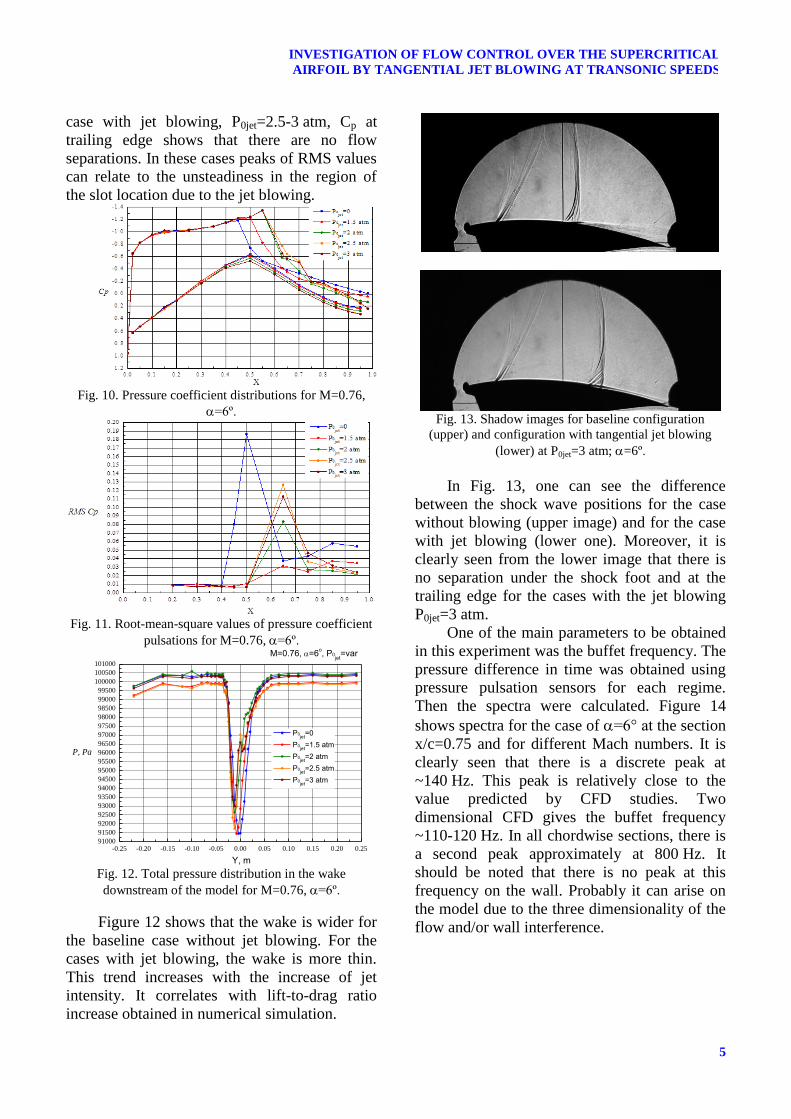
Fig. 13. Shadow images for baseline configuration
(upper) and configuration with tangential jet blowing
(lower) at P0jet=3 atm; =6º.
In Fig. 13, one can see the difference
between the shock wave positions for the case
without blowing (upper image) and for the case
with jet blowing (lower one). Moreover, it is
clearly seen from the lower image that there is
no separation under the shock foot and at the
trailing edge for the cases with the jet blowing
P0jet=3 atm.
One of the main parameters to be obtained
in this experiment was the buffet frequency. The
pressure difference in time was obtained using
pressure pulsation sensors for each regime.
Then the spectra were calculated. Figure 14
shows spectra for the case of =6° at the section
x/c=0.75 and for different Mach numbers. It is
clearly seen that there is a discrete peak at
~140 Hz. This peak is relatively close to the
value predicted by CFD studies. Two
dimensional CFD gives the buffet frequency
~110-120 Hz. In all chordwise sections, there is
a second peak approximately at 800 Hz. It
should be noted that there is no peak at this
frequency on the wall. Probably it can arise on
the model due to the three dimensionality of the
flow and/or wall interference.

PETROV A.V., POTAPCHIK A.V., SOUDAKOV V.G.
6
Fig. 14. Spectra of pressure pulsations for =6° for
baseline configuration (upper) and tangential jet blowing
(lower) with P0jet=3 atm.
One can see that in the cases with jet
blowing, the discrete peak ~140 Hz typical to
the baseline configuration disappears while the
level of pulsations in this region increases. The
peak with ~800 Hz is approximately the same as
in the case without jet blowing.
4 Summary
Two-dimensional numerical simulations
are carried out to characterize the buffet
phenomenon on transonic supercritical airfoil P-
184-15SR. Two dimensional CFD gives the
buffet frequency ~100-120 Hz. Tangential jet
blowing in the shock region is investigated to
delay buffet. Numerical simulations showed that
the jet suppresses shock-induced separation and
increases lift coefficient and lift-to-drag ratio.
Numerical results showed that buffet onset
delays both in the AoA and CL domain.
The wind tunnel tests of this configuration
with tangential jet blowing were carried out in
the TsAGI transonic wind tunnel T-112. The
pressure distributions on the airfoil, wind tunnel
walls and in the wake have been obtained.
Experimental results confirm that the tangential
jet blowing moves the shock location
downstream at all regimes. The increase of a jet
intensity leads to a more downstream location of
the shock and a better recovery of the trailing
edge pressure. The jet suppresses the shock-
induced separation. The buffet frequency was
measured as ~140 Hz. This peak is relatively
close to the value predicted by CFD studies. In
the cases with jet blowing, there is no discrete
peak associated with buffet at ~140 Hz.
Authors thank K.A. Abramova and
A.A. Ryzhov for the data processing and help in
performing the numerical simulations.
This work was supported by BUTERFLI
Project of the 7th Framework Program of the
European Commission (Grant Agreement
605605) and grant of Russian Scientific
Foundation No. 16-19-10407 (part of numerical
simulations).
References
[1] Caruana D., Mignosi A., Robitaille C. and Correge
M. Separated Flow and Buffeting Control. Flow,
Turbulence and Combustion, Vol. 71, pp 221-245,
2003.
[2] Dandois J., Molton P., Lepage A., Geeraert A.,
Brunet V., Dor J.-B. and Coustols E. Buffet
Characterization and Control for Turbulent Wings.
Aerospace Lab Journal, Vol. 6, AL06-01, 2013.
[3] Petrov A.V., Bokser V.D.,Sudakov G.G. and Savin
P.V. Application of tangential jet blowing for
suppression of shock-induced flow separation over a
supercritical wing at transonic speeds. 27-th
Congress of the International Council of the
Aeronautical Sciences, Nice, France, 2010.
[4] Abramova K.A., Brutyan M.A., Lyapunov S.V.,
Petrov A.V., Potapchik A.V., Ryzhov A.A.,
Soudakov V.G. Investigation of buffet control on
transonic airfoil by tangential jet blowing. 6-th
European Conference for Aeronautics and Space
Sciences (EUCASS), Poland, Krakow, June 25-July
3, 2015.
5 Contact Author Email Address
Copyright Statement

7
INVESTIGATION OF FLOW CONTROL OVER THE SUPERCRITICAL
AIRFOIL BY TANGENTIAL JET BLOWING AT TRANSONIC SPEEDS
The authors confirm that they, and/or their company or
organization, hold copyright on all of the original material
included in this paper. The authors also confirm that they
have obtained permission, from the copyright holder of
any third party material included in this paper, to publish
it as part of their paper. The authors confirm that they
give permission, or have obtained permission from the
copyright holder of this paper, for the publication and
distribution of this paper as part of the ICAS proceedings
or as individual off-prints from the proceedings.