investigation of damaged 12-year old prestressed concrete box beams
DESCRIPTION
Investigation of Damaged Concrete Box BeamsTRANSCRIPT
Investigation of Damaged 12-Year Old Prestressed ConcreteBox Beams
Clay Naito, Ph.D., P.E.1; Richard Sause, P.E.2; and Brian Thompson, P.E.3
Abstract: An investigation was conducted of unexpected damage to a pair of three-span continuous-spread prestressed box beam bridgesafter 12 years of service. Routine inspection had revealed cracks in the box beams near the piers and abutments. An investigation wasconducted to assess the condition of the beams in the bridges as well as their as-built properties and remaining strength. The investigationshowed that the beams were built in accordance with the design drawings and specifications. One beam was tested under a combinationof flexure and shear. These tests showed that the effective prestress was lower than standard design estimates. Measurable slip of thestrands initiated as shear or flexure-shear cracks developed; however, the bond strength was sufficient for the strands to fail by fracture.The measured ultimate strength exceeded the analytical estimates by 7 to 9%. The conclusion of the investigation is that the cracks in thebeams developed from a combination of conditions created by the design, detailing, and production of the beams.
DOI: 10.1061/�ASCE�1084-0702�2008�13:2�139�
CE Database subject headings: Concrete, prestressed; Cracking; Experimentation; Box girders; Bridge design; Beams; Damage;Forensic engineering.
Introduction
A three-span precast prestressed spread box beam bridge in Penn-sylvania was designed in 1986 and placed in service in 1989.During a routine bridge inspection in 2000, a crack was discov-ered in one of the beams. Further inspection revealed numerouscracks in the beams near the piers and abutments. The beamswere expected to have sufficient prestress in these regions to pre-vent such cracks from forming. Owing to the importance of thehighway carried by the bridge, the Pennsylvania Department ofTransportation �PennDOT� demolished and replaced the bridgesuperstructure. An investigation of the damage, including in-situcrack mapping, review of the construction inspection logs, fieldmonitoring, forensic investigation of a beam from the bridge, andlaboratory testing of a beam from the bridge, was conducted. Thispaper presents the results of these studies.
1P.C. Rossin Assistant Professor, Dept. of Civil and EnvironmentalEngineering, Lehigh Univ., ATLSS Center, 117 ATLSS Dr., Bethlehem,PA 18015. E-mail: [email protected]
2Joseph T. Stuart Professor of Structural Engineering, Dept. of Civiland Environmental Engineering, Lehigh Univ., ATLSS Center, 117ATLSS Dr., Bethlehem, PA 18015. E-mail: [email protected]
3Assistant Chief Bridge Engineer, Pennsylvania Department of Trans-portation, Bridge Quality Assurance Division, 7th Floor Keystone Build-ing, P.O. Box 3560, Harrisburg, PA 17105. E-mail: [email protected]
Note. Discussion open until August 1, 2008. Separate discussionsmust be submitted for individual papers. To extend the closing date byone month, a written request must be filed with the ASCE ManagingEditor. The manuscript for this paper was submitted for review and pos-sible publication on December 28, 2006; approved on May 23, 2007. Thispaper is part of the Journal of Bridge Engineering, Vol. 13, No. 2,
March 1, 2008. ©ASCE, ISSN 1084-0702/2008/2-139–148/$25.00.JOURN
Downloaded 31 Mar 2009 to 129.69.59.183. Redistribution subject to
Bridge Design and Construction
Bridge System
The bridge system consisted of two parallel bridges, one bridge inthe westbound direction of traffic and one bridge in the eastbounddirection �Fig. 1�. Each bridge carried three lanes of highwaytraffic and had three spans that were made continuous after erec-tion. The bridge superstructure cross section consisted of six1.2 m �4 ft� square precast prestressed box beams with a 22.9 mm�9 in.� cast-in-place deck on stay-in-place corrugated steel forms.The box beams had internal diaphragms at midspan and werebraced with cast-in-place diaphragms at the piers and abutments�Fig. 2�. Each bridge was intended to have freedom in the longi-tudinal direction at the abutments and pier 1 and to be restrainedin the longitudinal direction at pier 2. Each bridge had a skew of85.8° and a grade of 3.78%. The substructure of each bridgeconsisted of reinforced concrete stub abutments and multicolumnbents. The abutments and bents were supported by steel H pilesdriven into bedrock.
Beam Design
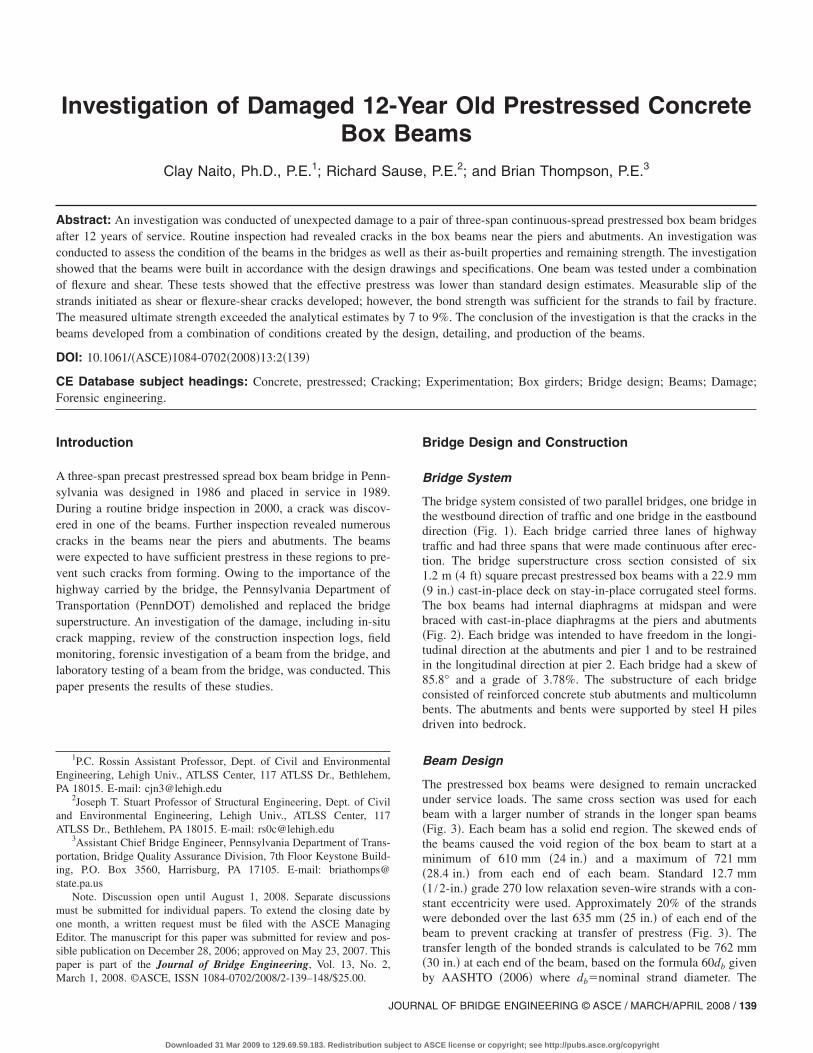
The prestressed box beams were designed to remain uncrackedunder service loads. The same cross section was used for eachbeam with a larger number of strands in the longer span beams�Fig. 3�. Each beam has a solid end region. The skewed ends ofthe beams caused the void region of the box beam to start at aminimum of 610 mm �24 in.� and a maximum of 721 mm�28.4 in.� from each end of each beam. Standard 12.7 mm�1 /2-in.� grade 270 low relaxation seven-wire strands with a con-stant eccentricity were used. Approximately 20% of the strandswere debonded over the last 635 mm �25 in.� of each end of thebeam to prevent cracking at transfer of prestress �Fig. 3�. Thetransfer length of the bonded strands is calculated to be 762 mm�30 in.� at each end of the beam, based on the formula 60db given
by AASHTO �2006� where db�nominal strand diameter. TheAL OF BRIDGE ENGINEERING © ASCE / MARCH/APRIL 2008 / 139
ASCE license or copyright; see http://pubs.asce.org/copyright

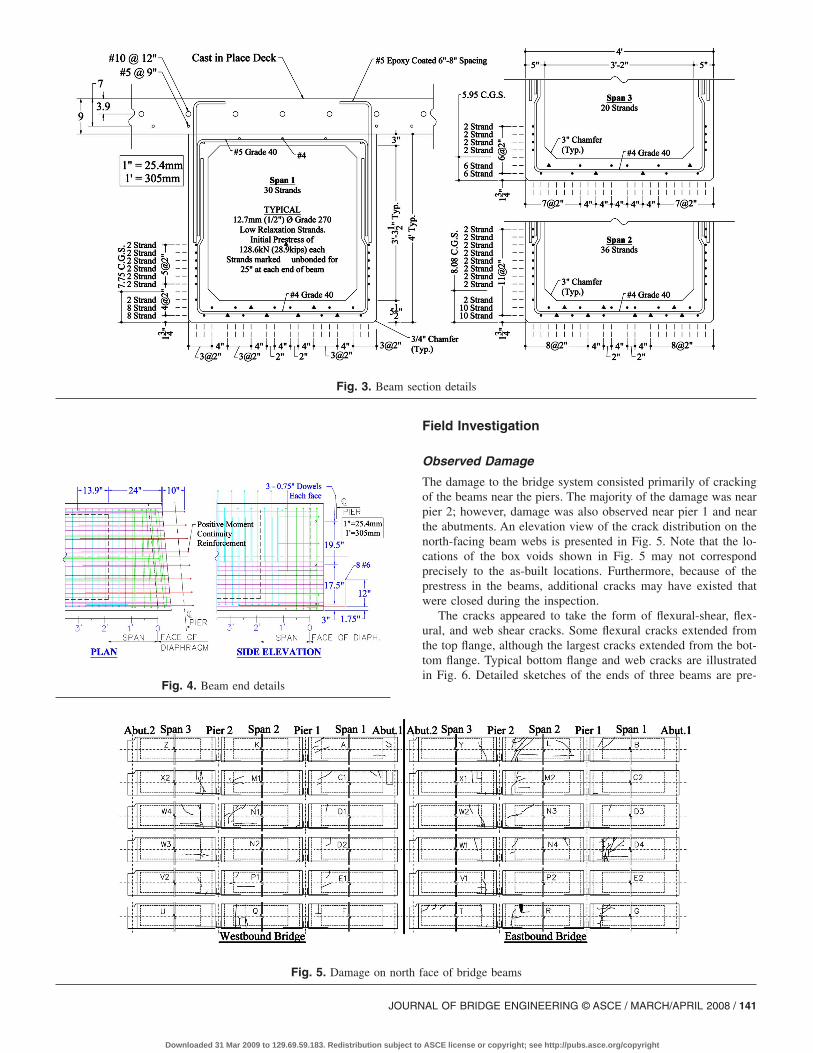
beams were made composite with the deck through the use ofhorizontal shear ties. The beams were anchored into the dia-phragms at the piers and abutments using web dowels �Fig. 4�. Atthe piers, positive moment reinforcement, which consisted ofhooked longitudinal bottom #6 reinforcing bars that extended ap-proximately 250 mm �10 in.� beyond the end of the beam �Fig.4�, was cast into the continuity diaphragms to develop positivemoment in the beams at the piers. This positive moment continu-ity reinforcement was embedded 965 mm �38 in.� into the ends ofthe beams. The continuity diaphragms were intended to make thebridge continuous for superimposed dead, live, thermal, and creepand shrinkage load effects.
Precast Beam Production
PennDOT inspection notes �Gannett Fleming 2000� indicate prob-lems with production of beams for the bridges. The beams wereproduced from July to October 1987 on outdoor prestressing bedsin Pennsylvania. The concrete mix was designed to achieve acompressive strength of 37.9 MPa �5,500 psi� at the time of pre-
Fig. 1. Bridge plan view
Fig. 2. Bridge sid
140 / JOURNAL OF BRIDGE ENGINEERING © ASCE / MARCH/APRIL 2008
Downloaded 31 Mar 2009 to 129.69.59.183. Redistribution subject to
stress transfer and 44.8 MPa �6,500 psi� at 28 days. The averagemeasured concrete strengths exceeded the required strength lev-els. Various problems with quality control of the beams, however,led to rejection and reproduction of over 24 of the required 36beams. The observed problems included 6 to 22 mm �1/4 to7 /8 in.� errors in the width of several beams and poor consolida-tion of several beams. In the initial production plan the horizontalshear ties were installed after concrete placement. Rapid settingof the concrete, in some cases, required the producer to hammerthe shear ties into place. Inspection of the first 21 beams indicatedthat 60% to 90% of these ties were too close to the edges of thebeams and 20 of these beams were rejected. One inspection reportnoted pools of form oil on the prestressing bed and strands; theaffected strands were removed and replaced, and the excess oilwas removed from the form. Two beams were rejected becausethe void form moved during casting operations. In one case,strands were not properly debonded at one end of the beam and atthe other end the required debonding was omitted. In all cases, theproduction problems were addressed prior to concrete placementor the beams were rejected. It is important to note that the inspec-tion records indicate that all beams accepted for the bridge metthe specifications. Nevertheless, during the investigation, specialattention was placed on potential problems with strand bond, er-rors in beam dimensions, and misplaced or omitted reinforce-ment.
Construction Sequence
The erection of the beams and construction of the cast-in-placediaphragms and deck followed typical practices of the time. Thebeams were installed on the abutments and piers with 12.7 mm�0.5 in.�- to 31.8 mm �1.25 in.�-thick neoprene bearing pads.Then the diaphragms were cast at the abutments. The midspanregion of the deck slab �positive moment region� was then castfollowed by the continuity diaphragms at the piers and the pierregion of the deck slab �negative moment region�. Placement ofthe midspan region deck before the pier region deck reduces thepotential for transverse cracking of the deck slab near the piers.
ation and section
e elevASCE license or copyright; see http://pubs.asce.org/copyright
JOURN
Downloaded 31 Mar 2009 to 129.69.59.183. Redistribution subject to
Field Investigation
Observed Damage
The damage to the bridge system consisted primarily of crackingof the beams near the piers. The majority of the damage was nearpier 2; however, damage was also observed near pier 1 and nearthe abutments. An elevation view of the crack distribution on thenorth-facing beam webs is presented in Fig. 5. Note that the lo-cations of the box voids shown in Fig. 5 may not correspondprecisely to the as-built locations. Furthermore, because of theprestress in the beams, additional cracks may have existed thatwere closed during the inspection.
The cracks appeared to take the form of flexural-shear, flex-ural, and web shear cracks. Some flexural cracks extended fromthe top flange, although the largest cracks extended from the bot-tom flange. Typical bottom flange and web cracks are illustratedin Fig. 6. Detailed sketches of the ends of three beams are pre-
tion details
ace of bridge beams
Fig. 3. Beam sec
Fig. 4. Beam end details
Fig. 5. Damage on north f
AL OF BRIDGE ENGINEERING © ASCE / MARCH/APRIL 2008 / 141
ASCE license or copyright; see http://pubs.asce.org/copyright

sented in Fig. 7. In most cases, the cracks were concentrated nearthe transition from the solid beam end region to the box region.Gaps greater than 2.5 mm �0.1 in.� at the interface between thecontinuity diaphragms and the beams were observed at the piers�Fig. 8�. The gaps tended to be largest at the bottom, indicating apossible excessive positive moment demand.
In-Situ Monitoring
Two lanes of eastbound and westbound traffic were routed to thewestbound bridge while the eastbound bridge was demolishedand replaced. The westbound bridge was monitored from Augustto September 2000 using displacement transducers, strain gauges,and thermocouples. The monitoring program revealed that exist-ing cracks opened and closed under traffic loads; they measuredon the order of 0.0025 mm �0.0001 in.� of closure and 0.010 mm�0.0004 in.� of opening. In no cases did the crack sizes grow, nordid the cracks completely close.
Strain measurements were taken at midspan and near the sup-ports to assess load levels and the remaining continuity of the
Fig. 6. Crack in bottom flange extending into web
Fig. 7. Elevation view of typical be
142 / JOURNAL OF BRIDGE ENGINEERING © ASCE / MARCH/APRIL 2008
Downloaded 31 Mar 2009 to 129.69.59.183. Redistribution subject to
bridge. Data was taken both under normal traffic loads and undera standard test load under crawl and dynamic conditions. The testload consisted of a single 4-axle 326.0 kN �73.28 kip� Pennsyl-vania maximum legal load truck �ML-80� as defined by PennDOT�2000�. The strain measurements revealed that negative moments,though smaller than expected, developed in the beams adjacent tothe piers. In addition, strains up to 1.4 times the strains producedby the ML-80 test truck load were observed under traffic loads.The higher strains may be attributed to the presence of multiplevehicles or individual vehicles producing load effects larger thanthe maximum legal load.
The deck of the bridge exhibited a greater temperature varia-tion than did the bottom of the precast beams. During the moni-toring program, the ambient temperature varied from a low of42°F �5.6°C� to a high of 88°F �31.1°C�. Daily measurementsindicated that the bottom of the composite deck slab had a tem-perature 0 to 15°F ��17.8 to �9.4°C� higher than the bottom
mage �Gannet Fleming et al. 2000�
Fig. 8. Gaps at continuity diaphragm
am da
ASCE license or copyright; see http://pubs.asce.org/copyright

flange of the beam. This variation between the top and bottom hada direct influence on the crack size. As the deck slab increased intemperature, the bottom flange crack opened; when the deck slabcooled, the crack closed. The variation in crack size was smallmeasuring approximately 0.025 mm �0.001 in.�.
Forensic Investigation
Several beams were removed from the eastbound structure, in-cluding one from Span 1 �D-4� and one from Span 3 �W-1�.Removal was conducted by saw cutting the deck parallel to thebeams at approximately 600 mm �2 ft� from the beam webs andtransverse to the beams at approximately 1,500 mm �5 ft� fromthe beam ends. The continuity diaphragms were demolished bycutting and jack-hammering.
Beam D-4 was selected for the forensic investigation, andBeam W-1 was selected for laboratory testing �discussed later�.Beam D-4 was selected because of a large transverse crack ob-served near the east end of the beam �Fig. 7�, and the forensicinvestigation concentrated on the conditions in the vicinity of thiscrack. A combination of cross-section cutting, coring, and chip-ping of concrete was used to locate the prestressing strands andmild steel reinforcement �Fig. 9�. Concrete cores containingcracks were subject to petrographic examination in accordancewith ASTM �1995�. Cores without cracks were tested to deter-mine the existing compressive strength. An average compressivestrength of 59.5 MPa �8.63 ksi� was measured, which is 33%greater than the specified 28-day compressive strength of44.8 MPa �6.5 ksi�.
As-Built Properties
Differences between beam D-4 and the design drawings, specifi-cations, and detail drawings were observed. The overall width anddepth of beam D-4 and the length of the solid end region wereclose to those shown on the design and detail drawings. Variationswere observed in the box region of the beam, where the web andbottom flange thickness were as much as 15% less than the speci-fied dimensions. The number and location of the prestressingstrands and the length and location of debonding were withinspecifications �Fig. 3�. The stirrups exposed during the forensicoperations were present in �approximately� the number and loca-tion shown on the detail drawings, with one notable discrepancy.The spacing between stirrups in the solid end region near thetransition to the box section was as much as 50 mm �2 in.�, or40%, greater than intended. The spacing error, however, was com-
Fig. 9. Forensic investigation of beam D-4
pletely within the solid end region and the stirrups in the box
JOURN
Downloaded 31 Mar 2009 to 129.69.59.183. Redistribution subject to
region were as intended. The hooked #6 positive moment conti-nuity reinforcing bars at the end of beam D-4 were consistentwith the detail drawings. These bars were placed outside the stir-rups, and as a result, the actual clear concrete cover was less thanthe required 44.5 mm �1.75 in.�.
The beam design details resulted in an area of substantial dis-continuity at the transition from the solid end region to the boxregion. The length of the solid end region varies from 610 to721 mm �24 to 28.4 in.� because of the skew of the bridge �Fig.4�. The positive moment continuity reinforcing bars, which areembedded 965 mm �38 in.� into the beam ends, thus terminate ata distance between 244 and 356 mm �9.6 and 14 in.� into the boxsection region �which is only 33 to 48% of the developmentlength of these epoxy coated #6 bars�. The debonded strands atthe beam end are debonded over the first 635 mm �25 in.� at eachend of the beam �Fig. 3�. The calculated transfer length of thebonded strands is 762 mm �30 in.� at each end of the beam �cal-culated as 60db �AASHTO 2006��. Transfer length test data, how-ever, exhibits large scatter. Tabatabai and Dickson �1993� andRussell and Burns �1997� show that transfer lengths often reach80db or 1,016 mm �40 in.� for 12.7 mm �1 /2 in.� strands. Thenearly simultaneous termination of the positive moment continu-ity reinforcing bars and the debonded length of the debondedstrands near the transition to the box section where the prestressfrom the bonded strands may not be fully transferred appears tohave contributed to the observed damage, as discussed later.
Petrographic Study
Petrographic examination of the concrete cores indicated that thecoarse and fine aggregates were physically and chemically sound.The coarse and fine aggregates had a maximum diameter of25 mm �1 in.� and 9.5 mm �3 /8 in.�, respectively. There was adeficiency of intermediate and finer sizes of coarse aggregate re-sulting in a poor gradation on the whole. The low fine aggregatecontent, however, should result in lower shrinkage and reduceprestress losses. Crushed limestone and dolomite were used forcoarse aggregate and natural silica sand was used for fine aggre-gate. Dolomite and limestone are soft materials with a Mohs scaleof hardness less than 6 �can be scratched with glass�. At this levelof hardness, bond capacity may be compromised by prematurefailure of the aggregate. The cracks transected the coarse aggre-gate in some places and circumscribed the coarse aggregate inother places. The cracks developed after good aggregate-pastebond had developed so the aggregate in the plane of the crackfractured. Based on these observations the cracks formed after theconcrete had hardened.
Laboratory Investigation
Laboratory tests of Beam W-1 were conducted. Beam W-1 was15.01 m �49 ft ,3 in.� long and was removed from the bridge withthe field-cast composite-reinforced concrete deck attached as de-scribed earlier. The tests were conducted in three-point bendingby applying a single point load to the simply supported beam,subjecting the beam to combined shear and flexural demands. Thebeam was tested twice as shown in Fig. 10. In Configuration 1,the applied load was placed 3.56 m �11 ft ,8 in.� from the abut-ment 2 end of the beam �the undamaged end�. Pin and rollersupport conditions were provided. After several preliminary tests,the beam was loaded until a significant decrease in load capacity
was observed in the final test. The damaged beam was then re-AL OF BRIDGE ENGINEERING © ASCE / MARCH/APRIL 2008 / 143
ASCE license or copyright; see http://pubs.asce.org/copyright
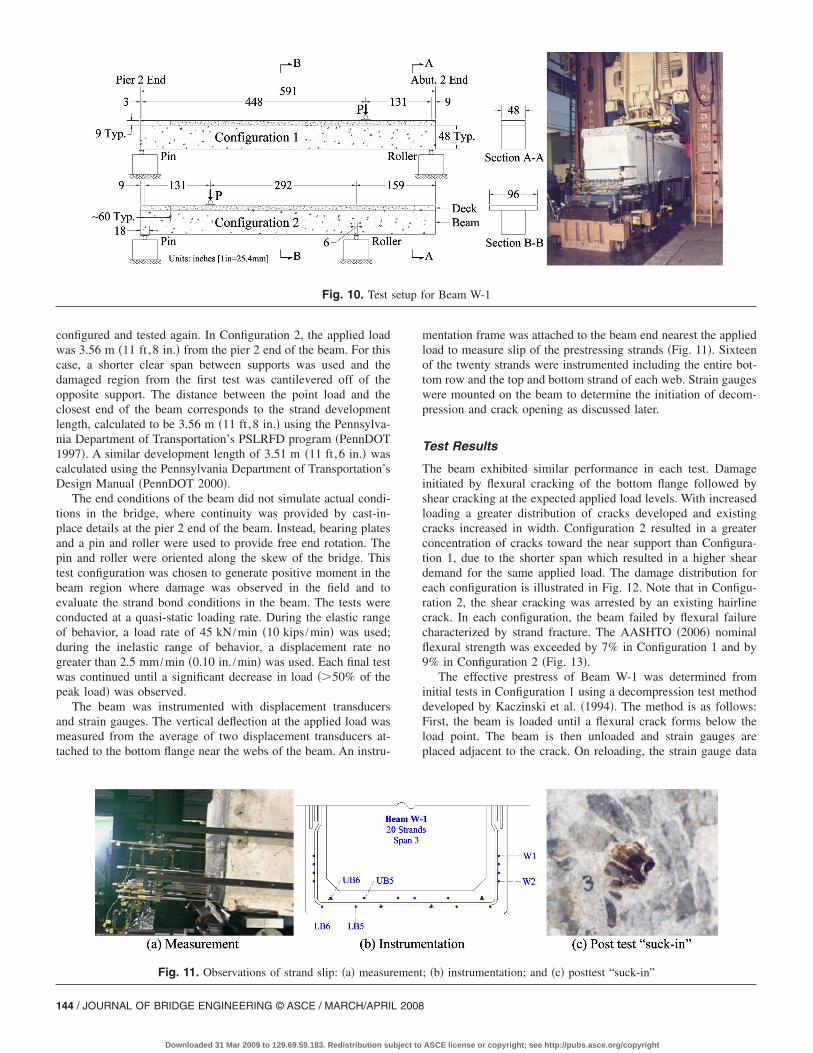
configured and tested again. In Configuration 2, the applied loadwas 3.56 m �11 ft ,8 in.� from the pier 2 end of the beam. For thiscase, a shorter clear span between supports was used and thedamaged region from the first test was cantilevered off of theopposite support. The distance between the point load and theclosest end of the beam corresponds to the strand developmentlength, calculated to be 3.56 m �11 ft ,8 in.� using the Pennsylva-nia Department of Transportation’s PSLRFD program �PennDOT1997�. A similar development length of 3.51 m �11 ft ,6 in.� wascalculated using the Pennsylvania Department of Transportation’sDesign Manual �PennDOT 2000�.
The end conditions of the beam did not simulate actual condi-tions in the bridge, where continuity was provided by cast-in-place details at the pier 2 end of the beam. Instead, bearing platesand a pin and roller were used to provide free end rotation. Thepin and roller were oriented along the skew of the bridge. Thistest configuration was chosen to generate positive moment in thebeam region where damage was observed in the field and toevaluate the strand bond conditions in the beam. The tests wereconducted at a quasi-static loading rate. During the elastic rangeof behavior, a load rate of 45 kN /min �10 kips /min� was used;during the inelastic range of behavior, a displacement rate nogreater than 2.5 mm /min �0.10 in. /min� was used. Each final testwas continued until a significant decrease in load ��50% of thepeak load� was observed.
The beam was instrumented with displacement transducersand strain gauges. The vertical deflection at the applied load wasmeasured from the average of two displacement transducers at-tached to the bottom flange near the webs of the beam. An instru-
Fig. 10. Test
Fig. 11. Observations of strand slip: �a� measur
144 / JOURNAL OF BRIDGE ENGINEERING © ASCE / MARCH/APRIL 2008
Downloaded 31 Mar 2009 to 129.69.59.183. Redistribution subject to
mentation frame was attached to the beam end nearest the appliedload to measure slip of the prestressing strands �Fig. 11�. Sixteenof the twenty strands were instrumented including the entire bot-tom row and the top and bottom strand of each web. Strain gaugeswere mounted on the beam to determine the initiation of decom-pression and crack opening as discussed later.
Test Results
The beam exhibited similar performance in each test. Damageinitiated by flexural cracking of the bottom flange followed byshear cracking at the expected applied load levels. With increasedloading a greater distribution of cracks developed and existingcracks increased in width. Configuration 2 resulted in a greaterconcentration of cracks toward the near support than Configura-tion 1, due to the shorter span which resulted in a higher sheardemand for the same applied load. The damage distribution foreach configuration is illustrated in Fig. 12. Note that in Configu-ration 2, the shear cracking was arrested by an existing hairlinecrack. In each configuration, the beam failed by flexural failurecharacterized by strand fracture. The AASHTO �2006� nominalflexural strength was exceeded by 7% in Configuration 1 and by9% in Configuration 2 �Fig. 13�.
The effective prestress of Beam W-1 was determined frominitial tests in Configuration 1 using a decompression test methoddeveloped by Kaczinski et al. �1994�. The method is as follows:First, the beam is loaded until a flexural crack forms below theload point. The beam is then unloaded and strain gauges areplaced adjacent to the crack. On reloading, the strain gauge data
or Beam W-1
; �b� instrumentation; and �c� posttest “suck-in”
setup f
ement
ASCE license or copyright; see http://pubs.asce.org/copyright

increases in proportion to the load until the crack decompresses,after which the strain gauge data becomes essentially constant.The load at which the strain gauge data becomes essentially con-stant is taken as the decompression load. The effective prestress isestimated from the decompression load �including the appliedload and the self weight�. Beam W-1 was unloaded and reloadedthree times, and the data from the most consistent strain gaugewas averaged. The effective prestress in the strands at the locationof the applied load after elastic shortening, creep and shrinkage ofconcrete, and strand relaxation was found to be 876 MPa�127 ksi�, which corresponds to a 32.7% loss from the initialprestress of 1,302 MPa �188.9 ksi�. The effective prestress wasestimated using the PCI �2004� and AASHTO �2006� approxi-mate methods, resulting in an effective prestress of 1,051 MPa�153 ksi�, a 19% loss, and 1,149 MPa �167 ksi�, a 12% loss, re-spectively. Therefore, the effective prestress determined experi-mentally was much less than that estimated from currentAASHTO and PCI methods.
The experimentally estimated effective prestress was con-firmed by considering the measured load at flexural cracking.Using the measured effective prestress of 876 MPa �127 ksi� anda concrete rupture stress of 9�f�c, the flexural cracking load wasestimated to be 1,157 kN �260 kips�. This is in good agreementwith the observed flexural cracking load of 1,173 kN�263.8 kips�, and consequently the effective prestress of 876 MPa�127 ksi� is used for the remaining discussion.
Slip of the strands was monitored at the end of the beam dur-ing the tests �Fig. 11�a and b��. The beam exhibited significant
Fig. 12. Primary crack distribution in beam
Fig. 13. Measured response at location of applied load
JOURN
Downloaded 31 Mar 2009 to 129.69.59.183. Redistribution subject to
strand slip in both tests. In Configuration 1, slip initiated with theformation of a shear crack �crack A in Fig. 12�a�� near the support�Fig. 14�a��. Slip continued to increase with beam deflection butdid not cause a decrease in load carrying capacity. For Configu-ration 2, strand slip occurred earlier in the loading and was moregradual than that observed in Configuration 1 �Fig. 14�b��. Slipwas associated with the formation of flexural cracks �cracks A andB in Fig. 12�b�� under the applied load. As the size of the flexuralcracks grew and more cracks occurred, the slip of the strandsincreased. It is important to note that slip of the web strands wasgreater than the slip of the bottom flange strands, and in somecases, the slip of the strands during loading was large �Fig. 11�c��.The slip, however, did not lead to a loss of load capacity. Thebeam flexural strength exceeded the AASHTO �2006� nominalflexural strength and failure resulted from fracture of a significantnumber of prestressing strands.
Analysis of Observed Damage
Types of Cracks Observed
No cracks were observed at the midspan of the beams, whereservice loads would produce the largest positive moments. As
Fig. 14. Slip relative to load deformation response of beam: �a�configuration 1; �b� configuration 2
discussed and presented previously �Fig. 5�, cracks were observed
AL OF BRIDGE ENGINEERING © ASCE / MARCH/APRIL 2008 / 145
ASCE license or copyright; see http://pubs.asce.org/copyright
only near the ends of the beams with the majority of the cracksnear piers 1 and 2. The cracks had the form of flexural-shear,flexural, and shear cracks and ran either vertically or diagonallyacross the web and across the bottom flange transverse to thespan. The diagonal cracks were inclined toward midspan and thusfollowed beam theory. The cracks appeared to initiate as eithernegative or positive moment cracking, but the largest cracks werepositive moment cracks extending from the bottom flange.
Negative Moment Flexural Cracking
The possibility that negative moment flexural cracking occurredat the time of transfer of prestress was investigated. From beamtheory, the maximum tensile stress at the top of the box section atthe transition from the solid end region to the box region wasfound to be 108 psi, which is far less than the rupture strength ofconcrete at the time of transfer, which was taken as 7.5�fci� or3.83 MPa �560 psi�. Therefore it is unlikely that negative momentflexural cracks initiated because of the transfer of prestress. Nega-tive moment flexural cracking could occur under traffic loadsafter the bridge deck is cast and continuity is provided over thepiers. The negative moment reinforcement in the deck would,however, restrain widening of these cracks.
Positive Moment Flexural Cracking
After the beam ends are restrained against rotation by the conti-nuity diaphragms, a large positive moment demand can be gener-ated at the pier by: �1� thermal loading; �2� creep; �3� live load;�4� settlement of the piers; or �5� a combination of these loadeffects.
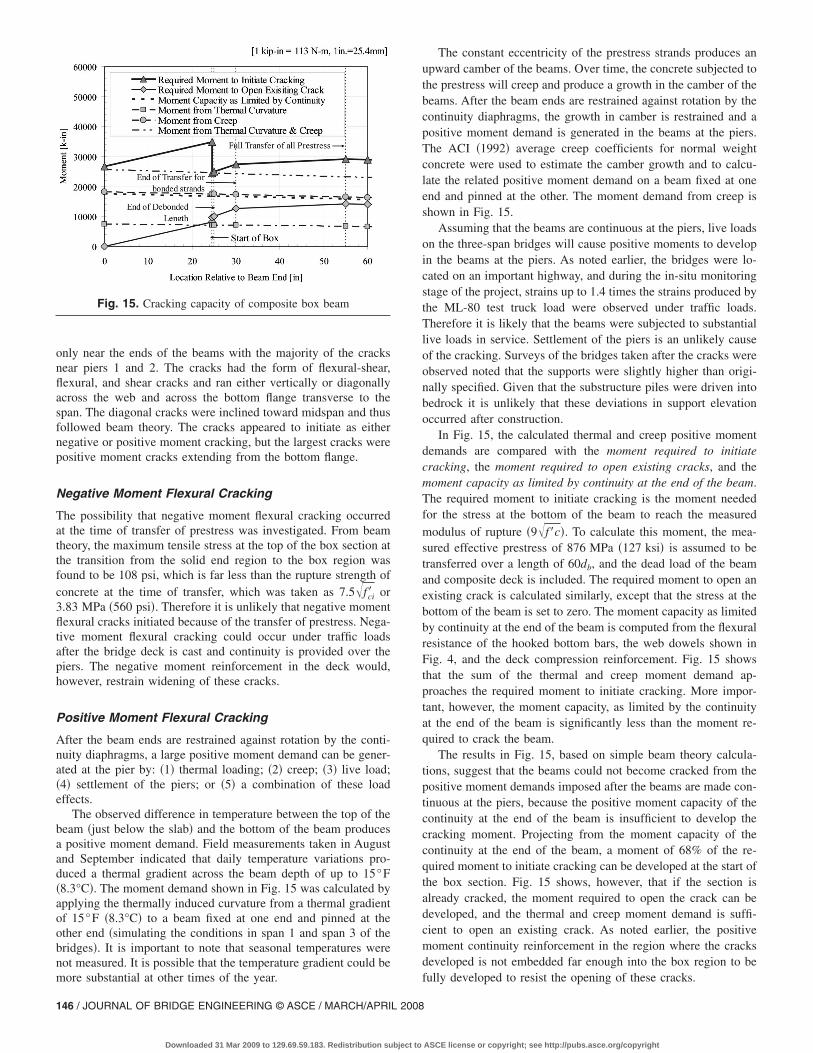
The observed difference in temperature between the top of thebeam �just below the slab� and the bottom of the beam producesa positive moment demand. Field measurements taken in Augustand September indicated that daily temperature variations pro-duced a thermal gradient across the beam depth of up to 15°F�8.3°C�. The moment demand shown in Fig. 15 was calculated byapplying the thermally induced curvature from a thermal gradientof 15°F �8.3°C� to a beam fixed at one end and pinned at theother end �simulating the conditions in span 1 and span 3 of thebridges�. It is important to note that seasonal temperatures werenot measured. It is possible that the temperature gradient could be
Fig. 15. Cracking capacity of composite box beam
more substantial at other times of the year.
146 / JOURNAL OF BRIDGE ENGINEERING © ASCE / MARCH/APRIL 2008
Downloaded 31 Mar 2009 to 129.69.59.183. Redistribution subject to
The constant eccentricity of the prestress strands produces anupward camber of the beams. Over time, the concrete subjected tothe prestress will creep and produce a growth in the camber of thebeams. After the beam ends are restrained against rotation by thecontinuity diaphragms, the growth in camber is restrained and apositive moment demand is generated in the beams at the piers.The ACI �1992� average creep coefficients for normal weightconcrete were used to estimate the camber growth and to calcu-late the related positive moment demand on a beam fixed at oneend and pinned at the other. The moment demand from creep isshown in Fig. 15.
Assuming that the beams are continuous at the piers, live loadson the three-span bridges will cause positive moments to developin the beams at the piers. As noted earlier, the bridges were lo-cated on an important highway, and during the in-situ monitoringstage of the project, strains up to 1.4 times the strains produced bythe ML-80 test truck load were observed under traffic loads.Therefore it is likely that the beams were subjected to substantiallive loads in service. Settlement of the piers is an unlikely causeof the cracking. Surveys of the bridges taken after the cracks wereobserved noted that the supports were slightly higher than origi-nally specified. Given that the substructure piles were driven intobedrock it is unlikely that these deviations in support elevationoccurred after construction.
In Fig. 15, the calculated thermal and creep positive momentdemands are compared with the moment required to initiatecracking, the moment required to open existing cracks, and themoment capacity as limited by continuity at the end of the beam.The required moment to initiate cracking is the moment neededfor the stress at the bottom of the beam to reach the measuredmodulus of rupture �9�f�c�. To calculate this moment, the mea-sured effective prestress of 876 MPa �127 ksi� is assumed to betransferred over a length of 60db, and the dead load of the beamand composite deck is included. The required moment to open anexisting crack is calculated similarly, except that the stress at thebottom of the beam is set to zero. The moment capacity as limitedby continuity at the end of the beam is computed from the flexuralresistance of the hooked bottom bars, the web dowels shown inFig. 4, and the deck compression reinforcement. Fig. 15 showsthat the sum of the thermal and creep moment demand ap-proaches the required moment to initiate cracking. More impor-tant, however, the moment capacity, as limited by the continuityat the end of the beam is significantly less than the moment re-quired to crack the beam.
The results in Fig. 15, based on simple beam theory calcula-tions, suggest that the beams could not become cracked from thepositive moment demands imposed after the beams are made con-tinuous at the piers, because the positive moment capacity of thecontinuity at the end of the beam is insufficient to develop thecracking moment. Projecting from the moment capacity of thecontinuity at the end of the beam, a moment of 68% of the re-quired moment to initiate cracking can be developed at the start ofthe box section. Fig. 15 shows, however, that if the section isalready cracked, the moment required to open the crack can bedeveloped, and the thermal and creep moment demand is suffi-cient to open an existing crack. As noted earlier, the positivemoment continuity reinforcement in the region where the cracksdeveloped is not embedded far enough into the box region to be
fully developed to resist the opening of these cracks.ASCE license or copyright; see http://pubs.asce.org/copyright
Cracking Caused by Discontinuity
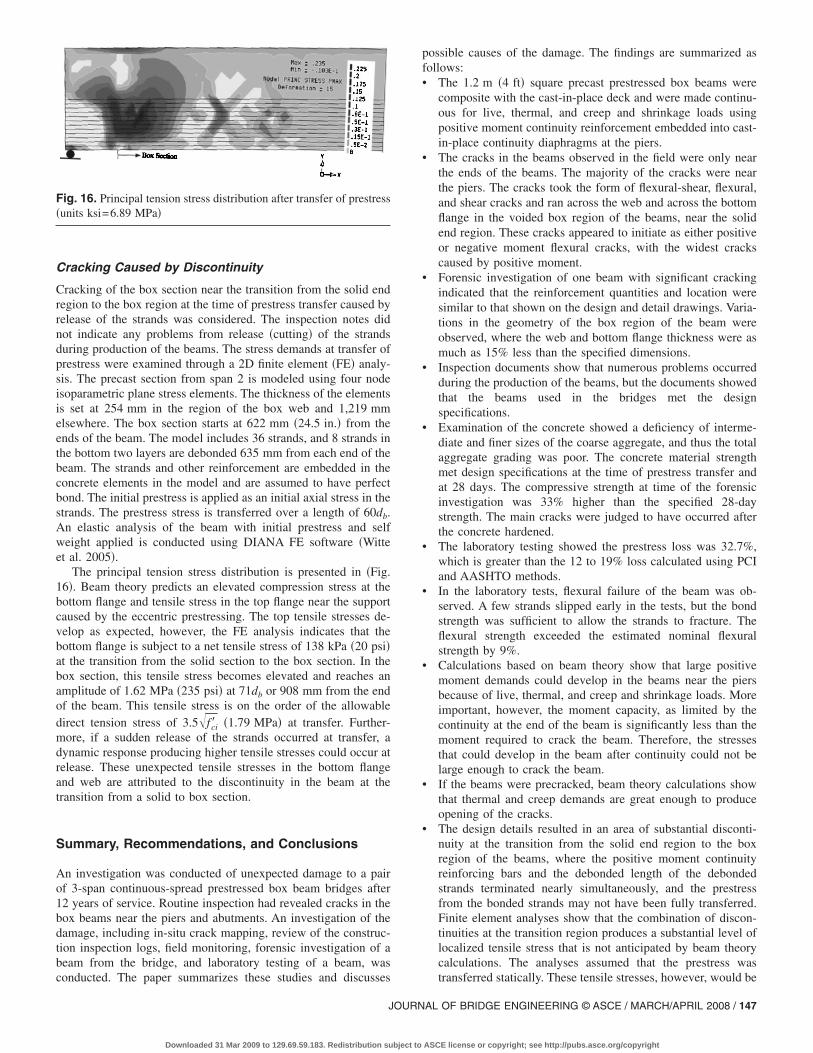
Cracking of the box section near the transition from the solid endregion to the box region at the time of prestress transfer caused byrelease of the strands was considered. The inspection notes didnot indicate any problems from release �cutting� of the strandsduring production of the beams. The stress demands at transfer ofprestress were examined through a 2D finite element �FE� analy-sis. The precast section from span 2 is modeled using four nodeisoparametric plane stress elements. The thickness of the elementsis set at 254 mm in the region of the box web and 1,219 mmelsewhere. The box section starts at 622 mm �24.5 in.� from theends of the beam. The model includes 36 strands, and 8 strands inthe bottom two layers are debonded 635 mm from each end of thebeam. The strands and other reinforcement are embedded in theconcrete elements in the model and are assumed to have perfectbond. The initial prestress is applied as an initial axial stress in thestrands. The prestress stress is transferred over a length of 60db.An elastic analysis of the beam with initial prestress and selfweight applied is conducted using DIANA FE software �Witteet al. 2005�.
The principal tension stress distribution is presented in �Fig.16�. Beam theory predicts an elevated compression stress at thebottom flange and tensile stress in the top flange near the supportcaused by the eccentric prestressing. The top tensile stresses de-velop as expected, however, the FE analysis indicates that thebottom flange is subject to a net tensile stress of 138 kPa �20 psi�at the transition from the solid section to the box section. In thebox section, this tensile stress becomes elevated and reaches anamplitude of 1.62 MPa �235 psi� at 71db or 908 mm from the endof the beam. This tensile stress is on the order of the allowabledirect tension stress of 3.5�fci� �1.79 MPa� at transfer. Further-more, if a sudden release of the strands occurred at transfer, adynamic response producing higher tensile stresses could occur atrelease. These unexpected tensile stresses in the bottom flangeand web are attributed to the discontinuity in the beam at thetransition from a solid to box section.
Summary, Recommendations, and Conclusions
An investigation was conducted of unexpected damage to a pairof 3-span continuous-spread prestressed box beam bridges after12 years of service. Routine inspection had revealed cracks in thebox beams near the piers and abutments. An investigation of thedamage, including in-situ crack mapping, review of the construc-tion inspection logs, field monitoring, forensic investigation of abeam from the bridge, and laboratory testing of a beam, was
Fig. 16. Principal tension stress distribution after transfer of prestress�units ksi=6.89 MPa�
conducted. The paper summarizes these studies and discusses
JOURN
Downloaded 31 Mar 2009 to 129.69.59.183. Redistribution subject to
possible causes of the damage. The findings are summarized asfollows:• The 1.2 m �4 ft� square precast prestressed box beams were
composite with the cast-in-place deck and were made continu-ous for live, thermal, and creep and shrinkage loads usingpositive moment continuity reinforcement embedded into cast-in-place continuity diaphragms at the piers.
• The cracks in the beams observed in the field were only nearthe ends of the beams. The majority of the cracks were nearthe piers. The cracks took the form of flexural-shear, flexural,and shear cracks and ran across the web and across the bottomflange in the voided box region of the beams, near the solidend region. These cracks appeared to initiate as either positiveor negative moment flexural cracks, with the widest crackscaused by positive moment.
• Forensic investigation of one beam with significant crackingindicated that the reinforcement quantities and location weresimilar to that shown on the design and detail drawings. Varia-tions in the geometry of the box region of the beam wereobserved, where the web and bottom flange thickness were asmuch as 15% less than the specified dimensions.
• Inspection documents show that numerous problems occurredduring the production of the beams, but the documents showedthat the beams used in the bridges met the designspecifications.
• Examination of the concrete showed a deficiency of interme-diate and finer sizes of the coarse aggregate, and thus the totalaggregate grading was poor. The concrete material strengthmet design specifications at the time of prestress transfer andat 28 days. The compressive strength at time of the forensicinvestigation was 33% higher than the specified 28-daystrength. The main cracks were judged to have occurred afterthe concrete hardened.
• The laboratory testing showed the prestress loss was 32.7%,which is greater than the 12 to 19% loss calculated using PCIand AASHTO methods.
• In the laboratory tests, flexural failure of the beam was ob-served. A few strands slipped early in the tests, but the bondstrength was sufficient to allow the strands to fracture. Theflexural strength exceeded the estimated nominal flexuralstrength by 9%.
• Calculations based on beam theory show that large positivemoment demands could develop in the beams near the piersbecause of live, thermal, and creep and shrinkage loads. Moreimportant, however, the moment capacity, as limited by thecontinuity at the end of the beam is significantly less than themoment required to crack the beam. Therefore, the stressesthat could develop in the beam after continuity could not belarge enough to crack the beam.
• If the beams were precracked, beam theory calculations showthat thermal and creep demands are great enough to produceopening of the cracks.
• The design details resulted in an area of substantial disconti-nuity at the transition from the solid end region to the boxregion of the beams, where the positive moment continuityreinforcing bars and the debonded length of the debondedstrands terminated nearly simultaneously, and the prestressfrom the bonded strands may not have been fully transferred.Finite element analyses show that the combination of discon-tinuities at the transition region produces a substantial level oflocalized tensile stress that is not anticipated by beam theorycalculations. The analyses assumed that the prestress was
transferred statically. These tensile stresses, however, would beAL OF BRIDGE ENGINEERING © ASCE / MARCH/APRIL 2008 / 147
ASCE license or copyright; see http://pubs.asce.org/copyright
larger if a sudden release of the strands at transfer occurred.Based on the investigations presented in the paper, the follow-
ing recommendations are given for design and construction ofbridges with prestressed concrete box beams with positive mo-ment continuity reinforcement embedded into cast-in-place conti-nuity diaphragms at the piers:• The length of the solid end region of the beams should exceed
the transfer length of the prestressing strands to ensure thattransfer does not occur in the box region adjacent to the tran-sition from the solid end region where the discontinuity mayproduce stress concentrations.
• As a minimum, the positive moment continuity reinforcingbars should extend into the beam, a distance equal to the ten-sion development length of these bars plus the transfer lengthof the prestressing strands, to ensure that the prestress is trans-ferred into the beam before the bars are terminated.
• Prestressing strands should be kept free of contaminants tomaintain good quality bond to concrete and avoid unexpect-edly long prestress transfer lengths.
• The cut-off locations of positive moment continuity reinforc-ing bars should be staggered within the beam to reduce stressconcentrations.
• The positive moment continuity reinforcing bars should belocated inside the beam stirrups.
Some of these recommendations were incorporated into proposedrevisions to the AASHTO LRFD Bridge Design Specificationscontained in Miller et al. �2004�.
The conclusion of the investigation summarized in the paper isthat the cracks developed from a combination of conditions cre-ated by the design, detailing, and production of the beams. Al-though large positive moment demands could develop in thebeams near the piers because of superimposed dead, live, thermal,and creep loads, these demands were not sufficient to crack thebeams. The design details resulted in an area of substantial dis-continuity in the region where cracks were observed producing ahigh localized tensile stress not anticipated by beam theory cal-culations. Possible transfer lengths that are longer than thosegiven by the standard equations may have contributed to the ten-sile stress in the area of discontinuity. Possible errors in produc-tion, such as contamination of the strands, which would furtherincrease the transfer length, or sudden release of the strands,which would amplify the localized tensile stress, may have con-tributed to the tensile stresses in the region where cracks wereobserved.
148 / JOURNAL OF BRIDGE ENGINEERING © ASCE / MARCH/APRIL 2008
Downloaded 31 Mar 2009 to 129.69.59.183. Redistribution subject to
Acknowledgments
The writers would like to acknowledge Professors StephenPessiki and Robert Connor for their contributions to the fieldinvestigations described in the paper. Contributions from the en-gineering staff of Gannett Fleming, Inc., and the PennsylvaniaDepartment of Transportation are also acknowledged. The writersare grateful to the technical staff at Lehigh University for theircontributions to the investigation. This study was sponsored bythe Pennsylvania Department of Transportation. The opinions,findings, conclusions, and recommendations expressed in thepaper material are the authors and do not necessarily reflect theviews of others acknowledged here.
References
AASHTO. �2006�. LRFD bridge design specifications, 3rd Ed., InterimRevisions, American Association of State Highway and Transporta-tion Officials, Washington, D.C.
American Concrete Institute �ACI� Committee 209. �1992�. Prediction ofcreep, shrinkage, and temperature effects in concrete structures (ACI209R-92), American Concrete Institute, Farmington Hills, Mich.
ASTM. �1995�. C856-95 petrographic examination of hardened concrete,ASTM, West Conshohoken, Penn.
Gannett Fleming, Lehigh University, PennDOT. �2000�. “StructureEvaluation Rep. Lehigh County S.R. 0078 over S.R. 2023 �Vera CruzRoad�.” PennDOT, Harrisburg, Penn.
Kaczinski, M. R., Wescott, H. H., and Pessiki, S. �2004�. “Decompressionand ultimate load tests of 28-year-old prestressed concrete bridgebeams.” ATLSS Rep. No. 94CT1033.1, Bethlehem, PA.
Miller, R., Castrodale, R., Mirmiran, A., and Hastak, M. �2004�. “Con-nection of simple-span precast concrete girders for continuity.”NCHRP Rep. 519, Transportation Research Board, Washington, D.C.
PennDOT. �2000�. Design manual, Part 4: Structures–procedures–design–plans, Publication 15M, Bethlehem, Pa.
PennDOT. �1997�. “LRFD P/S concrete girder design and rating.” PSL-RFD version 1.4a.
Precast/Prestressed Concrete Institute �PCI�. �2004�. Design handbook,6th Ed., Chicago.
Russell, B. W., and Burns, N. A. �1997�. Measurement of transfer lengthson pretensioned concrete elements.” J. Struct. Eng., 123�5�, 541–549.
Tabatabai, H., and Dickson, T. J. �1993�. “The history of the prestressingstrand development length equation.” PCI J., 38�6�, 64–75.
Witte, F. C., et al. �2005�. DIANA: Finite element analysis user’s manual:Release 9, TNO Building Construction and Research, Delft,The Netherlands.
ASCE license or copyright; see http://pubs.asce.org/copyright