investigation of bulky carboxylic acid and amines as
TRANSCRIPT

1
Investigation of bulky carboxylic acid and amines as
trapping agents for controlling the desorption of
molecular guests from a porous metal-organic framework
material
A Major Qualifying Project
Submitted to the faculty
of the
WORCESTER POLYTECHNIC INSTITUTE
In partial fulfillment of the requirements for the
Degree of Bachelor of Science
By:
U Shwe Thein ___________________
Date:04/27/2017
Approved:
____________________________
Prof. John C. MacDonald, advisor

2
Abstract
Metal-organic frameworks (MOFs) composed of 3-D networks of coordination polymers
are of interest as porous host materials for sorption, storage and release of molecular
guests. MOF crystals are permeated by channels that impart permanent porosity with
high surface areas, large pore volumes, and properties that can be modified through
synthesis. We currently are exploring a strategy to trap molecular guests inside MOF-5
crystals to prevent diffusion out of the porous host. Establishing a reliable method to trap
guests within MOFs is necessary to develop MOFs as materials for molecular storage
and delivery. Toward that goal, the work in this project focused in three areas: (1)
synthesis of a porous MOF and characterization of its structure and porosity, (2)
characterization of the sorption-desorption behavior of two organic guest compounds by
the unsealed MOF, and (3) investigation of the ability of sterically demanding trapping
agents to bind to the surface of MOF particles and inhibit diffusion of guests out of the
MOF. Porous MOF-5 was prepared via hydrothermal synthesis by reacting benzene-1,4-
dicarboxylic acid with zinc nitrate hexahydrate in diethylformamide at an elevated
temperature. The structure, porosity and stability of the MOF were assessed by powder
X-ray diffraction and thermogravimetric analysis. Sorption-desorption of two aromatic
dyes—rhodamine B and crystal violet—by unsealed MOF-5 in ethanol was examined
using UV-Vis spectroscopy. Trapping of the dyes within MOF-5 was investigated by
reacting solutions containing MOF crystals and dye with zinc nitrate hexahydrate and a
trapping agent—triphenylacetic acid, diphenylacetic acid or trimethylamine—at elevated
temperature, then monitoring desorption of the guest from the resulting loaded, sealed
MOF using TGA. This work demonstrated that chemically bonding a bulky, sterically-
demanding monocarboxylic acid or amine to the surface of MOF crystals is an effective
approach for trapping guests within MOFs.

3
Acknowledgements
I would like to especially thank my faculty advisor and MQP advisor, Professor John C.
MacDonald, for all this help, guidance and support. Over the last two years that I’ve
worked with him in the laboratory, I’ve gained a wealth of experience and knowledge that
have helped me succeed in college. This project was very challenging and would not
have been completed without his wisdom and counsel.
I would also like to Andrew Butler for his help in training me on how to use the lab
instruments and lending a set of quartz cuvettes.

4
Table of Contents
1. Abstract 2
2. Acknowledgements 3
3. Table of Figures 6
4. Introduction 8
5. Background 11
a. Porous solid materials 11
b. Metal-organic Frameworks 12
c. MOF-5 13
d. Adsorption of Polyaromatic hydrocarbons in MOFs 13
e. Rhodamine B 14
f. Crystal Violet 17
6. Experimental and Characterization 19
a. Synthesis of MOF-5 19
i. Solvothermal Synthesis of MOF-5 19
ii. Room Temperature Synthesis of MOF-5 19
b. Characterization Techniques 19
i. Powder X-ray Diffraction (PXRD) 19
ii. Thermogravimetric Analysis (TGA) 21
iii. Calibration curve of rhodamine B in ethanol 22
iv. Calibration curve of crystal violet in ethanol 24
7. Methodology for trapping molecular guests 26
a. Adsorption of dye into MOF-5 crystals 26
i. Adsorption of rhodamine B 26
ii. Adsorption of crystal violet 26
b. Desorption of dye out of MOF-5 Crystals 26
i. Desorption of rhodamine B 27
ii. Desorption of crystal violet 27
c. Sealing MOF-5 using trapping agents 29

5
i. Triphenylacetic acid as the trapping agent 29
ii. Diphenylacetic acid as the trapping agent 30
iii. Trimethylamine as the trapping agent 31
8. Results and Discussion 33
a. Synthesis and Characterization of MOF-5 33
b. Characterization of the sorption-desorption behavior of organic 34
guest compounds by the unsealed MOF-5
c. Investigation of sterically demanding trapping agents to bind to 38
the surface of the MOF-5 particles and inhibit diffusion of guests
out of the MOF-5
9. Conclusions 41
10. Future direction of research 42
11. References 43

6
Table of Figures
Figure 1. Overview of the process of sealing the MOF with trapping agents.
Figure 2. Schematic diagram of the framework structure of aluminosilicate zeolite A. Closed circles, open
circles and circles with dots represent Si, O and Al atoms, respectively.
Figure 3. The crystal structures of two MOFs with cubic architecture (bottom) prepared using ligands of
two different lengths (top).
Figure 4. MOF-5.
Figure 5. Bar graph showing the relative amounts of naphthalene and phenanthrene adsorbed into MOF-
5.
Figure 6. UV-Vis spectroscopy of rhodamine B in ethanol.
Figure 7. Chemical structure of rhodamine B (a) and ball-and-stick model from the crystal structure of
rhodamine B (b).
Figure 8. UV-Vis spectroscopy of crystal violet solution in ethanol.
Figure 9. Chemical structure of crystal violet (a) and ball-and-stick model from the crystal structure of
crystal violet (b).
Figure 10. PXRD trace of MOF-5 synthesized via solvothermal method.
Figure 11. PXRD trace of the microcrystals synthesized via room temperature method
Figure 12. TGA trace of decomposition of MOF-5 via heating.
Figure 13. UV-Vis spectroscopy graph showing rhodamine B solution in ethanol at five different
concentrations.
Figure 14. Calibration curve of rhodamine B in ethanol.
Figure 15. UV-Vis spectroscopy graph showing crystal violet solution in ethanol at five different
concentrations.
Figure 16. Calibration curve of crystal violet in ethanol.
Figure 17. UV-Vis spectroscopy graph of desorption of rhodamine B out of the unsealed MOF-5.
Figure 18. UV-Vis spectroscopy graph of desorption of crystal violet out of the unsealed MOF-5.
Figure 19. UV-Vis spectroscopy graph of desorption of rhodamine B out of the MOF-5 sealed by
triphenylacetic acid.
Figure 20. UV-Vis spectroscopy graph of desorption of crystal violet out of the MOF-5 sealed by
triphenylacetic acid.
Figure 21. UV-Vis spectroscopy graph of desorption of rhodamine B out of the MOF-5 sealed by
diphenylacetic acid.
Figure 22. UV-Vis spectroscopy graph of desorption of crystal violet out of the MOF-5 sealed by
diphenylacetic acid.
Figure 23. UV-Vis spectroscopy graph of desorption of rhodamine B out of the MOF-5 sealed by
trimethylamine.
Figure 24. UV-Vis spectroscopy graph of desorption of crystal violet out of the MOF-5 sealed by
trimethylamine.
Figure 25. UV-Vis spectroscopy graph showing desorption of rhodamine B from unsealed MOF-5.
Figure 26. UV-Vis spectroscopy graph showing desorption of crystal violet from unsealed MOF-5.

7
Figure 27. UV-Vis spectroscopy graph showing the maximum desorption of rhodamine B from unsealed
MOF-5 and sealed MOF-5 samples.
Figure 28. UV-Vis spectroscopy graph showing the maximum desorption of crystal violet from unsealed
MOF-5 and sealed MOF-5.

8
Introduction
Over the last two decades, metal-organic frameworks (MOFs), a class of hybrid porous
and highly-ordered materials, have attracted significant attention.1 MOFs are of interest
as porous host materials for adsorption, storage and release of molecular guests because
MOFs are permeated by channels that impart permanent porosity with high surface areas
and large pore volumes.2 The surface areas of MOFs have been estimated to be in the
range of 3000-4500 m2/g compared to the most porous zeolites, another class of porous
materials, which have surface areas in the range of 900 m2/g.3 Their porosity values which
is the ratio of their void volumes to their total volume, ranges from 0.2 to 0.95.4 These
pores are large enough to allow adsorption and diffusion of organic compounds within the
channels.5
MOFs are synthesized by using organic ligands coordinating to metal clusters to form 3-
D networks of coordination polymers with a high degree of order such that the resulting
solids are crystalline. Zeolites are made of aluminosilicate minerals and are entirely
inorganic.1 Even though MOFs and zeolites are both crystalline porous materials, they
are very different from each other. The organic ligands used to bridge the metal ions in
MOFs are rigid aromatic ligands that feature two or more functional groups capable of
binding to metal ions. Structural rigidity of the ligand is important to generate a robust
framework where the crystal structure is controlled by the geometry of coordination
around the metal ions, and the spacing between the metal ions is controlled by the length
of the organic ligand. As a result, it is possible to tailor the dimensions of the channels in
MOFs to meet the specific requirements of the chemist by specifically changing the length
of the ligand. In zeolites, the building blocks are not organic ligands but Si, Al and O atoms
and this necessarily leads to the formation of smaller channel dimensions.6 Also,
depending on the zeolite, it may be possible to change the pore sizes but these will be
much smaller in comparison to the pores in MOFs.6 Smaller pore sizes restrict the use of
zeolites as porous host materials to applications involving smaller guests.

9
Our research group has been exploring a strategy to trap molecular guests inside MOF
crystals to prevent diffusion out of the porous host. One potential application of this could
be MOFs could be used as a long term storage for drugs and in the presence of an
external stimuli, release the drug to the target area. Based off previous experiments, it
was decided that polyaromatic hydrocarbons (PAHs) such as rhodamine B and crystal
violet would be suitable molecular guests for adsorption into the MOF since MOFs are
good adsorbers of PAHs. As such, establishing a reliable method to trap guests within
MOFs is vital to the development of MOFs as materials for molecular storage and delivery.
The trapping agents chosen for this experiment had to be wide enough to block the pores
on the outer surface of the MOF crystal but small enough to occupy all the metal clusters
exposed on the surface without blocking off adjacent coordination sites. This would
ensure total coverage on the surface of the MOF.
Toward that goal, the work in this project focused in three areas: (1) synthesis of a porous
MOF and characterization of its structure and porosity, (2) characterization of the
sorption-desorption behavior of two organic guest compounds by the unsealed MOF, and
(3) investigation of the ability of sterically demanding trapping agents to bind to the surface
of MOF particles and inhibit diffusion of guests out of the MOF. Porous MOF-5 was
prepared via hydrothermal synthesis by reacting benzene-1,4-dicarboxylic acid with zinc
nitrate hexahydrate in diethylformamide at an elevated temperature. The structure,
porosity and stability of the MOF were assessed by powder X-ray diffraction (PXRD) and
thermogravimetric analysis (TGA). Sorption-desorption of the two aromatic dyes—
rhodamine B and crystal violet—by unsealed MOF-5 in ethanol was examined using UV-
Vis spectroscopy. Trapping of the dyes within MOF was investigated by reacting solutions
containing MOF particles and dye with zinc nitrate and a trapping agent—triphenylacetic
acid, diphenylacetic acid or trimethylamine—at elevated temperature, then monitoring
desorption of the guest from the resulting loaded, sealed MOF. Figure 1 below shows a
simplified diagram for the method used to trap the adsorbed guest molecules inside the
MOF structure.

10
Figure 1. Overview of the process of sealing the MOF with trapping agents.

11
Background
Porous solid Materials
Porous solid materials that have channels or pores permeating their structures are large
enough to allow diffusion of molecular guests. The structures of these materials can
remain unchanged even after removal of their guest molecules. Porous solids usually
have high porosity (fraction of the void volumes and the total volume of the solid) with
values ranging from 0.2 – 0.95.4 These properties together make porous solid materials
ideal for use involving molecular sorption and storage. Carbon filtering is a method that
uses activated carbon, a solid porous material, in water treatment plants purify water by
absorbing contaminants and odors via chemical adsorption.
An example of a highly ordered porous material are inorganic zeolites. These materials
consist of hydrated aluminosilicate structures with countercations such as sodium ions.
Zeolites are widely regarded as some of the most important heterogeneous catalysts due
to their selectivity character, thermal stability, ion exchange activity and crystalline
properties.5 Figure 2 below shows the framework structure of aluminosilicate zeolite A.
Figure 2. Schematic diagram of the framework structure of aluminosilicate zeolite A. Closed circles, open circles and circles with dots represent Si, O and Al atoms, respectively.14

12
Metal-organic Frameworks
Metal-organic frameworks (MOFs) consist of 3-D networks of coordination polymers that
are composed of metal clusters coordinated to adjacent rigid organic ligands. MOFs are
permeated by channels that impart permanent porosity with high surface areas, large
pore volumes, and properties that can be modified through synthesis. For example,
shown in Figure 3 are the crystal structures of cubic MOF-5 prepared from benzene-1,4-
dicarboxylic acid and Zn(NO3)2 (left) and the corresponding MOF prepared from
naphthalene-2,6-dicarboxylic acid and Zn(NO3)2 (right). Expanding the length of the rigid,
linear ligand by replacing benzene with naphthalene results in a homologous cubic
structure in which the void volume of the channels increases from 79% to 84% in the
crystal.11 The structure, surface areas and pore volumes of the MOFs can be varied by
changing the organic ligand. MOFs are highly porous and possess high surface areas in
the range of 3000-4500 m2/g, compared to zeolites with surface areas in the range of 900
m2/g.3
Figure 3. The crystal structures of two MOFs with cubic architecture (bottom) prepared using ligands of two
different lengths (top).

13
MOF-5
MOF-5 was first developed in 1999 by Omar M. Yaghi et all and was originally described
as consisting of Zn4O units connected by benzene-1,4-dicarboxylic acid to form a cubic
structure.8 MOF-5 was chosen for our study specifically its structure is highly symmetric
such that the channels are uniform in all dimensions—therefore, the pore openings also
are uniform on all surfaces of MOF-5 crystals with the same structures and same chemical
functionalities present at all surfaces—namely either solvated Zn metal ions or BDC
molecules projecting off those surfaces. In addition, the cubic symmetry is essential for
our purposes because it means that the exposed functionalities for binding
monocarboxylic acid trapping agents are positioned in a square grid with known spacing.
That allowed us to calculate the maximum size for substituents on the trapping agent to
provide maximum coverage of pore openings without being too large, which would lead
to incommensurate binding and leakage from incomplete coverage. Figure 4 shows a 3-
D view of the MOF-5.
Figure 4. MOF-5.
Adsorption of Polyaromatic Hydrocarbons (PAHs) in MOFs
Previous work in our group investigating the absorption behavior of MOF-5 toward
hydrophobic polyaromatic hydrocarbon (PAHs) showed that MOF-5 is a good absorber
of PAHs and preferentially absorbs PAHs that have similar dimensions to diameters of
channels measuring 12.9 Å × 12.9 Å × 12.9 Å. Figure 5 below shows the amount of
naphthalene and phenanthrene that was absorbed by the MOF-5 from solutions
containing equimolar amounts of naphthalene and phenanthrene at three different

14
concentration values of 2mM, 3mM and 5mM.9 That study showed that MOF-5
preferentially absorbs phenanthrene over naphthalene by an average factor of 8.2 ± 0.3.9
We also have shown previously that MOF-5 and other MOFs developed in our group
adsorb greater concentrations of non-polar aromatic compounds (e.g. toluene) compared
to polar aromatic compounds (e.g. phenol, benzenoic acid), suggesting that the channels
of MOF-5 are largely hydrophobic due to the non-polar benzene ring of the ligand 1,4-
benzenedicarboxylic acid.10
Figure 5. Bar graph showing the relative amounts of naphthalene and phenanthrene adsorbed into the MOF-5.9
Rhodamine B
For the work described in this study, it was important to use dyes that were easy to
observe both qualitatively by visually inspecting it and quantitatively by using UV-Vis
spectroscopy so that it can be determined whether the dye present in the MOF-5 samples
was diffusing out of the pores. The dimensions of the dye also had to be small enough to
fit within the channels of the MOF-5 but large enough so that the guest cannot diffuse out
of the MOF-5 when the trapping agents are bound on the surface of the MOF-5.
15
The length of one side of the MOF-5 pores, measured from the center of one metal ion to
another along the benzene-1,4-dicarboxylic acid, is 12.9 Å and hence the dimensions of
the MOF-5 pores must be 12.9 Å × 12.9 Å × 12.9 Å. Even though the dimensions of
rhodamine B are 15 Å × 11.3 Å × 5.9 Å, the aromatic dye is mainly flat and small enough
so that it could easily diffuse into the MOF-5 pores. When MOF-5 is sealed, the trapping
agent binds to the metal ion and it will occupy an area with its center about the metal ion
and sterically hinder the diffusion of the dye out of the MOF-5. For example, the area from
which a dye molecule can diffuse out from is 12.9 Å × 12.9 Å. A molecule of triphenylacetic
acid, the biggest trapping agent used in this study, occupies a theoretical circular area
with a radius of 12.4 Å at each corner of this area. By calculation, it can be shown that
triphenylacetic acid can block off approximately 72% area of the pores and rhodamine B
is not small enough to fit through the opening in the center of the pore.
Also, the functional groups of the dye must not interact too strongly within the pores of
the MOF-5. If it does, then it’ll be difficult to determine whether the dye is present in the
MOF-5 because of strong interactions between the dye molecules and the walls or
whether it was successful trapping that retained the dye inside the MOF-5. Rhodamine B
was one of the dyes that fulfilled all these requirements. Rhodamine B forms a deep red
solution in both ethanol and DEF and its bright color helps to observe the presence of the
dye inside the MOF-5 both qualitatively and quantitatively. The UV-Vis spectroscopy of
the solution of rhodamine B in ethanol shows a strong absorbance peak at 542 nm as
shown in Figure 6.

16
Figure 6. UV-Vis spectroscopy of rhodamine B in ethanol.
Figure 7 below shows the structure of the dye and its functional groups. The carboxylic
group on the rhodamine B does not react with the walls of the MOF-5 since the metal
clusters are already in coordination with benzene-1,4-dicarboxylic acid. Furthermore,
coordination of this carboxylic acid group to metal clusters is sterically unfavorable.
a. b.
Figure 7. Chemical structure of rhodamine B (a) and ball-and-stick model from the crystal structure of rhodamine B (b).

17
Crystal Violet
Crystal violet was also another dye that fulfilled the necessary requirements stated above.
The dimensions of crystal violet are 14.9 Å × 12.2 Å × 4.9 Å. It is also flat and small so
the molecule can easily diffuse into the channels of the MOF-5 but it is also large enough
so that it cannot diffuse out of the MOF-5 when the trapping agents are bound to the metal
ions on the surface of the MOF-5. Crystal violet forms a deep violet solution in both
ethanol and DEF and its bright color helps to observe the presence of the dye inside the
MOF-5 both qualitatively and quantitatively. The UV-Vis spectroscopy of the solution of
crystal violet in ethanol shows a strong absorbance peak at 589 nm as shown in Figure
8.
Figure 8. UV-Vis spectroscopy of crystal violet solution in ethanol.
Figure 9 below shows the structure of the dye and its functional groups. The positive
tertiary amine group on the crystal violet does not react with the walls of the MOF-5 since
the metal clusters are already in coordination with benzene-1,4-dicarboxylic acid.

18
a. b.
Figure 9. Chemical structure of crystal violet (a) and ball-and-stick model from the crystal structure of crystal violet (b).

19
Experimental and Characterization
Synthesis of MOF-5
Solvothermal Synthesis of MOF-5
Zinc nitrate hexahydrate (1.53 g, 5.2 mmol) and benzene-1,4-dicarboxylic acid (0.70 g,
4.2 mmol) were mixed in 100 mL of diethylformamide (DEF) and sealed in a high-pressure
microwaveable glass vial. The solution was heated in an oven for 48 hours at 100°C, after
which it cooled to room temperature. Clear cubic crystals were formed in the solution over
time and were later identified as MOF-5 crystals by powder X-ray diffraction and
thermogravimetric analysis. The crystals were kept in the solution to prevent solvent from
evaporating out of the pores.
Room Temperature Synthesis of MOF-5
Zinc nitrate hexahydrate (1.21 g, 4 mmol) and benzene-1,4-dicarboxylic acid (0.34 g, 2
mmol) was added to 40 mL of dimethylformamide solution in a round bottomed flask.
Triethylamine (1.6 g, 16 mmol) was added to the solution, which was then stirred for 4
hours at room temperature until microcrystals of MOF-5 were formed in suspension. The
microcrystals were kept in the solution to prevent solvent from evaporating out of the
pores.
Characterization techniques
Powder X-ray diffraction (PXRD)
Powder X-ray diffraction data was collected by using a Bruker-AXS D8-Advance
diffractometer. PXRD was used to verify whether the correct crystalline phase was
obtained for the samples of MOF-5. 0.50 g of clear colorless cubic crystals of MOF-5 were
prepared for powder X-ray diffraction analysis by extracting them from the solution in
which they were synthesized, washed with few drops of ethanol to briefly remove the
residual solution from the surface and blotted dry between two filter papers. The crystals
were ground with a pestle and mortar to from smaller crystallites and loaded on to the

20
sample holder in the diffractometer, after covering it with a layer of parafilm. The sample
was prepared quickly as quickly as possible to reduce its exposure to water vapor since
it has been shown previously that exposure to water vapor can lead to solid phases other
than MOF-5.12 The Cu X-rays used for the experiment were generated at 40kV and 20
mA. The readings were taken at 0.05° steps with a scan rate of 2° per minute from 3° to
50° by using 2θ scanning method. The crystalline phase of the samples was verified as
MOF-5 by comparing the experimental PXRD traces to the previously reported PXRD
traces for MOF-5 to ensure a good match.7 Figure 10 below shows the experimental
PXRD trace corresponding to the MOF-5 synthesized by the solvothermal method and
figure 11 shows the PXRD trace corresponding to the micro-crystals synthesized by the
room temperature method.
Figure 10. PXRD trace of MOF-5 synthesized via solvothermal method.

21
Figure 11. PXRD trace of the microcrystals synthesized via room temperature method.
Thermogravimetric analysis
Thermogravimetric analysis data was collected by using a TA Instruments Hi-Res TGA
2950 Thermogravimetric Analyzer. TGA is used to analyze the porosity of the sample by
heating the sample and recording the loss of solvent from the sample simultaneously.
0.10 g of clear colorless cubic crystals of MOF-5 were prepared for thermogravimetric
analysis by extracting them from the solution in which they were synthesized, washed
with few drops of ethanol to briefly remove the residual solution from the surface and
blotted dry between two filter papers. The sample was prepared as quickly as possible to
minimize the amount of DEF evaporating from the MOF-5, so that the percentage of the
mass of DEF in the MOF-5 can determined as accurately as possible. The MOF-5 sample
was heated at a rate of 10°C per minute from 20°C to 600°C. The experimental TGA trace
for MOF-5 was compared to TGA traces reported previously to determine the total
reduction in mass corresponding to the amount of solvent and guest lost from the crystals
during heating and determine the thermal stability of MOF-5. The thermal behavior of our
samples was then compared to the corresponding data reported previously. and

22
documents to validate the identity of the synthesized crystals. Figure 12 shows the TGA
trace obtained from heating a sample of MOF-5.
Figure 12. TGA trace of decomposition of MOF-5 via heating.
Calibration curve of rhodamine B in ethanol
Rhodamine B (5.0 mg) was dissolved in 50 mL of ethanol and the solution was diluted
down to a concentration of 0.0134 mM to make the stock solution. The concentration of
the solution was such that it was high enough for the dye to actively diffuse into the MOF
but low enough so that the highest absorbance value of the solution is less than 2.0. This
was because absorbance values can be determined more accurately if it is less than 2.
Multiple 10% dilutions of the stock solution were performed and until a total of 5 readings
under the absorbance value of 2 were obtained. These points were used to construct a
calibration curve of rhodamine B in ethanol. Figure 13 below shows the absorbance peak
values at five different concentrations of rhodamine B and figure # shows the calibration
curve of rhodamine B in ethanol.

23
Figure 13. UV-Vis spectroscopy graph showing rhodamine B solution in ethanol at five different
concentrations.
Figure 14. Calibration curve of rhodamine B in ethanol.
y = 84072x
0.6
0.7
0.8
0.9
1
1.1
1.2
8.00E-06 9.00E-06 1.00E-05 1.10E-05 1.20E-05 1.30E-05 1.40E-05 1.50E-05 1.60E-05
Ab
sorb
ance
Concentration
Concentration curve of rhodamine B in ethanol
Concentration curve of Rhodamine B in Ethanol
Linear (Concentration curve of Rhodamine B in Ethanol)

24
Calibration curve of crystal violet in ethanol
Crystal violet (5.0 mg) was dissolved in 50 mL of ethanol and the solution was diluted
down to a concentration of 0.0136 mM to make the stock solution. Again, the
concentration of the solution was such that it was high enough for the dye to actively
diffuse into the MOF but low enough so that the highest absorbance value of the solution
is less than 2.0. Multiple 10% dilutions of the stock solution were performed and until a
total of 5 readings under the absorbance value of 2 were obtained. These points were
used to construct a calibration curve of crystal violet in ethanol. Figure 15 below shows
the absorbance peak values at five different concentrations of crystal violet.
Figure 15. UV-Vis spectroscopy graph showing crystal violet solution in ethanol at five different
concentrations.

25
Figure 16. Calibration curve of crystal violet in ethanol.
y = 129419x
0.6
0.8
1
1.2
1.4
1.6
1.8
2
8.00E-06 9.00E-06 1.00E-05 1.10E-05 1.20E-05 1.30E-05 1.40E-05 1.50E-05 1.60E-05
Ab
sorb
ance
Concentration (M)
Concentration curve of crystal violet in ethanol
Concentration curve of Crystal Violet in Ethanol
Linear (Concentration curve of Crystal Violet in Ethanol)

26
Methodology for trapping molecular guests
Adsorption of dye into MOF-5 crystals
Adsorption of rhodamine B
A red saturated solution of rhodamine B in ethanol was prepared in a 100 mL beaker.
0.10 g of clear colorless MOF-5 crystals was extracted from the solution in which they
were synthesized, washed with few drops of ethanol to briefly remove the residual
solution from the surface, blotted dry between two filter papers and placed in the
rhodamine B solution for 24 hours, during which the clear colorless crystals turned bright
red. The loaded crystals were extracted, washed with ethanol and blotted dry to remove
dye on the surface. This was done to ensure that the red color of the crystals was due to
the guest rhodamine B being present inside the MOF-5.
Adsorption of crystal violet
A violet saturated solution of crystal violet in ethanol was prepared in a 100 mL beaker.
0.10 g of clear colorless MOF-5 crystals was extracted from the solution in which they
were synthesized, washed with few drops of ethanol to briefly remove the residual
solution from the surface, blotted dry between two filter papers and placed in the crystal
violet solution for 24 hours, during which the clear colorless crystals turned dark violet.
The loaded crystals were extracted, washed with ethanol and blotted dry to remove dye
on the surface. This was done to ensure that the violet color of the crystals was due to
the guest crystal violet being present inside the MOF-5.
Desorption of dye out of MOF-5 crystals
Desorption of rhodamine B
0.10 g of MOF-5 crystals loaded with rhodamine B were placed in a quartz cuvette
containing 4.0 mL of pure ethanol. The quartz cuvette with a path length of 1 cm was
placed in a Thermo Scientific Evolution 300 UV-Vis Spectrophotometer and the
absorbance of the solution was measured over a period of an hour. Over time, the

27
colorless solution turned red and the absorbance peak signal increased at 542 nm,
showing that rhodamine B can diffuse out of the MOF-5 without the presence of trapping
agents on the surface. Figure 17 shows the desorption of rhodamine B from MOF-5. The
maximum concentration of the desorption at the 1 hour mark was determined to be
9.99×10⁻⁹ M.
Figure 17. UV-Vis spectroscopy graph of desorption of rhodamine B out of the unsealed MOF-5.
Desorption of crystal violet
0.10 g of MOF-5 crystals loaded with crystal violet were placed in a quartz cuvette
containing 4.0 mL of pure ethanol. The quartz cuvette with a path length of 1 cm was
placed in a Thermo Scientific Evolution 300 UV-Vis Spectrophotometer and the
absorbance of the solution was measured over a period of an hour. Over time, the
colorless solution turned violet and the absorbance peak signal increased at 589 nm,

28
showing that crystal violet can diffuse out of the MOF-5 without the presence of trapping
agents on the surface. Figure 18 shows the desorption of crystal violet from MOF-5. The
maximum concentration of the desorption at the 1 hour mark was determined to be
3.48×10⁻⁹ M.
Figure 18. UV-Vis spectroscopy of desorption of crystal violet out of the unsealed MOF-5.
29
Sealing MOF-5 Crystals using trapping agents
Triphenylacetic acid as the trapping agent
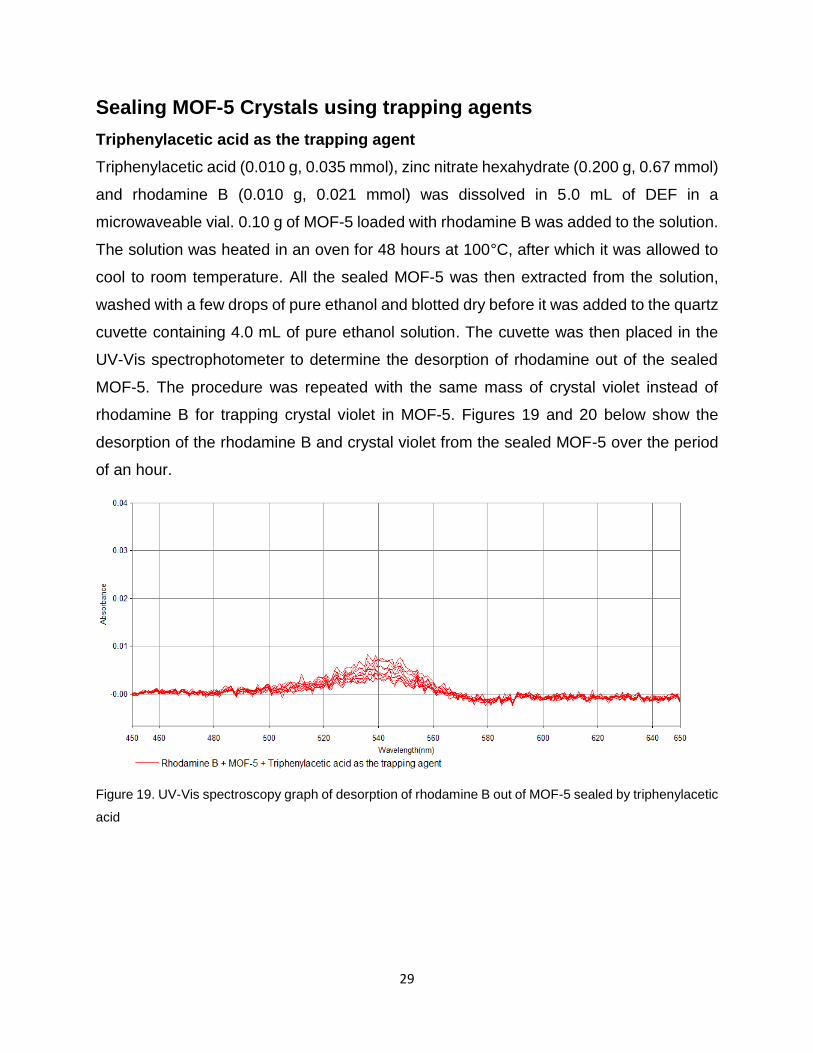
Triphenylacetic acid (0.010 g, 0.035 mmol), zinc nitrate hexahydrate (0.200 g, 0.67 mmol)
and rhodamine B (0.010 g, 0.021 mmol) was dissolved in 5.0 mL of DEF in a
microwaveable vial. 0.10 g of MOF-5 loaded with rhodamine B was added to the solution.
The solution was heated in an oven for 48 hours at 100°C, after which it was allowed to
cool to room temperature. All the sealed MOF-5 was then extracted from the solution,
washed with a few drops of pure ethanol and blotted dry before it was added to the quartz
cuvette containing 4.0 mL of pure ethanol solution. The cuvette was then placed in the
UV-Vis spectrophotometer to determine the desorption of rhodamine out of the sealed
MOF-5. The procedure was repeated with the same mass of crystal violet instead of
rhodamine B for trapping crystal violet in MOF-5. Figures 19 and 20 below show the
desorption of the rhodamine B and crystal violet from the sealed MOF-5 over the period
of an hour.
Figure 19. UV-Vis spectroscopy graph of desorption of rhodamine B out of MOF-5 sealed by triphenylacetic
acid

30
Figure 20. UV-Vis spectroscopy of desorption of crystal violet out of MOF-5 sealed by triphenylacetic acid
Diphenylacetic acid as the trapping agent
Diphenylacetic acid (0.007 g, 0.033 mmol), zinc nitrate hexahydrate (0.200 g, 0.67 mmol)
and rhodamine B (0.010 g, 0.021 mmol) was dissolved in 5.0 mL of DEF in a
microwaveable vial. 0.10 g of MOF-5 loaded with rhodamine B was added to the solution.
The solution was heated in an oven for 48 hours at 100°C, after which it was allowed to
cool to room temperature. All the sealed MOF-5 was then extracted from the solution,
washed with a few drops of pure ethanol and blotted dry before it was added to the quartz
cuvette containing 4.0 mL of pure ethanol solution. The cuvette was then placed in the
UV-Vis spectrophotometer to determine the desorption of rhodamine out of the sealed
MOF-5. The procedure was repeated with the same mass of crystal violet instead of
rhodamine B for trapping crystal violet in MOF-5. Figures 21 and 22 below show the
desorption of the rhodamine B and crystal violet from the sealed MOF-5 over the period
of an hour.

31
Figure 21. UV-Vis spectroscopy of desorption of rhodamine B out of MOF-5 sealed by diphenylacetic acid
Figure 22. UV-Vis spectroscopy of desorption of crystal violet out of MOF-5 sealed by diphenylacetic acid
Trimethylamine as the trapping agent
Trimethylamine hydrochloride (0.003 g,0.031 mmol), Zinc nitrate hexahydrate (0.200 g,
0.67 mmol) and rhodamine B (0.010 g, 0.021 mmol) was dissolved in 5 mL of DEF in a
microwaveable vial. 0.10 g of MOF-5 loaded with rhodamine B was added to the solution.
The solution was heated in an oven for 48 hours at 100°C, after which it was allowed to
cool to room temperature. All the sealed MOF-5 was then extracted from the solution,
washed with a few drops of pure ethanol and blotted dry before it was added to the quartz
cuvette containing 4.0 mL of pure ethanol solution. The cuvette was then placed in the

32
UV-Vis spectrophotometer to determine the desorption of rhodamine out of the sealed
MOF-5. The procedure was repeated with the same mass of crystal violet instead of
rhodamine B for trapping crystal violet in MOF-5. Figures 23 and 24 below show the
desorption of the rhodamine B and crystal violet from the sealed MOF-5 over the period
of an hour.
Figure 23. UV-Vis spectroscopy of desorption of rhodamine B out of MOF-5 sealed by trimethylamine.
Figure 24. UV-Vis spectroscopy of desorption of crystal violet out of MOF-5 sealed by trimethylamine.

33
Results and Discussion
Synthesis and Characterization of MOF-5
It was imperative to make sure that the crystals synthesized via the solvothermal method
were indeed MOF-5 before it could be used for further investigation. This was because
the experiment strictly requires the use of MOF-5. The crystals isolated from the reaction
solution were inspected under a low-power polarizing microscope to verify that most of
the crystals observed that most of the crystals had a similar cubic morphology. The
identity of the MOF-5 crystals was validated by powder X-ray diffraction. 0.50 g of MOF-
5 crystals of were prepared for powder X-ray diffraction analysis by extracting them from
the reaction solution, washed with few drops of ethanol to briefly remove the residual
solution from the surface and blotted dry between two filter papers. The crystals were
ground with a pestle and mortar to from smaller crystallites and loaded on to the sample
holder in the diffractometer, after covering it with a layer of parafilm. The sample was
prepared quickly as quickly as possible to reduce its exposure to water vapor. Minimizing
exposure of MOF-5 crystals to water vapor was important because the MOF-5 is known
to react with water causing MOF-5 structure to undergo a phase change to form a porous
MOF structure similar to MOF-5 having slightly higher internal surface area due to water
protonating some of the carboxylate acid groups bound to Zn ions in the backbone of the
framework.12 The PXRD trace of the synthesized MOF-5, shown in Figure 10, was
compared to those reported previously.7 Each peak in the PXRD trace represents a
unique set of lattice planes present in the crystal structure of the MOF-5. Comparison of
the experimental and reported SXRD traces showed that the crystals prepared via
hydrothermal synthesis by reacting benzene-1,4-dicarboxylic acid with zinc nitrate
hexahydrate and using diethylformamide as the solvent consisted of MOF-5. In addition,
the positions of the peaks in a PXRD trace calculated from the published crystal structure
using the mercury software package.13
Thermogravimetric analysis (TGA) was used to measure the mass of guest DEF lost from
the pores of MOF-5 upon heating samples of MOF-5 in order to verify porosity. Samples
of the crystals of MOF-5 tested were left in the reaction solution prior to testing to prevent

34
guest DEF from evaporating out of the MOF on standing in air. Upon removal from
solution, crystals of MOF-5 were blotted dry on filter paper to remove solution on the
surface of the crystals and then immediately loaded on the pre-tared Pt pan and tested.
This was done to measure the mass loss as accurately as possible since the DEF can
easily diffuse out of the large pores of the MOF on standing in air. Figure 12 shows the
TGA trace obtained when a sample of MOF-5 was heated from 20°C to 600°C at the rate
of 10°C per minute. The graph shows that about 52% of the total mass was lost before
the sample reached 300°C. The loss of mass from the MOF-5 between room temperature
and 300°C coincides with the boiling point of DEF of 177°C and can be attributed to
molecules of guest DEF solvent leaving the channels of MOF-5. The steep slope in the
graph from 100°C to 140°C represents rapid loss of mass of about 26 wt%. This was most
likely bulk guest DEF evaporating from the general void space in the interior channels
within the MOF as this process would require less energy. The less inclined slope from
140°C to 300°C shows a relatively slower loss of mass of about 13 wt% over a broader
range of temperature. This was most likely guest DEF at the edges of the channels in
contact with the molecular surfaces of the MOF-5 backbone evaporating from the inner
surface of the MOF-5 as this required more energy. Previous studies have shown that
molecular guests typically bind most strongly via intermolecular interactions on the
surface of the metal centers and aromatic rings and less strongly in the general void space
in the interior of the channels in MOF-5. Those findings support our observation that at
temperatures well above the boiling point of DEF, the MOF-5 still proceeds to lose mass.
Alternatively, the loss of mass above the boiling point of DEF could also be explained, in
part, by loss of excess starting materials with boiling points higher than that of DEF. Given
the molar ratio of starting materials used to synthesize MOF-5 and the 4:3 ratio of
Zn:benzene-1,4-dicarboxylic acid present in MOF-5 the loss of solvent is the more likely
explanation.
Characterization of the sorption-desorption behavior of two
organic guest compounds by the unsealed MOF-5
After validating the identity of the MOF-5 crystals, the next step involved trapping the
organic molecules inside the MOF. Before the MOF loaded with organic guests was

35
sealed, it was necessary to demonstrate that the guest dyes could diffuse into and out of
the crystals. If the guests were completely trapped by inside the MOF after diffusing into
it, then there would not be a need to use trapping agents to seal the MOF. In addition, the
sorption and desorption of the dyes in and out of the MOF would prove that the dye
molecules had dimensions small enough to be accommodated inside the pores of the
MOF-5.
After soaking crystals of MOF-5 separately in saturated solutions of the two dyes –
rhodamine B and crystal violet-for 24 hours, the loaded MOF samples were washed with
ethanol to remove the dye from the outer surface, then placed in a clear solution of ethanol
and desorption of the dye was measured over the period of an hour via UV-Vis
spectroscopy. Figure 17 shows a comparison of the desorption of rhodamine B from
unsealed MOF-5 and figure 18 shows a comparison the desorption of crystal violet from
unsealed MOF-5. It is possible to calculate the concentration of a dye in solution by using
Beer’s Law formula, A= εcl where ε is the molar absorptivity coefficient, c is the
concentration of the solution and l is the path length of the light or width of the cuvette.
Since the path length and molar absorptivity is the same for a dye, increasing absorbance
readings indicate an increase in concentration of the solution.

36
Figure 25. UV-Vis spectroscopy graph showing desorption of rhodamine B from unsealed MOF-5.

37
Figure 26. UV-Vis spectroscopy graph showing desorption of crystal violet from unsealed MOF-5.
Keeping in mind that these graphs only show desorption of the dyes from the MOF-5 over
the period of an hour, the maximum desorption detected in this period is not the maximum
amount of dye that can diffuse out of the MOF-5. If the readings were taken over a period
of two hours, then the maximum desorption detected would have been higher.
Using the calibration curve for the concentration of the dyes in ethanol (see figures 14
and 15), the concentration of the dye at the highest absorbance value can be calculated.
The maximum absorbance value of rhodamine B in ethanol, measured over the period of
an hour, is 0.084. This corresponds to a concentration of 9.99×10⁻⁷ M. The maximum

38
absorbance value of crystal violet in ethanol, measured over the period of an hour, is 0.45.
This corresponds to a concentration of 3.48×10⁻⁶ M.
Investigation of the ability of sterically demanding trapping agents to bind to the
surface of the MOF particles and inhibit diffusion of guests out of the MOF
The final step in this study focuses on determining the effectiveness of trapping the guest
dyes inside the MOF-5 by comparing the desorption values of unsealed MOF-5 and MOF-
5 sealed with triphenylacetic acid, diphenylacetic acid and trimethylamine as the trapping
agents. Figure 27 is a UV-Vis spectroscopy graph comparing the desorption of rhodamine
B out of the unsealed MOF-5 with desorption of rhodamine B out of MOF-5 with the three
different trapping agents present on the surface. The following graphs show the only the
maximum absorbance curves of unsealed MOF-5 and MOF-5 sealed with triphenylacetic
acid, diphenylacetic acid and trimethylamine as the trapping agents, that have been
measured over the period of an hour in the UV-Vis spectrometer.
Figure 27. UV-Vis spectroscopy graph showing the maximum desorption of rhodamine B from unsealed
MOF-5 and sealed MOF-5 samples.

39
At the maximum absorbance wavelength of 542 nm, the concentration of the dye diffusing
from 0.5 g of unsealed MOF-5 was 9.63×10⁻⁷ M. At the same wavelength with the same
mass of sample, the concentration of the dye diffusing out of MOF-5 sealed with
triphenylacetic acid, diphenylacetic acid and trimethylamine were 8.32×10⁻⁸ M, 3.56×10⁻⁸
M and 1.54×10⁻⁷ M, respectively. Since 4.0 mL of ethanol was the solvent used in the
desorption process, the concentration of the dye in the solutions is directly proportional
to the amount of dye that diffused out of the MOF-5 samples. Here, diphenylacetic acid
was the most effective trapping agent due to its lowest concentration as seen from the
graph.
Figure 28 is a UV-Vis spectroscopy graph comparing the desorption of crystal violet out
of the unsealed MOF-5 with desorption of crystal violet out of MOF-5 with the three
different trapping agents present on the surface.
Figure 28. UV-Vis spectroscopy graph showing the desorption of crystal violet from unsealed MOF-5 and
sealed MOF-5 samples.

40
At the maximum absorbance wavelength of 589 nm, the concentration of the dye diffusing
from 0.5 g of unsealed MOF-5 was 3.44×10⁻⁶ M. At the same wavelength with the same
mass of sample, the concentration of the dye diffusing out of MOF-5 sealed with
triphenylacetic acid, diphenylacetic acid and trimethylamine were 7.72×10⁻⁹ M, 1.55×10⁻⁸
M and 3.09×10⁻⁸ M, respectively. Since 4.0 mL of ethanol was the solvent used in the
desorption process, the concentration of the crystal violet in the solutions is directly
proportional to the amount of crystal violet that diffused out of the MOF-5 samples. Here,
in addition triphenylacetic acid being the most effective trapping agent diphenylacetic acid
and trimethylamine were also very effective, as seen from the graph.

41
Conclusion
• Coordination of bulky carboxylic acids and tertiary amines on the surface of the
MOF-5 is an effective strategy to trap molecular guests for storage in MOF-5.
• Analysis of MOF-5 crystals loaded with rhodamine B or crystal violet (molecular
guests) showed that sterically blocking the pores on the surface of MOF-5 with
triphenylacetic acid, diphenylacetic acid and triethylamine (trapping agents)
prevents diffusion of the guests out of the MOF.
• Diethylformamide (DEF) is necessary as the solvent for solvothermal synthesis of
MOF-5 and solvothermal sealing with trapping agents. DMF cannot be used as
the solvent for either purpose.

42
Future direction of research
• Develop photolabile carboxylic acids as trapping agents that can be removed as
a strategy to store and then release molecular guests in response to light.
• Investigate the relationship between steric bulk of substituents on trapping
agents and the ability of those trapping agents to prevent leakage of molecular
guests.
43
References
1.Zhou, H.-C.; Long, J. R.; Yaghi, O. M., Introduction to metal–organic frameworks. Chemical reviews 2012, 112 (2), 673-674. 2.Rowsell, J. and Yaghi, O. (2004). Metal–organic frameworks: A new class of porous materials.Microporous and Mesoporous Materials, 73, 3-14. 3. Eddaoudi, M.; Kim, J.; Rosi, N.; Vodak, D.; Wachter, J.; O'Keeffe, M.; Yaghi, O. M., Systematic Design of Pore Size and Functionality in Isoreticular MOFs and Their Application in Methane Storage. Science 2002, 295 (5554), 469-472. 4.Rouquerol, J.; Rouquerol, F.; Llewellyn, P.; Maurin, G.; Sing, K. S., Adsorption by powders and porous solids: principles, methodology and applications. Academic press: 2013. 5. Csicsery, S. M., Shape-selective catalysis in zeolites. Zeolites 1984, 4 (3), 202- 213. 5. Csicsery, S. M. (1984). Shape-selective catalysis in zeolites. Zeolites,4(3), 202-213. doi:10.1016/0144-2449(84)90024-1 6. Weitkamp, J. (2000). Zeolites and catalysis. Solid State Ionics, 131(1-2), 175-188. doi:10.1016/s0167-2738(00)00632-9 7. Tranchemontagne, D. J., Hunt, J. R., & Yaghi, O. M. (2008). Room temperature synthesis of metal-organic frameworks: MOF-5, MOF-74, MOF-177, MOF-199, and IRMOF-0. Tetrahedron,64(36), 8553-8557. doi:10.1016/j.tet.2008.06.036 8. Li, H.; Eddaoudi, M.; O’Keeffe, M.; Yaghi, O. Nature 1999, 402, 276–279. 9. Voskian, S. (2011). Design and Application of Metal Organic Frameworks (Undergraduate Major Qualifying Project No. E-project-042811-164737). Retrieved from Worcester Polytechnic Institute Electronic Projects Collection: https://web.wpi.edu/Pubs/E-project/Available/E-project-042811-164737
10. MacDonald, J. (2017, April 25). Private communication.
11. Eddaoudi, M; Kim, J.; Rosi, N.; Vodak, D.; Watcher, J.; O’Keefe, M.; Yaghi, O. M. Science, 2002, 295, 469-472.
12. Huang, L.; Wang, H.; Chen, J.; Wang, Z.; Sun, J.; Zhao, D.; Yan, Y. Microporous and Mesoporous Materials, 2013, 58, 105-114
13. Mercury CSD 2.0 - New Features for the Visualization and Investigation of Crystal Structures C. F. Macrae, I. J. Bruno, J. A. Chisholm, P. R. Edgington, P. McCabe, E. Pidcock, L. Rodriguez-Monge, R. Taylor, J. van de Streek and P. A. Wood, J. Appl. Cryst., 41, 466-470, 2008 [DOI: 10.1107/S0021889807067908]

44