investigation of astm e 238 bearing pin properties for
TRANSCRIPT
INVESTIGATION OF ASTM E 238 BEARING PIN PROPERTIES FOR VARIOUS AEROSPACE ALLOYS
A Thesis
presented to
the Faculty of California Polytechnic State University,
San Luis Obispo
In Partial Fulfillment
of the Requirements for the Degree
Master of Science in Engineering –
Materials Engineering Specialization
by
Trevor J Lee
September 2013

© 2013Trevor J Lee
ALL RIGHTS RESERVED
ii

COMMITTEE MEMBERSHIP
TITLE: Investigation of ASTM E 238 Bearing Pin Properties for Various Aerospace Alloys
AUTHOR: Trevor J Lee
DATE SUBMITTED: September 2013
COMMITTEE CHAIR: Trevor Harding, PhDProfessor of Materials Engineering
COMMITTEE MEMBER: Linda Vanasupa, PhDProfessor of Materials Engineering
COMMITTEE MEMBER: Michael Hahn, PhDNorthrop Grumman Corporation
iii

ABSTRACT
Investigation of ASTM E 238 Bearing Pin Properties for Various Aerospace Alloys
Trevor J Lee
Aircraft are often designed with numbers determined by testing in a lab, rather than by repeatedly
building prototypes. These lab tests conform to testing specifications so that the numbers can be compared
between manufacturers, suppliers, and lab technicians. One such specification is ASTM specification E238 –
84(08), and it is used to determine important properties of a bearing pin joint like hinges, bolt holes, and rivet
joints. The properties determined from this fastener-through-plate method are bearing strength, bearing yield
strength, and bearing stiffness.
Adhering to the methods outlined in ASTM E238, a study was performed, looking at the effects that plate
material, fastener used, fastener lubrication, and plate hole preparation method (whether drilled and reamed or
just drilled) have on the three bearing joint properties. The plate materials used were Al 7050 – T7451, Ti – 6Al –
4V (mill annealed), and PH13 – 8Mo – H1000. The fasteners were Ti – 6Al – 4V screws, coated A286 screws,
and high speed steel (HSS) pins used as a control. Lubrication was tested using a corrosion inhibitor, PR –
1776M B – 2 from PRC – DeSoto, on the fastener or leaving the fastener uncoated. The HSS pins were always
tested in the uncoated condition. 54 runs were performed, as outlined by a D-optimal design of experiment.
It was discovered from the statistical analysis of the results via ANOVA that both the plate material used
and the pin material, whether a screw or a pin, had a significant effect on the bearing strength, bearing yield
strength, and bearing stiffness. The interaction between the two factors was also significant on all responses but
the bearing stiffness. PH13 – 8Mo – H1000 plates seemed to perform best on average, followed by Ti – 6Al –
4V plates, then Al 7050 – T7451 plates. PH13 – 8Mo – H1000 and Ti – 6Al – 4V plates had similar bearing
strength and bearing yield strength averages with the HSS control pins being used, which had the highest mean
values for a given plate and fastener. The Ti – 6Al – 4V and A286 screws behaved and performed statistically
similar in most cases, except when hole preparation method was take into account. The Ti – 6Al – 4V screws
iv

performed better when the hole was drilled and reamed, while the coated A286 screws performed better when
the hole was drilled only. All screws had lower resulting bearing properties than the HSS control pins.
It was also found that ASTM specification E238 – 84(08) is a precise test method, since the method
could be performed repeatably and reliably with no missing data points. Therefore, this ASTM testing method is
reasonable for determining bearing properties, which can then be used to design aircraft.
Key Words: ASTM E238 – 84(08); Bearing Strength; Bearing Stiffness; Aluminum 7050 – T7451; Ti – 6Al – 4V;
PH13 – 8Mo; A286; High Speed Steel
v

ACKNOWLEDGMENTS
For assistance with this project, I would like to thank Prof. Trevor Harding and the Materials Engineering
Department for providing me with contact to the Northrop Grumman Corporation (the project's sponsor), access
to testing equipment, and guidance throughout the masters thesis experience. With help from Dr Harding and
the department, my project could be completed at a level of quality above what I could attain by myself.
I would also like to thank Prof. Karen McGaughey and Prof. John Walker for their assistance with the
design of experiments from a statistics standpoint. Although none of the designs discussed were needed in the
final design of experiments, their ability to convey the importance of many concepts, like sample sizes for
maximum significance and D- and I-optimality, and to interpret results from statistical software proved to be
invaluable.
Next, I would like to thank Dr. Michael Hahn at Northrop Grumman Corporation (NGC) for his assistance
as well. He helped me to understand the scope and importance of the project,as well as give the project
direction. Without NGC's investment, this project could not be undertaken, so NGC deserves many thanks for its
investment of resources and Dr. Hahn for his investment of time.
Also, I would like to thank Jack Follman at RA Industries. By working with Dr. Hahn to accumulate
materials, as well as machining the fixturing necessary for testing and preparing the samples, his help greatly
aided the project.
Additionally, I would like to thank Penny at Specialty Tool & Bolt. She helped out immensely when steel
pins were needed on very short-term notice. She worked with me to find material that met strict requirements,
and did so in an efficient and simple way. Her assistance prevented long delays from occurring.
Although I didn't deal with them directly, I would also like to thank Mike Garibay and Michelle Garcia from
PPG Aerospace for supplying the corrosion inhibitor and Bob Gurrola at Alcoa Fasteners and Igor Komsitsky at
Lisi Aerospace for supplying the screws for this study.
vi

TABLE OF CONTENTS
List of Tables.......................................................................................................................viii
List of Figures.......................................................................................................................ix
Introduction...........................................................................................................................1
Experimental Procedures.....................................................................................................4
Sample Verification........................................................................................................4
Bearing Sample Coating and Cleaning..........................................................................7
Testing Conditions..........................................................................................................8
Data Evaluation..............................................................................................................9
Results................................................................................................................................12
Design of Experiment...................................................................................................12
Raw Data.....................................................................................................................15
Bearing Test Analysis Assumption Check....................................................................17
Analysis of Variance.....................................................................................................20
Discussion..........................................................................................................................25
Qualifying.....................................................................................................................25
Testing..........................................................................................................................25
Statistics.......................................................................................................................29
Significant Effects.........................................................................................................30
Conclusions........................................................................................................................32
Recommendations and Future Work..................................................................................33
References.........................................................................................................................34
Appendices.........................................................................................................................36
A1: Numerical Data......................................................................................................36
A2: Load-Extension Curves.........................................................................................37
B1: Additional Randomization Tables..........................................................................39
B2: Data Analysis: Analysis of Variance......................................................................42
B3: Data Analysis: Plots...............................................................................................43
vii

LIST OF TABLES
Table I: Average Dimensions of Each Plate Specimen,Standard Deviation Shown in Parentheses...................................................................4
Table II: Target Hardness and Actual Hardness Values forPlate Specimen Materials, St Dev in Parentheses........................................................5
Table III: Target Hardness and Actual Hardness Values forFastener Materials, St Dev in Parentheses...................................................................6
Table IV: Pin Straightness Measurements, St Dev inParentheses...................................................................................................................7
Table V: Number of Runs Per Factor Combination............................................................13
Table VI: Generated Run Order from Design ofExperiments.................................................................................................................14
Table VII: Final Run Order for Experimentation.................................................................15
Table VIII: Collection of P-values for ANOVA Assumptions................................................18
Table IX: ANOVA P-Values for All Three Responses,Significant Values Shown in Green..............................................................................21
Table X: Power Analysis for Lubrication/Hole PreparationMethod Two-way Interaction........................................................................................22
Table XI: Approximate Stress Concentration Factors byScrew Type...................................................................................................................28
Table XII: Bearing Strength, Bearing Yield Strength, andBearing Stiffness for Each Run....................................................................................36
Table XIII: Plate Geometry Qualifying Order......................................................................39
Table XIV: Pin Straightness Qualifying Order.....................................................................40
Table XV: Pin Coating and Testing Order...........................................................................41
Table XVI: Pin Coating Order.............................................................................................41
Table XVII: Analysis of Variance Tables.............................................................................42
viii

LIST OF FIGURES
Figure 1: Side view (left) and front view (right) of thefixturing and specimen used in ASTM E238. Shownare the plunger used to measure the displacement (a),the frame used to apply the load in tension (b), thebearing pin to which the load is applied (c), and theplate specimen (d). Strain rate is applied on theloading frame in the direction shown. (ASTM E238,2008)..............................................................................................................................2
Figure 2: Dimensions measured for each plate specimen.Shown are the width (a), thickness (b), hole diameter(c), and the edge distance (d)........................................................................................4
Figure 3: V-block and pin gauge setup used for qualifyingthe HSS pins. The Ti – 6Al – 4V and coated A286screws used the same pin gauge setup formeasurement, but used centers to suspend the screw.................................................6
Figure 4: Assembled testing setup. Shown is the upperclevis (a), loading frames (b), plate being tested (c),fastener being tested (d), and lower grip (f)...................................................................9
Figure 5: Example of how to determine bearing yieldstrength. Material used is AZ31A-H24 sheet at roomtemperature. (ASTM E238, 2008)...............................................................................10
Figure 6: Typical load-extension curve. Propertiesdetermined from this curve are the ultimate tensileload (a), upper and lower stiffness loads (b, arbitrarilychosen), and upper and lower stiffness extensions (c).Also shown are the linear proportionality lines and theyield offset. Since the curve doesn't intersect the offsetyield line, no yielding occurred.....................................................................................11
Figure 7: Experimental Design Analysis. Since allefficiency criteria are above 90%, the design is said tobe highly efficient. Also, most powers are above 80%,signifying an effective design with respect to statisticalpower............................................................................................................................14
Figure 8: Typical load-extension plot, showing nine runs.Specimen 1 through 9 correspond to runs 10 through18 in this case. Curves are offset by extension forsimplicity; all extensions began at 0”...........................................................................16
ix

Figure 9: Normal probability distribution plot for bearingstrength. Since all p-values (lower right panel) aregreater than 0.01, all data are assumed to be normallydistributed within their respective groups (upper rightpanel)...........................................................................................................................17
Figure 10: Levene's test for equal variances plot forbearing strength. A p-value greater than 0.01 suggestsequal variance among groups......................................................................................18
Figure 11: 4-in-1 plot for bearing strength. Since theresidual vs order plot (lower right) shows no overallfanning, the residuals are thought to be random, andso randomization was effective....................................................................................19
Figure 12: Main effects plot for hole preparation method'seffect on bearing strength. The relative values wereused to reduce the 7 methods down to the two thatwere intended by the project........................................................................................20
Figure 13: Boxplot for mean bearing strength, grouped bylubrication and screw type. Since the groups showsignificant overlap, the groups can be consideredstatistically similar.........................................................................................................23
Figure 14: Minitab © output for a two-sample t test.Shown is the estimated difference, t-value, andinsignificant p-value......................................................................................................24
Figure 15: Scanning electron micrograph of the fracturesurface of one of the Al 7050 – T7451 platespecimens. The dimples seen suggest microvoidcoalescence, a common ductile fracture mechanism..................................................26
Figure 16: Scanning electron micrographs of a typicalTi – 6Al – 4V plate (left) and PH13 – 8Mo – H1000plate (right). Both micrographs show the microvoidcoalescence mechanism, signifying ductile fracture....................................................27
Figure 17: Stress concentration factor curves for a shaftwith a shoulder fillet, loaded in bending. (Shigley'sMechanical Engineering Design, 2011).......................................................................28
Figure 18: Load-extension curve for runs 2-9....................................................................37
Figure 19: Load-extension curve for runs 19-27................................................................37
x

Figure 20: Load-extension curve for runs 28-36................................................................38
Figure 21: Load-extension curve for runs 37-45................................................................38
Figure 22: Load-extension curve for runs 46-54................................................................38
Figure 23: Plate main effects plot for bearing strength......................................................43
Figure 24: Plate main effects plot for bearing yield strength..............................................43
Figure 25: Plate main effects plot for bearing stiffness......................................................44
Figure 26: Pin main effects plot for bearing strength.........................................................44
Figure 27: Pin main effects plot for bearing yield strength.................................................45
Figure 28: Pin main effects plot for bearing stiffness.........................................................45
Figure 29: Plate x Pin interaction plot for bearing strength................................................46
Figure 30: Plate x Pin interaction plot for bearing yieldstrength........................................................................................................................46
Figure 31: Plate x Pin interaction plot for bearing stiffness................................................47
Figure 32: Pin x Hole Preparation Method interaction plotfor bearing strength......................................................................................................47
Figure 33: Pin x Hole Preparation Method interaction plotfor bearing strength......................................................................................................48
Figure 34: Pin x Hole Preparation Method interaction plotfor bearing strength......................................................................................................48
xi
INTRODUCTION
Given the complexity of modern aircraft, many material and component specifications are used in their
design. Specifications are standardized methods for determining the performance of materials or components.
Since specifications are standardized and widely adopted, they allow for direct comparison not only between
materials and components, but also between different testing groups or companies. This permits the results to
be used by all interested parties without using confusing or misleading jargon or results. In the case of structural
materials and components, the specifications usually describe one or a few of the many possible stress states
(tension, shear, or torsion, for example), and then call for these stress states to be applied to a specific material,
component, or combination of components.
One example of a group of components to simulate in design is a plate with an inserted, unrestricted
fastener, oriented normally to the plane of the plate. This combination can be seen in various places in an
aircraft, such as the bolt holes in landing gear or the pivot joints used to attach the flight control surfaces
(ailerons or elevators) to the wings. In both cases, the accurate simulation of performance is mandatory, given
their critical need in the operation of the aircraft and great expense of real-world testing of these components.
In order to determine the performance of such joints in a lab setting, ASTM specification E238 – 84(08)
is used, which is designed to evaluate the response of the plate, fastener, and hole to stress. In addition to bolt
holes for landing gear, this specification is also used for the simulation of riveted structures (Caputo, 2008). The
test establishes a value for the bearing stiffness, bearing yield strength, and bearing strength for the joint. The
bearing stiffness is the linear proportionality between bearing stress and bearing strain (where a linear
relationship exists), and the bearing strength is the amount of bearing stress that the test specimen can support
before fracture. Bearing yield strength is the amount of stress endured where the bearing displacement deviates
from linear behavior by a significant amount (2% of the plate hole diameter). These properties are then
compared to simulated loads on the components of the aircraft. It can then be decided if the performance of the
simulated joint is sufficient for use on the aircraft, by comparing the stresses of the aircraft to the properties of
the simulated joint.
ASTM specification E238 – 84(08) is performed by loading a fastener-and-plate assembly into
specialized fixturing. The fastener is then loaded in shear in close proximity to where it enters the plate, on one
side. The layout and applied load are shown in Figure 1. From the data collected, the properties listed above can
1

be determined, and then utilized to evaluate performance of an actual joint defined by the parameters used for
testing.
For any specification to be accepted and used, it must be possible for the user to determine if the test
results are valid or erroneous, as well as be able to yield reproducible testing results. Since the equipment in this
study wasn't calibrated, determining validity was not possible. However, precision could be verified simply by
observing the scatter of the data. This precision is important, since imprecise results will appear to be random,
and will thus require more testing, and thus resources, until the results can become more precise. Many different
factors can affect the precision of this specification. Some examples include variation in the materials used, like
the specifics of the various heat treatments (temperatures, times, and cooling methods), plate thickness
preparation method (forging it to the proper thickness versus machining it), and variations in the geometry, like
the fastener-hole clearance. Even the method of cleaning can have an effect on the results; it has been found
that oils from human contact tend to lower the apparent strengths and stiffness results from the test (Stickley,
2
Figure 1: Side view (left) and front view (right) of the fixturing and specimen used in ASTM E238. Shown are the plunger used to measure the displacement (a), the frame used to apply the load in tension (b), the bearing pin to which the load is applied (c), and the plate specimen (d). Strain rate is applied on the loading frame in the direction shown. (ASTM E238, 2008)
d
c
a
b

1962). In another standard governing the determination of bearing properties, those oils were found to lower the
bearing strength by 10 percent when tested without sufficient cleaning (MMPDS, 2012).
In the interest of determining if ASTM specification E238 is sufficient to precisely evaluate the
performance of a fastener-and-plate joint, many factors have to be controlled in order to determine if the testing
factors have any significant effect on the results. For example, the dimensions of the specimens and the method
of cleaning are typically kept constant in order improve testing precision. Since the properties of the various
materials could be altered by the manipulation of the materials, the heat treatments were also verified for each
material to ensure that all samples of the same materials were subjected to the same heat treatment. Once
these factors were identified and controlled, factors of greater interest could be studied. The factors identified for
this purpose were the plate and fastener materials to be used, if a fastener corrosion inhibitor was used or not,
and the method for preparing the hole in the plate, since the method, whether simply drilled or drilled and
reamed (as is standard practice), can affect the amount of cold work around the hole, and thus alter the results
(ASTM E238, 2008). The materials to be studied were common aerospace alloys subjected to heat treatments
typical of plate components: aluminum 7050 – T7451, Ti – 6Al – 4V in the mill annealed condition, and PH13 –
8Mo in the H1000 condition. For the fasteners, the materials to be utilized were Ti – 6Al – 4V screws, coated
A286 stainless steel screws, and a high-speed steel (HSS) pin used as a control.
Once these parameters were chosen, the following research questions could be answered:
Can the effects of the plate material (Al 7050 – T7451, Ti – 6Al – 4V (mill
annealed), and PH13 – 8Mo – H1000), the fastener used (Ti – 6Al – 4V screws,
coated A286 screws, or HSS pins), lubrication, and cold work (due to hole
preparation method) on bearing mechanical properties be measured
precisely by following ASTM E 238 – 84 (08)? Are there any observable trends
in the data?
3

EXPERIMENTAL PROCEDURES
Sample Verification
To verify that the samples were fit for testing and thus would yield repeatable results, each plate
specimen was measured 5 times in the dimensions shown in Figure 2.
The results from these measurements are shown in Table I.
Table I: Average Dimensions of Each Plate Specimen, Standard Deviation Shown in Parentheses
Material Width Thickness Hole Diameter Edge Distance
Al 7050 – T7451 1.4974 (.0066) .1240 (.0005) .2497 (.0004) .5026 (.0067)
Ti – 6Al – 4V (mill annealed)
1.5001 (.0014) .1175 (.0034) .2499 (.0009) .5010 (.0024)
PH13 – 8Mo – H1000
1.4980 (.0043) .0891 (.0012) .2501 (.0006) .5019 (.0016)
As shown, the standard deviations are low relative to the average values, so the qualifying measurement data is
seen as reliable, leading to repeatable results from the bearing tests that follow. The largest deviations are in the
4
Figure 2: Dimensions measured for each plate specimen. Shown are the width (a), thickness (b), hole diameter (c), and the edge distance (d).
a
b
c
d

edge distance ratios; this is most likely due to the measurement error resulting from measuring the distance from
the curved surface of the hole to the flat surface at the edge of the plate. The deviations in the specimen widths
are also larger than those of the diameter or the thickness, but since the width is a significantly larger dimension,
this is to be expected.
Once the dimensions were verified for each sample, the heat treatments for each material was verified.
This was done by randomly selecting 3 of the samples of each material. These samples were used to verify the
heat treatment via Rockwell hardness. The proper scale and target value for each material type tested for the
plate specimens, as well as the actual values for each sample, is shown in Table II.
Table II: Target Hardness and Actual Hardness Values for Plate Specimen Materials, St Dev in Parentheses
Material Target Hardness Actual Hardness
Al 7050 – T7451 82 HRB (min) 109.122 (1.067)
Ti – 6Al – 4V (mill annealed)
35 HRC (min) 32.880 (.192)
PH13 – 8Mo – H1000
43 HRC (min) 35.200 (.200)
As shown, the Al 7050 – T7451 specimens exceeded the specified values, while the Ti – 6Al – 4V and PH13 –
8Mo – H1000 plate specimens fell short of the specified value. This could lead to an observed bearing strength
and bearing yield strength for the Ti – 6Al – 4V and PH13 – 8Mo – H1000 plate specimens lower than other Ti –
6Al – 4V (mill annealed) or PH13 – 8Mo – H1000 plate specimens. However, since no values exist in literature to
compare to compare to these strengths, this is not seen to be of significant concern. Also, the scatter in the Al
7050 – T7451 is significantly larger because the values are at the upper extreme of the Rockwell B scale;
accuracy decreases at the extremes of the scale (HRB 110 is considered the maximum value).
The fastener specimens were then verified by macrohardness. The target values for each, as well as the
actual results, are shown in Table III. The macrohardness was measured by a Rockwell C hardness tester, on 3
of each fastener material, again selected randomly. All three measurements were made on the end or head of
the fastener. Since the heads of the screws were large compared to the diameter of the screw, significant scatter
was introduced into the hardness data for these fasteners from the deflection of the head, as shown in Table III.
5

Table III: Target Hardness and Actual Hardness Values for Fastener Materials, St Dev in Parentheses
Material Target Hardness Actual Hardness
Ti – 6Al – 4V
60-64 HRC
32.660 (6.119)
A286 32.780 (7.022)
HSS 64.580 (.466)
As shown in Table III, The HSS pin exceed the ASTM E238 – 84(08) specified range. Alternatively, the
two screw fasteners were insufficiently hard. However, this was deemed as acceptable; since the purpose of
ASTM E 238 – 84 (08) testing is to simulate real-world scenarios, utilizing fasteners that don't meet the
requirements of the specification can still yield meaningful results. The requirement outlined by the specification
is meant to remove the fastener as a variable; if it is intentionally being observed, then a fastener with lower
hardness can provide valuable information about the fastener being tested.
The final qualification for the specimens was to measure each fastener to ensure it wasn't bent; each
fastener was placed between two centers (for screws) or on V-blocks (for pins), and a pin gauge was used in a
moveable fixture on top of a microflat to ensure consistency. The gauge was then placed up against the fastener,
and the displacement relative to the left-hand edge was measured. An example of the setup used for the HSS
pins is shown in Figure 3.
Figure 3: V-block and pin gauge setup used for qualifying the HSS pins. The Ti – 6Al – 4V and coated A286 screws used the same pin gauge setup for measurement, but used centers to suspend the screw.
The screws were measured in two places at 120° intervals, for a total of 6 measurements. Alternatively,
6

the HSS pins were measured three times, for a total of 9 measurements (since the HSS pins were used as a
control, straightness was more critical). The measured deviations from all fastener specimens were
consolidated, and are shown in Table IV.
Table IV: Pin Straightness Measurements, St Dev in Parentheses
Material Measurement 1 (mil) Measurement 2 (mil) Measurement 3 (mil)
HSS
0.000 (.000)
-0.025 (.324) -0.250 (.446)
A286 -0.092(.446)
Ti – 6Al – 4V 0.017 (.664)
Since the greatest amount of variation, that between measurements 1 and 3 for the HSS pins, was around 0.25
mil (0.00025”), the pins deviated only slightly from straight.
Once all qualifying data was collected, the data were compared against the relevant specification, ASTM
E238 – 84(08) for the dimensions and macrohardness of the fasteners, SAE standard AMS 2658B for the
hardness of the Al 7050 – T7451 plates, the Aerospace Structural Metals Handbook (Code 3707) for the
hardness of the Ti – 6Al – 4V plates, and SAE standard AMS 5629E for the hardness of the PH13 – 8Mo –
H1000 plates. The values for the hardness of the Ti – 6Al – 4V are not generally used as an acceptance
criterion (Aerospace Structural Metals Handbook Code 3707, 2006). Therefore, the deviations from the specified
values are not necessarily indicative of a failed heat treatment.
From this, it was found that the Ti – 6Al – 4V plates, Ti – 6Al – 4V screws, and coated A286 screws
failed to comply with the specifications, while all other samples met or exceeded those specifications.
Bearing Sample Coating and Cleaning
All fastener specimens to be coated were randomized and coated in a fume hood. The coating, the
corrosion inhibitor PR – 1776M B – 2 from PRC – DeSoto, was applied by rolling the fastener in a nitrile glove
that had the corrosion inhibitor on it, therefore applying the coating only to the surface without coating the head
of the fastener. The pins were then allowed to dry undisturbed for at least 24 hours prior to testing.
Nitrile gloves were worn for the duration of the testing. Just prior to testing, the plate specimen being
used was cleaned with a paper towel and acetone. The run order was randomized, and the fastener being tested
was inserted into the plate.
7

Testing Conditions
After each specimen was prepared, the test was carried out according to ASTM E238 – 84(08). The test
was performed using a crosshead rate of 0.25 in/min, making a strain rate of 0.05/min (based on 5 inch-long
samples). Unlike in the specification, the lower clevis was not used, since the clevis pin hole for the samples did
not permit the bottom of the sample from clearing the inside of the lower clevis. Instead, a typical grip was used,
tightened around the base of the plate specimen being tested. The highest point gripped on the specimen was a
distance of 1.5” from the bottom edge of the plate; this is the nominal furthest point that the clevis pin hole is
from the bottom of the plate specimen. The plate was fully aligned to the left inside the grip to ensure
repeatability. Also, since there was no extensometer readily available that was compatible with the plunger and
plunger guide, they were not used, and instead the crosshead displacement was used to approximate the
extension of the sample.
Taking these variations into account, the specimen and fixturing were assembled, as shown in Figure 4.
8

Figure 4: Assembled testing setup. Shown is the upper clevis (a), loading frames (b), plate being tested (c), fastener being tested (d), and lower grip (f).
Data Evaluation
The properties were then determined, as per the specification. Bearing strength and bearing stiffness
were determined using a method analogous to tensile strength and modulus in uniaxial tension tests. The
bearing strength measured was the maximum stress supported during the test. The bearing stiffness was the
linear proportionality coefficient (slope) in the elastic region of the stress-strain curve; this is developed by
transforming the load-extension curve. The stress is determined by dividing the load at each point by the bearing
area, defined as the product of the plate hole diameter and the specimen thickness. The strain is calculated by
dividing the displacement by the plate fastener hole diameter (ASTM E238, 2008).
In the case of the bearing yield strength, a specific method, as shown in Figure 5, was utilized. This
method defines the bearing yield strength as the stress corresponding to the first point upon loading the sample
where the difference in extension between the linear proportionality estimate and the actual sample extension 9
a
b
c
d
e

exceeds 2% of the diameter of the hole in the plate, unlike the typical 0.2% extension used in uniaxial tension
testing.
In order to determine the bearing strength, bearing stiffness, and bearing yield strength, the load-
extension curve was used for each sample. The greatest load achieved by the test was the ultimate tensile load,
which was divided by the bearing area to determine the bearing strength of the sample. Next, two different loads
were chosen that corresponded to two extensions withing the elastic region of the curve. These loads and
extensions were then used to determine the bearing stiffness by the equation
E = σ2−σ1
ϵ2−ϵ1
=
P2 − P1
AL2 − L1
D
where P is the load selected, A is the bearing area, L is the corresponding extension, and D is the plate fastener
hole diameter.
To determine the bearing yield strength, the linear proportionality line was offset to the right (towards
10
Figure 5: Example of how to determine bearing yield strength. Material used is AZ31A-H24 sheet at room temperature. (ASTM E238, 2008)
longer extensions) a distance of 2% of the plate fastener hole diameter, or 0.005”. If the load-extension curve
intersected the yield offset line prior to failure, then the yield load was equal to the load that corresponds to the
intersection. If not, then the material did not yield, and the yield load is equal to the ultimate tensile load. The
yield load was then divided by the bearing area, as with the ultimate tensile load, to determine the yield strength
of the specimen.
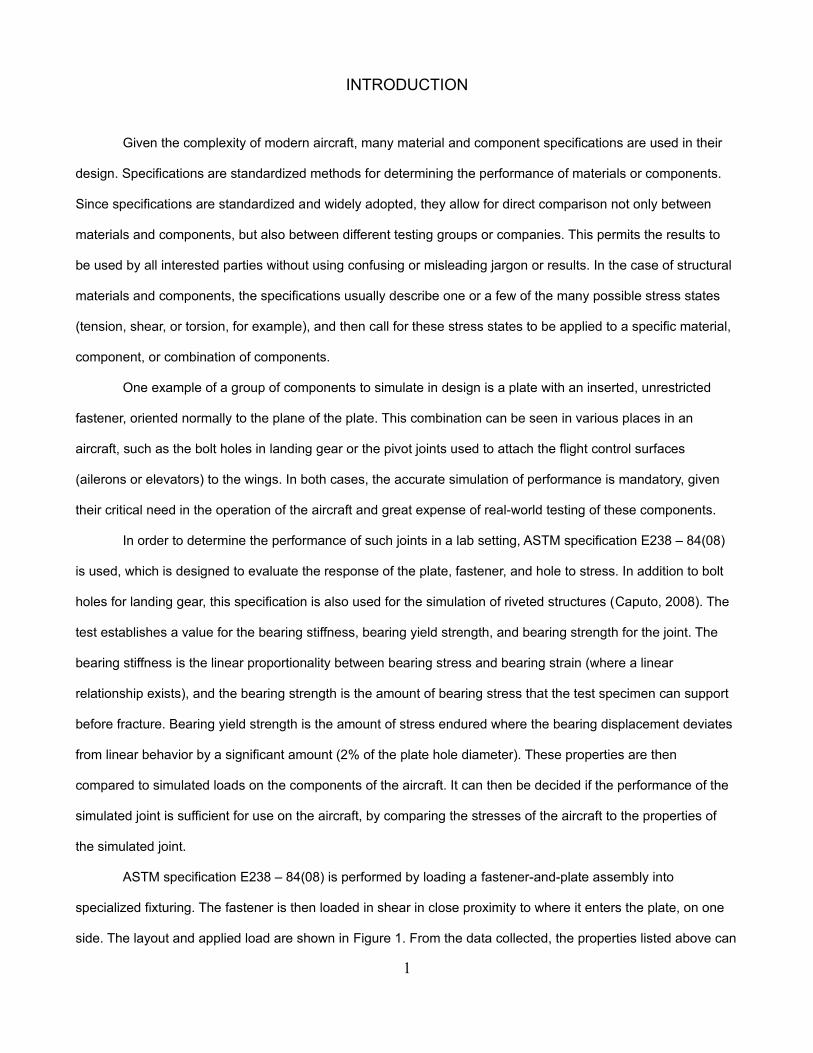
An example of the graphical determination of the loads and displacements that were used to determine
stresses and strains, respectively, is shown in Figure 6.
Figure 6: Typical load-extension curve. Properties determined from this curve are the ultimate tensile load (a), upper and lower stiffness loads (b, arbitrarily chosen), and upper and lower stiffness extensions (c). Also shown are the linear proportionality lines and the yield offset. Since the curve doesn't intersect the offset yield line, no yielding occurred.
This process was used for all samples, then the bearing strength, bearing yield strength, and bearing
stiffness were used for analysis of the factors.
11
a
b
c

RESULTS
Design of Experiment
For this experiment, a total of three levels of plate material (Al 7050 – T7451, Ti – 6Al – 4V (mill
annealed), and PH13 – 8Mo – H1000), three levels of pin material (Ti – 6Al – 4V, coated A286, and HSS pins),
two levels of fastener hole preparation method (drilled only and drilled & reamed), and two levels of fastener
lubrication (lubricated and not lubricated) were used. This results in a total of 36 possible combinations (a full
factorial design would have 36 runs in it). However, 18 aluminum plates, 20 Ti – 6Al – 4V plates, and 19 PH13 –
8Mo – H1000 plates were supplied for the project.
An Analysis of Variance (ANOVA) approach would be used to determine the likelihood of an effect or
interaction being statistically significant with 95% confidence (significance level, α = 0.05). This confidence level
provides a good balance between a higher chance of type I error (failing to detect a true effect) at lower
significance levels, and a higher chance of type II error (detecting a false effect) at higher significance levels.
The upper bound for type II error is equal to the significance level times the number of factors, which is 4 main
effects + all 6 two-way interactions = 10, for a upper bound of 50%, which is somewhat high. As a preliminary
screening study, it is thought to be better practice to determine a greater-than actual number of significant factors
to be eliminated later, rather than a less-than-actual number of significant factors, since discovery of newly
significant factors later in a study is more difficult. Therefore, the 50% upper bound was deemed acceptable and
preferable to increasing the confidence level.
Utilizing the extra plates is statistically advantageous; more runs performed translates to more error
degrees of freedom in the analysis, increasing the power (the probability of avoiding a type II error) of the design
without modifying the significance level (the probability of a type I error), which in turn increases the likelihood of
statistical significance for all factors investigated. To include the additional specimens, an experimental design
was developed using D-optimality, which is a software-driven algorithm that prioritizes the stabilization of the
effect coefficients. In other words, it attempts to space runs as far apart as possible in the design space (varies
the runs as much as possible) to improve the significance of the effects.
From this method, it was determined that 54 runs should be performed (analogous to a full factorial plus
a one-half fractional factorial) to create a balanced design space; in other words, 54 was the maximum number
12

of runs based on materials provided that could be used without having an unbalanced design. A balanced design
allows direct comparison between averages to be legitimate and meaningful, since the sample size (and thus,
theoretically, the variance) for all levels of any of the four factors would be equal. Balance with respect to the
hole preparation method was of additional important, since the plates were pre-drilled; half were drilled only, and
the other half were drilled and reamed. The number of plates in either condition could not be changed, so 9 of
each plate type had to be used. This balance is confirmed by tabulating the number of plates in each condition,
as shown in Table V by an equal number of runs in each column. Since the design is not evenly replicated (not a
multiple of a full factorial), the contents of each cell are not equal.
Table V: Number of Runs Per Factor Combination
Plate Material
Al 7050 – T7451Ti – 6Al – 4V (mill
annealed)
PH13 – 8Mo –
H1000
Hole Preparation Hole Preparation Hole Preparation
Fastener Material
Lubrication Drill OnlyDrill and Ream
Drill OnlyDrill and Ream
Drill OnlyDrill and Ream
Ti – 6Al –
4V
Yes 2 1 2 1 1 2
No 1 2 1 2 2 1
A286Yes 2 1 1 2 1 2
No 1 2 2 1 2 1
HSSYes 1 2 2 1 2 1
No 2 1 1 2 1 2
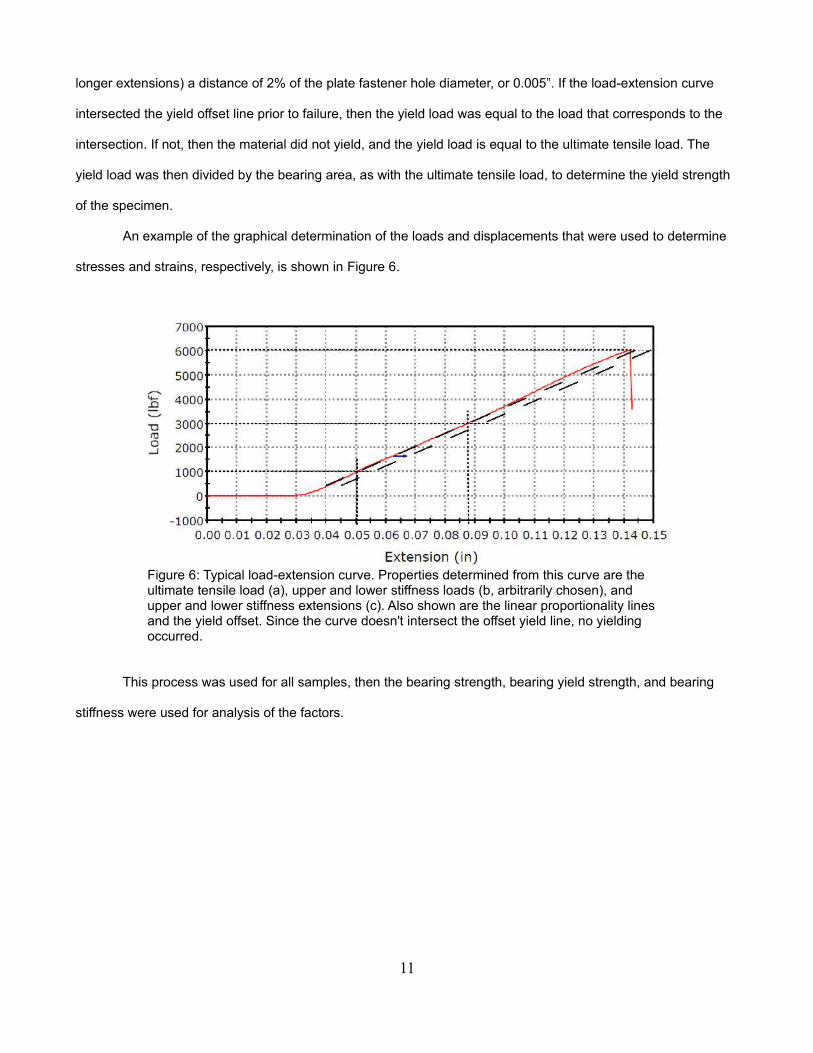
Since the design had the proper number of plates in either condition (level of fastener hole preparation
method), the design was analyzed for efficiency. This was done by looking at the D-optimal efficiencies and a
power analysis of the design, as shown in Figure 7. Of importance are the design efficiencies (D, G, and A; the
closer to 100%, the more efficient and thus better), the significance level being used, the signal-to-noise ratio
(anticipated ratio of effect variance to variance among runs with identical treatments), and the resulting lower
bounds on the power for each effect.
13
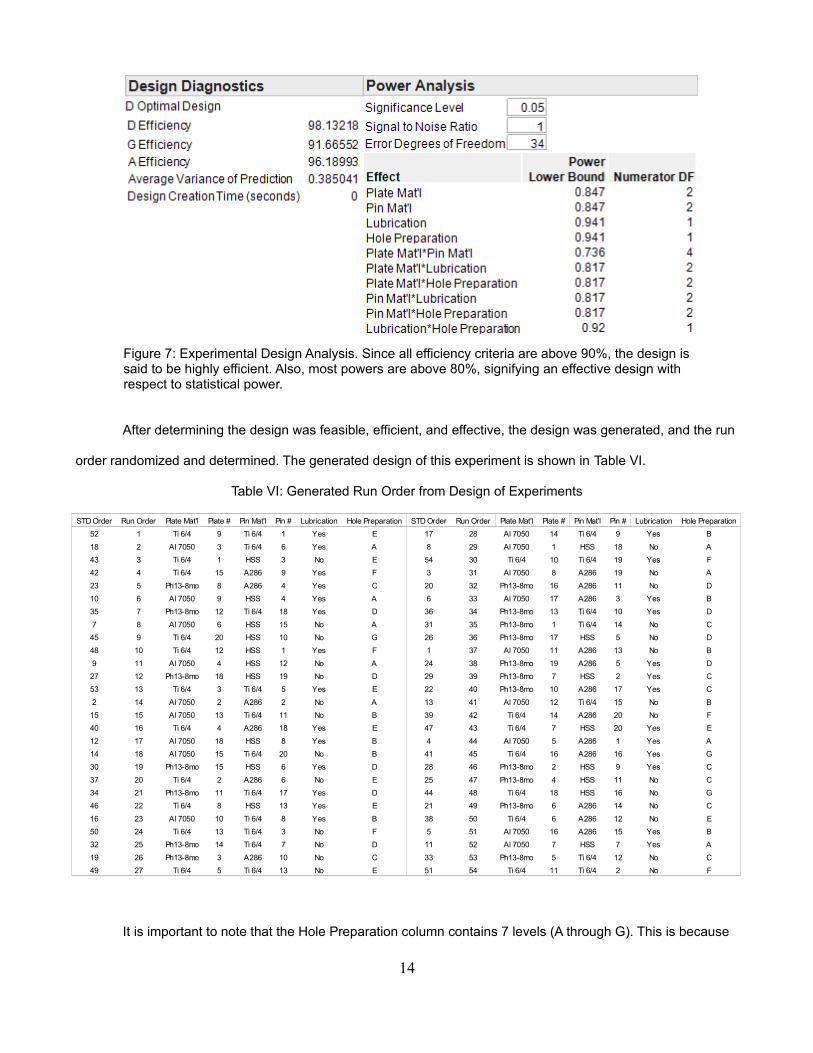
Figure 7: Experimental Design Analysis. Since all efficiency criteria are above 90%, the design is said to be highly efficient. Also, most powers are above 80%, signifying an effective design with respect to statistical power.
After determining the design was feasible, efficient, and effective, the design was generated, and the run
order randomized and determined. The generated design of this experiment is shown in Table VI.
Table VI: Generated Run Order from Design of Experiments
It is important to note that the Hole Preparation column contains 7 levels (A through G). This is because
14
STD Order Run Order Plate Mat'l Plate # Pin Mat'l Pin # Lubrication Hole Preparation STD Order Run Order Plate Mat'l Plate # Pin Mat'l Pin # Lubrication Hole Preparation
52 1 Ti 6/4 9 Ti 6/4 1 Yes E 17 28 Al 7050 14 Ti 6/4 9 Yes B
18 2 Al 7050 3 Ti 6/4 6 Yes A 8 29 Al 7050 1 HSS 18 No A
43 3 Ti 6/4 1 HSS 3 No E 54 30 Ti 6/4 10 Ti 6/4 19 Yes F
42 4 Ti 6/4 15 A286 9 Yes F 3 31 Al 7050 8 A286 19 No A
23 5 Ph13-8mo 8 A286 4 Yes C 20 32 Ph13-8mo 16 A286 11 No D
10 6 Al 7050 9 HSS 4 Yes A 6 33 Al 7050 17 A286 3 Yes B
35 7 Ph13-8mo 12 Ti 6/4 18 Yes D 36 34 Ph13-8mo 13 Ti 6/4 10 Yes D
7 8 Al 7050 6 HSS 15 No A 31 35 Ph13-8mo 1 Ti 6/4 14 No C
45 9 Ti 6/4 20 HSS 10 No G 26 36 Ph13-8mo 17 HSS 5 No D
48 10 Ti 6/4 12 HSS 1 Yes F 1 37 Al 7050 11 A286 13 No B
9 11 Al 7050 4 HSS 12 No A 24 38 Ph13-8mo 19 A286 5 Yes D
27 12 Ph13-8mo 18 HSS 19 No D 29 39 Ph13-8mo 7 HSS 2 Yes C
53 13 Ti 6/4 3 Ti 6/4 5 Yes E 22 40 Ph13-8mo 10 A286 17 Yes C
2 14 Al 7050 2 A286 2 No A 13 41 Al 7050 12 Ti 6/4 15 No B
15 15 Al 7050 13 Ti 6/4 11 No B 39 42 Ti 6/4 14 A286 20 No F
40 16 Ti 6/4 4 A286 18 Yes E 47 43 Ti 6/4 7 HSS 20 Yes E
12 17 Al 7050 18 HSS 8 Yes B 4 44 Al 7050 5 A286 1 Yes A
14 18 Al 7050 15 Ti 6/4 20 No B 41 45 Ti 6/4 16 A286 16 Yes G
30 19 Ph13-8mo 15 HSS 6 Yes D 28 46 Ph13-8mo 2 HSS 9 Yes C
37 20 Ti 6/4 2 A286 6 No E 25 47 Ph13-8mo 4 HSS 11 No C
34 21 Ph13-8mo 11 Ti 6/4 17 Yes D 44 48 Ti 6/4 18 HSS 16 No G
46 22 Ti 6/4 8 HSS 13 Yes E 21 49 Ph13-8mo 6 A286 14 No C
16 23 Al 7050 10 Ti 6/4 8 Yes B 38 50 Ti 6/4 6 A286 12 No E
50 24 Ti 6/4 13 Ti 6/4 3 No F 5 51 Al 7050 16 A286 15 Yes B
32 25 Ph13-8mo 14 Ti 6/4 7 No D 11 52 Al 7050 7 HSS 7 Yes A
19 26 Ph13-8mo 3 A286 10 No C 33 53 Ph13-8mo 5 Ti 6/4 12 No C
49 27 Ti 6/4 5 Ti 6/4 13 No E 51 54 Ti 6/4 11 Ti 6/4 2 No F

the samples were not labeled upon shipment. Therefore, no two groups could be said to be the same level of
hole preparation. Instead, the plates of each material were randomized into the run order in order to reduce the
chance of any inexplicable factors affecting the results. The hole preparation method was therefore ignored in
the run order and would instead be determined later, based on the relative responses of the two levels from the
analysis.
Also, the corrosion inhibitor was applied at a thickness of approximately 2 mil or greater, as per MIL-
PRF-16173 E. Unfortunately, this meant the HSS pins could not fit into the hole in the plate, since the minimum
clearance for the fastener in the plate specimen hole is .001” (ASTM E238, 2008) . Therefore, all HSS pins were
cleaned prior to use. This deviates from the experimental design as well, which is not ideal. However, there was
no viable way to permit the coating to clear the edges of the hole, so this modification had to be made.
In light of these two alterations, the finalized testing matrix is shown below in Table VII.
Table VII: Final Run Order for Experimentation
Raw Data
From the experimental design shown in Table VII and utilizing the sample preparation outlined by this
study, The plate specimen and fastener (either coated or uncoated) to be tested were loaded into the fixturing
and then tested. The data was arranged into load-extension curves, like the one shown in Figure 6. In order to
simplify the determination of bearing strength, bearing yield strength, and bearing stiffness from these curves,
the curves were grouped together into six groups of 9 curves. A typical example of one of these nine-in-one plots
15
STD Order Run Order Plate Mat'l Plate # Pin Mat'l Pin # Lubrication STD Order Run Order Plate Mat'l Plate # Pin Mat'l Pin # Lubrication
52 1 Ti 6/4 1 Ti 6/4 1 Yes 17 28 Al 7050 14 Ti 6/4 9 Yes
18 2 Al 7050 3 Ti 6/4 6 Yes 8 29 Al 7050 1 HSS 18 No
43 3 Ti 6/4 9 HSS 3 No 54 30 Ti 6/4 10 Ti 6/4 19 Yes
42 4 Ti 6/4 15 A286 9 Yes 3 31 Al 7050 8 A286 19 No
23 5 Ph13-8mo 8 A286 4 Yes 20 32 Ph13-8mo 16 A286 11 No
10 6 Al 7050 9 HSS 4 No 6 33 Al 7050 17 A286 3 Yes
35 7 Ph13-8mo 12 Ti 6/4 18 Yes 36 34 Ph13-8mo 13 Ti 6/4 10 Yes
7 8 Al 7050 6 HSS 15 No 31 35 Ph13-8mo 1 Ti 6/4 14 No
45 9 Ti 6/4 20 HSS 10 No 26 36 Ph13-8mo 17 HSS 5 No
48 10 Ti 6/4 12 HSS 1 No 1 37 Al 7050 11 A286 13 No
9 11 Al 7050 4 HSS 12 No 24 38 Ph13-8mo 19 A286 5 Yes
27 12 Ph13-8mo 18 HSS 19 No 29 39 Ph13-8mo 7 HSS 2 No
53 13 Ti 6/4 3 Ti 6/4 5 Yes 22 40 Ph13-8mo 10 A286 17 Yes
2 14 Al 7050 2 A286 2 No 13 41 Al 7050 12 Ti 6/4 17 No
15 15 Al 7050 13 Ti 6/4 11 No 39 42 Ti 6/4 14 A286 20 No
40 16 Ti 6/4 4 A286 18 Yes 47 43 Ti 6/4 7 HSS 20 No
12 17 Al 7050 18 HSS 8 No 4 44 Al 7050 5 A286 1 Yes
14 18 Al 7050 15 Ti 6/4 20 No 41 45 Ti 6/4 16 A286 16 Yes
30 19 Ph13-8mo 15 HSS 6 Yes 28 46 Ph13-8mo 2 HSS 9 No
37 20 Ti 6/4 2 A286 6 No 25 47 Ph13-8mo 4 HSS 11 No
34 21 Ph13-8mo 11 Ti 6/4 15 Yes 44 48 Ti 6/4 18 HSS 16 No
46 22 Ti 6/4 8 HSS 13 No 21 49 Ph13-8mo 6 A286 14 No
16 23 Al 7050 10 Ti 6/4 8 Yes 38 50 Ti 6/4 6 A286 12 No
50 24 Ti 6/4 13 Ti 6/4 3 No 5 51 Al 7050 16 A286 15 Yes
32 25 Ph13-8mo 14 Ti 6/4 7 No 11 52 Al 7050 7 HSS 7 No
19 26 Ph13-8mo 3 A286 10 No 33 53 Ph13-8mo 5 Ti 6/4 12 No
49 27 Ti 6/4 5 Ti 6/4 13 No 51 54 Ti 6/4 11 Ti 6/4 2 No
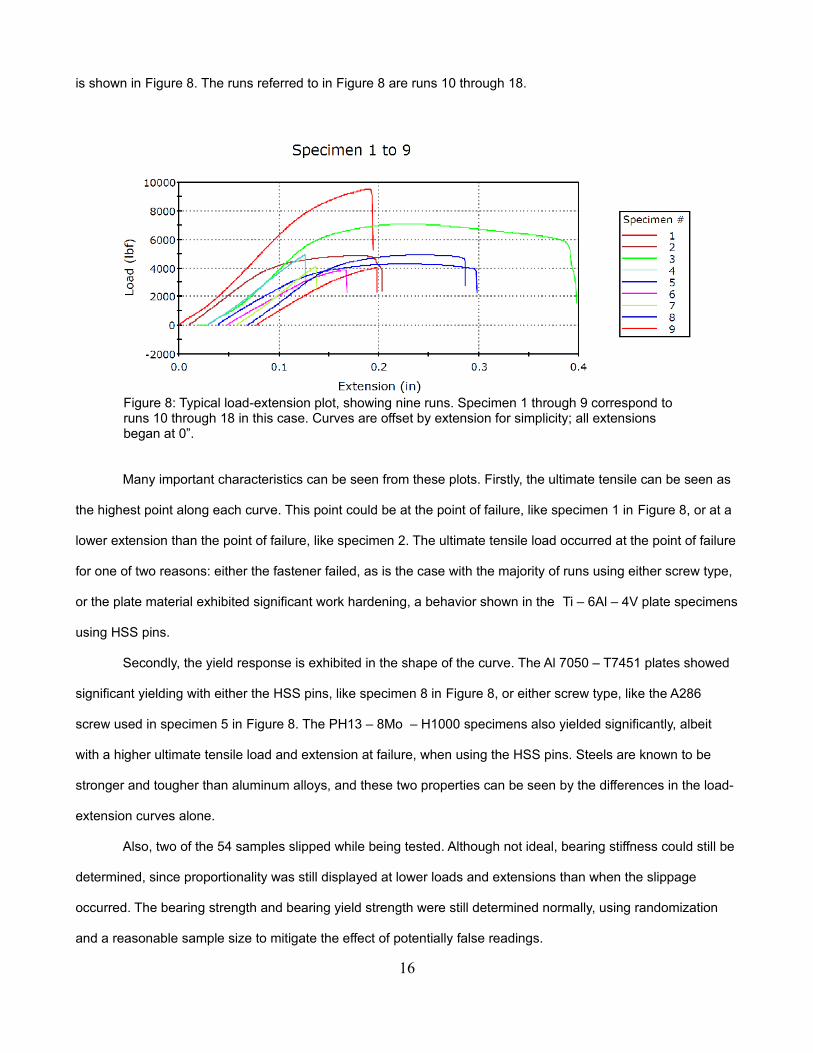
is shown in Figure 8. The runs referred to in Figure 8 are runs 10 through 18.
Figure 8: Typical load-extension plot, showing nine runs. Specimen 1 through 9 correspond to runs 10 through 18 in this case. Curves are offset by extension for simplicity; all extensions began at 0”.
Many important characteristics can be seen from these plots. Firstly, the ultimate tensile can be seen as
the highest point along each curve. This point could be at the point of failure, like specimen 1 in Figure 8, or at a
lower extension than the point of failure, like specimen 2. The ultimate tensile load occurred at the point of failure
for one of two reasons: either the fastener failed, as is the case with the majority of runs using either screw type,
or the plate material exhibited significant work hardening, a behavior shown in the Ti – 6Al – 4V plate specimens
using HSS pins.
Secondly, the yield response is exhibited in the shape of the curve. The Al 7050 – T7451 plates showed
significant yielding with either the HSS pins, like specimen 8 in Figure 8, or either screw type, like the A286
screw used in specimen 5 in Figure 8. The PH13 – 8Mo – H1000 specimens also yielded significantly, albeit
with a higher ultimate tensile load and extension at failure, when using the HSS pins. Steels are known to be
stronger and tougher than aluminum alloys, and these two properties can be seen by the differences in the load-
extension curves alone.
Also, two of the 54 samples slipped while being tested. Although not ideal, bearing stiffness could still be
determined, since proportionality was still displayed at lower loads and extensions than when the slippage
occurred. The bearing strength and bearing yield strength were still determined normally, using randomization
and a reasonable sample size to mitigate the effect of potentially false readings.
16

Once the ultimate tensile load, yield load, upper and lower stiffness loads, and upper and lower stiffness
extensions were determined for each run (via the method outlined in Figure 6), the bearing strength, bearing
yield strength, and bearing stiffness for each run could be determined and used for analysis.
Bearing Test Analysis Assumption Check
Once all the testing was completed and the bearing properties were determined, the experiment could
be analyzed using the ANOVA approach, assuming the underlying assumptions of ANOVA were met. In order to
check these assumptions, normality, equal variance, and randomization all needed to be checked for each of the
three responses: bearing strength, bearing yield strength, and bearing stiffness.
In order to check normality, a normal probability distribution plot was used. Since the plate and pin
materials are hypothesized to have a much more profound effect on the responses than the hole preparation
method or lubrication, the data was grouped by plate and fastener material, then analyzed for normality. Such a
plot is shown in Figure 9. A p-value greater than 0.01 represents a distribution of data that cannot be assumed to
deviate from normality.
17
Figure 9: Normal probability distribution plot for bearing strength. Since all p-values (lower right panel) are greater than 0.01, all data are assumed to be normally distributed within their respective groups (upper right panel).
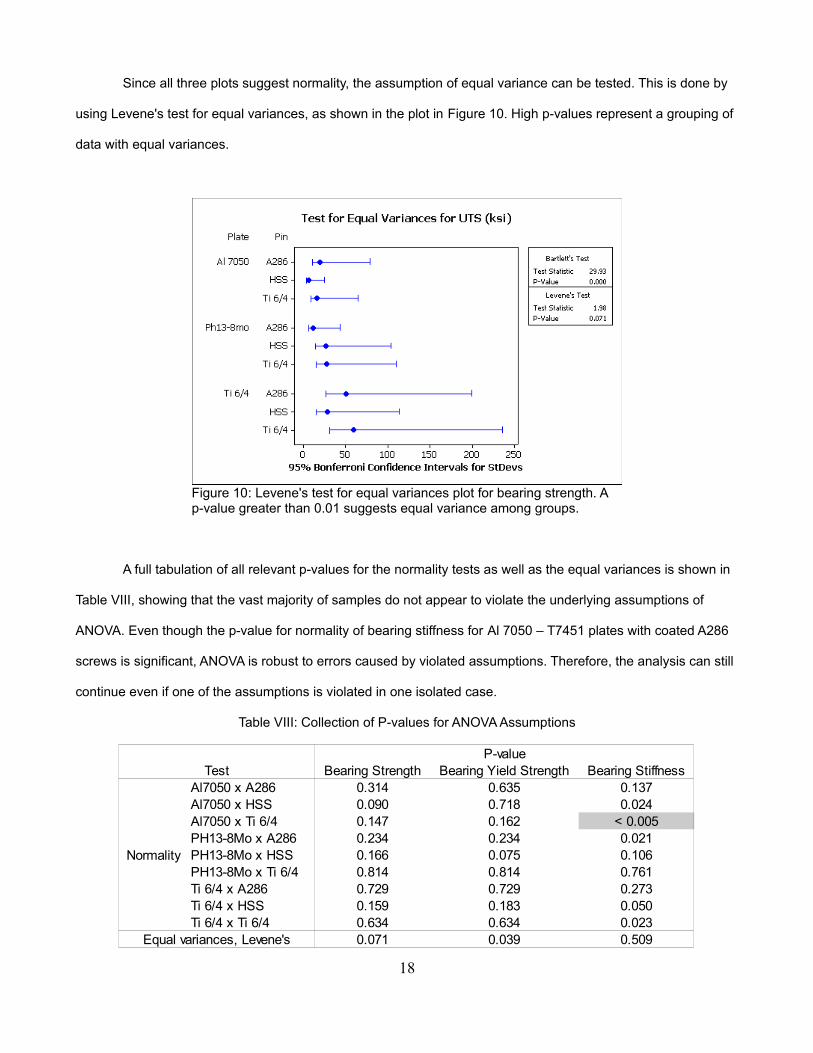
Since all three plots suggest normality, the assumption of equal variance can be tested. This is done by
using Levene's test for equal variances, as shown in the plot in Figure 10. High p-values represent a grouping of
data with equal variances.
A full tabulation of all relevant p-values for the normality tests as well as the equal variances is shown in
Table VIII, showing that the vast majority of samples do not appear to violate the underlying assumptions of
ANOVA. Even though the p-value for normality of bearing stiffness for Al 7050 – T7451 plates with coated A286
screws is significant, ANOVA is robust to errors caused by violated assumptions. Therefore, the analysis can still
continue even if one of the assumptions is violated in one isolated case.
Table VIII: Collection of P-values for ANOVA Assumptions
18
P-valueTest Bearing Strength Bearing Yield Strength Bearing Stiffness
Normality
Al7050 x A286 0.314 0.635 0.137Al7050 x HSS 0.090 0.718 0.024Al7050 x Ti 6/4 0.147 0.162 < 0.005PH13-8Mo x A286 0.234 0.234 0.021PH13-8Mo x HSS 0.166 0.075 0.106PH13-8Mo x Ti 6/4 0.814 0.814 0.761Ti 6/4 x A286 0.729 0.729 0.273Ti 6/4 x HSS 0.159 0.183 0.050Ti 6/4 x Ti 6/4 0.634 0.634 0.023
Equal variances, Levene's 0.071 0.039 0.509
Figure 10: Levene's test for equal variances plot for bearing strength. A p-value greater than 0.01 suggests equal variance among groups.
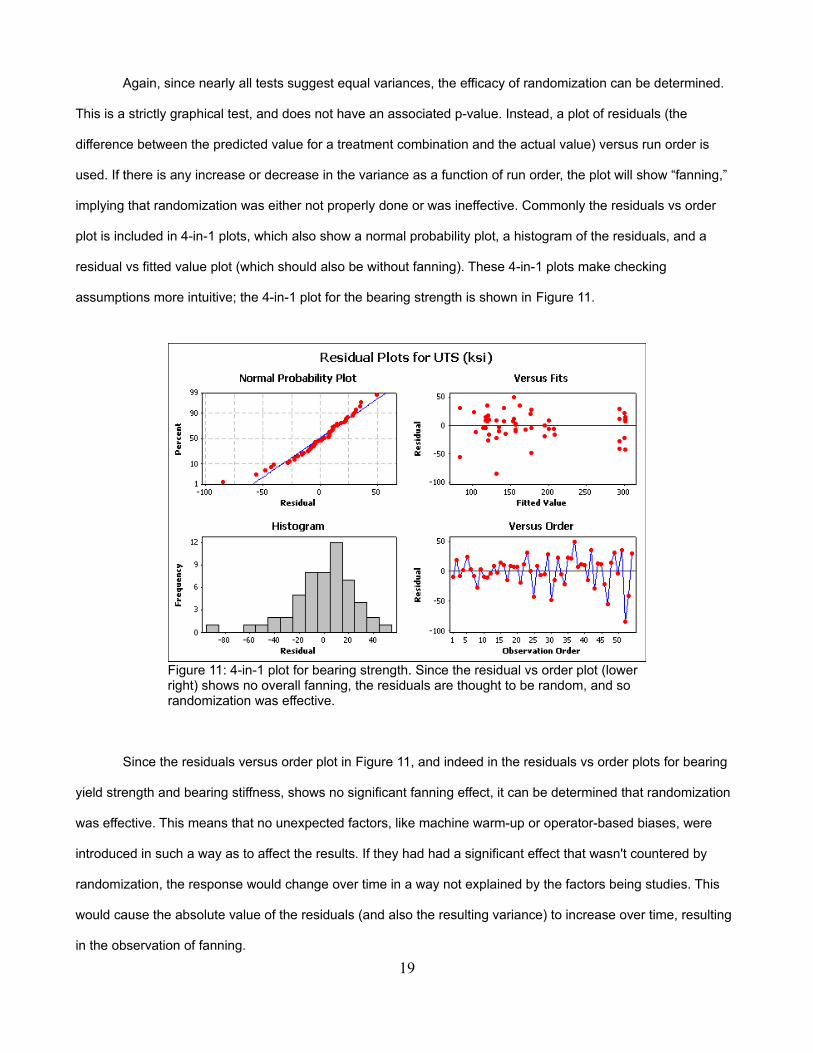
Again, since nearly all tests suggest equal variances, the efficacy of randomization can be determined.
This is a strictly graphical test, and does not have an associated p-value. Instead, a plot of residuals (the
difference between the predicted value for a treatment combination and the actual value) versus run order is
used. If there is any increase or decrease in the variance as a function of run order, the plot will show “fanning,”
implying that randomization was either not properly done or was ineffective. Commonly the residuals vs order
plot is included in 4-in-1 plots, which also show a normal probability plot, a histogram of the residuals, and a
residual vs fitted value plot (which should also be without fanning). These 4-in-1 plots make checking
assumptions more intuitive; the 4-in-1 plot for the bearing strength is shown in Figure 11.
Since the residuals versus order plot in Figure 11, and indeed in the residuals vs order plots for bearing
yield strength and bearing stiffness, shows no significant fanning effect, it can be determined that randomization
was effective. This means that no unexpected factors, like machine warm-up or operator-based biases, were
introduced in such a way as to affect the results. If they had had a significant effect that wasn't countered by
randomization, the response would change over time in a way not explained by the factors being studies. This
would cause the absolute value of the residuals (and also the resulting variance) to increase over time, resulting
in the observation of fanning.
19
Figure 11: 4-in-1 plot for bearing strength. Since the residual vs order plot (lower right) shows no overall fanning, the residuals are thought to be random, and so randomization was effective.

Analysis of Variance
Since all three assumptions for ANOVA are sufficiently met, the traditional analysis can be performed.
Even though the HSS pins were all without coating, the main effect by itself can be checked. However, the
interaction between fastener material and lubrication cannot, and so was temporarily removed from the analysis.
Also, in order to analyze the hole preparation method, the two methods had to be determined for each specimen.
This was done by analyzing the hole preparation main effect plot (Figure 12).
Figure 12: Main effects plot for hole preparation method's effect on bearing strength. The relative values were used to reduce the 7 methods down to the two that were intended by the project.
Since cold work could have an effect on the observed bearing strength of the specimen, the higher mean
value for the Al 7050 – T7451 samples (A/B), the PH13 – 8Mo – H1000 samples (C/D), and the Ti – 6Al – 4V
samples (E/F/G) was assumed to represent the drilled and reamed samples, while the lower mean represented
the samples that were only drilled. Since less material would be removed in the plates that were only drilled,
there would be a potential for less cold work along the surface of the hole. This would mean there was less
strengthening due to cold work, and would thus have a lower average strength. In the case of the Ti – 6Al – 4V
samples, which had 3 means, the two most closely grouped, E and G, were thought to be the same treatment. It
was know that the samples in group G were drilled and reamed (since they came in a separate, drilled-and-
reamed-only shipment); therefore, the above hypothesis appears to be reasonable. As a result, the group with
20

the higher mean bearing strength became hole preparation method A, while the lower became hole preparation
method B. However, even if the above hypothesis was deemed to be unreasonable, the effect on the response
would remained unchanged. Instead, hole preparation method A would represent the holes that were only drilled;
them effect observed would remain unchanged.
After reducing the levels of hole preparation and excluding the pin material/lubrication two-way
interaction, the ANOVA could be performed. One was performed for each of the three responses, and the effects
with significant p-values (those with p < α = 0.05) were highlighted in Table IX.
Table IX: ANOVA P-Values for All Three Responses, Significant Values Shown in Green.
From Table IX it can be seen that the plate material main effect and pin material main effect are
significant in all three responses, and the plate material/pin material and pin material/hole preparation method
two-way interactions are also significant, but neither are significant effects on the bearing stiffness. Also from the
ANOVA, the standard deviation for each response can be determined. The standard deviation for bearing
strength was 30.2044, 29.4149 for bearing yield strength, and 70.6052 for bearing stiffness.
It can also be seen that the lubrication/hole preparation method two-way interaction has a low, albeit
insignificant, p-value for all three responses. This means that although there appears to be no effect in this study,
it might deserve further, more careful investigation if that effect is either desirable or of particular interest. To
determine if the lubrication/hole preparation method two-way interaction is feasible to investigate in a related
study, a two-way T test power analysis can be performed. Using the pooled standard deviation (the standard
deviation for the entire ANOVA model) and a power of 0.90 (confidence level, α = 0.05), the necessary sample
size can be estimated given the difference in means. Utilizing the greatest difference between two means with
different combinations of lubrication and hole preparation method, the necessary sample size can be determined
21
P-valueEffect Strength Yield Stiffness
Plate Material 0.000 0.000 0.000Pin Material 0.000 0.000 0.000Lubrication 0.622 0.670 0.242Hole Preparation (Reduced) 0.493 0.794 0.504Plate x Pin 0.000 0.000 0.301Plate x Lubrication 0.243 0.208 0.901Plate x Hole Prep. 0.895 0.925 0.695Pin x Hole Prep. 0.027 0.038 0.331Lubrication x Hole Prep 0.113 0.076 0.108

(shown in Table X).
Table X: Power Analysis for Lubrication/Hole Preparation Method Two-way Interaction
As shown, the necessary sample size to detect at least one difference in the means (based on the
pooled standard deviation from this study) of bearing strength would be 83 samples. Since there are two levels
for both lubrication and hole preparation method, the total number of runs and samples would be 83 x 4 = 332.
Similarly, 420 runs would be necessary for the bearing yield strength and 588 runs for the bearing stiffness.
Therefore, to determine the significance of this effect, a sample size of the minimum of these three sizes, or 332
runs (significantly more than the number of runs in this study), would be needed. Otherwise, as is the case here,
no effect would be observed.
Also of importance in Table IX is the fact that even though hole preparation method does not have a
significant main effect, it does have a significant two-factor interaction. This means that by itself, it does not seem
to have an effect on bearing strength, bearing yield strength, or bearing stiffness, but it does have an effect when
another factor (in this case, the fastener used) changes.
Next, the fasteners can be compared without use of the HSS pins. This allows for a direct comparison
between the performances of the two screws. The most intuitive comparison is by that of a box plot, like the one
for bearing strength shown in Figure 13. As shown, there is significant overlap between the two pin types, even
with lubrication taken into account. Therefore, the performance of each screw type is statistically similar to one
another, and thus can be used interchangeably (with respect to the three responses).
22
Lubr Hole Prep Mean Difference Pooled SD Sample Size
BearingN A 209.6
36.6 72.0397 83N B 173.0
17.9Strength Y A 155.1
4.1Y B 151.0
BearingN A 187.6
28.8 64.0394 105N B 158.8
Yield 10.1Y A 148.7
Strength 1.8Y B 146.9
BearingN A 522.3
62.6 164.458 147N B 459.7
-2.6Stiffness Y A 462.3
29.0Y B 433.3

Figure 13: Boxplot for mean bearing strength, grouped by lubrication and screw type. Since the groups show significant overlap, the groups can be considered statistically similar.
Another way to quantitatively compare the two groups is by performing a two-sample t test. This test
uses the difference of the two means and the standard deviations for each screw type to develop a confidence
interval on the difference of means. A p-value is then determined by the ratio of the maximum value to the
minimum value; a range that is both positive and negative signifies an insignificant result. The actual values used
in this two-sample t test are shown in Figure 14.
23

Two-Sample T-Test and CI: UTS (ksi), Pin
Two-sample T for UTS (ksi)
Pin N Mean StDev SE Mean
A286 18 146.9 46.9 11
Ti 6/4 18 142.4 42.2 9.9
Difference = mu (A286) - mu (Ti 6/4)
Estimate for difference: 4.5
95% CI for difference: (-25.8, 34.7)
T-Test of difference = 0 (vs not =): T-Value = 0.30
P-Value = 0.766 DF = 33Figure 14: Minitab © output for a two-sample t test. Shown is the estimated difference, t-value, and insignificant p-value.
As given by the p-value, there is a 76.6% chance that any difference in the means of the two screws is
due to random chance, and is thus unlikely to occur intentionally. Therefore, this again shows that the two screw
types are statistically similar.
In conclusion, the plate material and fastener chosen seem to have an effect on bearing strength and
bearing yield strength, while the hole preparation method also has an effect, depending on the fastener chosen.
Alternatively, only the plate material and fastener chosen, independently of one another, seem to have an effect
on the bearing stiffness. Also, only the fastener type (pin or screw) in this study seems to affect the results, not
the fastener material.
Additionally, when the standard deviations are compared to the means for each group, it can be seen
that the standard deviations are sufficiently low. Because of this, effects could be determined from the ANOVA. It
can therefore also be said that ASTM specification E238 – 84(08) is a precise test method. A decent standard
deviation is attributed to the precision. Also, the precision was sufficient to allow for the observation of some
effects via ANOVA, attributing to the precision of both this study and the specification.
24

DISCUSSION
Qualifying
As shown in Table II, the Al 7050 – T7451 plates had significantly more scatter (a greater standard
deviation) in the hardness data than the other two plate materials. This is likely due to being at the upper limit of
the HRB scale. Since the hardness of the Al 7050 – T7451 plates is at the upper end of the scale, damage to the
sample from testing (size of the dimples) is minimal. This would mean that a slight dimensional change in the
localized yielding region would cause a significant areal change. Therefore, a large change in hardness would be
observed. This is the reason why data at the extremes, especially the upper extreme, are considered unreliable.
Also, the Al 7050 – T7451 plates exceeded the hardness outlined by AMS 2658B. This is perhaps due to
heat treatment deviation, but is difficult to say without access to material certifications. This could also be why
the Ti – 6Al – 4V (mill annealed) samples fell short of the hardness value outlined by the Aerospace Structural
Metals Handbook (Code 3707) and the PH13 – 8Mo – H1000 samples fell short of the value outlined by AMS
5629. However, as previously stated, the HRC hardness value for the Ti – 6Al – 4V plates is approximate and is
not used for acceptance.
The Ti – 6Al – 4V and A286 screws have a significantly lower hardness than the HSS pins, as displayed
in Table III. The pins are meant to be a control for the test, whereas the screws are manufactured and intended
for application. For the purposes of this ASTM specification E238 – 84(08) testing, the hardness requirements,
and thus heat treatment requirements, for the pins are much higher than for the screws. As stated previously,
this is ideal; the purpose of the pins is to cause the plate to fail with virtually no damage to the pin. Conversely,
the screws are supposed to fail before the plate. This allows lighter, less expensive screws to be used to the
same effect. Therefore, it is much more realistic for the screws to be less hard than the pins.
Testing
An important observation from the testing is that all Al 7050 – T7451 specimens yielded prior to failure.
This is typical for wrought aluminum alloys, like Al 7050. Since aluminum forms a face-centered cubic (FCC)
crystal structure, dislocations move easily in response to stress (FCC crystals are associated with a low Peierls
25
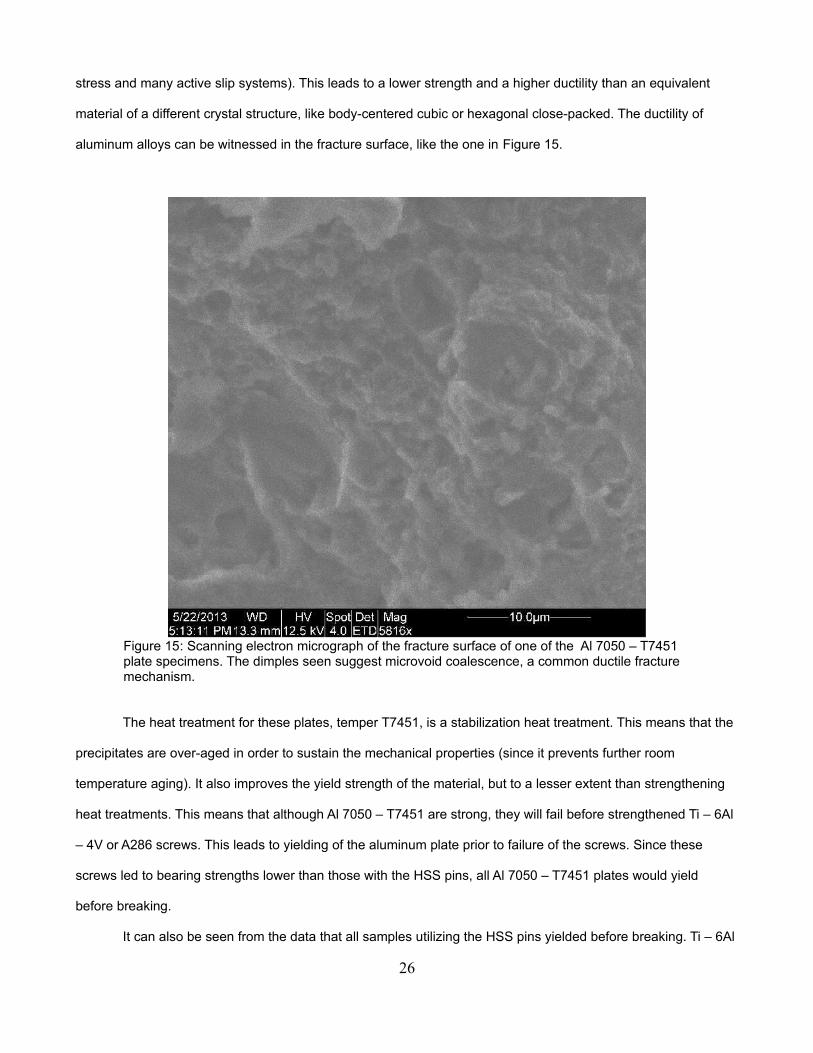
stress and many active slip systems). This leads to a lower strength and a higher ductility than an equivalent
material of a different crystal structure, like body-centered cubic or hexagonal close-packed. The ductility of
aluminum alloys can be witnessed in the fracture surface, like the one in Figure 15.
Figure 15: Scanning electron micrograph of the fracture surface of one of the Al 7050 – T7451 plate specimens. The dimples seen suggest microvoid coalescence, a common ductile fracture mechanism.
The heat treatment for these plates, temper T7451, is a stabilization heat treatment. This means that the
precipitates are over-aged in order to sustain the mechanical properties (since it prevents further room
temperature aging). It also improves the yield strength of the material, but to a lesser extent than strengthening
heat treatments. This means that although Al 7050 – T7451 are strong, they will fail before strengthened Ti – 6Al
– 4V or A286 screws. This leads to yielding of the aluminum plate prior to failure of the screws. Since these
screws led to bearing strengths lower than those with the HSS pins, all Al 7050 – T7451 plates would yield
before breaking.
It can also be seen from the data that all samples utilizing the HSS pins yielded before breaking. Ti – 6Al
26
– 4V (mill annealed) and PH13 – 8Mo – H1000, much like Al 7050 – T7451, exhibit ductile failure. This is a
desirable trait for structural materials; this makes the failure more predictable than a brittle fracture with no
yielding whatsoever. A yield-before-break behavior allows the user to witness the failure prior to fast fracture,
providing a degree of safety. As shown in the hardness data for the Ti – 6Al – 4V (mill annealed) plates, PH13 –
8Mo – H1000 plates, and HSS pins (Table II and Table III), the pins are much harder than the plates. This would
suggest that the yield strength for Ti – 6Al – 4V (mill annealed) and PH13 – 8Mo – H1000 is lower than HSS,
meaning that the plates should fail prior to the pins. This trend was observed, and ductile fracture is observed in
the fracture surface of the plates, like in the Al 7050 – T7451 plates (Figure 15). The fracture surfaces for the Ti –
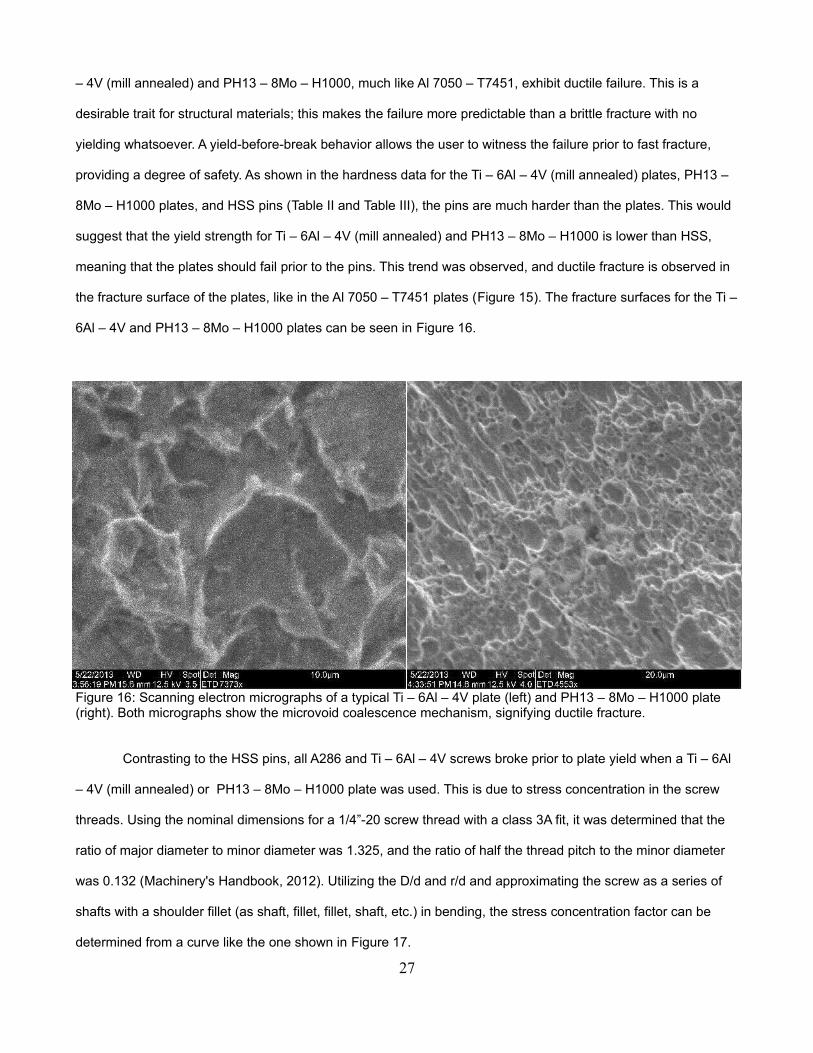
6Al – 4V and PH13 – 8Mo – H1000 plates can be seen in Figure 16.
Figure 16: Scanning electron micrographs of a typical Ti – 6Al – 4V plate (left) and PH13 – 8Mo – H1000 plate (right). Both micrographs show the microvoid coalescence mechanism, signifying ductile fracture.
Contrasting to the HSS pins, all A286 and Ti – 6Al – 4V screws broke prior to plate yield when a Ti – 6Al
– 4V (mill annealed) or PH13 – 8Mo – H1000 plate was used. This is due to stress concentration in the screw
threads. Using the nominal dimensions for a 1/4”-20 screw thread with a class 3A fit, it was determined that the
ratio of major diameter to minor diameter was 1.325, and the ratio of half the thread pitch to the minor diameter
was 0.132 (Machinery's Handbook, 2012). Utilizing the D/d and r/d and approximating the screw as a series of
shafts with a shoulder fillet (as shaft, fillet, fillet, shaft, etc.) in bending, the stress concentration factor can be
determined from a curve like the one shown in Figure 17.
27

Figure 17: Stress concentration factor curves for a shaft with a shoulder fillet, loaded in bending. (Shigley's Mechanical Engineering Design, 2011)
From the curves, the stress concentration factor, Kt, is between 1.4 and 1.6. This means that the far-field
stress is amplified by 40-60% around the screw threads. Since the hardness values, and thus the yield
strengths, between the two screw materials and two plate materials are similar, the amplified stress would lead
to the screws failing prior to plate yielding.
Since the approximation uses rounded threads, the actual stress concentration factor would be higher.
Since the HSS pins would ideally represent the performance without geometry, the stress concentration factor
can be approximated by the percent difference between the screw in question and the HSS pin. Using the mean
bearing strength, the HSS pins achieved a mean strength of 250.54 ksi. The approximate stress concentration
factors for each screw type are shown in Table XI.
Table XI: Approximate Stress Concentration Factors by Screw Type
Screw Material Mean Bearing Strength (ksi) Kt
Coated A286 146.92 1.71
Ti – 6Al – 4V 142.45 1.76
Although the stress concentration factors of the two screw types are different, they are not statistically
different. Therefore, it cannot be said which screw type has the greater stress concentration factor; in fact, since
the geometries of the two types are nearly identical, the factors should be the same. Also, the only difference
between the two screws is the material used to make them; since this only accounts for roughly a 5% difference
28
in stress concentration, the performance of the screws is geometry-driven, and the material used is nearly
insignificant by this measure. This insignificant difference can also be seen in the Rockwell hardness values for
the two screw types in Table III, which shows a percent difference of less than 1% in the mean hardness values.
As shown in Table XI, the stress concentration factor is roughly 71-76% around the screw threads.
However, this stress concentration is unlikely to be witness in application: ideally, the threads would not be
loaded, and only the section of the fastener without threads would contact the plate or plates. However, this was
not the case in this study. Since both the threaded section and the smooth section of the screws were loaded,
the threaded section failed in each case, due to stress concentrations greater than 40%. This makes estimation
of the performance of the screws inaccurate, since a screw would be chosen that was sufficiently long to avoid
stress concentration and early failure.
Statistics
The assumption of normality was determined to be reasonable overall. However, the p-value for the
bearing stiffness using Al 7050 – T7451 plate specimens with Ti – 6Al – 4V screws was significant. This is due to
the nature of stiffness: it is a function of the stiffness of the atomic bonds in the material, and is thus not subject
to heat treatment, cold work, or other strengthening mechanisms, like tensile strength and yield strength are.
This would cause the stiffness to manifest in discrete values (ideally), rather than as a continuous variable.
Therefore, it would be expected that bearing stiffness would be a less continuous variable than the bearing
strength or bearing yield strength. This can be seen in Table VIII, where the p-values for all stiffness normality
tests are lower than the corresponding p-value in the bearing strength and bearing yield strength tests. This
difference in continuity also has an effect on the Levene's tests for equal variances, showing a significantly
higher p-value.
This difference between stiffness and strength can also be witnessed in the lack of significant two-factor
interactions for stiffness. In ASTM E238 tests, the fastener is pulled upward, subjecting the plate to tension. To
determine bearing stiffness, this plate-pin system is only loaded in an elastic way; the pin and plate both operate
similar to two linear springs. Therefore, their effects simply add to one another, so no interaction between pin
and plate is witnessed. Also, cold work and lubrication have no effect on this mechanism, so neither main effect
nor their respective two-factor interactions are significant. However, depending on the scatter of the data, an
29

artificial two-factor interaction between lubrication and hole preparation method could be observed. This alludes
to the observation of false effects (type II error) mentioned earlier.
Another assumption was in the hole preparation method grouping: the group with the higher mean
bearing strength was drilled and reamed, while the group that was drilled only was the lower mean value (Figure
12). This assumption was made because more material would be removed from the plate during drilling and
reaming than drilling alone. This would lead to increased cold work, which would increase the strength of the
material around the hole. This, in turn, would lead to a higher perceived bearing strength for that particular run
and sample. However, since the hole preparation method was coded as A and B during experimentation, the
actual level coded to either A or B wouldn't alter the results. Therefore, A could be either drilled only or drilled and
reamed, and the grouping would still be valid.
Significant Effects
The first significant main effect discovered was the plate material. Since the three materials have
variations in tensile strength, yield strength, and elastic modulus, variation would also be expected in bearing
strength, bearing yield strength, and bearing stiffness, respectively. The same could be said for the fastener
used, the only other significant main effect, even though the two screw types behaved similarly, but quite
differently from the HSS pins. The mechanical properties were more governed by the geometry of the screws
than the material, causing them to behave similarly. In contrast, the HSS pins were made from a much harder
material and with a less significant stress concentration factor, since deviations in the surface, or surface
roughness, are much smaller and less severe than the screw threads.
As stated, the screws failed before the plates when Ti – 6Al – 4V (mill annealed) or PH13 – 8Mo –
H1000 plates were used, but afterward when Al 7050 – T7451 plates were used. Also, the Samples behaved in a
different way than this when the HSS pins were used. This complex relationship between plate and fastener led
to a significant two-factor interaction between plate material and fastener used. This seems reasonable since the
materials, and thus behaviors, varied between plate and pin materials, and geometry became a factor when
screws were used.
The Ti – 6Al – 4V and A286 screw behaved similarly in most ways. However, the A286 screws and HSS
pins both exhibited higher mean values with the drilled only plates than the drilled and reamed plates. However,
30

the opposite trend was observed in the Ti – 6Al – 4V screws. The Ti – 6Al – 4V screws had a tendency to
imbed themselves in the plates being tested before breaking, rather than just breaking as the A286 screws did.
This imbedding would be easier with less cold work, which could lead to a higher perceived strength. Contrary to
the analysis of the main effects plot shown in Figure 12, this would suggest that the drilled only plates were more
strengthened than the drilled and reamed samples. This can be seen in the HSS pins (which showed no
deformation or imbedding of any kind) performing better in the presumed drilled only condition. However, this
trend is not backed by the statistics, since both means are statistically similar in all three responses.
31

CONCLUSIONS
From this study, it was determined that both the plate material used and the pin material, whether a
screw or a pin, had a significant effect on ASTM E238 bearing strength, bearing yield strength, and bearing
stiffness. The interaction between the two factors was also significant on all responses but the bearing stiffness.
PH13 – 8Mo – H1000 plates seemed to perform best on average, followed by Ti – 6Al – 4V (mill annealed), then
Al 7050 – T7451. PH13 – 8Mo – H1000 and Ti – 6Al – 4V (mill annealed) plates had similar bearing strength
and bearing yield strength averages with the HSS control pins being used, which had the highest mean values
for a given plate and fastener. The Ti – 6Al – 4V and A286 screws behaved and performed statistically similar in
most cases.
The method by which the holes in the plates were prepared, drilled and reamed or simply drilled, was not
significant by itself, but did seem to have an effect on the performance of the fastener used. The Ti – 6Al – 4V
screws performed better when the hole was simply drilled, while the coated A286 screws performed better when
the hole was drilled and reamed. All screws had lower resulting bearing properties than the HSS control pins.
It was also found that ASTM specification E238 – 84(08) is a precise test method, since the method
could be performed repeatably and reliably with no missing data points. Therefore, this ASTM testing method is
reasonable for determining bearing properties, which can then be used to design aircraft.
32

RECOMMENDATIONS AND FUTURE WORK
One possible improvement on the experiment outlined in this work would be to test HSS pins in a coated
condition. To make this possible, smaller HSS pins would have to be used for the coated samples, and the
coating process would have to be automated in order to insure a constant coating thickness. Including coated
HSS pins in the model would allow for a more complete ANOVA, which could lead to more meaningful results by
allowing the fastener and lubrication two-factor interaction to be observed and evaluated for all possible levels of
fastener and lubrication. This could yield a significant effect for lubrication, either as a main effect or a two-factor
interaction with another factor.
A potential follow up experiment could be performed utilizing more or different plate materials and
fasteners. This application-based approach could yield valuable information about other plate materials and
fasteners, increasing the scope of the experiment.
Conversely, the scope of this experiment could be narrowed in a future experiment. Observing only
factors deemed statistically significant by this study, a more accurate p-value could be obtained. This means
more information could be determined, with either the same or more runs in the experiment. For example,
lubrication could be removed, since it didn't yield any statistically significant effects by itself or with other factors.
Another possible follow up study would be to narrow the study further, to look into the effect of cold work
on the bearing properties. Since the main effect plot for bearing strength suggests a different trend than the trend
in the fastener/hole preparation method interaction, careful investigation would be necessary to determine the
more accurate trend, and thus the underlying mechanism, in the relationship between cold work and the bearing
properties.
33

REFERENCES
1) Caputo, F., G. Lamanna, and A. Soprano. "About the Effects of Residual Stress States Coming from
Manufacturing Processes on the Behaviour of Riveted Joints." Key Engineering Materials 385 (2008):
25-28. Scientific.net. Web. <http://www.scientific.net/KEM.385-387.25>.
2) Stickley, G. W., and A. A. Moore. “Effects of Lubrication and Pin Surface on Bearing Strengths of
Aluminum and Magnesium Alloys.” Material Research & Standards, Vol. 2, No. 9, pp. 747 September
1962.
3) Metallic Materials Properties Development and Standardization (MMPDS). “Metallic Materials Properties
Development and Standardization Handbook MMPDS-07.” MMPDS. April 12, 2012. Techstreet.com.
<http://www.techstreet.com/products/1848007>
4) ASTM Standard E238, 1984 (2008). “Standard Test Method for Pin-Type Bearing Test of Metallic
Materials.” ASTM International. West Conshohocken, PA, 2008. DOI: 10.1520/E0238-84R08,
www.astm.org.
5) Society of Automotive Engineers (SAE) Aerospace Material Specifications (AMS) 2658 B. "Hardness
and Conductivity Inspection of Wrought Aluminum Alloy Parts." American National Standards Institute
(ANSI). N.p., n.d.
6) Aerospace Structural Metals Handbook Code 3707. "Aerospace Structural Metals Handbook." Vol. 5,
Code 3707. Department of Defense. 2000. Google Books.
7) Society of Automotive Engineers (SAE) Aerospace Material Specifications (AMS) 5629E – 2002. "Steel,
Corrosion Resistant, Bars, Forgings, Rings, and Extrusions, 13Cr 8.0Ni 2.2Mo 1.1Al Vacuum Induction
Plus Consumable Electrode Melted Solution Heat Treated, Precipitation Hardenable (Reaffirmed: Oct
2006)." American National Standards Institute (ANSI). 2006.
8) Military Specification MIL-PRF-16173 E. “MIL-PRF-16173E, Corrosion Prevention Compound, Solvent
Cutback, Cold-Application.” Department of Defense. Oct 1966.
34

9) Oberg, Erik, and Christopher J. McCauley. Machinery's Handbook: A Reference Book for the Mechanical
Engineer, Designer, Manufacturing Engineer, Draftsman, Toolmaker, and Machinist. New York: Industrial,
2012. Engineers Edge. Web. <http://www.engineersedge.com/screw_threads_chart.htm>
10) Budynas, Richard G., J. Keith. Nisbett, and Joseph Edward. Shigley. Shigley's Mechanical Engineering
Design. New York: McGraw-Hill, 2011. NC State University, Department of Mechanical & Aerospace
Engineering. Web. <http://www.mae.ncsu.edu/eischen/courses/mae316/docs/Appendix_C.pdf>.
35

APPENDICES
APPENDIX A: TESTING DATA
A1: Numerical Data
Table XII: Bearing Strength, Bearing Yield Strength, and Bearing Stiffness for Each Run
36
Run Order Plate Pin Lubrication Bearing Strength (ksi) Bearing Yield Strength (ksi) Bearing Stiffness (ksi)1 Ti 6/4 1 Ti 6/4 1 Y 204.44 204.44 479.782 Al 7050 3 Ti 6/4 6 Y 162.05 123.16 340.933 Ti 6/4 9 HSS 3 N 305.44 271.87 478.854 Ti 6/4 15 A286 9 Y 198.32 198.32 420.175 Ph13-8mo 8 A286 4 Y 208.72 208.72 754.726 Al 7050 9 HSS 4 N 160.43 131.55 401.077 Ph13-8mo 12 Ti 6/4 18 Y 205.83 205.83 572.528 Al 7050 6 HSS 15 N 159.35 130.08 433.609 Ti 6/4 20 HSS 10 N 323.51 286.18 591.7210 Ti 6/4 12 HSS 1 N 316.63 279.97 554.0211 Al 7050 4 HSS 12 N 158.06 135.48 403.2312 Ph13-8mo 18 HSS 19 N 323.16 282.19 909.0913 Ti 6/4 3 Ti 6/4 5 Y 166.20 166.20 369.3414 Al 7050 2 A286 2 N 139.08 113.21 323.4515 Al 7050 13 Ti 6/4 11 N 126.14 126.14 322.5816 Ti 6/4 4 A286 18 Y 141.18 141.18 420.1717 Al 7050 18 HSS 8 N 161.72 132.61 460.8318 Al 7050 15 Ti 6/4 20 N 132.61 109.97 322.5819 Ph13-8mo 15 HSS 6 N 322.82 277.98 895.5220 Ti 6/4 2 A286 6 N 127.71 127.71 438.3621 Ph13-8mo 11 Ti 6/4 17 Y 172.31 172.31 646.9022 Ti 6/4 8 HSS 13 N 306.32 268.46 575.5423 Al 7050 10 Ti 6/4 8 Y 125.13 109.09 320.8624 Ti 6/4 13 Ti 6/4 3 N 113.80 113.80 417.8325 Ph13-8mo 14 Ti 6/4 7 N 192.54 192.54 559.7026 Ph13-8mo 3 A286 10 N 175.51 175.51 561.8027 Ti 6/4 5 Ti 6/4 13 N 128.99 128.99 451.9828 Al 7050 14 Ti 6/4 9 Y 132.97 126.49 324.3229 Al 7050 1 HSS 18 N 147.20 124.80 400.0030 Ti 6/4 10 Ti 6/4 19 Y 109.09 109.09 413.2231 Al 7050 8 A286 19 N 93.92 84.21 268.8232 Ph13-8mo 16 A286 11 N 201.82 201.82 562.8533 Al 7050 17 A286 3 Y 106.61 100.15 322.5834 Ph13-8mo 13 Ti 6/4 10 Y 129.33 129.33 497.5135 Ph13-8mo 1 Ti 6/4 14 N 149.05 149.05 549.4536 Ph13-8mo 17 HSS 5 N 277.91 242.05 691.4437 Al 7050 11 A286 13 N 93.67 90.44 293.2638 Ph13-8mo 19 A286 5 Y 197.38 197.38 527.7639 Ph13-8mo 7 HSS 2 N 258.57 210.36 735.2940 Ph13-8mo 10 A286 17 Y 194.46 194.46 603.7741 Al 7050 12 Ti 6/4 15 N 113.21 103.50 153.6142 Ti 6/4 14 A286 20 N 110.15 110.15 416.6743 Ti 6/4 7 HSS 20 N 265.62 236.10 599.4044 Al 7050 5 A286 1 Y 126.31 100.40 323.4545 Ti 6/4 16 A286 16 Y 46.29 46.29 445.1046 Ph13-8mo 2 HSS 9 N 308.34 272.06 696.6647 Ph13-8mo 4 HSS 11 N 312.45 271.70 754.7248 Ti 6/4 18 HSS 16 N 253.16 231.76 593.4749 Ph13-8mo 6 A286 14 N 195.82 195.82 555.5650 Ti 6/4 6 A286 12 N 155.11 155.11 463.7751 Al 7050 16 A286 15 Y 132.43 129.20 306.4052 Al 7050 7 HSS 7 N 148.99 129.55 404.3153 Ph13-8mo 5 Ti 6/4 12 N 172.66 172.66 454.3754 Ti 6/4 11 Ti 6/4 2 N 27.73 27.73 105.53

A2: Load-Extension Curves
Figure 18: Load-extension curve for runs 2-9
Figure 19: Load-extension curve for runs 19-27
37

Figure 20: Load-extension curve for runs 28-36
Figure 21: Load-extension curve for runs 37-45
Figure 22: Load-extension curve for runs 46-54
38

APPENDIX B: STATISTICAL DATA
B1: Additional Randomization Tables
Table XIII: Plate Geometry Qualifying Order
39
Std Order Test Order Plate Std Order Test Order Plate43 1 Ti 6/4 6 25 30 Ph13-8mo 745 2 Ti 6/4 8 39 31 Ti 6/4 234 3 Ph13-8mo 16 1 32 Al 7040-T7451 148 4 Ti 6/4 11 17 33 Al 7040-T7451 1737 5 Ph13-8mo 19 38 34 Ti 6/4 154 6 Ti 6/4 17 8 35 Al 7040-T7451 829 7 Ph13-8mo 11 55 36 Ti 6/4 183 8 Al 7040-T7451 3 13 37 Al 7040-T7451 1326 9 Ph13-8mo 8 36 38 Ph13-8mo 1849 10 Ti 6/4 12 7 39 Al 7040-T7451 733 11 Ph13-8mo 15 4 40 Al 7040-T7451 451 12 Ti 6/4 14 27 41 Ph13-8mo 930 13 Ph13-8mo 12 53 42 Ti 6/4 1646 14 Ti 6/4 9 42 43 Ti 6/4 516 15 Al 7040-T7451 16 22 44 Ph13-8mo 46 16 Al 7040-T7451 6 14 45 Al 7040-T7451 1450 17 Ti 6/4 13 12 46 Al 7040-T7451 1211 18 Al 7040-T7451 11 15 47 Al 7040-T7451 1521 19 Ph13-8mo 3 9 48 Al 7040-T7451 947 20 Ti 6/4 10 18 49 Al 7040-T7451 1810 21 Al 7040-T7451 10 20 50 Ph13-8mo 240 22 Ti 6/4 3 2 51 Al 7040-T7451 224 23 Ph13-8mo 6 57 52 Ti 6/4 2056 24 Ti 6/4 19 28 53 Ph13-8mo 1032 25 Ph13-8mo 14 23 54 Ph13-8mo 535 26 Ph13-8mo 17 41 55 Ti 6/4 431 27 Ph13-8mo 13 5 56 Al 7040-T7451 519 28 Ph13-8mo 1 52 57 Ti 6/4 15

Table XIV: Pin Straightness Qualifying Order
40
Std Order Test Order Pin Std Order Test Order Pin36 1 HSS 16 13 31 A286 1337 2 HSS 17 11 32 A286 1132 3 HSS 12 58 33 Ti 6/4 1823 4 HSS 3 60 34 Ti 6/4 2028 5 HSS 8 43 35 Ti 6/4 334 6 HSS 14 5 36 A286 529 7 HSS 9 17 37 A286 1738 8 HSS 18 15 38 A286 1530 9 HSS 10 42 39 Ti 6/4 227 10 HSS 7 14 40 A286 1425 11 HSS 5 7 41 A286 721 12 HSS 1 16 42 A286 1626 13 HSS 6 3 43 A286 333 14 HSS 13 54 44 Ti 6/4 1424 15 HSS 4 56 45 Ti 6/4 1622 16 HSS 2 20 46 A286 2039 17 HSS 19 8 47 A286 831 18 HSS 11 44 48 Ti 6/4 435 19 HSS 15 57 49 Ti 6/4 1740 20 HSS 20 4 50 A286 451 21 Ti 6/4 11 9 51 A286 91 22 A286 1 19 52 A286 1959 23 Ti 6/4 19 10 53 A286 1047 24 Ti 6/4 7 45 54 Ti 6/4 553 25 Ti 6/4 13 41 55 Ti 6/4 150 26 Ti 6/4 10 12 56 A286 126 27 A286 6 18 57 A286 1848 28 Ti 6/4 8 55 58 Ti 6/4 1549 29 Ti 6/4 9 46 59 Ti 6/4 652 30 Ti 6/4 12 2 60 A286 2

Table XV: Pin Coating and Testing Order
Table XVI: Pin Coating Order
41
Rdm Order Pin Pin Pin1 HSS 4 A286 1 Ti 6/4 8
Coat
Test Order
2 HSS 7 A286 15 Ti 6/4 93 HSS 8 A286 3 Ti 6/4 64 HSS 9 A286 17 Ti 6/4 175 HSS 2 A286 4 Ti 6/4 186 HSS 6 A286 5 Ti 6/4 107 HSS 13 A286 18 Ti 6/4 18 HSS 20 A286 16 Ti 6/4 59 HSS 1 A286 9 Ti 6/4 1910 HSS 14 A286 8 Ti 6/4 4 Unused11 HSS 15 A286 13 Ti 6/4 15
Uncoated
12 HSS 18 A286 2 Ti 6/4 2013 HSS 12 A286 19 Ti 6/4 1114 HSS 11 A286 10 Ti 6/4 1415 HSS 5 A286 11 Ti 6/4 716 HSS 19 A286 14 Ti 6/4 1217 HSS 3 A286 6 Ti 6/4 1318 HSS 16 A286 12 Ti 6/4 319 HSS 10 A286 20 Ti 6/4 220 HSS 17 A286 7 Ti 6/4 16 Unused
Num Order Coat Order Pin Num Order Coat Order Pin Num Order Coat Order Pin1 8 A286 1 11 9 HSS 1 21 18 Ti 6/4 12 30 A286 3 12 28 HSS 2 22 15 Ti 6/4 43 14 A286 4 13 16 HSS 4 23 12 Ti 6/4 54 17 A286 5 14 4 HSS 6 24 29 Ti 6/4 65 27 A286 8 15 21 HSS 7 25 1 Ti 6/4 86 3 A286 9 16 19 HSS 8 26 10 Ti 6/4 97 26 A286 15 17 22 HSS 9 27 5 Ti 6/4 108 13 A286 16 18 25 HSS 13 28 23 Ti 6/4 179 2 A286 17 19 24 HSS 14 29 20 Ti 6/4 1810 7 A286 18 20 11 HSS 20 30 6 Ti 6/4 19

B2: Data Analysis: Analysis of Variance
Table XVII: Analysis of Variance Tables
General Linear Model: UTS (ksi), Yield (ksi), ... versus Plate, Pin, ...
Factor Type Levels ValuesPlate fixed 3 Al 7050, Ph13-8mo, Ti 6/4Pin fixed 3 A286, HSS, Ti 6/4Lubr. fixed 2 N, YHole Prep (reduced) fixed 2 A, B
Analysis of Variance for UTS (ksi), using Adjusted SS for Tests
Source DF Seq SS Adj SS Adj MS F PPlate 2 69540 43110 21555 23.63 0.000Pin 2 134639 81609 40805 44.73 0.000Lubr. 1 2662 226 226 0.25 0.622Hole Prep (reduced) 1 12 438 438 0.48 0.493Plate*Pin 4 41366 35693 8923 9.78 0.000Plate*Lubr. 2 1547 2684 1342 1.47 0.243Plate*Hole Prep (reduced) 2 5 202 101 0.11 0.895Pin*Hole Prep (reduced) 2 5651 7285 3643 3.99 0.027Lubr.*Hole Prep (reduced) 1 2402 2402 2402 2.63 0.113Error 36 32843 32843 912Total 53 290667
S = 30.2044 R-Sq = 88.70% R-Sq(adj) = 83.37%
Analysis of Variance for Yield (ksi), using Adjusted SS for Tests
Source DF Seq SS Adj SS Adj MS F PPlate 2 76951 51587 25794 29.81 0.000Pin 2 72307 43754 21877 25.28 0.000Lubr. 1 2235 159 159 0.18 0.670Hole Prep (reduced) 1 20 60 60 0.07 0.794Plate*Pin 4 28801 25108 6277 7.25 0.000Plate*Lubr. 2 1572 2844 1422 1.64 0.208Plate*Hole Prep (reduced) 2 430 135 67 0.08 0.925Pin*Hole Prep (reduced) 2 4748 6182 3091 3.57 0.038Lubr.*Hole Prep (reduced) 1 2889 2889 2889 3.34 0.076Error 36 31149 31149 865Total 53 221102
S = 29.4149 R-Sq = 85.91% R-Sq(adj) = 79.26%
Analysis of Variance for Stiffness (ksi), using Adjusted SS for Tests
Source DF Seq SS Adj SS Adj MS F PPlate 2 824149 614654 307327 61.65 0.000Pin 2 330258 192812 96406 19.34 0.000Lubr. 1 20898 7043 7043 1.41 0.242Hole Prep (reduced) 1 2497 2267 2267 0.45 0.504Plate*Pin 4 27939 25244 6311 1.27 0.301Plate*Lubr. 2 264 1041 521 0.10 0.901Plate*Hole Prep (reduced) 2 5778 3669 1835 0.37 0.695Pin*Hole Prep (reduced) 2 10554 11379 5689 1.14 0.331Lubr.*Hole Prep (reduced) 1 13507 13507 13507 2.71 0.108Error 36 179463 179463 4985Total 53 1415307
S = 70.6052 R-Sq = 87.32% R-Sq(adj) = 81.33%
42

B3: Data Analysis: Plots
Figure 23: Plate main effects plot for bearing strength.
Figure 24: Plate main effects plot for bearing yield strength.
43

Figure 25: Plate main effects plot for bearing stiffness.
Figure 26: Pin main effects plot for bearing strength.
44

Figure 27: Pin main effects plot for bearing yield strength.
Figure 28: Pin main effects plot for bearing stiffness.
45

Figure 29: Plate x Pin interaction plot for bearing strength.
Figure 30: Plate x Pin interaction plot for bearing yield strength.
46

Figure 31: Plate x Pin interaction plot for bearing stiffness.
Figure 32: Pin x Hole Preparation Method interaction plot for bearing strength.
47

Figure 33: Pin x Hole Preparation Method interaction plot for bearing strength.
Figure 34: Pin x Hole Preparation Method interaction plot for bearing strength.
48