investigation into the influence of reynolds number on ... · investigation into the influence of...
TRANSCRIPT

Fourth International Symposium on Marine Propulsors smp’15, Austin, Texas, USA, June 2015
Investigation into the Influence of Reynolds Number on Open Water
Characteristics of Pod Propulsors
Vladimir Krasilnikov, Lucia Sileo and Tae-Hwan Joung MARINTEK, Trondheim, Norway
ABSTRACT
This paper presents the results of CFD-based analysis of the influence of Reynolds number on open water characteristics of a pulling pod propuslor. Numerical results are compared with experimental data in model scale. Full scale CFD simulations are performed at two scale factors, covering the whole range of propulsor operation, from near bollard to free sailing, and beyond the point of maximum efficiency. Scale effects on propeller characteristics, pod resistance and propeller-pod interaction are predicted, and predictions are supported by the findings from flow analysis. The influence of surface roughness is accounted for approximately in full scale predictions.
Keywords Propellers, Pod propulsors, Scale effect, Open water characteristics, CFD, RANSE.
1 INTRODUCTION
Pod propulsors have secured a firm place on the shipbuilding market due to their superior performance characteristics as regards efficiency, steering capabilities, cavitation and acoustics. They are found as the main propulsion systems and auxiliary steering units on a wide range of vessels, including coastal ferries, multi-purpose offshore vessels, cargo vessels and naval ships. In spite of substantial volume of correlation data on the performance of pod propulsors, which are accumulated by the testing facilities and ship operators, there exists certain deficiency in performance prediction procedures based on the results of model tests. As a general rule, model tests for a vessel equipped with pod propulsors are conducted according to the standard procedure recommended by the ITTC (ITTC, 2008), which involves resistance test of ship hull without propulsor, propulsor test in open water and self-propulsion test. Thus, performance prediction in full scale implies scaling of the open water propulsor characteristics to account for the effect of Reynolds number. A number of engineering methods are known to be applied to this problem (Hotrop, 2001), (Mewis & Praefke, 2003), (Sasaki et al, 2004). These methods vary in degree of complexity, but none can be recognized as a universal procedure applicable to different propulsor designs. Presently, the
most common method for scaling pod propulsor characteristics follows the procedure recommended by the ITTC and detailed in (ITTC, 2008), which treats propeller thrust and torque exactly as those of a conventional shaft propeller (ITTC'78 Extrapolation Procedure) and considers the total resistance of the pod as a sum of the friction component and pressure component. The former component is scaled according to the traditional friction extrapolation lines, while the latter component is defined by means of a form-factor, which is usually assumed dependent neither on Reynolds number nor on propeller loading condition. The very idea of such scaling methods does not necessary require capturing the details of flow physics, but rather implies a reasonable correlation with full scale data, which may be ship specific, propulsor specific, and even dependent on the procedure adopted in a testing facility.
Additional challenge comes from the fact that pod resistance is seldom measured directly during model tests. Instead, it is defined as the difference between the measured total thrust of the unit and thrust of propeller. For this reason, pod resistance may be influenced by the so-called “gap effect”, depending on size of the gap between the propeller hub and pod gondola, and configuration of the above parts at the location of the gap.
Therefore, in recent years numerical analyses of pod propulsors by CFD are used to establish dependencies of their open water characteristics on Reynolds number. One of the pioneering RANSE-based studies on the subject (Chicherin et al, 2004) presented the evidence that commonly used pod form-factor appears dependent on pod geometry, propeller loading and Reynolds number, and thus can hardly be used with confidence in scaling procedures, unless tuned for the application to specific pod configurations. Instead they suggest using the scaling factor TG, which is the ratio between pod resistance coefficients calculated in full scale and in model scale
/ . (1)
Thus defined scaling factor depends on pod configuration, and according to (Chicherin et al, 2004) it may vary from 0.65 for well-streamlined pods to 0.86 for pods with blunter outlines. The influence of propeller loading on the scaling factor was addressed in (Krasilnikov et at, 2007) where a

viscous/potential coupled method was applied to study scale effects on the characteristics of a pod propulsor operating in pulling and pushing modes. The scaling factor for the pod resistance TG was shown to be dependent on propeller loading conditions and configuration of the unit. For the pulling configuration, it varied from 0.71 for heavier loading to 0.81 for lighter loading, whereas for the pushing configuration, it varied from 0.91 for heavier loading to 0.85 for lighter loading. An interesting and detailed CFD study on Reynold number effect on open characteristics of a generic pulling pod propulsor was recently presented in (Choi et al, 2014). In particular, observations are made that pod interaction with accelerated and swirled propeller slipstream is the key mechanism that determines pod resistance. The pressure component of pod resistance is shown to be dependent on the rate of pressure recovery near the strut trailing edge under different Reynolds numbers, and also affected considerably by the pressure distribution in region of pod-strut junction. The frequently used ratio between pod resistance and total unit thrust KTG/KTTOT is shown to increase with increasing advance coefficient, while the rate of its increase reduces with increasing Reynolds number (from model to full scale).
Within the frameworks of the ongoing R&D project PROPSCALE, the authors of the present paper conduct numerical investigation into the influence of Reynolds number on the open water characteristics of pod propulsors of different type. In the present paper, the results from this research are presented for one of the most widely used types of pod propulsion systems – a pulling pod propulsor Azipull. Based on thorough verification and validation studies, a practical setup for RANSE simulation of pod propulsor in open water is recommended. It is found sufficiently accurate for research analyses under variable scale factor and, at the same time, not excessively demanding for engineering calculations. Numerical simulations are performed in model scale and at two scale factors corresponding to full scale conditions, covering the whole range of propulsor operation, from near bollard to free sailing, and beyond the point of maximum efficiency. In addition, the influence of propeller pitch on propulsor characteristics under different scales is considered. Scale effects on propeller characteristics, pod resistance and propeller-pod interaction are discussed.
2 NUMERICAL SETUP AND ITS IMPLICATIONS
The generic Azipull unit whose configuration can be seen from the figures on the following pages is equipped with a 4-bladed controllable pitch propeller P1374, which has been used previously in many research projects at MARINTEK (Koushan and Krasilnikov, 2008). The propeller has blade area ratio of 0.60, balanced skew distribution with the maximum skew angle of 23 degrees, and hub ratio of 0.24.
The design pitch P(0.7)/D is 1.10, and the tip pitch factor P(1.0)/P(0.7) is 0.85. While having higher blade area ratio than typical pulling propeller designs, this propeller is representative of those as regards number of blades, pitch, skew and thickness distributions.
The platform for numerical analyses is the commercial program STAR-CCM+ by CD-Adapco, which is also the main CFD tool in the PROPSCALE project. The viscous, incompressible flow around propulsor is solved by the unsteady RANS equations, under the assumption of fully turbulent flow at all scales. In model scale conditions, the validity of the latter assumption may generally be argued, especially as regards the flow over propeller blades, and over the upper part of strut that operates outside of propeller slipstream. In the PROPSCALE project, a special test campaign has been carried out to study the influence of Reynolds number on propeller open water characteristics in model tests. This campaign included open water tests and paint tests with the propeller P1374 model, having the diameter of 0.25 [m] and run at varied RPS – 5, 9 and 15 [Hz]. It was found that, at the higher RPS values, the flow pattern on propeller blades is very close to fully turbulent flow. A fairly strong leading edge vortex observed at the leading edge of this propeller contributes to flow turbulization. The numerical analyses in model scale were performed at the highest RPS of 15 [Hz], where the assumption about fully turbulent flow holds well.
The SST k- turbulence model is used for turbulence closure. The blades and pod surfaces are treated as smooth in the CFD simulations. This assumption a priori makes full scale predictions too optimistic, as roughness effects contribute to the reduction of propeller thrust, on the one hand, and increase of propeller torque and pod resistance, on the other hand. In order to make a more realistic prognosis in full scale, roughness effects on propeller thrust and torque were estimated from the calculations by the MARINTEK panel method propeller analysis code AKPA, where roughness corrections to blade section lift and drag are introduced proportional to the change of the flat plate skin friction coefficient in turbulent flow over a rough surface compared to a smooth surface. This procedure employs the same skin friction formula for flat plate with roughness as recommended in the ITTC'78 Extrapolation Procedure, while the algorithm of lift and drag correction in the propeller code is detailed in (Krasilnikov et al, 2006). As regards pod resistance, roughness corrections are introduced only in the drag, by applying directly the skin friction formula for flat plate with roughness. The roughness height of kP=3010-6 is used in the estimations.
The cylindrical computation domain is divided into the two regions – the stationary region of Outer Fluid and rotating Propeller Block, as shown in Figure 1.

Figure 1: The regions Outer Fluid and Propeller Block in the computation domain.
The Propeller Block region participates in rotational motion with respect to the Outer Fluid region with the rotational speed corresponding to propeller RPS. The interaction between the fluid regions is resolved using the interface Sliding Mesh method. It has been found that a steady-state solution by the Moving Reference Frame (MRF) method applied in the Propeller Block offers satisfactory prognosis of propeller characteristics, but it appears insufficient for the prediction of pod resistance, which depends strongly on the unsteady interaction between pod and propeller slipstream. The unsteady Sliding Mesh solution requires appropriate time step. In the course of the studies the influence of time step, number of inner iterations with respect to solution residuals and temporal discretization scheme were investigated. The time step was varied as corresponding to 1, 2 and 3 degrees of propeller revolution, while 5 and 10 inner iterations were used, showing nearly identical results for propeller thrust and torque, and very close results for pod resistance. These conclusions remain valid for the whole range propeller loading conditions. Since the interaction between vortex sheets from propeller blades and strut, and unsteady separation phenomena are expected to have considerable impact on pod resistance, it is prudent to keep the time step sufficiently small, so that t2 [deg] with 5 inner iterations appears a reasonable compromise between calculation accuracy and speed.
Polyhedral Mesh is employed in the Propeller Block, while hexahedral Trimmed Mesh is used in the region of Outer Fluid. In open water simulation setup, an efficient solution to provide sufficient domain extent toward Inlet and Outlet boundaries without large increase in cell count can be achieved by using the prismatic Extruder Mesh.
Sensitivity studies were conducted focusing on the size of Propeller Block and position of its downstream interface. The numerical solution shows little sensitivity to a reasonably chosen size of Propeller Block (cylinder having radius 1.2D and height 0.4D was used in this work),
provided that its downstream and outward sliding interfaces are placed not too close to the blade trailing edges, where trailing vortices detach from the blades, and not too close to the strut, where these vortices come in contact with strut and are deviated and destroyed, at heaving loadings rather violently. Since the numerical setup used in the present work included gap between the propeller hub and pod, it was also important to check the implications of placing the downstream interface in the vicinity of the gap. Test calculations were performed with the interface placed on the hub (upstream of the gap), on the pod (downstream of the gap) and directly in the gap. The numerical solution was found fairly insensitive to the position of the interface, which was an encouraging result, showing that the solver was capable of handling consistently the zones of local flow separation found upstream of the gap and at the outer gap boundary, as illustrated in Figure 2. The upstream zone is associated with the passage of the trailing vortices from blade roots.
Figure 2: Flow in the vicinity of hub-pod gap.
The inclusion of hub-pod gap is important for adequate prediction of both the pod resistance and propeller thrust. Calculations done without gap, when the downstream interface of the Propeller Block simply splits the pod/hub surface into the two boundaries, result in under-prediction of pod resistance and do not reproduced experimentally observed trends in its dependence on propeller loading. The error is caused by uncertainty in the definition of gauge pressure on the open part of the pod surface. Unless flow details in the gap are of interest, a very fine mesh is not required. It is however crucial to have the gap present to ensure physically correct flow picture and adequate pressure values over closed surfaces of the pod and hub. In the present model scale simulations, the gap size was adopted equal to 1.25 [mm], similar to practices of model tests. In full scale simulations, the gap size was simply scaled from that value, according to the scale factor.
The overall mesh fineness in the STAR-CCM+ Meshing model is governed by the Base Size. In the present work it is set equal to propeller diameter, D. The Target and

Minimum surface and volume sizes are set up as relative to the Base Size. For propeller blade, the target size is set to 0.5% of base, and minimum size is set to 0.25% of base. Additional mesh refinement near the leading edge can be achieved by applying the target size of 0.125% to the feature curve that describes leading edge. On the blade tip and blade trailing edge, which are present as separate boundaries, the equal values of the target and minimum size as 0.25% of base are applied. On the propeller hub, a coarser mesh can be used, except the vicinity of the gap. The target and minimum surface size values for the pod are set to 0.5% and 0.25%, respectively. If additional refinement in the gap area is needed, it can easily be achieved by using a cylindrical volumetric control around the gap.
The boundary layer mesh consists of 10 prismatic layers on all boundaries. The total thickness of the boundary layer is 0.5% of the Base Size on the pod and 0.25% of the Base Size on propeller blades and hub. The prism layer stretching factor is 1.4. Such settings allow for the values of wall y+ to be in the range from 0 to 5 in model scale simulations (with propeller model diameter 0.2-0.25 [m]). When performing full scale simulations on the same geometry, one can simply scale the geometry parts (domain, bodies and volumetric controls) used in the setup, according to the scale factor, change the Base Size, and re-build the mesh with the same settings. It has to be noted that this approach is not the same as simple "mesh scaling". It results in wall y+ values to be in the range from 20 to 80, for the full scale factor 10, and in the range from 40 to 180, for the full scale factor 20. The examples of boundary layer mesh around propeller blades, in the vicinity of hub-pod gap and at the rear part of the pod are shown in Figures 3 to 5.
In the present work, systematic global and local mesh refinement studies have been performed, and the final mesh, as described above, is the result of these studies, taking into account the aspects of both the accuracy and computation cost. The mesh contains 1.75 million cells in the Propeller Block and 5.6 million cells in the Outer Fluid region.
Figure 3: Boundary layer mesh around propeller blades.
Figure 4: Mesh details in the hub-pod gap area.
Figure 5: Mesh details at the rear part of the pod.
3 COMPARISONS WITH EXPERIMENTAL DATA IN MODEL SCALE
Comparisons with experimental data were performed for the studied propeller operating as a single propeller on the shaft, and as pulling propeller with the Azipull unit. In all cases propeller diameter was 0.25 [m] and propeller RPS was 15 [Hz], as in model tests. The corresponding propeller Reynolds number defined for the blade section 0.7R varied in the range (0.70.8)106. The Reynolds number for the part of the pod immersed in propeller slipstream, which is based on the averaged axial velocity in propeller slipstream, was in the range (1.271.35)106 (estimation is given for propeller pitch ratio P/D=1.1). The Reynold number for the upper part of strut outside of propeller slipstream, which is based on the speed of inflow, varied greatly with speed, reaching maximum 106 at the highest J. The results for single propeller at the two pitch settings P/D=1.1 and 0.9 are presented in Figures 6 and 7, showing propeller thrust and torque coefficients and propeller efficiency. The results for podded propeller are presented in Figure 8, showing total thrust, propeller torque and total propulsor efficiency.

Figure 6: Comparison of calculated and measured open water characteristics of the single propeller at P/D=1.1.
Figure 7: Comparison of calculated and measured open water characteristics of the single propeller at P/D=0.9.
Figure 8: Comparison of calculated and measured open water characteristics of the podded propeller at P/D=1.1.
Figure 9: Comparison of calculated pod resistance with experimental data.
Figure 10: Comparison of calculated fraction of pod resistance in total thrust with experimental data.
For the single propeller, a good prediction of propeller characteristics is observed around free-sailing operation range for both pitch settings. For the higher pitch 1.1, calculations show over-prediction of blade loads compared to model test data from the towing tank. One reason for this result may be related to the influence of the leading edge vortex of considerable strength detected in both the calculations and paint tests. This vortex results in intensive flow separation at the leading edge under heavy loading conditions. At the same time, the results from model tests in the cavitation tunnel conducted at a higher RPS of 20 [Hz] match calculation results at low J values very well.
For the pulling podded propeller, one can also observe a very good agreement between experiment and calculation at free-sailing conditions. The computed propulsor efficiency is slightly over-predicted at advance coefficients J 0.9, which is mainly due to lower pod resistance predicted by the calculations. In Figure 9 the pod resistance coefficient KTG (same non-dimensional form as propeller thrust,

TG/n2D4) obtained from calculations is compared with the value derived from model test as the difference between the measured total thrust and propeller thrust, KTTOT-KTP. It can be noticed that the slope of the KTG curve derived from the experiment is quite different from the curve obtained in the calculation. At higher speeds, higher resistance is predicted from experiment, whereas at lower speeds it is lower than computed values. While the influence of gap on the measured propeller thrust cannot be entirely disregarded, the probable reason for this difference is related to low-Re flow over the upper part of the strut, which operates outside of propeller slipstream. The upper part of the studied pod is a quite full body whose thickness increases rapidly toward the headbox. It is expected to give considerable contribution in pod resistance. Since no turbulence stimulators were installed on the pod during the tests, at low speeds it operates in almost laminar flow, without separation, directed upwards by the action of propeller slipstream interacting with the strut (see Figure 17), and experiences lower drag. At high speeds, the flow is presumably transient, following primarily the direction of the main axial flow. From Figure 19 it can be seen that intensive separation develops at the upper part of the strut, especially on its downwind side with respect to swirled propeller slipstream. In the transient flow as in the tests, separation will start earlier upstream than in fully turbulent flow enforced in the CFD model, which will result in higher pod resistance. For comparison, in the same Figure 9 the experimental data from the test with the same pod unit equipped with another propeller, operating at the same pitch, are plotted. In spite of even lower Reynolds number, the experimental values of pod resistance from this test match very well with the present calculation. While it could not be verified, turbulence stimulation was presumably used in the latter test. When comparing resistance of pod units tested in different scales, it is not very strict to work in terms of dimensionless characteristics KTG and J. A more adequate comparison can be made in terms of the fraction of pod resistance in total thrust of the unit, KTG/KTTOT, plotted against propeller loading coefficient CTH=(8/)(KTP/J2), as presented in Figure 10. This comparison confirms the trends in KTG as discussed above, and it shows that calculations reproduce the dependence of KTG on propeller loading very accurately. In view of the above results, the use of turbulence stimulation in the upper part of the strut during model tests appears very important.
4 SCALE EFFECT ON PROPELLER CHARACTERISTICS
In the studies on scale effect, full scale CFD calculations were performed for the units with scale factors 10 and 20. Propeller RPS was scaled according to the Froude number identity, resulting in n=4.7434 [Hz] for FS10, and n=3.3541 [Hz] for FS20. The following ranges of propeller Reynolds
number were provided: (2.22.6)107for FS10, and (6.37.3)107 for FS20. The respective ranges of Reynolds number for the part of pod immersed in propeller slipstream were as follows: (0.280.30)108for FS10, and (1.141.2)108 for FS20 (estimations are given for pitch setting P/D=1.1). Similar to model scale conditions, calculations were performed for the case of single propeller operating on shaft and for the case of pulling propeller. The three propeller pitch settings were considered, including P/D=0.9, 1.1 and 1.3. The results in terms of relative changes in propeller thrust and torque coefficients from model scale to FS20 are reduced in Figures 11 and 12. At FS10, the respective increments of propeller thrust were only marginally smaller than at FS20, while propeller torque was exactly at the same level as for FS20, since at both scale factors propeller operates in the range where section lift and drag show little dependence on Reynolds number. It can be seen that the relative increase of propeller thrust in full scale depends on propeller loading, rapidly becoming larger at lighter loadings. At the same thrust loading coefficient, the increase of propeller thrust in full scale is larger for the single propeller than for the pulling propeller, and it is larger for lower pitch settings than for higher pitch settings. The changes in propeller torque are much smaller and less dependent on propeller loading. For the pulling propeller, torque changes very little from model scale to full scale. In order to explain physical mechanisms behind the observed trends, the variations of pressure and friction components of thrust and torque with Reynolds number were examined. Table 1 presents these variations for the pulling propeller at P/D=1.1 at a number of loading conditions. The contributions from blade thrust are presented as the pressure and friction components, while for hub thrust only the pressure component is given, since its friction component is negligible.
Figure 11: Relative changes in propeller thrust from model scale to full scale (FS20). Smooth blades.

Figure 12: Relative changes in propeller torque from model scale to full scale (FS20). Smooth blades.
Table 1: Scale effects on pressure and friction components of propeller thrust and torque for pulling propeller at different loading conditions (P/D=1.1).
Thrust components
J KTB(P) KTB
(F) KTB KTH KTP KTP,%
0.1 0.01018 0.00132 0.0115 0.0002 0.0117 1.94
0.7 0.0091 0.00163 0.01073 0.00215 0.01288 4.19
1.1 0.00707 0.00183 0.0089 0.0045 0.0134 14.89
Torque components
J KQB(P) KQB
(F) KQB KQH KQP KQP,%
0.1 0.00129 -0.00118 0.00011 -0.00001 1E-04 0.11
0.7 0.00164 -0.00143 0.00021 0.00001 0.00022 0.38
1.1 0.00132 -0.00145 -0.00013 0.00002 -0.00011 -0.43
*) (P) – Pressure, (F) – Friction, B – blade force, H – Hub force, P – propeller force.
Table 2: Scale effects on pressure and friction components of propeller thrust and torque for single propeller and pulling propeller at equivalent loading condition (P/D=1.1, CTH1.53).
Thrust components
KTB(P) KTB
(F) KTB KTH KTP KTP,%
Single 0.0125 0.00166 0.01416 0.00025 0.01441 5.13
Pulling 0.0091 0.00163 0.01073 0.00215 0.01288 4.19
Torque components
KQB(P) KQB
(F) KQB KQH KQP KQP,%
Single 0.00216 -0.00146 0.0007 0.0001 0.0008 1.55
Pulling 0.00164 -0.00143 0.00021 0.00001 0.00022 0.38
*) (P) – Pressure, (F) – Friction, B – blade force, H – Hub force, P – propeller force.
One can notice that scale related changes of both the pressure and friction components of blade thrust depend on loading. While the friction component decreases with loading, then the pressure component increases. It is the pressure component that gives major contribution to blade thrust. For the pulling propeller, hub gives significant contribution to the variation of thrust with scale, which increases as loading becoming lighter. When combined, these contributions result in a larger increment of thrust at lighter loadings. For the torque of pulling propeller, the changes in pressure and friction components with scale compensate each other to a large degree at all loadings. The contribution of propeller hub in torque is very small. Hence, propeller torque shows little dependency on both the scale and loading.
Table 2 compares the same components for the pulling propeller and single propeller at the condition of equal loading, corresponding to the operation point J=0.7 of the pulling propeller. From these results it can be concluded that changes in the friction component of blade thrust and torque are comparable for the pulling and single propeller, while the pressure component shows a greater increase for the single propeller. The analysis of pressure distributions on propeller blades reveals that smaller change in KTB
(P) of the pulling propeller comes from the blades operating around the position where their wakes interfere with the strut. This interference results in higher pressure values on both the suction and pressure sides of the blade, and smaller pressure difference across the blade, in the region downstream of the mid-chord location. In that region, the scale related changes in pressure distribution are smaller for the pulling propeller than they are for the single one. This difference becomes more pronounced as propeller loading gets lighter. If not the increase in hub thrust of the pulling propeller, the difference between the thrust changes for pulling and single propellers would be even larger. The hub thrust of the pulling propeller increases in full scale due to a higher pressure built on the side of the hub facing the hub/pod gap. The size of the gap may have influence on this increase, which will influence scale effect on the thrust of pulling propellers. The difference in the magnitude of thrust and torque changes for propellers operating at the same thrust loading, but at different pitch settings, gives one an indication that scale effects are dependent on loading distribution along the blade radius which, in a broader picture, also makes them blade geometry specific.
The estimations of blade surface roughness on the magnitude of scale effect on propeller thrust and torque were based on the calculation by the propeller panel method code AKPA including roughness corrections to blade section lift and drag. The results of these estimations are presented in Figures 13 and 14. Comparing these results with those presented in Figures 11 and 12 for smooth blades, one can conclude that the influence of roughness reduces the relative increase of thrust in full scale for about 50% compared to smooth blades.

Figure 13: Relative changes in thrust of pulling propeller from model scale to full scale (FS20). Blades with roughness in full scale.
Figure 14: Relative changes in torque of pulling propeller from model scale to full scale (FS20). Blades with roughness in full scale.
Propeller torque in full scale increases due to roughness, most considerably at the conditions of lighter propeller loading. These changes will result in much smaller increase of propeller efficiency in full scale than it is predicted for smooth blades.
5 SCALE EFFECT ON POD RESISTANCE
The computed values of pod resistance coefficient KTG are presented in Figure 15, for model scale and full scale conditions, and for the three studied pitch settings of propeller, as a function of propeller thrust loading coefficients. A number of observations can be made. The pod resistance depends on pitch setting of propeller. In model scale, the resistance is larger for higher pitches at all loadings. In full scale, the above statement remains true for lighter loadings, but at heavier loadings, the highest
Figure 15: Computed pod resistance in model scale and full scale conditions. Smooth pod surface.
Figure 16: Pod resistance scaling factor for different propeller pitch settings. Smooth pod surface.
propeller pitch allows for the lowest pod resistance. When analysing these results, it should be remembered that pod resistance includes contributions from both the drag forces and lift forces acting on the pod. The lift forces, mainly produced by the strut and bottom fin, depend on local angles of attack defined by the tangential velocity component (swirl) in propeller slipstream. They give especially large contribution to the reduction of pod resistance at low speeds (heavy loading), as their axial projections act in the direction of propeller thrust. For propellers operating at the same thrust loading coefficient, the swirl-induced angles of attack will be larger at higher propeller pitches, which will result in higher lift forces produced by the strut and fin, and hence larger reduction of resistance. This effect is already noticed in model scale, but at low Reynolds numbers the lift is reduced by intensive flow separation on the bottom fin (see Figure 17). In full scale, where separation on the fin is largely eliminated and limited only to the region of the aft pod end, the lift forces produced by the fin and strut result in strong reduction of

pod drag. In the range of moderate loadings, the resistance component due to lift becomes smaller, while the drag component increases. Here the reduction of resistance in full scale is primarily caused by the reduction of flow separation at the rear part of the pod, along the strut trailing edge and downstream part of the fin, on the upwind side of the pod (see Figure 18). Separation on the upper side of the strut, operating outside of propeller slipstream begins to play its role in resistance. In this range, the resistance reduction in full scale is smallest. At light loading operation, the drag forces give major contribution in resistance. In model scale, separation of large extent is found along the whole rear end of the pod, on both the upwind and downwind sides, and especially large separation domain is found on the upper part of strut, on the downwind side (see Figure 19). These separation domains are reduced in full scale, resulting again in a larger reduction of pod resistance. In this range, the reduction of resistance with scale is much less dependent on propeller pitch, since its lift component is relatively small.
a) Model scale
b) Full scale
Figure 17: Pressure distribution and constrained streamlines on the pod in model scale and full scale. P/D=1.1, J=0.1 (CTH=154). Upwind side.
The aforementioned findings are reflected in the chart showing pod resistance scaling factor TG, according to Eq.(1), as presented in Figure 16. Figure 20 presents the visualization of flow separation domains on the pod in model scale that have largest impact on the magnitude of scale effect. Separation domains are identified as the zones of increased vorticity magnitude, using volume rendering technique of STAR-CCM+.
The relative changes of pod resistance with scale can also be assessed in terms of its fraction in total thrust as presented in Figure 21. These changes are most significant (2030% for smooth pod surface) in the range of light loading operation, where resistance contribution in total thrust is also largest. With the introduction of roughness corrections into drag forces, according to the flat plate skin friction formula, the respective scaling factor for pod resistance is reduced, as can be seen from Figure 22.
a) Model scale
b) Full scale
Figure 18: Pressure distribution and constrained streamlines on the pod in model scale and full scale. P/D=1.1, J=0.7 (CTH=1.63). Upwind side.

6 SCALE EFFECT ON PROPELLER – POD INTERACTION
In integral sense, the interaction between propeller and pod can be described using the characteristics analogous to propulsion factors derived from self-propulsion tests – axial wake fraction (WTPOD) and relative rotative efficiency (RPOD). Employing thrust identity for the open water characteristics of single propeller and podded propeller, one can estimate the aforementioned factors in model and full scale, as shown in Figures 23 and 24. The pod/propeller axial wake fraction WTPOD increases with propeller loading. In full scale conditions, this quantity is slightly lower than in model scale, while its scale related changes are larger for propellers operating at higher pitch setting. The effect of interaction on torque shows trends opposite to those of WTPOD. The factor RPOD is higher for lighter loadings, and it increases in full scale compared to model scale. The scale related increase of RPOD is larger for propellers operating at lower pitch settings. It should however be mentioned that by no means such integral factors can fully characterize complex interaction phenomena taking place between the propeller and pod.
a) Model scale
b) Full scale
Figure 19: Pressure distribution and constrained streamlines on the pod in model scale and full scale. P/D=1.1, J=1.1 (CTH=0.22). Downwind side.
a) P/D=1.1, J=0.1 (CTH=154). Upwind side.
b) P/D=1.1, J=0.7 (CTH=1.63). Upwind side.
c) P/D=1.1, J=1.1 (CTH=0.22). Downwind side.
Figure 20: Visualization of flow separation domains on the pod in model scale that have largest impact on the magnitude of scale effect on pod resistance at different loading conditions.
Unsteady interaction of blade vortex sheets with strut and fin plays decisive role in the development of separation domains on these pod components, and it also affects vorticity production in the regions of their junction with the gondola. Over one propeller revolution, propeller thrust and torque, and especially pod resistance, experience oscillations whose amplitudes increase with increasing propeller loading.
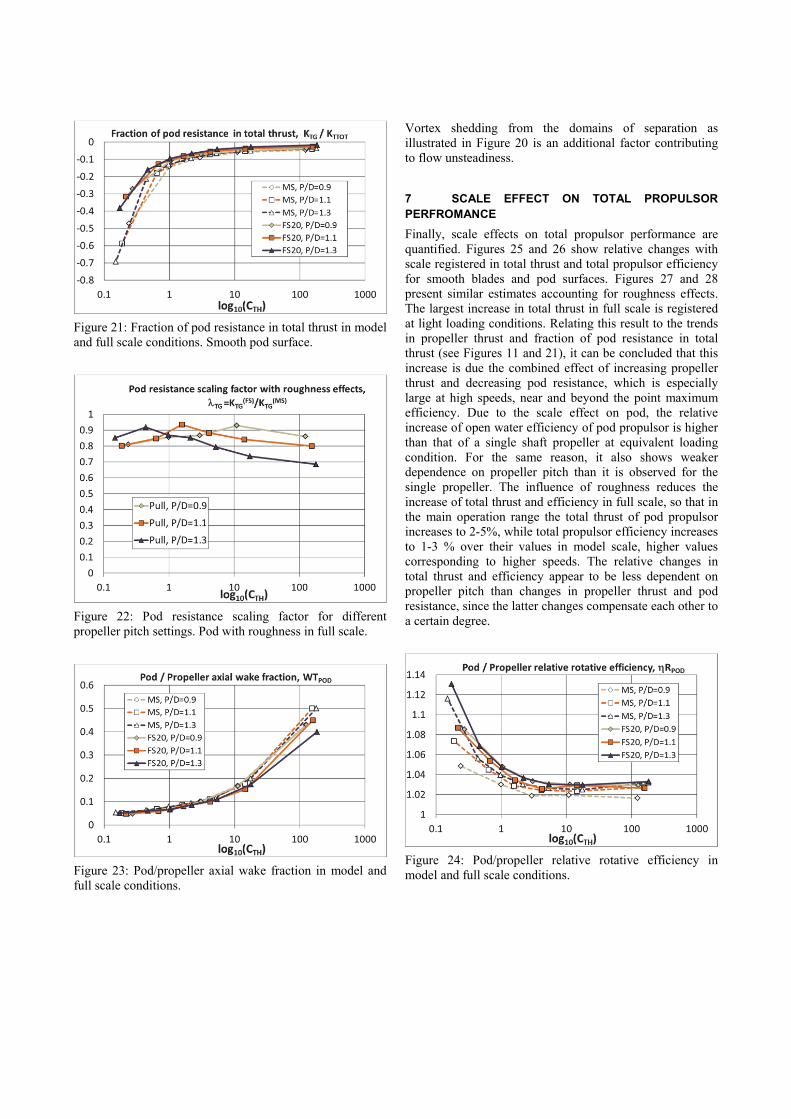
Figure 21: Fraction of pod resistance in total thrust in model and full scale conditions. Smooth pod surface.
Figure 22: Pod resistance scaling factor for different propeller pitch settings. Pod with roughness in full scale.
Figure 23: Pod/propeller axial wake fraction in model and full scale conditions.
Vortex shedding from the domains of separation as illustrated in Figure 20 is an additional factor contributing to flow unsteadiness.
7 SCALE EFFECT ON TOTAL PROPULSOR PERFROMANCE
Finally, scale effects on total propulsor performance are quantified. Figures 25 and 26 show relative changes with scale registered in total thrust and total propulsor efficiency for smooth blades and pod surfaces. Figures 27 and 28 present similar estimates accounting for roughness effects. The largest increase in total thrust in full scale is registered at light loading conditions. Relating this result to the trends in propeller thrust and fraction of pod resistance in total thrust (see Figures 11 and 21), it can be concluded that this increase is due the combined effect of increasing propeller thrust and decreasing pod resistance, which is especially large at high speeds, near and beyond the point maximum efficiency. Due to the scale effect on pod, the relative increase of open water efficiency of pod propulsor is higher than that of a single shaft propeller at equivalent loading condition. For the same reason, it also shows weaker dependence on propeller pitch than it is observed for the single propeller. The influence of roughness reduces the increase of total thrust and efficiency in full scale, so that in the main operation range the total thrust of pod propulsor increases to 2-5%, while total propulsor efficiency increases to 1-3 % over their values in model scale, higher values corresponding to higher speeds. The relative changes in total thrust and efficiency appear to be less dependent on propeller pitch than changes in propeller thrust and pod resistance, since the latter changes compensate each other to a certain degree.
Figure 24: Pod/propeller relative rotative efficiency in model and full scale conditions.

Figure 25: Relative changes in total propulsor thrust from model scale to full scale (FS20). Smooth blades and pod surfaces.
Figure 26: Relative changes in propulsor efficiency from model scale to full scale (FS20). Smooth blades and pod surfaces.
Figure 27: Relative changes in total propulsor thrust from model scale to full scale (FS20). Blades and pod surfaces with roughness in full scale.
Figure 28: Relative changes in propulsor efficiency from model scale to full scale (FS20). Blades and pod surfaces with roughness in full scale.
8 CONCLUSIONS
The present paper offers a detailed CFD-based analysis of the influence of Reynolds number on the open water characteristics of a pulling pod propuslor commonly known as Azipull. In model scale conditions, the numerical results are validated against experimental data, showing good accuracy for both the single propeller and podded propeller. Comparisons of pod resistance between calculations and experiments confirm the necessity of additional turbulence stimulation in model tests on the part of pod strut operating outside of propeller slipstream.
As regards scale effects, the main conclusions are as follows.
The effects of Reynolds number on thrust and torque of the pulling propeller are smaller than for the single shaft propeller. The interaction of propeller blades with pod strut, resulting in smaller increase in the pressure component in full scale is responsible for this result. It is the pressure component that gives major contribution to the scale related changes in thrust, making it also loading dependent. The changes in pressure and friction components of propeller torque compensate each other, to a large degree, at all loadings, so that torque of smooth propeller blades does not vary significantly with scale. At equal thrust loading coefficient, the magnitude of propeller thrust increment in full scale is larger at lower pitch settings, which gives an indication that scale effects depend on loading distribution along the blade radius.
The effect of Reynolds number on pod resistance reveals dependence on both the propeller loading conditions and propeller pitch setting. At low speeds (heavy loading), the major contribution to scale effect comes from the increase of lift forces acting on the strut and bottom fin. Larger lift forces are produced by propeller slipstream at higher pitch

setting due to larger angles of attack on strut and fin. Reduction of separation on the fin is the primary factor, resulting in increase of lift and reduction of pod resistance in full scale. At moderate speeds, scale effects on pod resistance are less pronounced, and they are related to the reduction of flow separation along the downstream end of the strut, gondola and fin. At high speeds (light loading), where drag mostly determines pod resistance, scale effects become larger again. The major decrease of drag in full scale comes from the reduction of large separation domain on the upper part of the strut that operates outside of propeller slipstream, on the downwind side of the pod.
While the integral propeller/pod interaction factors do not vary significantly with scale, unsteady interaction between blade vortex sheets with strut and fin plays decisive role in the development of separation domains on these pod components, and it affects vorticity production in the regions of their junction with the gondola. These unsteady interactions have direct impact on the magnitude of scale effect on pod resistance.
The influence of roughness appears important for the realistic prognosis of propulsor performance in full scale. A simplified approach used in the present work to account for roughness effects can be used for practical estimations. However, more detailed studies are needed, which necessitates the inclusion of roughness effects in CFD calculations.
With roughness effects included, calculations show that, in the main operation range, the total thrust of pod propulsor increases to 2-5%, while total propulsor efficiency increases to 1-3 % over their values in model scale, higher values corresponding to higher speeds. The relative changes in total thrust and efficiency appear to be less dependent on propeller pitch than changes in propeller thrust and pod resistance, since the latter changes are counteracting.
ACKNOWLEDGEMENT
The work presented here has been conducted within the frameworks of the ongoing Competence Building Project PROPSCALE coordinated by MARINTEK (Norway) with support from the Research Council of Norway. The consortium members include: MARINTEK (Norway), Norwegian University of Science and Technology (Norway), Aalesund University College (Norway), Hamburg Technical University (Germany), China Ship Scientific Research Center (China), Havyard Group AS (Norway), Rolls-Royce Marine AS (Norway), Scana Volda AS (Norway), VARD Design (Norway) and CD-Adapco.
REFERENCES
[1] Chicherin, I.A., Lobatchev, M.P, Poustoshny, A.V. and Sanchez-Caja, A. (2004), "On a Propulsion Prediction Procedure for Ships with Podded Propusors Using RANS-Code Analysis," Proceedings of the 1st T-POD Conference, University of Newcastle, UK.
[2] Choi, J-K., Park, H-G. and Kim, H-T. (2014), "A Numerical Study of Scale Effects on Performance of a tractor Type Podded Propeller," Int. Journal of Naval Architecture and Ocean Engineering, 2014(6):380-391.
[3] Holtrop, J. (2001), "Extrapolation of Propulsion Tests for Ships with Appendages and Complex Propulsors," Marine Technology, 38 (3).
[4] ITTC (2008), "ITTC – Recommended Procedures and Guidelines 7.5 – 02, 03 – 01.3, Propulsion, Performance, Podded Propulsion Tests and Extrapolation", Effective date 2008, Revision 00.
[5] Koushan, K. and Krasilnikov, V.I. (2008), "Experimental and Numerical Investigation of Open Thrusters in Oblique Flow Conditions," Proceedings of the 27th ONR Symposium on Naval Hydrodynamics, October 5-10, Seoul, Korea. [6] Krasilnikov, V.I., Achkinadze, A.S., Ponkratov, D.V. and Sun, J. (2007), "Prediction of Open Water Characteristics of Podded Propulsors Using a Coupled Viscous/Potential Solver," Proceedings of the 9th International Conference on Fast Sea Transportation FAST’2007, Shanghai, China, September, 2007.
[7] Krasilnikov, V.I., Ponkratov, D.V., Achkinadze, A.S., Berg, A. and Sun J. (2006), "Possibilities of a Viscous/Potential Coupled Method to Study Scale Effects on Open-Water Characteristics of Podded Propulsors," Proceedings of the 2nd T-POD Conference, L’aber Wrac’h, France. [8] Mewis, F. and Praefke, E. (2003), "A Method for Scale Effect Corrections on Pod Propulsor Open Water Chracteristics from Model to Full Scale," Jahrbuch der Schiffbautechnischen Gesellschaft, 97, Band 2003, Springer Verlag, Berlin Heidelberg, New York.
[9] Sasaki, N., Laapio, J., Fagerstrom, B, Juurma, K and Wilkman, G. (2004), "Full Scale Perfromance of Double Acting Tankers Mastera & Tempera, Proceedings of the 1st T-POD Conference, University of Newcastle, UK.