investigation into freezing-thawing durability of … into freezing-thawing durability of...
TRANSCRIPT

Investigation into Freezing-Thawing Durability of Low-Permeability Concrete with and without Air Entraining Agent
Final ReportJune 2009
Sponsored byIowa Concrete Paving AssociationIowa Department of Transportation

About the CP Tech Center
The mission of the National Concrete Pavement Technology Center is to unite key transportation stakeholders around the central goal of advancing concrete pavement technology through research, tech transfer, and technology implementation.
Disclaimer Notice
The contents of this report reflect the views of the authors, who are responsible for the facts and the accuracy of the information presented herein. The opinions, findings and conclusions expressed in this publication are those of the authors and not necessarily those of the sponsors.
The sponsors assume no liability for the contents or use of the information contained in this document. This report does not constitute a standard, specification, or regulation.
The sponsors do not endorse products or manufacturers. Trademarks or manufacturers’ names appear in this report only because they are considered essential to the objective of the document.
Non-discrimination Statement
Iowa State University does not discriminate on the basis of race, color, age, religion, national origin, sexual orientation, gender identity, sex, marital status, disability, or status as a U.S. veteran. Inquiries can be directed to the Director of Equal Opportunity and Diversity, (515) 294-7612.
Iowa Department of Transportation Statements
Federal and state laws prohibit employment and/or public accommodation discrimination on the basis of age, color, creed, disability, gender identity, national origin, pregnancy, race, religion, sex, sexual orientation or veteran’s status. If you believe you have been discriminated against, please contact the Iowa Civil Rights Commission at 800-457-4416 or Iowa Department of Transportation’s affirmative action officer. If you need accommodations because of a disability to access the Iowa Department of Transportation’s services, contact the agency’s affirmative action officer at 800-262-0003.
The preparation of this document was financed in part through funds provided by the Iowa Department of Transportation through its “Agreement for the Management of Research Conducted by Iowa State University for the Iowa Department of Transportation,” and its amendments.
The opinions, findings, and conclusions expressed in this publication are those of the authors and not necessarily those of the Iowa Department of Transportation.

Technical Report Documentation Page
1. Report No. 2. Government Accession No. 3. Recipient’s Catalog No.
4. Title and Subtitle 5. Report Date Investigation into Freezing-Thawing Durability of Low-Permeability Concrete with and without Air Entraining Agent
June 2009 6. Performing Organization Code
7. Author(s) 8. Performing Organization Report No. Kejin Wang, Gilson Lomboy, Robert Steffes 9. Performing Organization Name and Address 10. Work Unit No. (TRAIS) National Concrete Pavement Technology Center Iowa State University 2711 South Loop Drive, Suite 4700 Ames, IA 50010-8664
11. Contract or Grant No.
12. Sponsoring Organization Name and Address 13. Type of Report and Period Covered Iowa Concrete Paving Association 360 S.E. Delaware Avenue Ankeny, Iowa 50021
Iowa Department of Transportation 800 Lincoln Way Ames, IA 50010
Final Report 14. Sponsoring Agency Code
15. Supplementary Notes Visit www.cptechcenter.org for color PDF files of this and other research reports. 16. Abstract The aim of the present study is to investigate the effect of low-permeability concrete, made with reduced water‐to‐binder ratios (w/b) and/or supplementary cementitious materials (SCMs), on the need for air entrainment to achieve freezing‐thawing (F‐T) durability.
In the present study, concrete mixes were made with different types of cement (Types I and IP), with or without fly ash replacement (15%), with different water‐to‐binder ratios (w/b =0.25, 0.35, 0.45 and 0.55), and with or without air entraining agent (AEA). All concrete mixtures were controlled to have a similar slump by using different dosages of superplasticizer. The rapid chloride permeability and F-T durability of the concrete samples were determined according to ASTM C1202 and ASTM C666A, respectively. The air void structure of the concrete was studied using the Air Void Analyzer, RapidAir, and porosity tests (ASTM C642). In addition, the general concrete properties, such as slump, air content, unit weight, and 28‐day compressive strength, were evaluate d.
The results indicate that all concrete mixes with proper air entrainment (ASTM C231 air content ≥ 6%) showed good F‐T resistance (durability factor ≥85%). All concrete mixes without AEA showed poor F‐T resistance (durability factor < 40%), except for one mix that had very low permeability and high strength. This was the concrete made with Type IP cement and with a w/b of 0.25, which had a permeability of 520 coulombs and a compressive strength of 12,760 psi (88 MPa). There were clear relationships between the F‐T durability and hardened concrete properties of non–air entrained concrete. However, such relationships did not exist in concrete with AEA. For concrete with AEA, good F‐T durability was associated with an air void spacing factor ≤ 0.28 mm (by AVA) or ≤ 0.22 mm (by RapidAir).
17. Key Words 18. Distribution Statement air entrainment—freeze-thaw durability—rapid chloride ion permeability No restrictions. 19. Security Classification (of this report)
20. Security Classification (of this page)
21. No. of Pages 22. Price
Unclassified. Unclassified. 48 NA
Form DOT F 1700.7 (8-72) Reproduction of completed page authorized


INVESTIGATION INTO FREEZING-THAWING DURABILITY OF LOW PERMEABILITY CONCRETE WITH AND WITHOUT AIR
ENTRAINING AGENT
Final Report June 2009
Principal Investigator Kejin Wang
Associate Professor Department of Civil, Construction, and Environmental Engineering, Iowa State University
Co-Principal Investigator
Robert Steffes PCC Research Engineer
Institute for Transportation, Iowa State University
Research Assistant Gilson Lomboy
Authors
Kejin Wang, Gilson Lomboy, Robert Steffes
Sponsored by the Iowa Concrete Paving Association
and the Iowa Department of Transportation
A report from National Concrete Pavement Technology Center
Institute for Transportation Iowa State University
2711 South Loop Drive, Suite 4700 Ames, IA 50010-8664 Phone: 515-294-8103 Fax: 515-294-0467
www.cptechcenter.org


v
TABLE OF CONTENTS
ACKNOWLEDGMENTS ............................................................................................................ IX
1. INTRODUCTION .......................................................................................................................1
1.1 Background ....................................................................................................................1 1.2 Problem Statement .........................................................................................................2 1.3 Research Objectives .......................................................................................................2
2. MATERIALS AND METHODS .................................................................................................3
2.1 Materials ........................................................................................................................3 2.2 Methods..........................................................................................................................5
3. TEST RESULTS ..........................................................................................................................7
3.1 Fresh Concrete Properties ..............................................................................................7 3.2 Hardened Concrete Properties .....................................................................................10
4. DATA ANALYSIS ....................................................................................................................16
4.1 Relationship between Air Void Parameters .................................................................16 4.2 Relationship between Hardened Concrete Properties ..................................................19 4.3 Effects of Low-Permeability Concrete on F-T Durability ...........................................21 4.4 Effects of w/b and Strength on F-T- Durability ...........................................................23 4.5 Effects of Cement Type on the Effectiveness of Air Entrainment ..............................25 4.6 Interaction between Cementitious Materials and AEA ...............................................27 4.7 Effect of Air Void Structure on F-T Durability ...........................................................27
5. CONCLUSIONS........................................................................................................................31
6. RECOMMENDATIONS ...........................................................................................................32
7. REFERENCES ..........................................................................................................................33
APPENDIX A. IMAGES OF BEAM SAMPLES AFTER F-T TEST ....................................... A-1


vii
LIST OF FIGURES
Figure 2.1. Fine and coarse aggregate gradations ............................................................................3 Figure 3.1. Cumulative air content by void size for mixtures, measured by AVA .......................10 Figure 3.2. Cumulative air content by void size for mixtures, measured by RapidAir .................13 Figure 3.3. RDM for concrete with and without AEA ..................................................................14 Figure 4.1. Relationships between air void parameters measured by AVA ..................................16 Figure 4.2. Relationships between air void parameters measured by Rapid Air ...........................17 Figure 4.3. Relationships between RapidAir and AVA measurements .........................................18 Figure 4.4. Correlation of results from RapidAir and AVA with ASTM C231 ............................19 Figure 4.5. Relationship between hardened concrete properties ...................................................20 Figure 4.6. Durability factor as a function of porosity ..................................................................21 Figure 4.7. Durability factor as a function of rapid chloride ion permeability ..............................22 Figure 4.8. Durability factor as a function of w/b ..........................................................................23 Figure 4.9. Durability factor as a function of strength ...................................................................24 Figure 4.10. Relationship between durability factor and % air, by ASTM 231, of air entrained
samples ...............................................................................................................................25 Figure 4.11. Relationship between durability factor and % air and spacing factor of air entrained
samples, obtained by AVA ................................................................................................26 Figure 4.12. Relationship between durability factor and % air and spacing factor of air entrained
samples, obtained by RapidAir ..........................................................................................26 Figure 4.13. Durability factor as a function of the amount of air, measured following ASTM
C231 ...................................................................................................................................28 Figure 4.14. Durability factor as a function of spacing factor, measured using the AVA ............29 Figure 4.15. Durability factor as a function of spacing factor, measured using the RapidAir ......29 Figure A.1. I-FA beams after F-T cycles .................................................................................... A-1 Figure A.2. I-FA-AEA beams after F-T cycles .......................................................................... A-2 Figure A.3. IP beams after F-T cycles ........................................................................................ A-3 Figure A.4. IP-AEA beams after F-T cycles............................................................................... A-4
LIST OF TABLES
Table 2.1. Chemical composition and compounds of cementitious materials (%) ..........................3 Table 2.2. Properties of aggregates ..................................................................................................4 Table 2.3. Concrete mix proportions ...............................................................................................5 Table 2.4. Test methods and number of samples .............................................................................6 Table 3.1. Slump, air content, and unit weight of concrete mixtures ..............................................8 Table 3.2. Air void parameters of fresh concrete from AVA tests ..................................................9 Table 3.3. Properties of hardened concrete ....................................................................................11 Table 3.4. Air void parameters of fresh concrete from rapid air tests ...........................................12 Table 3.5. RDM and durability factors of beams...........................................................................15


ix
ACKNOWLEDGMENTS
The authors sincerely thank the Iowa Department of Transportation (Iowa DOT) for its sponsorship of this research. The authors would also like to acknowledge the special technical and administrative support of the National Concrete Pavement Technology Center (CP Tech Center) at Iowa State University throughout the entire project.
Earnest thanks are given to Mr. Todd Hanson at the Iowa DOT for his assistance in selecting and supplying concrete materials. Special appreciation also goes to Dr. Jim Cable (Iowa State University), Mr. John Joiner (City of Ames), and Mr. Eric Cowles (City of Ames) for their time and effort serving as the project advisory committee and for reviewing this project report.
Dr. Gang Lu participated in the early stages of the experimental work. Mr. Soogeun Kim helped in the freezing-thawing tests. Mr. Jeremy McIntyre and Mr. Brian Zimmerman assisted in the AVA tests. The project would not have been completed smoothly without all of the above-mentioned support and help.


1. INTRODUCTION
1.1 Background
In cold climate regions, many concrete pavement deterioration types are associated with cyclic freezing and thawing (F-T) and repeated applications of deicing chemicals. The F-T damages generally result from the volume change involved in ice formation and water migration in concrete, which generate hydraulic and osmotic pressures. For most conventional concretes, proper air entrainment is therefore essential because well-distributed micro-air bubbles can cut the water paths and provide additional spaces for ice to expand, which thus reduces the hydraulic and osmotic pressures.
Researchers and engineers have emphasized that a precondition for concrete to have F-T damage is the existence of freezable water in the concrete. Generally, concrete becomes vulnerable to F-T damage when it reaches a critical saturation condition. In other words, concrete will not be damaged by F-T if the concrete is dry or impermeable. This assumption later becomes a basis of argument about whether high-strength concrete (HSC) or very low permeability concrete needs air entrainment.
Since little water can penetrate into the concrete, HSC or very low permeability concrete rarely reaches its critical saturation condition, and therefore no significant F-T damage should take place. From the microstructure point of view, HSC contains mostly very fine pores. Due to the pore surface tension, the pore water is very difficult to freeze. Because the water in HSC barely freezes, there would be no F-T damage.
Philleo (1987) has pointed out that concrete with very low water-to-binder ratio (w/b) has no capacity for freezable water. All water in the concrete can be used for cement hydration, and proper curing is essential to provide proper hydration so that all spaces in the concrete are filled with hydration products. Thus, the concrete becomes impermeable, and moisture saturation is unlikely under natural exposure conditions. The addition of supplemental cementitious materials (SCMs), especially silica fume, can produce smaller pore sizes in which water cannot freeze at ordinary ambient temperature. Pigeon et al. (1991), in testing the F-T durability of 17 low w/b concrete mixes, have analyzed the influence of various parameters (type of cement, type of aggregate, and curing period) on the limiting w/b value, or the value below which air entraining admixture (AEA) is not required for good F-T durability. The authors reported that the limiting w/b is 0.25 (or 0.30 in certain cases). However, Cohen et al. (1992) has shown that the strength of HSC decreases with the increase of the F-T cycles, which implies that use of AEA is necessary. Bassuoni and Nehdi (2005) have stated that non–air-entrained, low w/b concrete is vulnerable to F-T degradation, although such vulnerability might not be detected using classical frost durability tests.
Currently in Norway, air entrainment is not required for low w/b concrete, while in Canada air entrainment is demanded regardless of w/b (Jacobsen et al. 1996). More research is necessary on this subject to provide proper guidelines for designing and constructing durable concrete.
1

1.2 Problem Statement
During the last decade, HSC, typically having a w/b lower than 0.30 and used with an application of SCMs, has increasingly been used not only because of the strength demand but also because of concrete durability considerations. Having high density and very low permeability, HSC or low w/b concrete possesses excellent resistance to various deteriorations caused by water, gas, and chemical penetration into the concrete.
High-density and low-permeability concrete rarely becomes saturated, and the water in the very fine capillary voids of the concrete hardly freezes in field exposure conditions (Philleo 1987). Therefore, theoretically, there is no need to require the use of AEA for F-T durability in high-density and low-permeability concrete. The use of AEA could cause notable strength reduction due to the existence of air bubbles. Moreover, it is often difficult to produce a proper and stable entrained air system in HSC due to the dry mixture made with a low w/b and high binder content.
A great deal of research has been conducted to investigate whether the use of AEA in HSC is necessary. Unfortunately, the results are controversial. Some researchers have shown that concrete with low w/b without AEA exhibits excellent F-T resistance, while others indicate that HSC with w/b higher than 0.25 must contain entrained air (Pigeon et. al. 2003; Aitcin 1994; Molhotra 1987; Krumbach et al 1997). These controversial laboratory and field results may result from the difficulties in consistently delivering non–air-entrained low w/b concrete, the deficiency of the standard F-T test method, and the variations in concrete materials and process methods (mixing and curing) used.
The correct answers regarding whether AEA is necessary for low w/b or low-permeability concrete and how low the w/b should be before AEA becomes unnecessary are of practical importance for designing and constructing functional and durable concrete pavements. With the use of blended cements in Iowa, lower permeability concrete has been achieved at normal w/b ratios. The present research is designed to investigate the F-T behaviors of Iowa concrete materials.
1.3 Research Objectives
The major objectives of this study are as follows:
1. To investigate the effects of concrete mixes, made with different types of cement, different w/b, and with and without AEA, on F-T durability
2. To determine the value of the limiting w/b, or the permeability below which AEA becomes unnecessary for good concrete F-T durability
3. To examine the effects of cement type and SCM on the effectiveness of air entrainment and the limiting w/b or permeability values
2

2. MATERIALS AND METHODS
2.1 Materials
The cementitious materials used in the study were provided by the Iowa Department of Transportation (Iowa DOT). The cementitious materials are Type I and Type IP and Class C fly ash. The Type IP source is a blended cement with 25% Class F fly ash. The chemical composition and compounds of these cementitious materials were determined by XRF and are listed in Table 2.1. The cementitious materials are within the requirements of their respective American Society for Testing Materials (ASTM) specifications.
Table 2.1. Chemical composition and compounds of cementitious materials (%)
Na2O MgO Al2O3 SiO2 SO3 K2O CaO Fe2O3 LOI Type I 0.15 3.34 4.17 20.20 2.47 0.69 63.20 2.96 2.37 Type IP 0.29 2.87 8.51 30.10 3.38 0.70 48.50 3.17 1.60 Fly Ash - C 1.64 4.87 17.68 31.92 1.68 0.43 30.92 6.54 0.47
C3S C2S C3A C4AF Type I 64.48 9.27 6.04 9.01
The freeze-thaw durable limestone coarse aggregate used in this research was obtained from the Ames Quarry, Bed 47 LC, through Martin Marietta Materials. Its nominal maximum size was 25 mm (1 in.). The fine aggregate was river sand from Hallett Materials. The gradation of the fine and coarse aggregates are shown in Figure 2.1. The aggregate properties are given in Table 2.2.
0
10
20
30
40
50
60
70
80
90
100
1-1/
2"1"
3/4"
1/2"
3/8"
No.
4
No.
8
No.
16
No.
30
No.
50
No.
100
No.
200
Perc
ent P
assin
g
Sieve Size
Coarse
Fine
Figure 2.1. Fine and coarse aggregate gradations
3

Table 2.2. Properties of aggregates
Sieve Size
% Passing (by mass) Limestone,
NMSA= 25 mm (1 in.)River sand
(F.M. =3.16) 25 mm (1 in.) 100.00 - 19 mm (3/4 in.) 85.85 -
12.5 mm (1/2 in.) 45.87 - 9.5 mm (3/8 in.) 26.97 100.00
4.75 mm (No. 4) 3.46 97.96 2.36 mm (No. 8) 1.04 84.84 1.18 mm (No. 16) - 63.06 600 μm (No. 30) - 31.04 300 μm (No. 50) - 6.48 150 μm (No. 100) - 0.44
Specific gravity 2.66 2.61 Absorption, % 0.72 1.09
The two Iowa DOT mix proportions, (1) C3-WR-C with Type I cement and Class C fly ash and (2) C3-WR with Type IP cement, were modified to obtain concrete mixtures with different w/b (0.25, 0.35, 0.45, 0.55). To obtain different w/b, the amount of water was reduced while all other concrete components were kept the same. All concrete mixtures were controlled to have similar slumps. Different dosages of high-range water reducing agent (HWRA) were applied to the lower w/b mixtures obtain similar slump values. The concrete mix proportions for the different cement types and w/b are given in Table 2.3.
4

Table 2.3. Concrete mix proportions
Binder Mix ID
Mix Design, kg/m3 (pcy)
w/c Cement Fly Ash Water
Fine Agg.
Coarse Agg.
AEA, ml/m3 (oz/cy)
HRWR, ml/m3 (oz/cy)
I-FA
I-FA55 221 (487)
39 (86)
143 (315)
625 (1376)
761 (1674)
166 (4.30) 0 0.55
I-FA45 221 (487)
39 (86)
117 (258)
625 (1376)
761 (1674)
166 (4.30)
1316 (34) 0.45
I-FA35 221 (487)
39 (86)
91 (201)
625 (1376)
761 (1674)
166 (4.30)
2514 (65) 0.35
I-FA25 221 (487)
39 (86)
65 (143)
625 (1376)
761 (1674)
166 (4.30)
6190 (160) 0.25
IP
IP55 260 (571) 0 143
(314) 627
(1380) 765
(1684) 166
(4.30) 0 0.55
IP45 260 (571) 0 117
(257) 627
(1380) 765
(1684) 166
(4.30) 1316 (34) 0.45
IP35 260 (571) 0 91
(200) 627
(1380) 765
(1684) 188
(4.85) 2514 (65) 0.35
IP25 260 (571) 0 65
(143) 627
(1380) 765
(1684) 221
(5.71) 6190 (160) 0.25
The HWRA used is Adva Cast 575, from Grace Construction Products. The AEA used is AEA-92 by Euclid Chemical Company.
2.2 Methods
All concrete mixtures were batched based on a standard procedure according to ASTM C192 and were moist-cured for 28 days. The slump, air content, and unit weight of the fresh concrete were measured as the concrete quality control information. The air void analyzer (AVA) was used to determine the volume and size distributions of the entrained air voids in the fresh concrete.
The AVA test was performed according to the test method outlined by Taylor et al. (2006). To set up the AVA, water and glycerol of known viscosity are poured into the riser cylinder. Air bubbles are removed using a brush. The buoyancy recorder is set up at the top of the riser, and the operator ensures that no air is trapped in the collector. Samples are extracted from the fresh concrete using an assembly of a percussion drill, a vibrator cage, and a syringe. The vibrating cage is slowly pushed into the concrete to let the mortar flow into the cage. The operator obtains 20 ml of mortar and fills the syringe. The mortar is injected into the glycerol-filled cylinder. The AVA machine stirs the mortar to release the air bubbles, which rise in the fluid. The AVA takes a maximum of 25 minutes to complete data recording and analysis.
5

Samples from each mixture were prepared in three 100×200 mm (4×8 in.) cylinders and three 75×100×400 mm (3×4×16 in.) beams for compressive strength and F-T resistance tests, respectively. Six additional cylinders were prepared, three for rapid chloride permeability, two for porosity, and one for RapidAir testing. All hardened concrete properties, including F-T durability, were taken on 28-day-old concrete.
Because of the importance of concrete air void structure in this study, three different tests were conducted for all concrete mixtures: rapid chloride permeability, RapidAir, and porosity. The F-T resistance test was conducted to compare the durability of the concrete with and without air-entrainment.
To measure the air void structure of the concrete, 100×100×10 mm (4×4×3/8 in.) samples were cut from the center of the 100×200 mm (4×8 in.) cylinders. The samples were then polished following ASTM C457. When the samples were flat and smooth, they were coated with a thin film of black dye and let dry. Then, each sample was heated to about 50 ºC. A paste of zinc oxide (white in color) was rubbed on the concrete to fill the air voids in the sample. The zinc oxide was then allowed to cool. The excess was scrapped off using a blade, leaving only the zinc oxide in the voids. The result was a black concrete surface with white air voids. Using a microscope and a computer program, the RapidAir device identified white spots (air voids) and provided information on the air void content, spacing factor (SF), and specific surface of the tested sample.
A summary of the proposed tests and related ASTM or American Association of State and Highway Transportation Officials (AASHTO) standards are presented in Table 2.4.
Table 2.4. Test methods and number of samples
Property Test Methods Fresh Concrete Properties
Slump ASTM C143/ AASHTO T 119 Air content ASTM C231/ AASHTO T 152 Unit weight ASTM C138/ AASHTO T 121
AVA NA Hardened Concrete Properties
f’c, 28 strength ASTM C39/ AASHTO T 22 Rapid chloride permeability ASTM C1202/ AASHTO T 277
Rapid air ASTM C457 Porosity (boiling) test ASTM C642
F-T resistance ASTM C666/ AASHTO T 161
6

3. TEST RESULTS
The results for the various tests of the different mixes are given in the following sections. In cases where the Iowa DOT designation is not used (and for brevity), I-FA and I-FA-AEA will denote concrete with Type I cement plus Class C fly ash, without and with AEA, respectively. IP and IP-AEA will denote concrete plus Type IP cement, without and with AEA, respectively. When I-FA or IP is followed by a number, the number indicates the w/b of the concrete. This notation will also be adopted in other sections of this report.
3.1 Fresh Concrete Properties
Slump, Air Content, and Unit Weight
The fresh concrete slumps, air contents, and unit weights are given in Table 3.1. The range of the reference slumps (w/b = 0.55) is from 175 to 200 mm (7 to 8 in.). The slumps for the different types of mixes are similar to their respective references, with a maximum difference of 31 mm (1.25 in.). These maxima are on the lowest w/b (0.25), where controlling the workability becomes much more difficult.
From the results given in Table 3.1, concrete without AEA has 1.5% to 2.8% air. I-FA-AEA has 7% to 8.2% air, while IP-AEA has 6% to 8% air. All I-FA concrete mixtures with AEA had the same dosage of admixture, while IP concrete mixtures required more AEA with decreasing w/b, as shown in Table 2.3. I-FA-AEA shows higher and more consistent air content than IP-AEA. The unit weights of the fresh concrete mixes were measured using a 0.007 m3 (0.25 ft3) cylindrical mold.
The unit weights for the I-FA mixtures ranged from 2,262 to 2,326 kg/m3 (141 to 145 pcf), where the low w/b is slightly higher than the reference mix (w/b = 0.55). In the case of the IP concrete, the range of unit weights is much larger, 2,278 to 2,400 kg/m3 (142 to 149.6 pcf), with IP25 having the highest unit weight of 2,518 kg/m3 (157 pcf).
7

Table 3.1. Slump, air content, and unit weight of concrete mixtures
Slump, mm (in) (C143)
Air, % (C231)
Unit Weight, kg/m3 (pcf) (C138)
Concrete without AEA I-FA55 181.2 (7.25) 1.5 2284 (142.4)
I-FA45 187.5 (7.50) 1.8 2262 (141.0)
I-FA35 162.5 (6.50) 2.2 2306 (143.8)
I-FA25 150.0 (6.00) 2.8 2318 (144.5)
IP55 175.0 (7.00) 1.5 2310 (144.0)
IP45 168.8 (6.75) 2.5 2278 (142.0)
IP35 162.5 (6.50) 2.2 2374 (148.0)
IP25 200.0 (8.00) 1.5 2518 (157.0)
Concrete with AEA
I-FA55-AEA 193.8 (7.75) 7.8 2278 (142.0)
I-FA45-AEA 187.5 (7.50) 7.0 2270 (141.5)
I-FA35-AEA 175.0 (7.00) 8.0 2302 (143.5)
I-FA25-AEA 175.0 (7.00) 8.2 2326 (145.0)
IP55-AEA 200.0 (8.00) 6.0 2276 (141.9)
IP45-AEA 200.0 (8.00) 8.0 2278 (142.0)
IP35-AEA 200.0 (8.00) 7.0 2318 (144.5)
IP25-AEA 187.5 (7.50) 7.5 2400 (149.6)
Air Void Structure by AVA
The air contents, specific surfaces, and SFs of the concrete mixtures were obtained using the AVA and are given in Table 3.2. The AVA measures air voids with a size equal to or less than 2 mm. In concrete, only the small-size air voids (≤ 0.3 mm or 300 µm) significantly benefit the F-T resistance. Therefore, both the total air (≤ 2 mm) and small air (≤ 300 µm) content measurements are presented. Figure 3.1 shows the amount of air by the size of the void for mixtures without AEA and with AEA.
The amount of air in the concrete without AEA ranges from 0.2% to 2.4%. For I-FA-AEA, the entrained air is from 5.9% to 9.3%. For the IP mixtures with AEA, the amount of air varies from 5.6% to 9.3%, except for IP55-AEA, whose air measured only 2.8%. Since AVA measures only air voids with a size equal or less than 2 mm, the total air content measured by AVA is generally less than that measured by the ASTM C231 tests (Wang et al. 2008). It is not clear at this time
8

why some mixtures in the present study had higher AVA total air content than total air content measured by C231.
To be able to withstand a great number of F-T cycles, the air content of air entrained concrete with a low w/b ratio should be between 5% to 8% (Woods 1956). In addition to this value, experience shows that > 6% ± 1% air, specific surface ≥ 24 mm2/mm3, and SF ≤ 0.20 mm would be expected to give good concrete F-T resistance (Tanesi and Meininger 2006). In a recent study by Wang et al. (2008), it was found that concrete with SF ≤ 0.3 mm measured by AVA would be acceptable for F-T durability because this SF criterion (SF ≤ 0.3 mm) from an AVA test is equivalent to the criterion (SF ≤0.2 mm) from the ASTM C457 test method. Based on this, mixtures with AEA have sufficient air entrainment for F-T durability, while mixtures without AEA do not.
Table 3.2. Air void parameters of fresh concrete from AVA tests
Total Air % (size ≤ 2mm)
Small Air, % (size ≤ 300 μm)
Specific surface, mm-1
Spacing factor, mm
Concrete without AEA I-FA55 0.3 0.06 16.9 1.07 I-FA45 1.8 0.07 6.2 1.36 I-FA35 0.8 0.10 10.3 1.11 I-FA25 1.0 0.05 9.5 1.02 IP55 0.2 0.05 14.0 1.43 IP45 0.5 0.00 7.6 1.86 IP35 2.4 0.80 18.9 0.37 IP25 1.5 0.08 8.1 1.03 Concrete with AEA I-FA55-AEA 5.9 2.47 21.5 0.24 I-FA45-AEA 9.3 4.50 25.4 0.14 I-FA35-AEA 8.0 4.43 31.0 0.13 I-FA25-AEA 7.7 1.96 17.2 0.20 IP55-AEA 2.8 1.44 26.1 0.28 IP45-AEA 8.2 4.55 31.0 0.13 IP35-AEA 5.6 1.62 17.3 0.28 IP25-AEA 9.3 6.54 28.4 0.10
9

(a) Without AEA (b) With AEA
0.0
1.0
2.0
3.0
4.0
5.0
6.0
7.0
8.0
9.0
10.0
10 100 1000
Cum
mul
ativ
e Air
Cont
ent (
%)
Void Size (μm)
I-FA55 I-FA45 I-FA35
I-FA25 IP55 IP45
IP35 IP25
0.0
1.0
2.0
3.0
4.0
5.0
6.0
7.0
8.0
9.0
10.0
10 100 1000Cu
mm
ulat
ive A
ir Co
nten
t (%
)Void Size (μm)
I-FA55-AEA I-FA45-AEAI-FA35-AEA I-FA25-AEAIP55-AEA IP45-AEAIP35-AEA IP25-AEA
Figure 3.1. Cumulative air content by void size for mixtures, measured by AVA
3.2 Hardened Concrete Properties
28th Day Compressive Strength, Rapid Chloride Permeability, and Porosity
The average 28th day compressive strengths of the concrete cylinder samples are given in Table 3.3. The concrete mixes without air entrainment have higher strengths than their air entrained counterparts. The difference in strengths of the air entrained and non–air entrained mixes is much larger for the I-FA samples than for the IP samples. It is also obvious that the compressive strength of IP25 is much larger than all the other results.
The rapid chloride permeability test measures the electrical conductance of a concrete sample to indicate its permeability to chloride ion penetration. The lower the amount of charge is passed through the concrete, the less permeable the concrete is to chloride ion penetration. The permeability results for the concrete samples are shown in Table 3.3. In the I-FA samples, the permeability values for w/b = 0.55 and w/b = 0.45 mixes tend to be much greater than the permeability values of the mixes with lower w/b ratios. These samples’ permeability values range from high to very low, going from w/b = 0.55 to 0.25. For the IP samples, the permeability differs only from moderate to very low. It is interesting to note that the air entrained samples are more impermeable than their non-air entrained counterparts, which could be due to the slightly higher slump for IP-AEA.
10

The porosity obtained in the boiling test is the amount of permeable voids in the concrete samples at the age of 28 days. Table 3.3 gives the porosity of the concrete samples. The amount of permeable voids in the samples with AEA is greater than the amount in the non–air entrained samples. The difference in porosity of I-FA and I-FA-AEA is larger than the difference between IP and IP-AEA.
Table 3.3. Properties of hardened concrete
28-day compressive strengths, MPa (psi)
Rapid chloride permeability, coulombs Porosity, %
Concrete without AEA I-FA55 46.4 (6730) 4300 5.6 I-FA45 54.4 (7890) 3220 6.6 I-FA35 58.6 (8500) 960 5.5 I-FA25 61.0 (8850) 480 4.3 IP55 43.6 (6320) 2080 13.0 IP45 51.8 (7510) 1720 10.5 IP35 54.1 (7840) 1320 8.1 IP25 88.0 (12760) 520 5.0 Concrete with AEA I-FA55-AEA 42.4 (6150) 5090 12.7 I-FA45-AEA 47.4 (6870) 3920 9.9 I-FA35-AEA 52.2 (7570) 1160 11.0 I-FA25-AEA 55.5 (8050) 660 10.1 IP55-AEA 31.3 (4540) 1290 13.3 IP45-AEA 39.3 (5690) 1290 11.9 IP35-AEA 49.3 (7150) 1070 11.0 IP25-AEA 57.5 (8330) 350 9.4
Air Void Structure by RapidAir
The results from the RapidAir tests performed on 28-day-old samples are given in Table 3.4. Different from AVA device, the RapidAir equipment measures all voids observed under an optical microscope and considers all air void sizes. In Table 3.4, both the total air and small air (≤ 300 µm) content measurements are presented so that the results can be compared to the results in Table 3.2. Considering generally accepted limits for a satisfactory air void system for F-T resistance (Tanesi and Meininger 2006), the concrete samples with AEA would provide adequate F-T resistance.
11

The air content of mixtures without AEA ranges from 0.4% to 4.1%, while mixtures with AEA have 5.3% to 9.1% air. The maximum SF for mixtures with AEA is 0.22 mm-1, while the SF ranges from 0.29 to 0.83 mm-1 for mixtures without AEA. Figure 3.2 shows the cumulative distribution of the percentage of air according to the size or the air void.
Table 3.4. Air void parameters of fresh concrete from rapid air tests
Total Air % (size ≤ 3mm)
Small Air, % (size ≤ 300 μm)
Specific surface, mm-1
Spacing factor, mm
Without AEA I-FA55 1.5 0.39 18.4 0.50 I-FA45 1.6 0.43 17.7 0.49 I-FA35 4.1 0.63 9.6 0.58 I-FA25 3.0 1.13 20.9 0.29 IP55 0.4 0.16 21.3 0.81 IP45 1.3 0.29 13.6 0.76 IP35 2.7 0.97 20.7 0.34 IP25 1.5 0.24 10.5 0.83 With AEA I-FA55-AEA 5.3 3.02 25.8 0.21 I-FA45-AEA 8.2 3.63 21.4 0.19 I-FA35-AEA 7.0 2.85 22.1 0.20 I-FA25-AEA 6.7 2.15 19.0 0.22 IP55-AEA 6.7 3.00 22.6 0.22 IP45-AEA 9.1 5.26 27.6 0.14 IP35-AEA 6.2 3.13 24.2 0.19 IP25-AEA 7.1 3.84 28.1 0.14
12

(a) Without AEA (b) With AEA
0.0
1.0
2.0
3.0
4.0
5.0
6.0
7.0
8.0
9.0
10.0
10 100 1000
Cum
mul
ativ
e Air
Con
tent
(%)
Void Size (μm)
I-FA55 I-FA45 I-FA35
I-FA25 IP55 IP45
IP35 IP25
0.0
1.0
2.0
3.0
4.0
5.0
6.0
7.0
8.0
9.0
10.0
10 100 1000
Cum
mul
ativ
e Air
Con
tent
(%)
Void Size (μm)
I-FA55-AEA I-FA45-AEAI-FA35-AEA I-FA25-AEAIP55-AEA IP45-AEAIP35-AEA IP25-AEA
Figure 3.2. Cumulative air content by void size for mixtures, measured by RapidAir
F-T Durability
Concrete beams were subjected to F-T cycling after a 28-day standard fog-room curing. The relative dynamic modulus (RDM) values of the concrete beams and the number of F-T cycles are shown in Figure 3.3. In cases where the samples deteriorated excessively, the dynamic modulus was taken until the deterioration rendered the sample immeasurable. The data show that the terminal RDM of the samples without AEA increased with decreasing w/b. Except for mixtures with w/b = 0.25, all of the beam samples had completely deteriorated before reaching 300 F-T cycles. At 300 cycles, I-FA25 and IP25 had RDM values equal to 34% and 94%, respectively. The I-FA-AEA samples had RDM values at 300 cycles of 92% to 95%, while the IP-AEA had a wider range of final values, 87% to 96%.
The durability factors of the concrete beam samples are shown in Table 3.5. The minimum RDM is 50%, and the maximum number of F-T cycles is 300. The F-T durability of the samples without AEA increased with decreasing w/b. For the air entrained samples, because the RDM values were all greater than 50% after 300 F-T cycles, the durability factors were the same as the RDMs.
13

(a) Without AEA (b) With AEA
0
10
20
30
40
50
60
70
80
90
100
0 50 100 150 200 250 300
Rel
ativ
e Dyn
amic
Mod
ulus
(%)
F-T Cycles
I-FA55 I-FA45 I-FA35
I-FA25 IP55 IP45
IP35 IP25
0
10
20
30
40
50
60
70
80
90
100
0 50 100 150 200 250 300
Rel
ativ
e Dyn
amic
Mod
ulus
(%)
F-T Cycles
I-FA55-AEA I-FA45-AEA
I-FA35-AEA I-FA25-AEA
IP55-AEA IP45-AEA
IP35-AEA IP25-AEA
Figure 3.3. RDM for concrete with and without AEA
14

Table 3.5. RDM and durability factors of beams
Relative Dynamic Modulus (%)
Durability Factor (%)
Concrete without AEA I-FA55 8 5 I-FA45 12 9 I-FA35 12 19 I-FA25 34 39 IP55 12 4 IP45 13 10 IP35 25 30 IP25 94 94 Concrete with AEA I-FA55-AEA 92 93 I-FA45-AEA 95 95 I-FA35-AEA 94 94 I-FA25-AEA 94 95 IP55-AEA 92 92 IP45-AEA 87 87 IP35-AEA 96 96 IP25-AEA 95 95
15

4. DATA ANALYSIS
Many factors can affect the F-T durability of concrete: (1) the amount and structure of entrained air, (2) the permeability or porosity of the concrete, (3) existing defects, (4) the F-T durability of the aggregates (5) curing and strength, and (5) surface finish. The following discussion relates the measured F-T durability of the concrete beam samples to the amount and structure of entrained air, permeability and porosity, and w/b. The same type of aggregate was used for all samples, and thus all have the same F-T durability. All samples were cured for 28 days and had no existing defects before testing. The F-T beams had five sides smooth because of the steel mold, while one side was finished using a straight edge. In the discussion below, the different properties that affect F-T durability are compared individually to the durability factors of the concrete samples.
4.1 Relationship between Air Void Parameters
Figure 4.1 illustrates the relationships between the different air void parameters measured by AVA. Figure 4.1(a) shows that SF decreased with increasing air content. In this figure, the air content in the small air voids is shown because this air content has a better relationship to SF (R2=0.96) than total air content. When the total AVA air content is considered, a similar relationship still exists, but its R2 value decreases to 0.83. Figure 4.1(b) shows that SF also decreases with increasing specific surface. Based on Figure 4.1(b), the AVA-measured specific surface will be approximately 20 mm2/mm3 when the SF is 0.3 mm.
(a) Spacing factor vs. content of small air voids (b) Spacing factor vs. specific surface of all air voids
SF = 0.3184(Air)-0.504
R² = 0.96
0.0
0.4
0.8
1.2
1.6
2.0
0 2 4 6
Spac
ing F
acto
r (m
m)
Air Content "size ≤ 300 micron" (%)8
SF = 50.9SS-1.717
R² = 0.79
2.0
0.0
0.4
0.8
1.2
1.6
0 10 20 30
Spac
ing F
acto
r (m
m)
Specific Surface (mm-1)
Figure 4.1. Relationships between air void parameters measured by AVA
16

Figure 4.2 illustrates the relationships between the air void parameters measured by RapidAir; the trends are the same as those illustrated in Figure 4.1. In Figure 4.2(b), one data point had a higher SF and specific surface than other data points. Excluding this outlier in the model improves the fit from R2 = 0.61 to R2 = 0.79.
(a) SF vs. content of small air voids (b) Spacing factor vs. Specific surface
Figure 4.2. Relationships between air void parameters measured by Rapid Air
Figure 4.3 shows that certain relationships exist between RapidAir and AVA measurements. Based on the present test data, the total air content and specific surface measured by the RapidAir test method were noticeably higher than those values measured by the AVA test method. The small air contents measured by both test methods were comparable. The SF measured by the RapidAir test method was much lower than that measured by the AVA test method.
17
SF = 0.348(Air)-0.528
R² = 0.96
0.0
0.4
0.8
1.2
1.6
2.0
0 2 4 6 8
Spac
ing F
acto
r (m
m)
Air Content "size ≤ 300 micron" (%)
R² = 0.61
SF = 36.739(SS)-1.626
R² = 0.79
0.0
0.4
0.8
1.2
1.6
2.0
0 10 20 30
Spac
ing F
acto
r (m
m)
Specific Surface (mm-1)

(a) Total air content (b) Small air (≤0.3mm) content
(c) Spacing factor (d) Specific surface
RA = 0.721AVA + 1.583R² = 0.80
0
1
2
3
4
5
6
7
8
9
10
0 1 2 3 4 5 6 7 8 9 10
Tota
l Air
Con
tent
by
Rap
id A
ir, %
Total Air Content by AVA, %
RA = 0.658AVA + 0.763R² = 0.75
0
1
2
3
4
5
6
7
0 1 2 3 4 5 6 7Sm
all A
ir (≤
0.30
mm
) Con
tent
by
Rap
id A
ir, %
Small Air (≤0.30 mm) by AVA, %
RA = 0.372AVA + 0.132R² = 0.77
0.0
0.2
0.4
0.6
0.8
1.0
1.2
1.4
1.6
1.8
2.0
0.0 0.2 0.4 0.6 0.8 1.0 1.2 1.4 1.6 1.8 2.0
Spac
ing F
acto
r by
Rap
id A
ir, m
m
Spacing Factor by AVA, mm
RA = 0.48AVA + 11.518R² = 0.57
0
5
10
15
20
25
30
35
40
0 5 10 15 20 25 30 35
Spec
ific
Surf
ace b
y R
apid
Air,
mm
-1
Specific Surface by AVA, mm-1
Figure 4.3. Relationships between RapidAir and AVA measurements
18

Figure 4.4 shows the correlation between the percent air obtained from RapidAir or AVA testing and the pressure method. The resulting trend lines show that the results from RapidAir and AVA testing are lower than the results obtained by C231, and the results from AVA testing are slightly lower than those from RapidAir.
AVA = 0.9310(C231)R² = 0.81
RA = 0.9450(C231)R² = 0.84
0
1
2
3
4
5
6
7
8
9
10
0 1 2 3 4 5 6 7 8 9 10
Air
Con
tent
(Rap
id A
ir or
AV
A, %
)
Air Content (C231 Air, %)
AVA
Rapid Air
AVA line
Rapid Air line
Figure 4.4. Correlation of results from RapidAir and AVA with ASTM C231
4.2 Relationship between Hardened Concrete Properties
Figure 4.5 illustrates the relationships between hardened concrete properties, including 28-day compressive strength, rapid chloride permeability, and porosity.
Figure 4.5 (a) to (c) shows that, with increasing w/b, concrete strength decreases while rapid chloride permeability and porosity increase. In the case of I-FA, when w/b becomes greater than 0.35, there is a more rapid increase in permeability. It can also be observed that concrete with AEA has a slightly lower strength but a much higher porosity than concrete without AEA.
19

(a) Compressive strength vs. w/b (b) Rapid Cl permeability vs. w/b
(c) Porosity vs. w/b (d) Rapid Cl permeability vs. porosity
Figure 4.5. Relationship between hardened concrete properties
In Figure 4.5(d), the concrete with AEA has a much higher porosity than the concrete without AEA, whereas the difference in the permeability values of concrete with and without AEA is not as defined. For concrete with type IP cement, Figure 4.5(d) shows that there is an increase in
20
permeability with the increase in porosity, but for I-FA there is no clear relationship between concrete porosity and rapid chloride permeability.
It should be noted that, in addition to having the highest unit weight, concrete made with IP cement, a w/b of 0.25, no AEA (IP25) had the highest strength (88 MPa or 12,760 psi) and the lowest porosity (5%) among all mixes. Such properties significantly influence concrete F-T resistance.
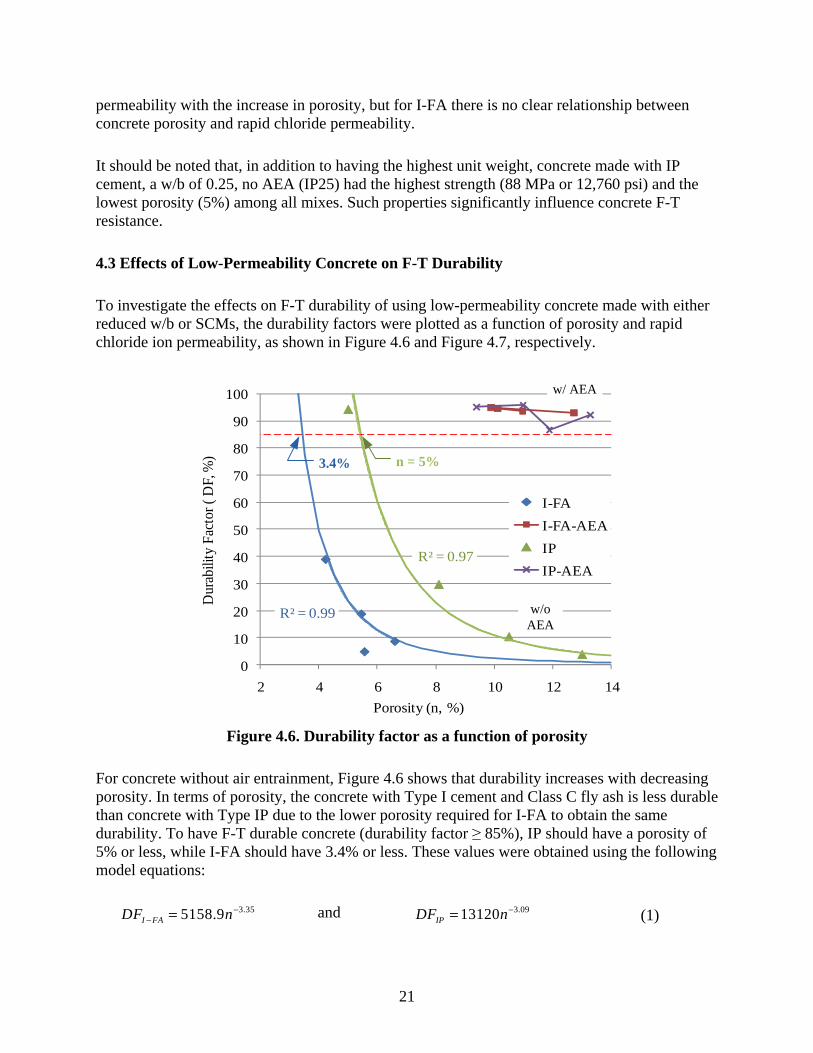
4.3 Effects of Low-Permeability Concrete on F-T Durability
To investigate the effects on F-T durability of using low-permeability concrete made with either reduced w/b or SCMs, the durability factors were plotted as a function of porosity and rapid chloride ion permeability, as shown in Figure 4.6 and Figure 4.7, respectively.
R² = 0.97
R² = 0.99
0
10
20
30
40
50
60
70
80
90
100
2 4 6 8 10 12 1
Dur
abili
ty F
acto
r ( D
F, %
)
Porosity (n, %)4
I-FAI-FA-AEAIPIP-AEA
3.4% n = 5%
w/o AEA
w/ AEA
Figure 4.6. Durability factor as a function of porosity
For concrete without air entrainment, Figure 4.6 shows that durability increases with decreasing porosity. In terms of porosity, the concrete with Type I cement and Class C fly ash is less durable than concrete with Type IP due to the lower porosity required for I-FA to obtain the same durability. To have F-T durable concrete (durability factor ≥ 85%), IP should have a porosity of 5% or less, while I-FA should have 3.4% or less. These values were obtained using the following model equations:
3.355158.9 −− =I FADF n and 3.0913120 −=IPDF n (1)
21
Subscripts I-FA and IP denote the cementitious materials (Type I cement with 15% Class C fly ash and IP cement, respectively), and n is the porosity of concrete without AEA.
The trend line for I-FA does not include the results from I-FA55, as this data point is clearly an outlier. For the air entrained concrete samples, the relation between porosity and durability is not as well defined as the relationship for non-air entrained concrete samples. This is due to the role of the air void system in resisting F-T stresses. In this case, the samples may have high porosity values but still have high durability factors. The entrained air tends to increase porosity, but the air void system provides room for freezing water to expand and thus reduces stress.
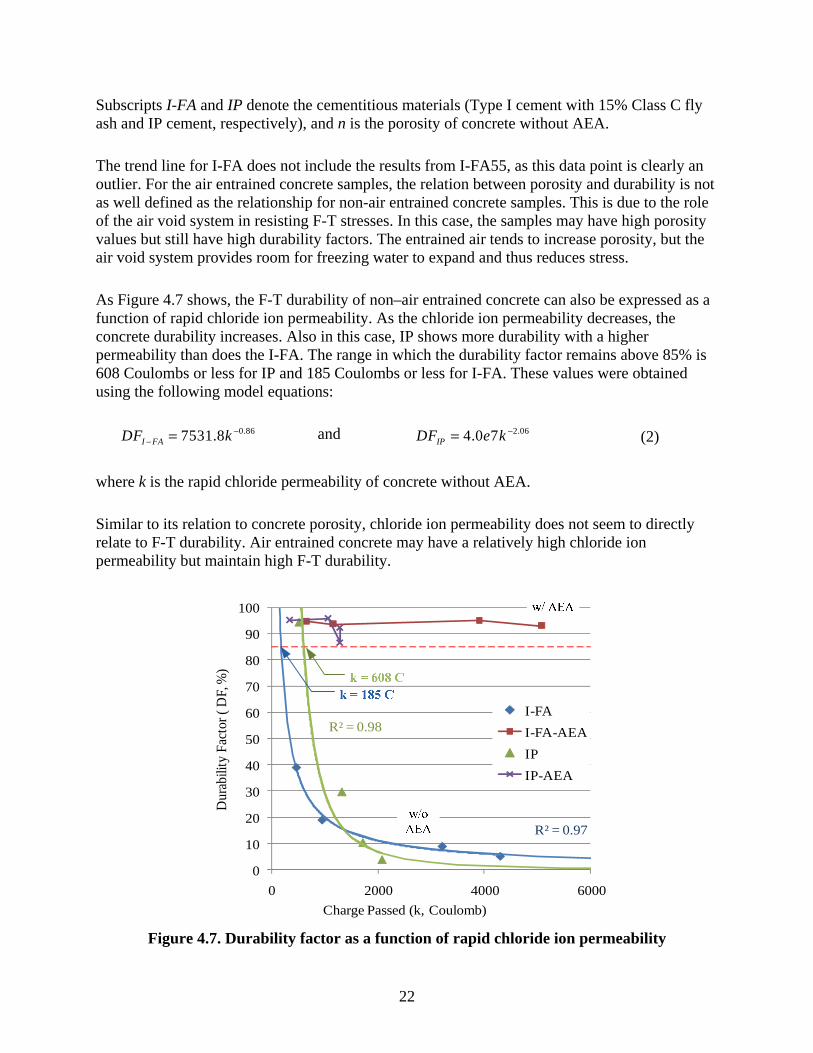
As Figure 4.7 shows, the F-T durability of non–air entrained concrete can also be expressed as a function of rapid chloride ion permeability. As the chloride ion permeability decreases, the concrete durability increases. Also in this case, IP shows more durability with a higher permeability than does the I-FA. The range in which the durability factor remains above 85% is 608 Coulombs or less for IP and 185 Coulombs or less for I-FA. These values were obtained using the following model equations:
0.867531.8 −− =I FADF k and 2.064.0 7 −=IPDF e k (2)
where k is the rapid chloride permeability of concrete without AEA.
Similar to its relation to concrete porosity, chloride ion permeability does not seem to directly relate to F-T durability. Air entrained concrete may have a relatively high chloride ion permeability but maintain high F-T durability.
R² = 0.97
R² = 0.98
0
10
20
30
40
50
60
70
80
90
100
0 2000 4000 6000
Dur
abili
ty F
acto
r ( D
F, %
)
Charge Passed (k, Coulomb)
I-FAI-FA-AEAIPIP-AEA
Figure 4.7. Durability factor as a function of rapid chloride ion permeability
22

4.4 Effects of w/b and Strength on F-T- Durability
Water in large enough capillary pores will freeze near or a few degrees below its normal freezing point (Philleo 1987). When the pores become smaller, the water in them tends to require much lower temperatures to freeze. For concrete without air entrainment for durability, freezable water must be eliminated. One of the ways that this may be achieved is to reduce the w/b to minimize the capillary pores. Reducing the w/b also has the benefit of lowering permeability (as shown in Figure 4.5(b)) and thus hindering water saturation in the concrete. The w/b can then be related to F-T durability. Figure 4.8 shows the concrete durability factor as a function of w/b. Similar to porosity and chloride ion permeability, the F-T durability of non–air entrained concrete increases as w/b decreases. For the samples tested, the relationships are expressed as follows:
( ) 2.621.09I FADF w b −− = and ( ) 3.720.48IPDF w b −= (3)
To achieve a durability factor of 85% or greater, the limiting w/b of IP concrete without AEA is 0.26. For I-FA concrete, the limiting w/b is 0.19. It should be noted that the concrete samples were prepared in a laboratory and that the lowest w/b ratio for the tests was 0.25. The w/b of 0.19 was obtained by interpolating the results. In terms of current pavement construction practice, a w/b of 0.19 is not attainable in the field, while a w/b of 0.26 is not practical. Such a low w/b is especially not conducive for slip form paving.
The limiting w/b does not apply to air entrained concrete, because F-T durability would depend more on the concrete’s entrained air system than on w/b. The w/b of I-FA55-AEA and I-FA25-AEA greatly differ, yet their durability factors are similar. The same is the case for IP55-AEA and IP25-AEA.
R² = 0.99
R² = 0.99
0
10
20
30
40
50
60
70
80
90
100
0.1 0.2 0.3 0.4 0.5 0.6
Dur
abili
ty F
acto
r ( D
F, %
)
w/b
I-FAI-FA-AEAIPIP-AEA
Figure 4.8. Durability factor as a function of w/b
23

In addition to w/b, the effect of strength on F-T durability was examined. Generally, concrete gets damaged because the stresses developed in the concrete are higher than the concrete strength. As a result, concrete F-T durability increases with strength. This concept is reflected in Figure 4.9 in the performance of the concrete without AEA. For concrete with AEA, the relationships between concrete durability factor and strength or w/b were not clear, even though the relationship between concrete strength and w/b held well.
R² = 0.87R² = 0.88
0
10
20
30
40
50
60
70
80
90
100
0 10 20 30 40 50 60 70 80 90 100
Dura
bility
Fac
tor (
DF,
%)
f'c (MPa)
IPIP-AEAI-FAI-FA-AEA
Figure 4.9. Durability factor as a function of strength
Based on the present study, the relationships between durability factor and 28-day compressive strength ( '
cf ) of non-air entrained concrete can be expressed by Equation (4):
( )6.96'1.05 11I FA cDF e f− = −
and ( )4.29'5.24 7IP cDF e f= −
(4)
According to Equation (4), concrete made with Type I cement and Class C fly ash requires a 28-day compressive strength of 70.7 MPa (10,246 psi) to be F-T durable (durability factor ≥ 85%). Concrete made with IP cement requires 28-day compressive strength of 82 MPa (11,880 psi).
In the study by Pigeon et al. (1991) on the F-T durability of high-strength concrete, the authors suggested that the w/b ratio below which air entrainment becomes unnecessary, for a concrete with Type I cement, 6% silica fume, and dolomitic limestone, is “probably” on the order of 0.25, which is a similar result range in the present study. It is also interesting to note that in the authors’ study, the 28-day compressive strength and SF are 11,930 psi and 0.69 mm, respectively. In the case of IP25, the compressive strength and spacing factor is 82.0 MPa (12,760 psi) and 0.83 mm, respectively.
24

In a study by Whiting (1987) on the durability of high-strength concrete, all moist-cured samples without air entrainment failed to reach 300 F-T cycles before having a relative dynamic modulus below 60%. The range of study for non–air entrained concrete included a w/b range of 0.31 to 0.56, and a 28-day compressive strength range of 10,000 to 6,000 psi. Consistent with the present study, these values are not within the range found that would provide sufficient F-T durability for concrete without air entrainment.
4.5 Effects of Cement Type on the Effectiveness of Air Entrainment
The effectiveness of air entrainment was evaluated in this study by comparing the concrete’s durability factor after 300 F-T cycles to the amount of and spacing factor for the entrained air. The parameters used for evaluating air entrainment in concrete include air content greater than 6% and spacing factor 0.2 mm or less. The air entrainment is considered effective if the durability factor is ≥ 85%. Figure 4.10 to Figure 4.12 show the relationship between the durability factor and the amount of air and spacing factor of the air entrained samples. (The “AEA” was dropped in the figures to reduce the labels’ sizes.) There are eight cases of air entrained concrete in this study, including four w/b ratios for each type of cementitious material. The result for each case is the average of three samples.
For samples with AEA, Figure 4.10 shows the relationship between durability factor and the percentage of air obtained from the ASTM C231 pressure method. The figure shows that for all cases, when the amount of air is above 6%, the durability factor is also above 85%.
Figure 4.10. Relationship between durability factor and % air, by ASTM 231, of air
entrained samples
For the results obtained from the air entrained concrete samples using the AVA, Figure 4.11 shows the relationship between the durability factor and the amount of air and spacing factor. The results show that 100% of the samples that meet the required amount of air and the required spacing factor have durability factors greater than 85%. I-FA55-AEA has good durability because its air content (5.9%) is very close to the required. IP35-AEA also has a high durability factor because its air content (5.6%) is close to the required and because its spacing factor is small (0.28 mm). IP55-AEA does not meet either the air or spacing factor criteria but still has good durability. This is because its spacing factor is still small (0.28 mm) and, considering Figure 4.10, because IP55-AEA shows sufficient air entrainment to provide good durability.
25

Figure 4.11. Relationship between durability factor and % air and spacing factor of air
entrained samples, obtained by AVA
For the results obtained from the RapidAir equipment, Figure 4.12 shows the relationship between the durability factor and the air structure. In this case, 100% of the samples that meet the air structure requirement also have a durability factor greater than 85%. I-FA55-AEA has a durability factor greater than 85% because its air content (5.3%) and spacing factor (0.21 mm) are close to the required. In the case of I-FA25-AEA and IP55-AEA, their spacing factors are both 0.22 mm, close enough to 0.2 mm to provide good F-T durability.
Figure 4.12. Relationship between durability factor and % air and spacing factor of air
entrained samples, obtained by RapidAir
Based on the results obtained, the effectiveness of air entrainment in terms of resistance to F-T damage depends largely on the amount and structure of the entrained air and is not affected by the type of cemetitious material. When the air structure is sufficient, then a good F-T durability can be obtained.
26
4.6 Interaction between Cementitious Materials and AEA
The interaction between the cementitious materials and AEA is based on the amount of air entrained for the same admixture and dosage. As described above, the cementitious materials included I-FA (a combination of Type I cement and Class C fly ash) and IP (Type IP, blended Type I and Class F fly ash cement), and the AEA was an aqueous solution compound of synthetic organic chemicals. The amount of AEA required to have sufficient air entrainment varies depending on type of cement, fineness of sand, temperature, design of the mix, etc. For this study, the amount of admixture was varied to achieve sufficient air entrainment.
The results from the I-FA mixtures showed that sufficient air entrainment can be achieved with the same dosage of admixture. The amount of air measured using the pressure method ranged from 7% to 8.2%. With the AVA, the entrained air varied from 5.9% to 9.3%, while the results measured with the RapidAir equipment varied from 5.3% to 8.2%. Because the tests are taken from different conditions of the sample (i.e., the pressure method uses rodded plastic concrete, the AVA uses vibrated mortar, the RapidAir uses hardened concrete), the fact that the entrained air remained above 5% means that it may be considered stable.
The IP mixtures have a less stable air entrainment. The amount of air measured with the pressure method ranged from 6% to 8%, while the amount of air measured with the AVA and RapidAir, respectively, ranged from 2.8% to 9.3% and from 6.24% to 9.1%. To achieve these amounts of air entrainment, the dosage of AEA had to be increased with a decreasing w/b and an increasing amount of cementitious material.
4.7 Effect of Air Void Structure on F-T Durability
Figure 4.13 shows that, for this study, all of the samples with air contents ≥ 6% had good F-T durability (durability factor ≥ 85%). For the samples without AEA, all except one of the samples with air contents less than 6% had poor F-T durability. The exception to these criteria was IP25, which has a low air content and high durability. This mixture showed a very high compressive strength (12,760 psi) and a low porosity (5%) and permeability (350 C).
27

0
10
20
30
40
50
60
70
80
90
100
0 2 4 6 8 1
Dur
abili
ty F
acto
r (%
)
ASTM C231 Air (%)0
I-FAI-FA-AEAIPIP-AEA
Figure 4.13. Durability factor as a function of the amount of air, measured following ASTM C231
A spacing factor criterion of ≤ 0.20 mm is usually adopted to determine an adequate F-T durability for concrete. In the present study, it is shown in Figure 4.14 that all samples having a spacing factor of ≤ 0.28 mm and less are F-T durable. Samples with a higher spacing factor were not F-T durable, except for IP25, which had a SF of 1.03 mm.
For the spacing factor as measured by RapidAir, shown in Figure 4.15, all samples having a spacing factor of ≤ 0.28 mm and less are F-T durable. Samples with a higher spacing factor were not F-T durable, except for IP25, which had a SF of 0.83 mm.
28

Figure 4.14. Durability factor as a function of spacing factor, measured using the AVA
Figure 4.15. Durability factor as a function of spacing factor, measured using the RapidAir
Pigeon et al. (1991) studied the F-T durability of high-strength concrete and suggested that the limiting w/b, below which air entrainment is not required for concrete made with Type I cement, 6% silica fume, and dolomitic limestone, is “probably” on the order of 0.25, which is a similar result range in the present study. It is also interesting to note that, in the Pigeon et al. study, the 28-day compressive strength and spacing factor for F-T durable concrete was 82.3 MPa (11,930
0.28
mm
0
10
20
30
40
50
60
70
80
90
100
0.0 0.4 0.8 1.2 1.6 2.0
Dur
abili
ty F
acto
r (%
)
AVA Spacing Factor (mm)
I-FAI-FA-AEAIPIP-AEA
0.22
mm
0
10
20
30
40
50
60
70
80
90
100
0 0.4 0.8 1.2 1.6 2
Dur
abili
ty F
acto
r (%
)
Rapid Air Spacing Factor (mm)
I-FAI-FA-AEAIPIP-AEA
29

psi) and 0.69 mm, respectively. In the present study, the only F-T durable concrete mix without AEA was mix IP25, which had a compressive strength of 88.0 MPa (12,760 psi) and a spacing factor of 0.83 mm (measured by RapidAir).
In addition, the results from the present study are consistent with those from previous research, although different test methods for concrete air void structure analysis were applied. Whiting (1987) studied the F-T durability of high-strength concrete and reported that all moist-cured samples without air entrainment failed with a dynamic modulus below 60% before reaching 300 F-T cycles. The concrete in that study had no AEA, a w/b ranging from 0.31 to 0.56, and a 28-day compressive strength between 6,000 and 10,000 psi.
30

5. CONCLUSIONS
The F-T durability of concrete without air entrainment increases as rapid chloride permeability decreases and strength increases. Low-permeability concrete without air entrainment can be F-T durable if the concrete also has very high strength. In the present study, the concrete mix made with Type IP cement and without AEA had a durability factor of 94.3%, along with a rapid chloride permeability of 520 coulombs and a 28-day compressive strength of 88.0 MPa (12,760 psi).
For concrete with AEA, the effectiveness of air entrainment for resisting F-T deterioration is dependent mostly on the air void system rather than the type of cementitious material. To ensure F-T durability, according to the tests conducted, the amount of air needed to be 6% or greater (measured with ASTM C231) and the spacing factor needed to be 0.28 mm or less when measured using AVA or 0.22 mm or less when measured using RapidAir.
The relationships between concrete F-T durability and other properties (such as rapid chloride permeability, porosity, and w/b) have been clearly demonstrated by the concrete made with given cementitious materials and without AEA. These relationships can be expressed as a power form: DF = a·(P)-b, where a and b are constant and P is the above-mentioned concrete properties. These relationships do not exist for the concrete with AEA.
31
6. RECOMMENDATIONS
It is quite common, even for high-performance concrete, to have air entrainment when the concrete’s application involves freezing and thawing conditions. In a publication of the Portland Cement Association (PCA), Kosmatka (2006) mentioned that air entrainment is mandatory for high-strength concrete, but the author recognizes that the amount of air entrainment may be reduced. The author also notes applications where good freeze-thaw resistance is obtained for high-strength concrete without air entrainment.
Based on the present findings, low permeability alone would not guarantee F-T durability. Rather, it is the combination of low permeability and high strength that would make concrete F-T durable without air entrainment. It has been noted in Section 4.4 that very low w/b (0.19 and 0.26) either cannot be achieved in the field or is impractical. However, if casting conditions would permit, low permeability can be attained with the following:
1. Using supplementary cementitious materials, such as fly ash, slag, metakaolin, or silica fume
2. Increasing the degree of hydration by longer moist-curing periods 3. Using a lower water-to-cement ratio
The above factors are also responsible for increasing concrete strength. Additionally, one must carefully consider aggregate properties and gradation.
32

7. REFERENCES
Bassuoni, M. T.; and Nehdi, M. L.; (2005). “The case for air-entrainment in high-performance concrete”. Proceedings of the Institution of Civil Engineers: Structures and Buildings, vol. 158, No. 5, pp. 311-319
Biolzi, L.; Guerrini, G. L.; and Rosati, G.; (1999). “Frost durability of very high performance cement-based materials”, Journal of Materials in Civil Engineering, vol. 11, No. 2, pp. 167-170
Chatterji, S., (2003). “Freezing of air-entrained cement-based materials and specific actions of air-entraining agents”, Cement and Concrete Composites, vol. 25, No. 7, pp. 759-765
Cohen, M. D.; Zhou, Y.; and Dolch, W. L.; (1992). “Non-air-entrained high-strength concrete - Is it frost resistant?”, ACI Materials Journal (American Concrete Institute), v 89, n 4, Jul-Aug, 1992, p 406-415
Jacobsen, S.; Sellevold, E.; and Matala, S.; (1996). “Frost durability of high strength concrete: effect of internal cracking on ice formation”, Cement and Concrete Research, vol. 26, No. 6, pp. 919-931
Kosmatka, S.H.; (2006). “Design and control of concrete mixtures, 14th edition”, Portland Cement Association.
Krumbach , R.; Schmelter, U.; Seyfarth, K; (1997). “High Strength Concrete–Durability Investigations by Using the CDF–Test”, LACER, vol. 2, pp.159-170
Mather, B. (1998). “How to make concrete that will be immune to the effects of freezing and thawing”, Proceedings of the International Conference on Cold Regions Engineering, pp. 721-730
Mindess, S.; Young, J. F.; and Darwin, D., (2003). “Concrete”, 2nd ed., Prentice Hall Philleo, R.; (1987). “Frost susceptibility of high-strength concrete”, in Concrete Durability,
Katharine and Bryant Mather International Conference, ACI SP-100, Scanlon, J.M. ed. pp. 819-842
Pigeon, M.; Gagne, R.; Aitcin, P.-C.; and Banthia, N., (1991). “Freezing and thawing tests of high-strength concretes”, Cement and Concrete Research, vol. 21, No. 5, pp. 844-852
Pigeon, M.; and Lachance, M.; (1981). “Critical air void spacing factors for concretes submitted to slow freeze-thaw cycles”, Journal of The American Concrete Institute, vol. 78, No. 4, pp. 282-291
Pigeon, M.; Zuber, B.; Marchand, J.; (2003) “Freeze/thaw resistance”, Advanced Concrete Technology: Concrete Properties, Butterworth-Heinemann
Tanesi, J.; and Meininger, R.; (2006). “Freeze-thaw resistance of concrete with marginal air content”, Federal Highway Administration, Publication No. FHWA-HRT-06-117.
Taylor, P.C.; Kosmatka, S.H.; Voigt, J.F.; et al.; (2006) “Integrated Materials and Construction Practices for Concrete Pavement: A State-of-the-Practice Manual.” A Report from the National Concrete Pavement Technology Center and Federal Highway Administration, Ames, IA: Iowa State University. [FHWA Publication No. HIF-07-004] [www.cptechcenter.org/publications/imcp/]
Wang, K.; Mohamed-Metwally, M.; Bektas, F.; and Grove, J.; (2008) “Improving Variability and Precision of Air-Void Analyzer (AVA) Test Results and Developing Rational Specification Limits”, Final Project Report, National Concrete Pavement Technology Center, Iowa State University, Ames, Iowa.
33

34
Whitting, D. (1987). “Durability of High Strength Concrete” in Concrete Durability, Katharine and Bryant Mather International Conference, ACI SP100, Scanlon, J.M. ed. pp 169-186.
Woods, H. (1956). “Observations on the resistance of concrete to freezing and thawing”, Research Department Bulletin RX067, Portland Cement Association, http://www.cement.org/pdf_files/RX067.pdf.

APPENDIX A. IMAGES OF BEAM SAMPLES AFTER F-T TEST
I-FA55 I-FA45
I-FA35 I-FA25
Figure A.1. I-FA beams after F-T cycles
A-1

I-FA55-AEA I-FA45-AEA
I-FA35-AEA I-FA25-AEA
Figure A.2. I-FA-AEA beams after F-T cycles
A-2

IP55 IP45
IP35 IP25
Figure A.3. IP beams after F-T cycles
A-3

IP55-AEA IP45-AEA
IP35-AEA IP25-AEA
Figure A.4. IP-AEA beams after F-T cycles
A-4