investigating the role of internal hospital factors and
TRANSCRIPT

University of South CarolinaScholar Commons
Theses and Dissertations
2016
Investigating The Role Of Internal Hospital FactorsAnd The External Environment On HealthcareQuality Outcomes And Patient ChoiceDeepa WaniUniversity of South Carolina
Follow this and additional works at: https://scholarcommons.sc.edu/etd
Part of the Business Administration, Management, and Operations Commons
This Open Access Dissertation is brought to you by Scholar Commons. It has been accepted for inclusion in Theses and Dissertations by an authorizedadministrator of Scholar Commons. For more information, please contact [email protected].
Recommended CitationWani, D.(2016). Investigating The Role Of Internal Hospital Factors And The External Environment On Healthcare Quality Outcomes AndPatient Choice. (Doctoral dissertation). Retrieved from https://scholarcommons.sc.edu/etd/3816

INVESTIGATING THE ROLE OF INTERNAL HOSPITAL FACTORS AND THE EXTERNAL ENVIRONMENT ON HEALTHCARE QUALITY OUTCOMES AND
PATIENT CHOICE
by
Deepa Wani
Bachelor of Engineering University of Mumbai, 2000
Master of Science
University of South Carolina, 2008
Submitted in Partial Fulfillment of the Requirements
For the Degree of Doctor of Philosophy in
Business Administration
Darla Moore School of Business
University of South Carolina
2016
Accepted by:
Manoj Malhotra, Major Professor
Sriram Venkataraman, Committee Member
Yan Dong, Committee Member
Paul Bliese, Committee Member
Lacy Ford, Senior Vice Provost and Dean of Graduate Studies

ii
© Copyright by Deepa Wani, 2016 All Rights Reserved.

iii
DEDICATION
To my husband, Hrishikesh and our twin daughters, Shruti and Aarushi

iv
ACKNOWLEDGEMENTS
My dissertation would not have been possible without the guidance, critical insight, and
encouragement from my advisor Dr. Manoj Malhotra. I would also like to thank Dr. Yan
Dong for his immense support and advice on a variety of research topics. My interactions
with both of them have broadened my horizons and allowed me to see things from
different perspectives. In addition, I greatly value their wisdom in various aspects of life
and I will continue to seek their advice in the future.
I thank Dr. Sriram Venkataraman for his constant support with one of my
dissertation essays and on various econometric topics. I also thank Dr. Paul Bliese for
serving as a member on my committee and taking the time to clarify statistical concepts
using simulations and graphs. I thank Dr. Mark Ferguson for his support and advice
throughout my PhD program and all other faculty members of the Moore School of
Business for having equipped me with the tools and techniques to finish my PhD program
successfully. I am grateful to Dr. Aravind Chandrasekaran and Luv Sharma for providing
useful feedback on my paper drafts. Julia Witherspoon and Scott Ranges have been
excellent resources for all my administrative needs. I also acknowledge the support of
fellow PhD students who helped make the tough task of finishing a PhD more bearable.
I would also like to thank my parents and my in-laws for their constant
inspiration. Finally, I cannot truly express how grateful I am to my husband, Hrishikesh,
for his patience, love and encouragement, and to our twin daughters Shruti and Aarushi,
for putting up with the limited amount of time that I was able to devote to them.
v
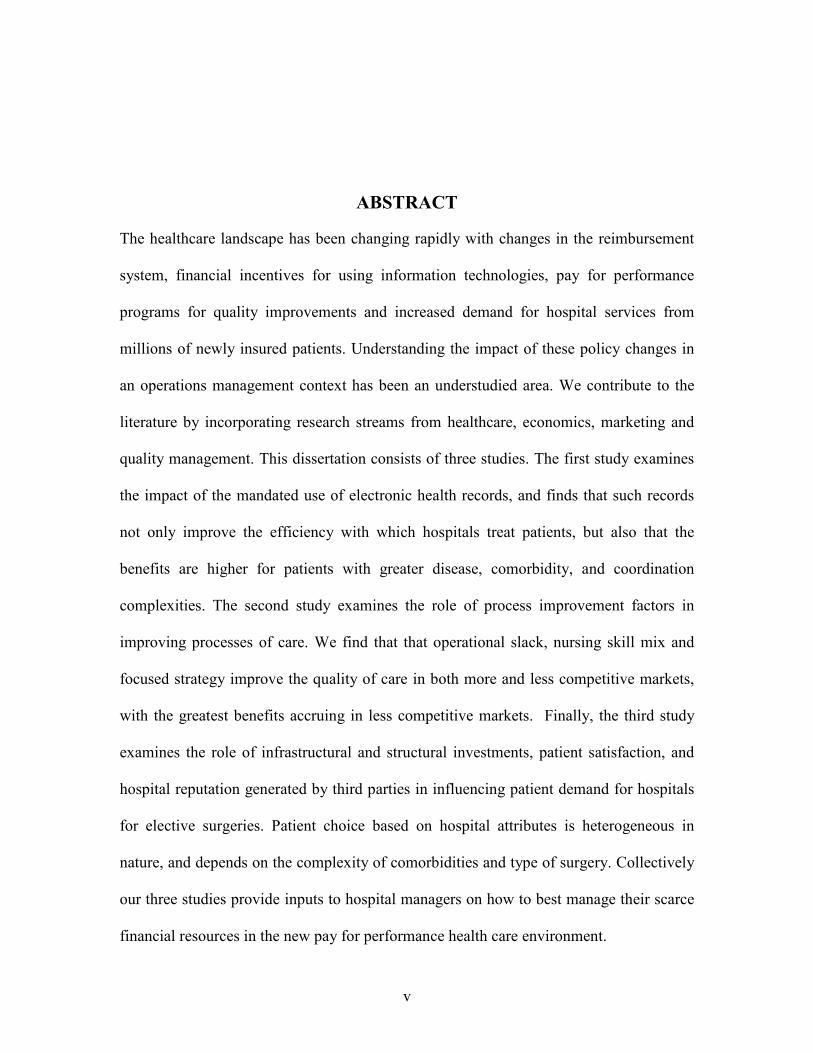
ABSTRACT
The healthcare landscape has been changing rapidly with changes in the reimbursement
system, financial incentives for using information technologies, pay for performance
programs for quality improvements and increased demand for hospital services from
millions of newly insured patients. Understanding the impact of these policy changes in
an operations management context has been an understudied area. We contribute to the
literature by incorporating research streams from healthcare, economics, marketing and
quality management. This dissertation consists of three studies. The first study examines
the impact of the mandated use of electronic health records, and finds that such records
not only improve the efficiency with which hospitals treat patients, but also that the
benefits are higher for patients with greater disease, comorbidity, and coordination
complexities. The second study examines the role of process improvement factors in
improving processes of care. We find that that operational slack, nursing skill mix and
focused strategy improve the quality of care in both more and less competitive markets,
with the greatest benefits accruing in less competitive markets. Finally, the third study
examines the role of infrastructural and structural investments, patient satisfaction, and
hospital reputation generated by third parties in influencing patient demand for hospitals
for elective surgeries. Patient choice based on hospital attributes is heterogeneous in
nature, and depends on the complexity of comorbidities and type of surgery. Collectively
our three studies provide inputs to hospital managers on how to best manage their scarce
financial resources in the new pay for performance health care environment.

vi
TABLE OF CONTENTS
DEDICATION ....................................................................................................................... iii
ACKNOWLEDGEMENTS ........................................................................................................ iv
ABSTRACT ............................................................................................................................v
LIST OF TABLES ................................................................................................................ viii
LIST OF FIGURES ................................................................................................................. ix
CHAPTER 1 INTRODUCTION ..................................................................................................1
CHAPTER 2 DOES THE MEANINGFUL USE OF ELECTRONIC HEALTH RECORDS IMPROVE
PATIENT OUTCOMES? .................................................................................................8 2.1 MOTIVATION ........................................................................................................9
2.2 MEANINGFUL USE OF ELECTRONIC HEALTH RECORDS ........................................12
2.3 LITERATURE REVIEW ..........................................................................................14
2.4 HYPOTHESIS DEVELOPMENT ...............................................................................17
2.5 DATA DESCRIPTION .............................................................................................24
2.6 ECONOMETRIC MODEL ........................................................................................31
2.7 RESULTS ..............................................................................................................34
2.8 CONCLUSIONS AND DISCUSSION ..........................................................................38
CHAPTER 3 LONGITUDINAL IMPACT OF PROCESS IMPROVEMENT ON PATIENT CARE UNDER
COMPETITION AND ACA ...........................................................................................44 3.1 INTRODUCTION ...................................................................................................45
3.2 LITERATURE REVIEW AND HYPOTHESIS DEVELOPMENT .....................................47

vii
3.3 DATA SOURCES, VARIABLES AND ECONOMETRIC MODEL ..................................58
3.4 RESULTS ..............................................................................................................65
3.5 IMPACT OF ACA ON PROCESS OF CARE AND THE ROLE OF PROCESS IMPROVEMENT FACTORS ...........................................................................................73
3.6 CONCLUSIONS AND LIMITATIONS ........................................................................75
CHAPTER 4 IMPACT OF HOSPITAL CHARACTERISTICS ON PATIENT CHOICE BEHAVIOR FOR
ELECTIVE SURGERIES ................................................................................................83 4.1 INTRODUCTION ...................................................................................................84
4.2 LITERATURE REVIEW ..........................................................................................89
4.3 HYPOTHESIS DEVELOPMENT ...............................................................................95
4.4 DATA DESCRIPTION AND ECONOMETRIC MODEL ..............................................103
4.5 EMPIRICAL SPECIFICATION OF THE DEMAND MODEL ........................................109
4.6 RESULTS ............................................................................................................113
4.7 ROBUSTNESS TEST ............................................................................................119
4.8 STUDY CONTRIBUTIONS AND CONCLUSION .......................................................120
CHAPTER 5 CONCLUSION ..................................................................................................125
REFERENCES .....................................................................................................................129
APPENDIX A – SUMMARY OF KEY PAPERS ON THE IMPACT OF EHRS AND INFORMATION
TECHNOLOGY ...................................................................................................................145
APPENDIX B – PROCESS OF CARE COMPONENTS ...............................................................147

viii
LIST OF TABLES
Table 1.1 List of Variables used in different studies within the Dissertation ......................7
Table 2.1 Descriptive Statistics of Variables used in main analysis ..................................28
Table 2.2 Hospital Level Characteristics used in selection model ....................................29
Table 2.3 Comparative Statistics for MU_EHR and non MU_EHR certified hospitals ...30
Table 2.4 Main Results ......................................................................................................35
Table 2.5 Choice Model Results ........................................................................................36
Table 2.6 Post-Hoc Results for Readmissions ...................................................................37
Table 3.1 Descriptive Statistics ..........................................................................................62
Table 3.2 Correlations ........................................................................................................63
Table 3.3 Regression Results for Process of Care Dependent Variable ............................67
Table 3.4 Robustness Test for Process of Care Dependent Variable ................................72
Table 3.5 Joint Simultaneous Impact of Competition and ACA on Process of Care ........74
Table 4.1 Summary of papers on Revealed Patient Choice ...............................................90
Table 4.2 Descriptive Statistics for Elective Hip-Knee Surgeries ...................................114
Table 4.3 Conditional Logit Estimates of Hospital Choice .............................................118
Table 4.4 Robustness Check ............................................................................................119

ix
LIST OF FIGURES
Figure 1.1 Schematic of Factors impacting Quality of Care and Patient Choice in Healthcare ............................................................................................................................2
Figure 1.2 Schematic for Study 1 ........................................................................................4
Figure 1.3 Schematic for Study 2 ........................................................................................5
Figure 1.4 Schematic for Study 3 ........................................................................................7
Figure 3.1 Theoretical Model ............................................................................................57
Figure 3.2 Impact of Process Design Factors on Process of Care in Low and High Competitive Markets ..........................................................................................................68
1
CHAPTER 1
INTRODUCTION
The national healthcare expenditure in the US reached $3.0 trillion in 2014, growing by
5.3% over the previous year (CMS.gov, A). Despite increases in healthcare spending over
many decades, the Institute of Medicine (IOM) reported that US healthcare system fails
at providing safe and effective care, and does not make the best use of its resources
(Richardson et al. 2001). Thus there is an urgent need to seek effective ways to reduce
spending while improving the quality of care. In addition, there has been an upheaval in
the way hospitals are reimbursed for their services. The traditional pay for service model
which focused on paying providers based on the volume and complexity of services was
replaced by a prospective payment system which encouraged a reduction in excessive and
unnecessary care by providing a fixed payment for services rendered (James, 2012). The
Affordable Care Act (ACA) was signed into law in 2010 to further reduce medical errors,
readmissions and mortality and at the same time promote greater coordination across
providers and reduce healthcare spending costs. Financial incentives are also built into
this Act through the value based purchasing program, which create competitive
conditions and encourage organizations to deliver efficient and high quality medical care
through appropriate investment of resources (CMS.gov, B). Hospitals also make
investments in various resources to differentiate themselves from the competition to
attract insurers, referring physicians, and patients to their hospitals. Hence this
dissertation provides insights into the role that various internal resources and external

2
factors play in improving patient quality of care. On the supply side, we contribute to
healthcare operations management research and practice by attempting to understand the
role of structural and infrastructural investments and competition in improving both
patient as well as hospital level quality outcomes. On the demand side, we contribute
through this dissertation to the understanding of how these investments help inform
patient choice of hospitals. Figure 1.1 schematically shows the factors that impact quality
of care and how and where patients choose to consume health care services.
Figure 1.1: Schematic of Factors impacting Quality of Care and Patient Choice in HealthCare
Study 1
In study 1, we look at the impact of electronic health records (EHRs) on patient level
outcomes. EHRs have the potential to transform healthcare delivery through the use of
built-in evidence based medical guidelines, and efficient coordination of patient treatment
and care. The Health Information Technology for Economic and Clinical Health
(HITECH) Act was passed in in 2009 and billions of dollars were set aside in incentives
to encourage meaningful use of these systems (HHS, 2009). However, past studies on
adoption of such EHRs have shown mixed results (McCullough et al. 2010; Miller and
Tucker 2011; Furukawa 2011; Appari et al. 2012; Dranove et al. 2012; Appari et al.
Patient and Hospital
Level Outcomes
Internal
Factors
External Factors
Patient Choice
3
2013; McCullough et al. 2013; Jones et al. 2014; Agha 2014). In this study, we posit that
hospitals that meaningfully use EHRs perform better on resource efficiency than
hospitals that just adopt such systems. Further, in a knowledge-intensive industry like
healthcare, diagnosing a patient’s condition and treating it effectively is a complex task,
considering that there are currently about 13,600 diagnoses with 6000 drugs and 4000
procedures to treat these diagnoses (The New Yorker 2011). In addition, comorbidities
such as hypertension, diabetes, obesity, etc. are increasing in the United States and
clinicians have to take these factors into consideration while designing effective
treatment plans. Task complexity has been previously identified as an important factor in
affecting performance (Payne 1976, Van de Ven and Ferry 1980, Locke et al. 1981,
Culnan 1983, Campbell and Gingrich 1986, Wood 1986, Campbell 1991, Argote et al.
1995), and this argument can be extended to treatment of patients as well. Because
information gained from information systems such as EHRs can potentially transform a
worker’s knowledge structures (Ingwersen, 1992), we posit that EHRs can help health
care providers by easing their cognitive load and providing useful information about
disease conditions and recommendations for tasks that are more complex than simpler
tasks. Using detailed patient level data, we develop various measures of patient
complexity to determine whether meaningful use of EHRs incentivized by the HITECH
Act is more effective in improving resource efficiency for complex tasks. Figure 1.2
schematically shows the model that we test in Study 1.

4
Figure 1.2: Schematic for Study 1
Study 2
Even though EHRs represent an important structural investment for hospitals, there are
other important investments that hospitals have to consider given the changing
reimbursement system within which they must function. The economics literature
suggests that increased competition improves quality (Tirole, 1988; Gaynor and Town,
2011; Gravelle et al., 2014). In the second study, we seek to understand how a shift
toward more competitive conditions for capturing patient demand affects process of care
(PoC) at the hospital level. Further, given hospitals’ financial constraints, we also seek to
understand how hospital managers should make resource allocation decisions that
improve hospital processes that ultimately improve patient outcomes. We posit that the
impact of process improvement factors will be positive in both more and less competitive
markets. However, considering that hospitals in more competitive markets make
additional investments in technology and state of the art equipment, we posit that the
marginal benefit will be stronger in less competitive markets. Accordingly, we use panel
data collected over 7 years from 2007 to 2013 and various sources such as CMS’
Hospital Compare website, California Office of Statewide Planning and Development’s
Meaningful Use of
Technology Resource Efficiency
Disease Complexity
Comorbidity Complexity
Coordination Complexity
5
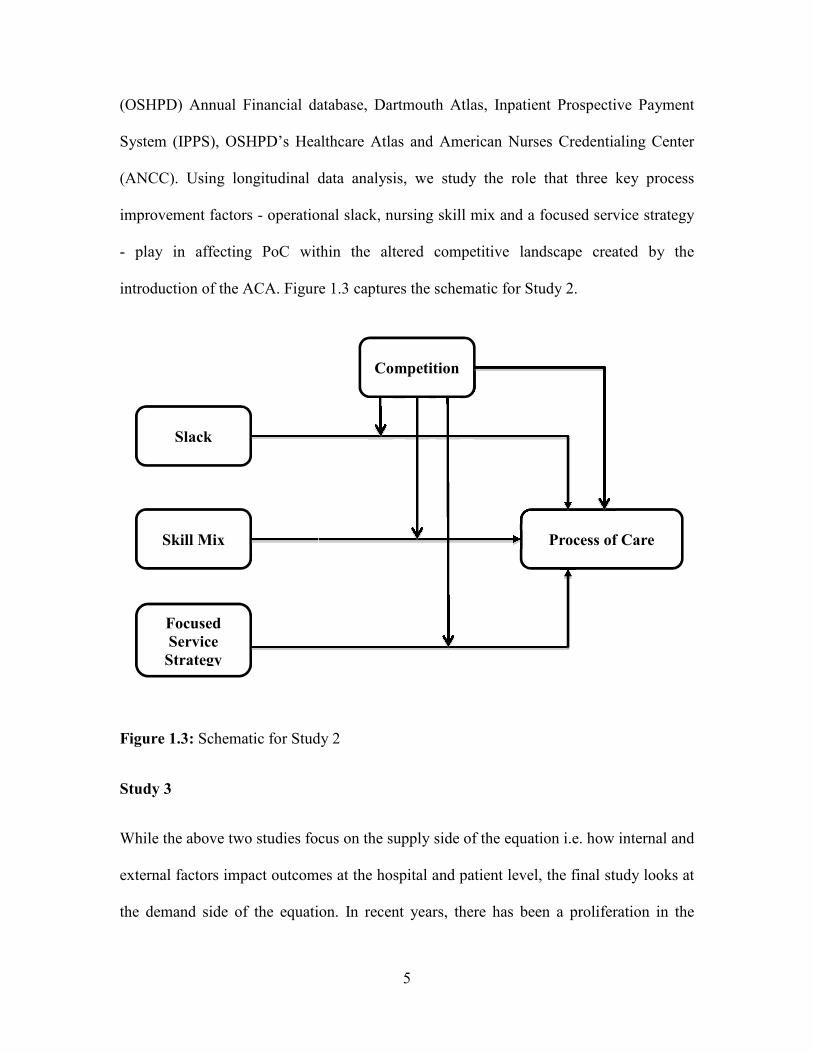
(OSHPD) Annual Financial database, Dartmouth Atlas, Inpatient Prospective Payment
System (IPPS), OSHPD’s Healthcare Atlas and American Nurses Credentialing Center
(ANCC). Using longitudinal data analysis, we study the role that three key process
improvement factors - operational slack, nursing skill mix and a focused service strategy
- play in affecting PoC within the altered competitive landscape created by the
introduction of the ACA. Figure 1.3 captures the schematic for Study 2.
Figure 1.3: Schematic for Study 2
Study 3
While the above two studies focus on the supply side of the equation i.e. how internal and
external factors impact outcomes at the hospital and patient level, the final study looks at
the demand side of the equation. In recent years, there has been a proliferation in the
Slack
Skill Mix
Focused
Service
Strategy
Process of Care
Competition

6
number of organizations that seek to signal a hospital’s reputation via ranking systems.
The government also posts information on the quality of care e.g. patient satisfaction,
timeliness of care for certain conditions, readmissions, etc. at over 4,000 hospitals via its
Hospital Compare website. As millions of newly insured people seek hospital services,
there is a need to help people make informed choices and also improve the quality of care
they provide. While reputation signaling is an external factor that may influence patient
decisions, hospitals also make several structural and infrastructural investments in order
to be more attractive to insurers, patients, and referring physicians. In this study, we seek
to understand whether such internal resource investments, perceptual patient satisfaction
or external hospital rankings are more influential in patient choice of hospitals. Further,
we investigate whether patients with greater comorbidity complexity emphasize certain
factors over others in their hospital choice decision. We focus on elective surgeries rather
than emergent conditions as patients have more time to deliberate various options of
hospitals in such cases, and hopefully make an informed choice. We posit that
fundamental hospital characteristics such as technology, registered nurse staffing, focus,
etc., along with third party reputation and patient satisfaction drive patient choice. We
also posit that the effects are likely to be heterogeneous across patients with greater
comorbidity complexity. Using a discrete choice model, this study seeks to provide
insights into patient choice behavior, and has implications for how hospitals should
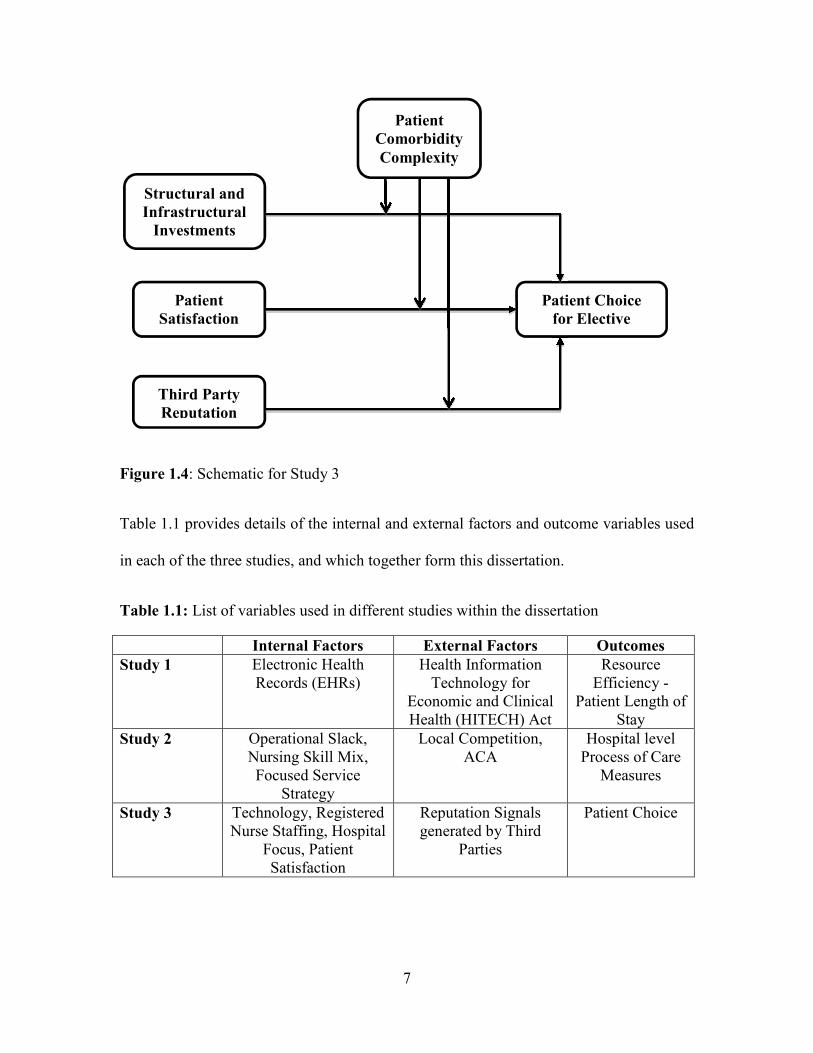
allocate their limited financial resources. Figure 1.4 provides the schematic for study 3.
7
Figure 1.4: Schematic for Study 3
Table 1.1 provides details of the internal and external factors and outcome variables used
in each of the three studies, and which together form this dissertation.
Table 1.1: List of variables used in different studies within the dissertation
Internal Factors External Factors Outcomes
Study 1 Electronic Health Records (EHRs)
Health Information Technology for
Economic and Clinical Health (HITECH) Act
Resource Efficiency -
Patient Length of Stay
Study 2 Operational Slack, Nursing Skill Mix, Focused Service
Strategy
Local Competition, ACA
Hospital level Process of Care
Measures
Study 3 Technology, Registered Nurse Staffing, Hospital
Focus, Patient Satisfaction
Reputation Signals generated by Third
Parties
Patient Choice
Structural and
Infrastructural
Investments
Patient
Satisfaction
Third Party
Reputation
Patient Choice
for Elective
Surgery
Patient
Comorbidity
Complexity
8
CHAPTER 2
DOES THE MEANINGFUL USE OF ELECTRONIC HEALTH RECORDS
IMPROVE PATIENT OUTCOMES?1
Abstract
Electronic Health Records (EHRs) have the potential to transform healthcare delivery
through the use of built-in evidence based medical guidelines, and efficient coordination
of patient treatment and care. Meaningful use of EHRs can play an especially important
role in easing a health care provider’s cognitive load while working on complex tasks. In
this study, we examine the impact of meaningful use of EHR after the mandated
HITECH (Health Information Technology for Economic and Clinical Health) Act on
patients’ length of stay (LOS) in the context of treating patients with varying dimensions
of complexity: (i) complexity arising from the treatment of a patient’s disease, (ii)
complexity arising from a patient’s comorbidities and (iii) complexity arising from
coordination required from various healthcare providers to treat the patient’s disease. We
conduct our analysis by using a large-scale dataset with detailed patient level data from
acute care hospitals in California that is coupled with relevant data from several other
sources. After accounting for self-selection bias, our analysis reveals that meaningful use
of EHRs reduces the overall LOS by about 9%; and that the magnitude of this effect is
greater for patients with higher disease and comorbidity complexity and for patients with
1 Wani, D. and M. Malhotra. To be submitted to Manufacturing and Service Operations Management

9
higher coordination needs. Further, these changes in LOS do not come at the expense of
increased readmissions. In fact, we find an overall decrease in readmissions and a greater
reduction in readmissions for patients with a higher disease and coordination complexity
profile. Apart from theoretical contributions, practical implications of these results are
also discussed.
Keywords: Electronic Health Records, Healthcare, Meaningful Use of Technology, Task
Complexity, Length of Stay
2.1 Motivation
The importance and benefits of information technology (IT) in improving the efficiency
and quality of customer-facing operations has been highlighted in previous literature
(Froehle and Roth 2004). Firms in industries such as telecommunications, retail, etc. have
seen benefits as a result of widespread use of IT throughout their organizations (Bower,
2005). Healthcare, which comprises nearly 20% of the gross domestic product (Berwick
and Hackbarth, 2012), has also adopted various information technologies but none have
received the kind of scrutiny that electronic health records (EHRs) have received.
Researchers generally agree that electronic health records (EHRs) have the potential to
transform healthcare delivery through the use of evidence based medical guidelines and
efficient coordination of patient treatment and care (Jha et al., 2009, Blumenthal and
Tavenner, 2010). Despite EHRs’ potential to improve the efficiency and effectiveness of
care, its adoption has been notoriously slow among U.S. hospitals, with less than 10% of
U.S. hospitals reporting a comprehensive EHR system across all clinical units in 2009
(Jha et al., 2009). Studies using large scale data in the healthcare and economics literature
10
that evaluate the impact of adoption of EHRs on various outcomes such as process
quality, mortality and cost have yielded mixed results (See Appendix A). In order to
overcome barriers and accelerate the adoption of EHRs, the Obama Administration
introduced the HITECH Act in 2009 (HHS, 2009). Under this Act, the government
committed $27 billion to incentivize hospitals and clinicians to adopt and meaningfully
use EHRs. The government set a high bar in this Act on healthcare providers to improve
quality through the use of scientifically supported decision support systems and sharing
of data to reduce costs. While the government mandate may encourage hospitals to adopt
and use EHRs, can these systems really improve patient outcomes given that past large
scale studies have not found overwhelming support from the adoption of EHRs on
outcomes?
The main goal of our paper is to investigate whether a hospital wide meaningful use
of EHRs, arising from the passage of the HITECH Act, has improved the effectiveness
with which hospitals treat patients. This is important to investigate because in a
knowledge-intensive industry like healthcare, diagnosing a patient’s condition and
treating it effectively is a complex task due to the fact that there are currently about
13,600 diagnoses with 6000 drugs and 4000 procedures to treat these diagnoses (The
New Yorker 2011). In addition, comorbidities such as hypertension, diabetes, obesity,
etc. are increasing in the United States, and clinicians have to take these factors into
consideration while designing effective treatment plans. Given the heterogeneity and
complexity that healthcare providers face, does the meaningful use of EHRs (henceforth
called MU_EHR) add any value so that patients are treated more efficiently? Does the
value of MU_EHR increase with increasing patient complexity? We conduct a thorough
11
examination of the arguments that associate meaningful use of EHRs with improved
operating efficiency.
One of the key challenges in measuring the effect of MU_EHR on patient outcomes is
the presence of self-selection bias that requires us to model a hospital’s decision to go for
meaningful use sooner rather than later. It is possible that hospital factors associated with
earlier adoption of such EHRs may play a role in earlier attestation of meaningful use of
EHRs. Financial incentives also get progressively lower if hospitals delay attestation for
MU_EHR. Without controlling for this endogenous selection process, the impact of
MU_EHR on outcomes may be biased. In our analysis, we propose a two-stage
framework that explicitly deals with the endogeneity inherent in self-selecting to attest
for meaningful use sooner. Our econometric model of patient length of stay and
readmission is based on detailed patient data from acute care hospitals in California in
2012, a new dataset made available from the Medicare EHR Incentive Program, and data
from various other sources. Our model and related analysis offers a new perspective on
this issue, which has captured the attention of healthcare providers, policy makers, and
academicians over the last few years.
After accounting for self-selection in the EHR incentive program, our results show
that patients treated at hospitals that have undertaken MU_EHR attestation have about a
9% lower length of stay as compared to patients that are treated at hospitals that have not
undertaken MU_EHR attestation. Thus MU_EHR helps in treating patients with greater
efficiency as measured by patient length of stay (LOS). Second, we find that MU_EHR
further helps in reducing LOS for patients with higher complexities. Third, we show that
a reduction in LOS is not at the expense of increased readmissions. We attribute these

12
results to the fact that meaningfully using EHRs helps in providing the right treatment at
the right time and in the right amount as healthcare providers can gain relevant
information about disease conditions by accessing the embedded knowledge base, which
results in improved medical decision making (Bulkley and Van Alstyne 2004).
The remainder of our paper is organized as follows: In section 2.2, we discuss the
problem background on the meaningful use of EHRs followed by a review of the relevant
literature in section 2.3. Our hypotheses are described in section 2.4. Data description and
econometric model used in this paper are in sections 2.5 and 2.6 respectively. We present
our results and post-hoc tests in section 2.7. We finally conclude with a discussion of
implications for research and practice in section 2.8.
2.2 Meaningful Use of Electronic Health Records
The implementation of EHRs has been very slow, with less than 10% of hospitals
reporting a comprehensive EHR system by the end of 2009 (Jha et al. 2009). The
HITECH Act was passed in October 2010 to encourage hospitals to not just adopt EHRs
but also meaningfully use them. Full details of the MU_EHR program can be found here
(https://www.healthit.gov/providers-professionals/how-attain-meaningful-use), but we
provide a brief summary next.
The MU_EHR initiative is rolled out in three stages. In the first stage, which is
the focus of this paper, hospitals have to “successfully attest to demonstrating meaningful
use of certified EHRs to qualify for an incentive payment scheme through the Medicare
EHR program administered by the Centers for Medicare and Medicaid Services (CMS)”
(Healthit.gov). Hospitals have to demonstrate use of EHRs at the hospital-wide level to
13
receive financial incentives. This use includes capturing patient information
electronically in a standardized format, using patient information to track key clinical
conditions, communicating the information to all providers for the purposes of care
coordination, initiating reporting of key clinical quality measures, and finally using the
information to engage families and patients in their care. For the successful attestation of
first stage of MU_EHR, hospitals are also required to maintain a current list of diagnosis,
maintain active medication and allergy lists, implement drug-drug and drug-allergy
checks for at least 80% of their patients, record vital statistics and demographics, enter
medication orders electronically, and provide electronic copy of health records and
discharge instructions for at least 50% of the patients. Based on the certification
requirements, MU_EHR depends not only on demonstrating the successful adoption of
EHRs from certified vendors, but also on demonstrating the actual use of the system
through a series of measures developed by the government. Finally, incentives get
progressively lower if hospitals delay attestation of MU_EHR. For example, hospitals
that attested meaningful use in 2011 received 100% of the incentive payments that can be
anywhere between $2 million to $10 million depending on the size of the hospital (Jha,
2010). Incentive payments get progressively lower to 75%, 50% and 25% in the later
years. Hospitals also lose 1% of their Medicare reimbursements, which can grow each
year up to a maximum of 5%, if they fail to achieve stage 1 certification for each year
beyond 2015. Thus it is in the hospitals’ best interest to successfully attest for MU_EHR
as soon as possible, while also being cognizant of the impact of information technology
and EHRs on patient outcomes. This MU_EHR program gives us a way to clearly
identify hospitals that are using EHRs meaningfully through well-defined criteria.
14
2.3 Literature Review
In this section, we preview existing work in the area of information technology and EHRs
in particular. Although several studies in the operations management literature have
looked at the effect of either IT investments or technologies on various patient outcomes,
to the best of our knowledge, none have looked at the impact of meaningful use of EHRs
on patient outcomes arising from a mandate. Examining the literature more holistically
enables us to identify the gaps and also highlight the importance and need for this study.
2.3.1 Impact of Information Technology on Patient Outcomes
At the hospital level, studies in the OM and IT literature have looked at the impact of IT
on outcomes. Angst et al. (2011) and Angst et al. (2012) find a positive outcome between
IT adoption and dependent metrics of costs and quality. Devaraj et al. (2013) look at the
impact of investments in strategic, clinical and administrative IT on revenue and
mortality rate. Sharma et al. (2016) look at the effect of clinical and augmented clinical
health information technology on patient satisfaction and cost measures. Queenan et al.
(2011, 2016) examine the impact of computerized physician order entry systems and IT
investments on patient satisfaction and other patient safety dimensions, while Aron et al.
(2011) focus on the impact of systems automation on medical errors. These studies are
summarized in Table A of the Appendix.
Most of these studies look at a wide variety of technologies, so it is difficult to
understand the specific benefits that accrue from adopting a specific technology. Also,
most of these studies focus on hospital level outcomes reported by CMS that are
restricted to the Medicare population, but do not apply to general population level
15
outcomes. Finally, all these studies examine outcomes under a scenario where adoption is
self-reported and voluntary. We overcome the drawbacks of previous studies by
narrowing our focus to a specific bundle of technologies as defined by MU_EHR (which
we explain in more detail in section 4.1), and discussing the specific mechanisms through
which information technology impacts patient outcomes and examining its impact on
heterogeneous patient types. This is important because hospitals would like the benefits
of expensive IT systems to accrue to all patients rather than to specific segments of the
patient population. Finally, we focus on patient outcomes when hospitals are mandated to
use technology through an Act rather than voluntarily using it. Although Devaraj and
Kohli (2003) study the effect of actual use of a basic technology on hospital level
mortality and revenue, we believe that our study is different in several ways. First, we
consider the meaningful use of technology under a major policy change that affects all
hospitals in the US. This is significant because the motivation, challenges and barriers to
usage are very different now than when only a small group of hospitals participated
voluntarily in their study. Second, our paper is more nuanced and in-depth as it not only
evaluates how technology impacts a patient’s length of stay, but also studies the
contingent impact of task complexity on the relationship between MU_EHR and length
of stay.
2.3.2 Impact of Electronic Health Records on Patient Outcomes
There are numerous studies in the economics and healthcare literature documenting the
effect of electronic health record (EHRs) and electronic medical record (EMRs) adoption
on outcomes. We focus on only large-scale empirical studies, and ignore single site or
16
case studies because they are too numerous to summarize in a single paper (See Table A).
There has been little consensus on the measurement of health information technologies in
the past literature. EHR adoption has been measured in several ways such as a generic
electronic medical record (EMR) adoption (Miller and Tucker 2011; Furukawa 2011),
EMR (Electronic medical record), and CDS (clinical decision support) adoption (Agha
2014), eMAR (electronic medical administration record) and CPOE (computerized
physician order entry) adoption (Appari et al. 2012), EHR and CPOE adoption
(McCullough et al. 2010; McCullough et al. 2013), or all functionalities including CDR,
CDS, eMAR and CPOE adoption (Dranove et al. 2012; Appari et al. 2013; Jones et al.
2014). There are also differences in the way patient outcomes are measured; however
process quality, mortality and cost have received the most attention. Results have been
mixed - EHRs improve some process quality measures (McCullough et al. 2010; Appari
et al. 2013) and patient safety indicators (Hydari et al. 2014), but do not improve
mortality, readmissions (McCullough et al. 2013; Agha 2014), costs (Agha 2014;
Dranove et al. 2012), or efficiency (Lee et al. 2013). These studies are again summarized
in Table A of the Appendix.
Given that the reference technologies and outcome are different in different studies, it
is difficult to interpret and reconcile differences in outcomes between these studies that
have been conducted using data prior to 2010. These studies also predate the government
mandate on meaningful use of EHRs, and as such leave open the question of whether
patient outcomes resulting from MU_EHR has changed materially since the mandate was
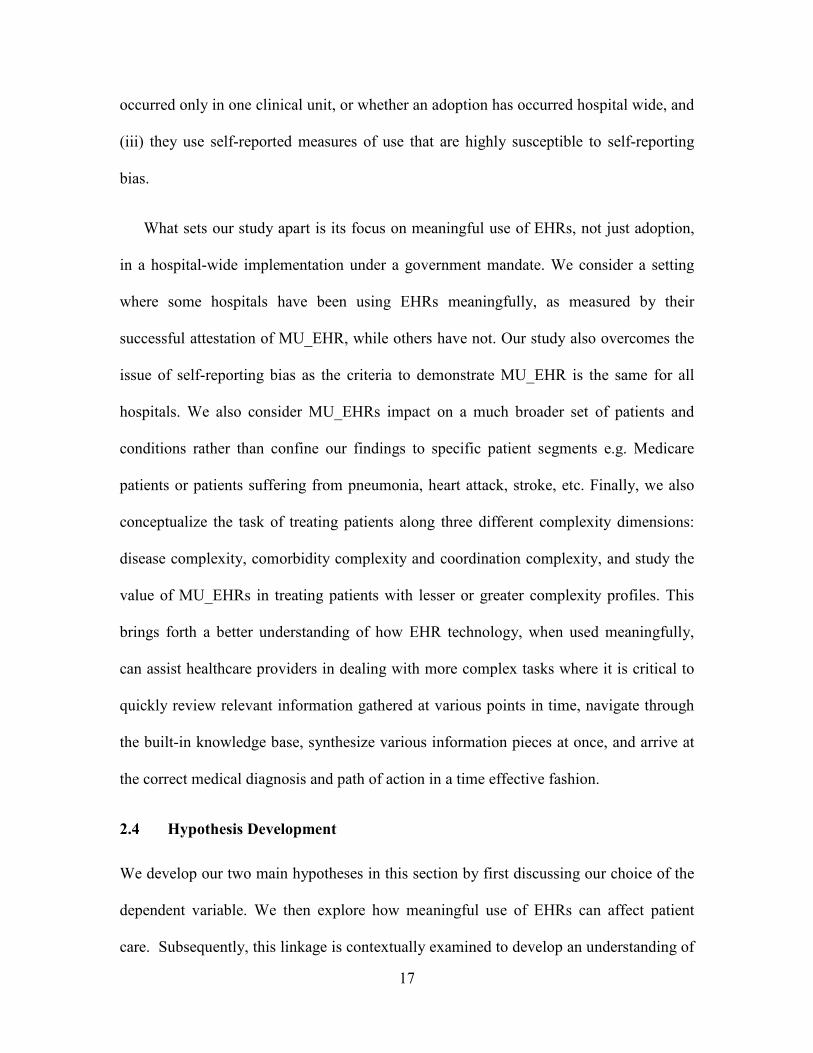
signed in October 2010. Other major issues with these prior studies are as follows: (i)
they capture adoption and not actual use of IT, (ii) it is unclear whether the adoption has
17
occurred only in one clinical unit, or whether an adoption has occurred hospital wide, and
(iii) they use self-reported measures of use that are highly susceptible to self-reporting
bias.
What sets our study apart is its focus on meaningful use of EHRs, not just adoption,
in a hospital-wide implementation under a government mandate. We consider a setting
where some hospitals have been using EHRs meaningfully, as measured by their
successful attestation of MU_EHR, while others have not. Our study also overcomes the
issue of self-reporting bias as the criteria to demonstrate MU_EHR is the same for all
hospitals. We also consider MU_EHRs impact on a much broader set of patients and
conditions rather than confine our findings to specific patient segments e.g. Medicare
patients or patients suffering from pneumonia, heart attack, stroke, etc. Finally, we also
conceptualize the task of treating patients along three different complexity dimensions:
disease complexity, comorbidity complexity and coordination complexity, and study the
value of MU_EHRs in treating patients with lesser or greater complexity profiles. This
brings forth a better understanding of how EHR technology, when used meaningfully,
can assist healthcare providers in dealing with more complex tasks where it is critical to
quickly review relevant information gathered at various points in time, navigate through
the built-in knowledge base, synthesize various information pieces at once, and arrive at
the correct medical diagnosis and path of action in a time effective fashion.
2.4 Hypothesis Development
We develop our two main hypotheses in this section by first discussing our choice of the
dependent variable. We then explore how meaningful use of EHRs can affect patient
care. Subsequently, this linkage is contextually examined to develop an understanding of
18
how different dimensions of task complexity impact the relationship between MU_EHR
and patient care.
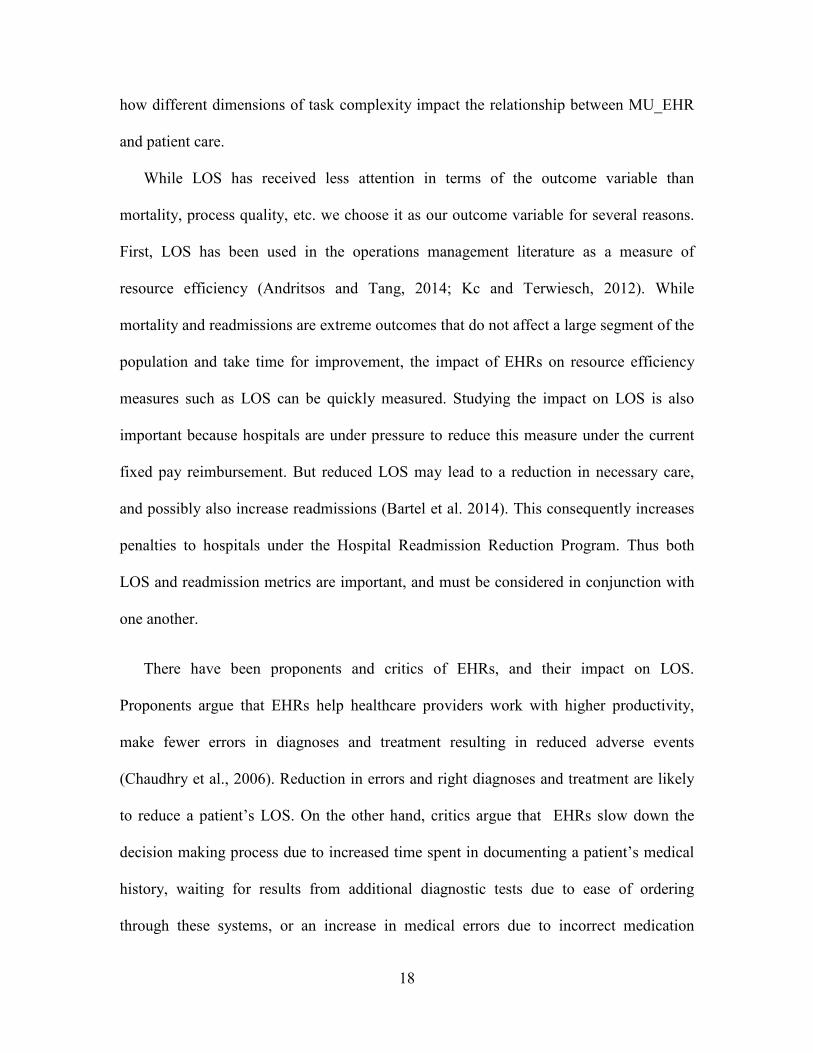
While LOS has received less attention in terms of the outcome variable than
mortality, process quality, etc. we choose it as our outcome variable for several reasons.
First, LOS has been used in the operations management literature as a measure of
resource efficiency (Andritsos and Tang, 2014; Kc and Terwiesch, 2012). While
mortality and readmissions are extreme outcomes that do not affect a large segment of the
population and take time for improvement, the impact of EHRs on resource efficiency
measures such as LOS can be quickly measured. Studying the impact on LOS is also
important because hospitals are under pressure to reduce this measure under the current
fixed pay reimbursement. But reduced LOS may lead to a reduction in necessary care,
and possibly also increase readmissions (Bartel et al. 2014). This consequently increases
penalties to hospitals under the Hospital Readmission Reduction Program. Thus both
LOS and readmission metrics are important, and must be considered in conjunction with
one another.
There have been proponents and critics of EHRs, and their impact on LOS.
Proponents argue that EHRs help healthcare providers work with higher productivity,
make fewer errors in diagnoses and treatment resulting in reduced adverse events
(Chaudhry et al., 2006). Reduction in errors and right diagnoses and treatment are likely
to reduce a patient’s LOS. On the other hand, critics argue that EHRs slow down the
decision making process due to increased time spent in documenting a patient’s medical
history, waiting for results from additional diagnostic tests due to ease of ordering
through these systems, or an increase in medical errors due to incorrect medication
19
guidelines (Koppel et al., 2005; Vartak et al., 2009). Either an increase in the number of
tests or an increase in errors resulting in rework on the patient will increase a patient’s
LOS. In either case, MU_EHR is likely to have an impact on patient’s LOS. As LOS is a
direct reflection of the quality and cost of care, we use this as our focal metric to study
the impact of MU_EHR. Even though it is not a part of the main hypotheses, our study
also looks at whether reducing LOS compromises readmissions for patients because any
efforts made by hospitals to improve LOS should also ensure that they do not lead to
increased readmissions. This link has not been previously studied in the context of
meaningful use of EHRs.
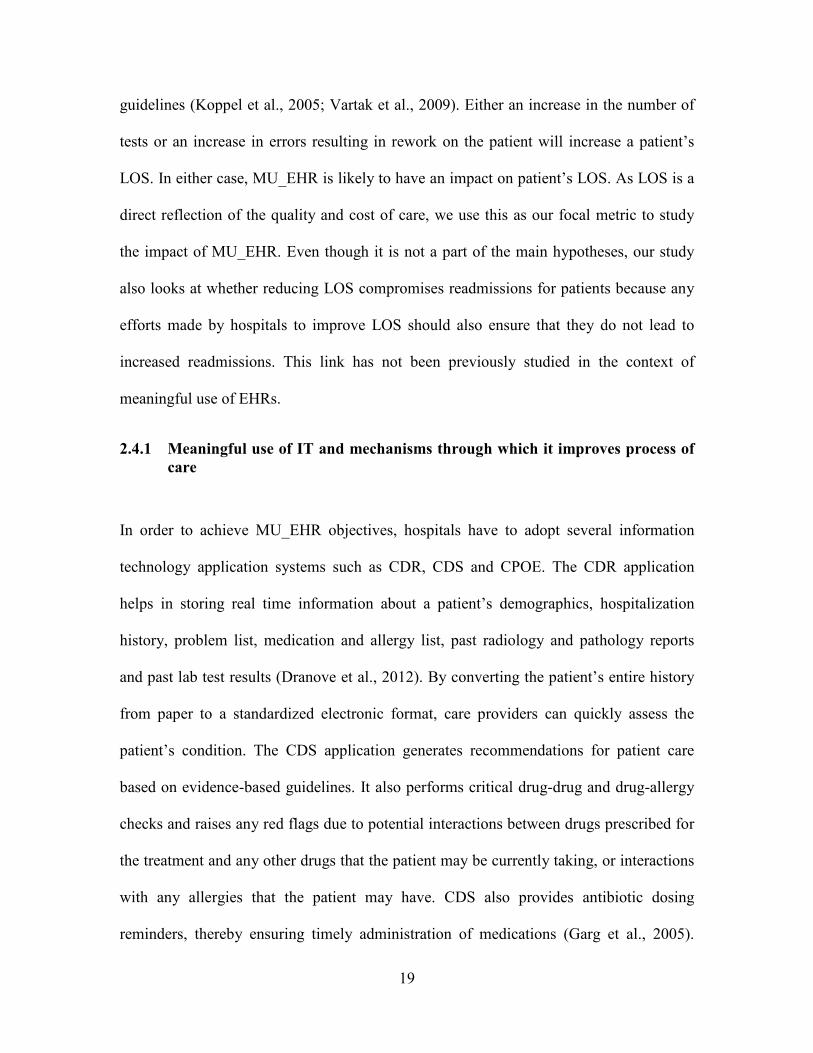
2.4.1 Meaningful use of IT and mechanisms through which it improves process of
care
In order to achieve MU_EHR objectives, hospitals have to adopt several information
technology application systems such as CDR, CDS and CPOE. The CDR application
helps in storing real time information about a patient’s demographics, hospitalization
history, problem list, medication and allergy list, past radiology and pathology reports
and past lab test results (Dranove et al., 2012). By converting the patient’s entire history
from paper to a standardized electronic format, care providers can quickly assess the
patient’s condition. The CDS application generates recommendations for patient care
based on evidence-based guidelines. It also performs critical drug-drug and drug-allergy
checks and raises any red flags due to potential interactions between drugs prescribed for
the treatment and any other drugs that the patient may be currently taking, or interactions
with any allergies that the patient may have. CDS also provides antibiotic dosing
reminders, thereby ensuring timely administration of medications (Garg et al., 2005).
20
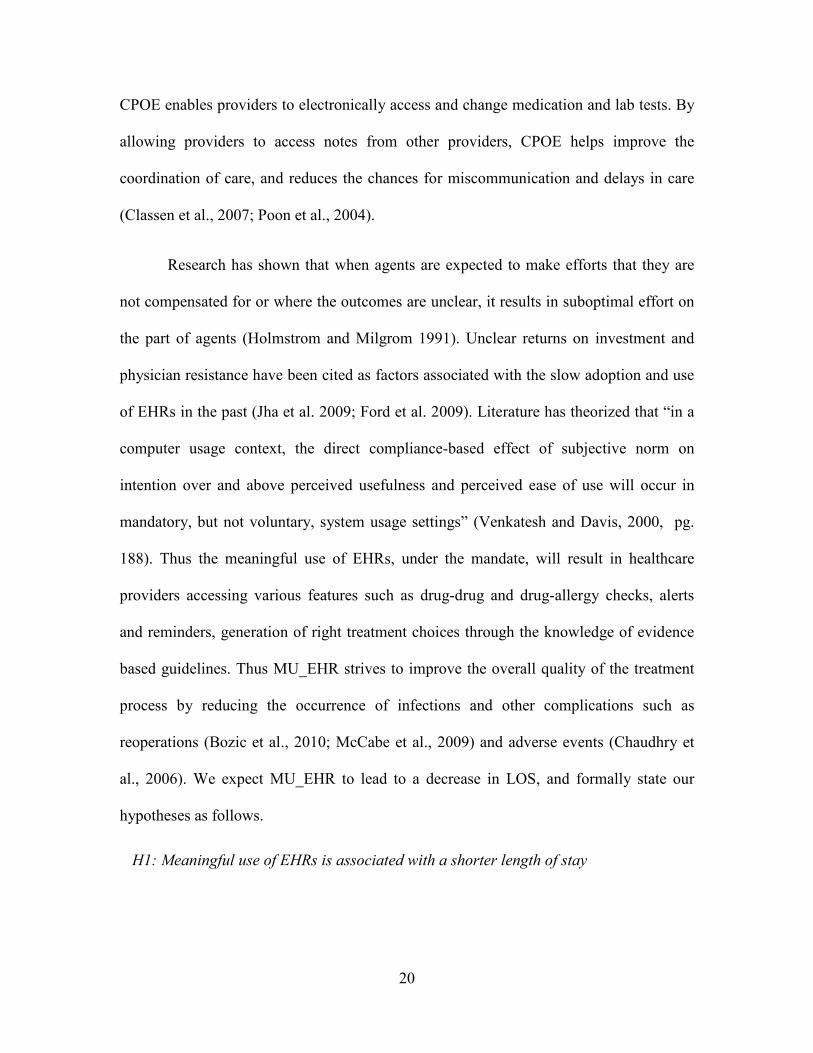
CPOE enables providers to electronically access and change medication and lab tests. By
allowing providers to access notes from other providers, CPOE helps improve the
coordination of care, and reduces the chances for miscommunication and delays in care
(Classen et al., 2007; Poon et al., 2004).
Research has shown that when agents are expected to make efforts that they are
not compensated for or where the outcomes are unclear, it results in suboptimal effort on
the part of agents (Holmstrom and Milgrom 1991). Unclear returns on investment and
physician resistance have been cited as factors associated with the slow adoption and use
of EHRs in the past (Jha et al. 2009; Ford et al. 2009). Literature has theorized that “in a
computer usage context, the direct compliance-based effect of subjective norm on
intention over and above perceived usefulness and perceived ease of use will occur in
mandatory, but not voluntary, system usage settings” (Venkatesh and Davis, 2000, pg.
188). Thus the meaningful use of EHRs, under the mandate, will result in healthcare
providers accessing various features such as drug-drug and drug-allergy checks, alerts
and reminders, generation of right treatment choices through the knowledge of evidence
based guidelines. Thus MU_EHR strives to improve the overall quality of the treatment
process by reducing the occurrence of infections and other complications such as
reoperations (Bozic et al., 2010; McCabe et al., 2009) and adverse events (Chaudhry et
al., 2006). We expect MU_EHR to lead to a decrease in LOS, and formally state our
hypotheses as follows.
H1: Meaningful use of EHRs is associated with a shorter length of stay

21
2.4.2 Impact of MU_EHR when Task of Treating Patients is More Complex
Task complexity has been identified as an important factor affecting performance in
various settings such as organizational studies, information seeking studies,
psychological studies, etc. (Payne 1976, Van de Ven and Ferry 1980, Locke et al. 1981,
Culnan 1983, Campbell and Gingrich 1986, Wood 1986, Campbell 1991, Argote et al.
1995). Task complexity determines the information processing behavior, cognitive load
and decision making process of a person or a team (Campbell, 1988), and is often divided
into objective and subjective task complexities. Liu and Li (2012) provide a review on
task complexity.
In our paper, we focus on objective task complexities that are related to task
characteristics, and independent of the characteristics of the person who performs the
task. Task complexity can arise due to several factors: the number of distinct acts and
information cues that have to be processed, the amount of coordination required, and the
relationship between task inputs that have to be taken into account in order to complete
the task (Wood, 1986; Campbell, 1988). As the complexity of the task increases via the
amount of information that needs to be processed, it puts a larger information load on a
person’s memory and attention. It forces humans to put greater cognitive resources to use
in such situations, which in turn may force people to either make tradeoffs between the
time required to make a decision and the decision accuracy, or to make suboptimal
decisions (Johnson and Payne, 1985; Milkman et al., 2009).
In our study, we consider treating the patient as the main task. Given that patient
diagnosis and treatment are complex tasks, several mental processes have to be
synchronized in order to provide the best outcomes. In healthcare, complexity can arise in
22
various forms. For example, performing a coronary artery bypass grafting procedure is
more complex than treating a fractured bone. The former involves more critical steps
such as ensuring that the correct drugs are administered before and after surgery, the
necessary checklists are followed, correct tests are performed before and after surgery,
etc. Thus more complex procedures require care providers to access and keep track of a
greater amount of information. As the amount of patient information that needs to be
processed increases, the knowledge and memory requirements to perform the task also
increases because the care provider must process all this information at once and arrive at
the best course of action (Chandler and Sweller, 1991). Presence of comorbidities such as
hypertension, diabetes and obesity are known to increase post-operative complications
and discharge decisions in patients undergoing shoulder, hip or knee surgery (Jain et al.
2005). When care providers encounter such patients, their treatment decision will depend
on several factors such as selection of the right treatment drugs, deciding the correct
amount of drug dosage, the method of drug administration, potential drug interactions,
and the duration of the treatment. Thus cognitive requirements would increase as
comorbidities that a person arrives with increases. Finally, some tasks require greater
coordination in the timing and sequencing of activities than others (Wood 1986, Braarud
and Kirwan 2011). As the steps involved in performing a task become more
interconnected, people who perform the later steps in the execution of a given task will
have to learn based on the information provided by the previous steps. The right
information on treatment plans, dosing schedules, and other protocols have to be
communicated to all parties involved to avoid errors such as performing surgery on the
wrong part of the body, overdosing, etc. (Seiden and Barach, 2006). Further, treatment
23
notes and instructions written by various clinical specialists have to be made available to
all care providers, especially during handoffs (Solet et al., 2005). Thus greater
coordination implies that greater amount of information has to be formally exchanged
among the involved agencies.
Typically, doctors and nurses are trained to diagnose problems and identify patterns
of symptoms, and this ability gets better with experience (Elstein and Schwarz, 2002).
However, when a clinician encounters complex cases, it is possible that his or her ability
to make good decisions becomes compromised under high cognitive load. This can lead
to poorer decision-making, improper medications, failure to treat all accompanying
conditions, etc. (Burgess, 2009; Parchman et al., 2007; Redelmeier et al., 1998). This
issue is further complicated in hospitals where providers encounter patient heterogeneity,
and may have to accommodate interruptions and unscheduled requests that may increase
the time required to complete the job as providers have to revisit task details (Froehle and
White 2013).
Previous literature has shown that (1) The correct fit between task and technology
is critical in predicting the success of information technology and that (2) Fit is
determined by the interaction between the characteristics of task and technology (Cooper
and Zmud, 1980, DeSantis and Poole, 1994, Goodhue 1995, Goodhue and Thompson
1995, Zigurs and Buckland 1998, Dennis et al. 2001, Banker et al. 2002). It has also been
suggested that group decision support systems technology may work better for complex
tasks as compared to simple tasks (Dennis and Gallupe, 1993). In the case of complex
tasks, technology that provides rich information, clarifies task assignment, supports
communication, and enables feedback results in better performance (Andres and Zmud,

24
2002; Gebauer et al., 2005; Ren et al. 2008). A pioneering study conducted by Autor et
al. (2003) on the effect of computerization across multiple industries suggests that
information technology can “complement workers in executing non-routine tasks
demanding flexibility, creativity, generalized problem-solving capability and complex
communications”. Mapping these results to the healthcare settings, it is plausible that key
features of EHRs such as checking for drug-drug or drug-allergy interactions, referring to
treatment guidelines, ordering additional tests, communicating with other physicians, etc.,
that are mandated to be used in a meaningful way, may possibly add more value when
tasks are non-routine and more complex as argued by Autor et al. (2003). We can view
MU_EHR as a group decision support system comprising of a set of technologies such as
CDR, CDSS and CPOE. As information on disease conditions, treatment protocols, and
checks for drug-drug and drug-allergy interactions are embedded into these group support
systems, providers can quickly and easily navigate this knowledge database for more
complex tasks and accrue larger benefits for higher complexity patients. Thus we
hypothesize:
H2: While meaningful use of EHRs will reduce length of stay for all patients, the
magnitude of effect will be larger for high complexity patients than for low
complexity patients
2.5 Data Description
Our study looks at the impact of MU_EHR on patient LOS, and further argues that
magnitude of effect will be greater for higher complexity patients. Our first source of data
25
comes from California’s Office of Statewide Health Planning and Development
(OSHPD) for the year 2012. This dataset contains detailed patient level discharge records
and includes information on patient demographics (e.g. age, gender, race and insurance),
dates of admission, procedures and discharge, diagnosis related group (DRG) codes and
type of procedures conducted. To identify hospitals that are meaningfully using EHRs,
we use a brand new dataset from the Medicare EHR Incentive program which provides
the year in which hospitals successfully attested for stage 1 of meaningful use across all
years (https://www.cms.gov /Regulations-and-Guidance/Legislation/ EHR Incentive
Programs/ DataAndReports.html). It should be noted that hospitals have to attest each
year to meaningful use to receive incentive payments. So when hospitals attest
successfully in 2011, the first year of attestation, they also have to attest in the later years
thus ensuring continued meaningful use. Our measure for hospitals that achieved
meaningful use of EHRs in 2011 is a binary 0/1 measure. While this measure may seem
trivial at the surface, it should be noted that in order to successfully attest to meaningful
use and receive incentives under the program, hospitals must achieve 14 core meaningful
use objectives and 5 out of 10 menu meaningful use objectives. Each objective is
accompanied with a very specific measure (Blumenthal and Tavenner 2010), and a
hospital can successfully attest to meaningful use only if it meets all requirements. Thus,
under the binary 0/1 measure for MU_EHR, there is an underlying continuous score on
which hospitals are measured. The commonly used Healthcare Information and
Management Systems (HIMSS) dataset in previous studies provides a measure of
whether EHR systems such as CDS, CDR, CPOE, etc. have been adopted or not, not the
actual use of these systems. In contrast, using this new dataset gives us confidence that
26
we are capturing not just adoption but also meaningful use of EHRs. Out of the 300+
nonfederal short-term acute care hospitals in California, 60 had attained meaningful use
in 2011. We join these two datasets using the unique CMS ID number. We would like to
highlight two points here. First, we ensure that hospitals that had undergone meaningful
use attestation in 2011 also did so in 2012. Second, we choose to study the performance
of 2011 meaningful use attested hospitals using 2012 data as it would ensure that we are
measuring the longer-term stable efficiency effects after the phase of learning and
recovery has taken place (Bhargava and Mishra 2014).
Our dependent variable is patient length of stay (LOS) from admission until
discharge. This measure is provided in the OHSPD dataset. The LOS in our dataset is an
integer value, and ranges from 1 day to 35 days for 99% of the observations, but the
distribution is right skewed. To adjust for this skew and ensure normality, we take the
natural log transformation.
We conceptualize three types of task complexity. Disease complexity arises from
how complex it is to treat the disease itself. Complex diseases consume greater resources
and require a greater number of steps to be performed in order to achieve the task
(Campbell, 1988; Wood, 1986). CMS assigns a relative weight to each DRG code that
reflects the resource consumption by each DRG. More complex procedures consume
more resources and are assigned higher weights. For example, coronary bypass with
cardiac catheterization is a more complex procedure with a weight of 5.4, while treatment
of a femur fracture is a relatively simple procedure and is assigned a weight of 1.19. DRG
weights range from 0 to 24 in the CMS dataset, and are available from CMS
(https://www.cms.gov/Medicare/Medicare-Fee-for-Service-Payment/ AcuteInpatientPPS

27
/FY-2012-IPPS-Final-Rule-Home-Page-Items/ CMS1250507.html). We join the dataset
containing patient level data and MU_EHR certification data with the DRG weights
dataset using a unique CMS Medicare identifier number.
Comorbidity complexity refers to the number of pieces of information about the
patient that need to be processed in order to complete the task of treating the patient
(Wood, 1986). We calculate this as an Elixhauser severity score based on literature
(Berry Jaeker and Tucker 2016). This score is calculated using two pieces of information
about a patient: (i) information on the Elixhauser Index which is a vector of 29 different
variables where each variable is binary in nature and represents the presence of a specific
comorbidity with a value of 1 and 0 otherwise and (ii) information on the severity score
on each comorbidity, ranging from -7 to 12 with larger weights representing more severe
comorbidities (Elixhauser et al. 1998). Thus the Elixhauser severity score is the dot
product of the Elixhauser Index and the severity score. Information on comorbidities is
provided in the OSHPD database. We convert the comorbidity description as a 0/1 binary
variable, and use the severity score published in literature (Elixhauser et al. 1998) to
arrive at the severity score for each patient. The scores in our sample range from -18 to
60.
Finally, we define and capture a new complexity variable associated with
coordination requirements, and name it Coordination Complexity. This represents the
total number of procedures done on a patient for diagnostic or exploratory purposes or
necessary to take care of a complication rather than one performed for definitive
treatment. Thus greater amount of information has to be formally exchanged among the
involved agencies which may have implications for developing treatment plans and

28
medication types, treating the right part of the body, etc. (Seiden and Barach, 2006). The
OSHPD database provides information on up to 21 procedures performed on a patient
besides the main procedure that was performed for definitive treatment. We sum up the
procedures done on each patient to arrive at our measure of coordination complexity.
We also control for various characteristics such as patient age (years), gender
(female = 1, male = 0), race (three categories), insurance type (Medicare, Medicaid,
Private, Self-pay), admission type (unscheduled = 1, scheduled = 0), day of admission
(weekend = 1, weekday = 0), month of admission, major diagnostic codes, and hospital
fixed effects. We drop observations with missing data on any of the control variables.
We delete observations with incorrect dates e.g. discharge date before the admission date,
procedure dates before the admission date as these were listed with negative LOS in the
OSHPD dataset. We also consider only 99% of the observations, as the remaining 1% of
the observations have very high LOS (several values ranged from 100 to 1000 days,
possibly due to data entry errors) and which can potentially result in a highly skewed
distribution. Joining the various datasets described above results in 2.20 million patient
records. A summary of the variables described above is given in Tables 2.1 and 2.2
Table 2.1: Descriptive Statistics of Variables used in main analysis
Variables Mean Std. Deviation Minimum Maximum
LOS 4.314 4.566 1 35
Readmission 0.104 0.305 0 1
Disease Complexity 1.465 1.549 0 24
Comorbidity Complexity 3.241 5.937 -18 60
Coordination Complexity 2.534 2.145 1 21
Patient Age 45.866 4.556 1 102

29
Categorical Variables Sub Category Percentages
Gender Male 39.18%
Female 60.82%
Race White 64.53%
Black 7.82%
Other 27.65%
Insurance Medicare 30.99%
Medi-Cal 25.85%
Private 34.19%
Other 8.97%
Admission Type Unscheduled 25.57%
Scheduled 74.43%
Admission Day Weekday 74.95%
Weekend 25.05%
Table 2.2: Hospital Level Characteristics used in selection model
Variables Mean Std. Deviation Min Max
Teaching Status (0 = Non-Teaching, 1 = Teaching) 0.091 0.288 0 1
Profit Goals (0 = For Profit, 1 = Not For Profit) 0.582 0.494 0 1
Location (1 = Rural, 2 = Semi-Urban, 3 = Urban) 1.752 0.500 1 3
Hospital Size 248.193 170.874 10 1500
Case Mix Index 1.519 0.260 0.782 2.604
IT Technologies 38.484 12.193 7 62
System Membership (0 = Yes; 1 = No) 0.445 0.497 0 1
Competition 34.859 28.842 8 81
It is in the best interest of hospitals to attest for meaningful use as soon as
possible, as incentives get progressively lower if they delay the attestation. However, the
decision to go for MU_EHR sooner or later may depend on several observable and
unobservable characteristics leading to self-selection. We address this issue in the
econometric model section, but would like to briefly discuss additional data collected for
this purpose. The decision to adopt EHRs and go for MU_EHR certification is dependent
on hospital characteristics (Jha et al. 2010; Diana et al. 2014). We collect hospital
characteristics from three different sources: OSHPD Annual financial database (AFD),

30
CMS Inpatient Prospective Payment System (IPPS) file and HIMSS database. All data
sources are joined together with the CMS unique Medicare Identifier number. Since we
have missing hospital identifier data in various datasets, after joining, we end up with 282
hospitals in the combined dataset. As information from the self-selection model is
incorporated into our main analysis, our final patient level data has 2.18 million patient
records. In this dataset, we have 47 hospitals that underwent MU_EHR in 2011 and
treated 0.48 million patients using these systems. The remaining 235 hospitals did not
undergo MU_EHR at the end of 2011 and treated 1.70 million patients. We provide a
comparison of MU_EHR certified and Non MU_EHR certified hospitals in Table 2.3
below.
Table 2.3: Comparative Statistics for MU_EHR certified and Non MU_EHR certified hospitals
Variables MU_EHR Certified
(Means)
Non MU_EHR
Certified
(Means)
LOS 4.098 4.375
Readmission 0.097 0..108
Disease Complexity 1.519 1.451
Comorbidity Complexity 3.377 3.202
Coordination Complexity 2.478 2.549
Patient Age 46.173 45.780
Teaching Status (0 = Non-Teaching, 1 = Teaching) 0.155 0.079
Profit Goals (0 = For Profit, 1 = Not For Profit) 0.80 0.541
Location (1 = Rural, 2 = Semi-Urban, 3 = Urban) 1.777 1.747
Hospital Size 274.556 243.250
Case Mix Index 1.556 1.513
IT Technologies 47.844 36.729
System Membership (0 = Yes; 1 = No) 0.667 0.404
Competition 30.311 35.713
Categorical Sub Category MU_EHR Certified Non MU_EHR Certified
Gender Male 40.19 38.90

31
Female 59.81 61.10
Race White 53.74 67.56
Black 8.93 7.51
Other 37.33 24.92
Insurance Medicare 31.96 30.72
Medicaid 11.35 29.93
Private 51.19 29.41
Other 5.50 9.94
Admission Type Unscheduled 27.27 25.09
Scheduled 72.73 74.91
Admission Day Weekday 74.71 75.02
Weekend 25.29 24.98
2.6 Econometric Model
A major concern in evaluating the impact of MU_EHR on patient LOS is a hospital’s
potential endogenous decision-making process on whether to go sooner or later for the
attestation. While certain observable hospital characteristics such as hospital size, profit
goals of the hospital, system membership, etc. have been identified in previous literature
as factors that likely affect early attestation decision (Jha et al. 2010; Diana et al. 2014),
other unobservable factors such as a cost benefit analysis could also play a key role in
impacting this decision. Ignoring the impact of these characteristics may render a biased
estimate of the effect of meaningful use of EHRs on patient length of stay (LOS). We use
a two-stage treatment effects model to account for endogeneity in the binary variable
measuring MU_EHR certification (Maddala 1983; Guajardo et al. 2012). This approach
allows us to estimate the effect of a binary treatment, MU_EHR in this case, on patient
LOS. The two-stage treatment effects model is represented by the following set of
equations:
��� = ���� + � + ��� (1)

32
��� = ���� + � + �� · ���������� + ���
� = 1 �� (��� + �� > 0)
(2)
(3)
The main coefficient of interest is α in equation 1 and γ in equation 2. Yih, which
denotes the log transformed patient i’s LOS at hospital h, is explained by exogenous
covariates Xih, described in the previous section, and the endogenous binary variable Zh,
which is coded as 1 for hospitals that achieved meaningful use in 2011 and 0 for hospitals
that did not. It should be noted that although a hospital received MU_EHR certification at
the organizational level, this certification is achieved only if at least 80% of its patients
are treated via these systems. Thus MU_EHR affects individual patients and is not just a
change that happens at the hospital level, which in turn justifies our approach of studying
the impact of MU_EHR using patient level data.
The standard procedure is to model the binary variable for MU_EHR attestation
decision as an indicator function that depends on a set of exogenous covariates Wh ,
which drive the decision to attest for meaningful use sooner than later. The unobservables
are captured through their mean effect in the treatment decision on the treatment outcome
(Tucker 2011); εih denotes the error term in the performance model, and vh denotes the
error term in the choice model. This treatment effects model allows us to correlate the
error terms from both equations. The choice model is determined using a Probit model
and a selectivity term is calculated from the results of the choice model. This is
substituted as a regressor in the performance equation to consistently estimate the impact
of MU_EHR on patient length of stay while also accounting for the endogeneity in the
choice process. The selectivity terms is given by equation 4, where ϕ and φ represent the
standard normal pdf and cdf respectively.

33
!���"������ #�$�� = %(���)&(���) �� � = 1; −%(���)
)1 − &(���)* �� � = 0 (4)
We select the following covariates in the choice model that may influence the decision to
self-select for early MU_EHR attestation. Literature indicates that hospitals with larger
bed size, not for-profit status, teaching and urban hospitals are more likely to meet
meaningful use criteria and receive incentives (Jha et al. 2010; Diana et al. 2014). It has
been suggested that hospitals with a more severe case mix may see more benefits from
such systems, so we include it as a covariate (McCullough et al. 2013). All variables
mentioned above are collected from CMS IPPS files. Hospitals may make other clinical,
administrative, and strategic IT investments such as diagnostic information systems,
scheduling systems, business intelligence, etc. and when hospitals integrate these
technologies with EHR systems, it is likely to improve hospitals’ quality improvement
efforts (Devaraj et al. 2013). Also, it is reasonable to assume that when hospitals choose
to invest in various other quality enhancing technologies, they would do so in EHRs as
well. The HIMSS database provides information on presence of each of these
technologies, and we create a count value to capture technology related investments made
by hospitals. Environmental conditions such as local competition in the service area in
which a hospital is located and system membership i.e. whether a hospital belongs to a
system may influence a hospital’s decision to achieve MU_EHR sooner or later (Diana et
al. 2014). System membership is collected from OSHPD AFD as a binary variable, and
competition is calculated as the number of hospitals in each hospital service area as
determined by the Dartmouth Atlas (http://www.dartmouthatlas.org/).
34
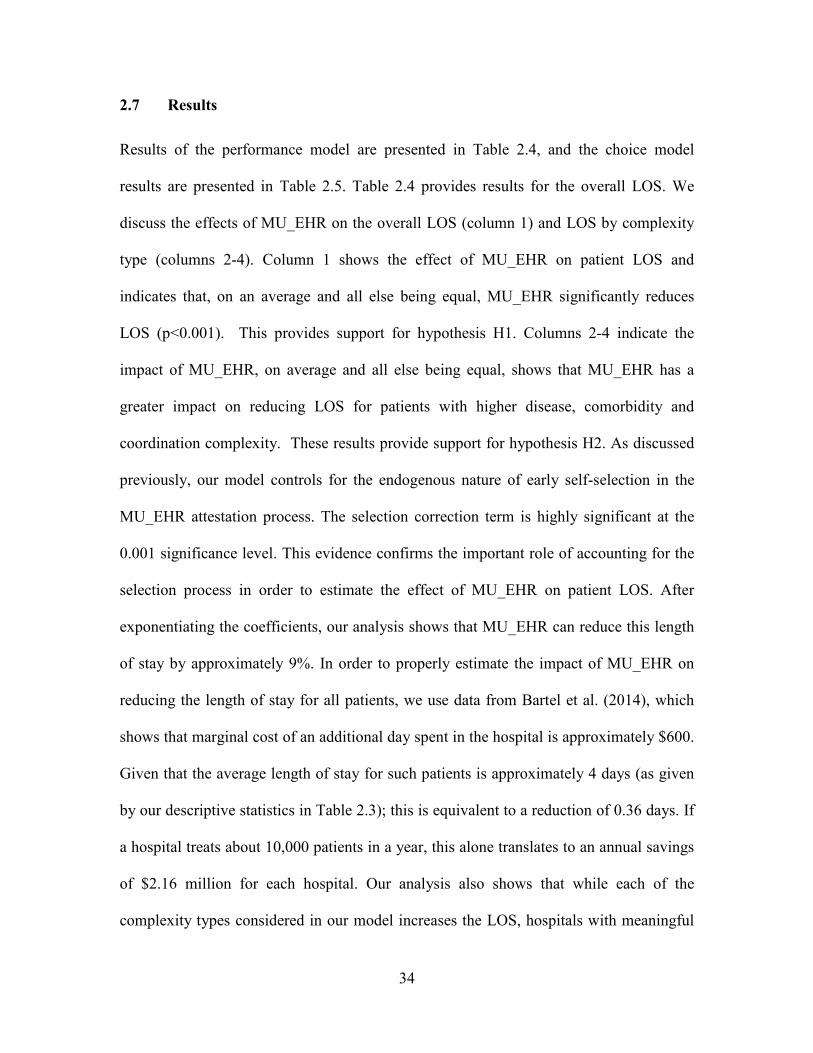
2.7 Results
Results of the performance model are presented in Table 2.4, and the choice model
results are presented in Table 2.5. Table 2.4 provides results for the overall LOS. We
discuss the effects of MU_EHR on the overall LOS (column 1) and LOS by complexity
type (columns 2-4). Column 1 shows the effect of MU_EHR on patient LOS and
indicates that, on an average and all else being equal, MU_EHR significantly reduces
LOS (p<0.001). This provides support for hypothesis H1. Columns 2-4 indicate the
impact of MU_EHR, on average and all else being equal, shows that MU_EHR has a
greater impact on reducing LOS for patients with higher disease, comorbidity and
coordination complexity. These results provide support for hypothesis H2. As discussed
previously, our model controls for the endogenous nature of early self-selection in the
MU_EHR attestation process. The selection correction term is highly significant at the
0.001 significance level. This evidence confirms the important role of accounting for the
selection process in order to estimate the effect of MU_EHR on patient LOS. After
exponentiating the coefficients, our analysis shows that MU_EHR can reduce this length
of stay by approximately 9%. In order to properly estimate the impact of MU_EHR on
reducing the length of stay for all patients, we use data from Bartel et al. (2014), which
shows that marginal cost of an additional day spent in the hospital is approximately $600.
Given that the average length of stay for such patients is approximately 4 days (as given
by our descriptive statistics in Table 2.3); this is equivalent to a reduction of 0.36 days. If
a hospital treats about 10,000 patients in a year, this alone translates to an annual savings
of $2.16 million for each hospital. Our analysis also shows that while each of the
complexity types considered in our model increases the LOS, hospitals with meaningful
35
use of EHRs actually see a slight reduction in their LOS for such patients. While the
effects may not seem very high, it is still preferable to the alternative where such patients
would have stayed longer in the hospital and potentially increased the risk of hospital-
acquired readmissions.
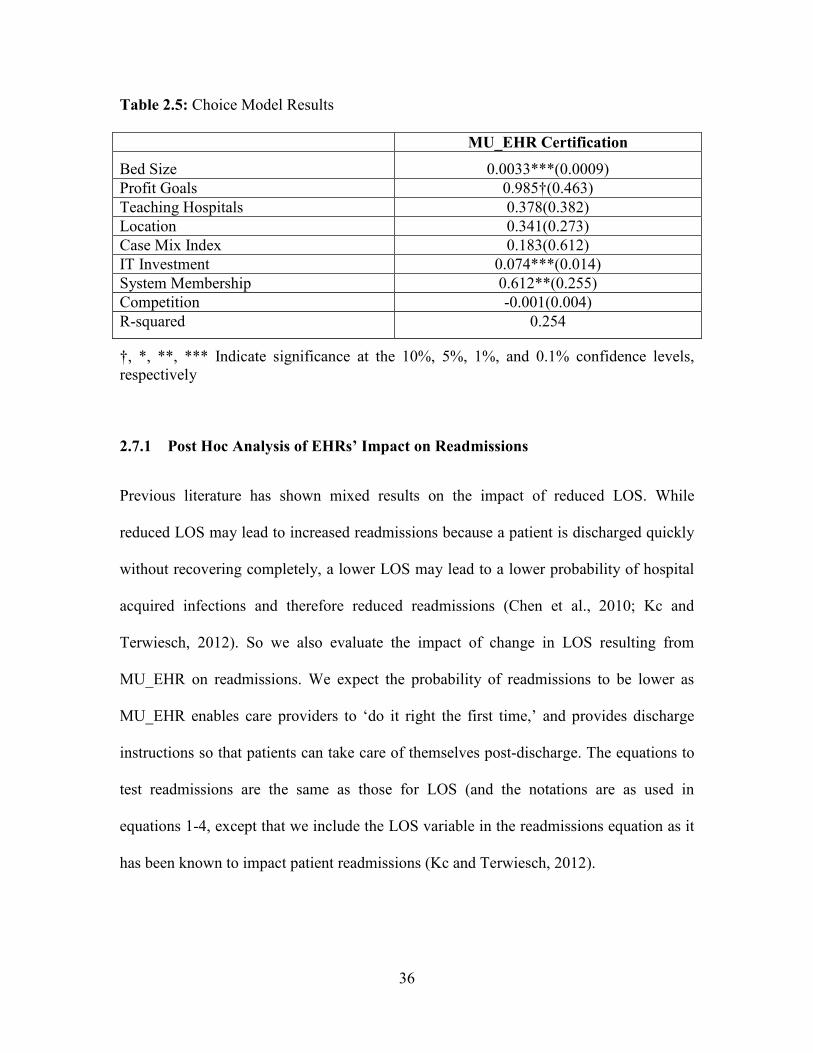
With respect to the choice equation, the results indicate that larger hospitals, non-
profit hospitals, hospitals that do not belong to a system and hospitals with greater
investments in other clinical, administrative and strategic technologies are more likely to
go for meaningful use sooner.
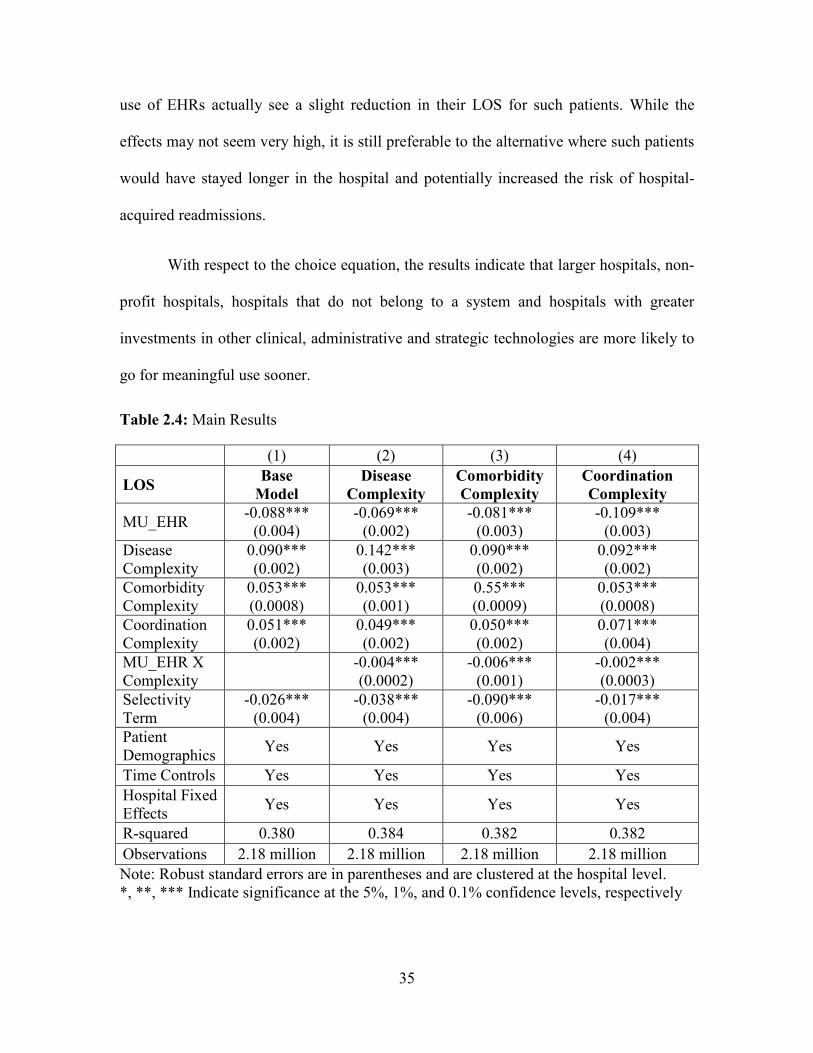
Table 2.4: Main Results
(1) (2) (3) (4)
LOS Base
Model
Disease
Complexity
Comorbidity
Complexity
Coordination
Complexity
MU_EHR -0.088***
(0.004) -0.069***
(0.002) -0.081***
(0.003) -0.109***
(0.003)
Disease Complexity
0.090*** (0.002)
0.142*** (0.003)
0.090*** (0.002)
0.092*** (0.002)
Comorbidity Complexity
0.053*** (0.0008)
0.053*** (0.001)
0.55*** (0.0009)
0.053*** (0.0008)
Coordination Complexity
0.051*** (0.002)
0.049*** (0.002)
0.050*** (0.002)
0.071*** (0.004)
MU_EHR X Complexity
-0.004*** (0.0002)
-0.006*** (0.001)
-0.002*** (0.0003)
Selectivity Term
-0.026*** (0.004)
-0.038*** (0.004)
-0.090*** (0.006)
-0.017*** (0.004)
Patient Demographics
Yes Yes Yes Yes
Time Controls Yes Yes Yes Yes
Hospital Fixed Effects
Yes Yes Yes Yes
R-squared 0.380 0.384 0.382 0.382
Observations 2.18 million 2.18 million 2.18 million 2.18 million
Note: Robust standard errors are in parentheses and are clustered at the hospital level. *, **, *** Indicate significance at the 5%, 1%, and 0.1% confidence levels, respectively
36
Table 2.5: Choice Model Results
MU_EHR Certification
Bed Size 0.0033***(0.0009)
Profit Goals 0.985†(0.463)
Teaching Hospitals 0.378(0.382)
Location 0.341(0.273)
Case Mix Index 0.183(0.612)
IT Investment 0.074***(0.014)
System Membership 0.612**(0.255)
Competition -0.001(0.004)
R-squared 0.254
†, *, **, *** Indicate significance at the 10%, 5%, 1%, and 0.1% confidence levels, respectively
2.7.1 Post Hoc Analysis of EHRs’ Impact on Readmissions
Previous literature has shown mixed results on the impact of reduced LOS. While
reduced LOS may lead to increased readmissions because a patient is discharged quickly
without recovering completely, a lower LOS may lead to a lower probability of hospital
acquired infections and therefore reduced readmissions (Chen et al., 2010; Kc and
Terwiesch, 2012). So we also evaluate the impact of change in LOS resulting from
MU_EHR on readmissions. We expect the probability of readmissions to be lower as
MU_EHR enables care providers to ‘do it right the first time,’ and provides discharge
instructions so that patients can take care of themselves post-discharge. The equations to
test readmissions are the same as those for LOS (and the notations are as used in
equations 1-4, except that we include the LOS variable in the readmissions equation as it
has been known to impact patient readmissions (Kc and Terwiesch, 2012).

37
As per CMS guidelines, we consider patient readmissions within 30 days. The
OSHPD data provides a unique patient identifier, which we use to code our readmission
as a binary variable, where 1 indicates that a person was readmitted within 30 days; and 0
indicates otherwise. Our dataset has missing information on several patients’ unique
identifier number. We deleted these records, as they are unusable in calculating the
readmission measure. Our resulting sample size is 1.74 million records, with 0.47 million
hospitals that have meaningfully used EHRs and 1.33 million for hospitals that have not.
We run a Probit regression here, and results from this analysis are shown in Table 2.6. As
shown in column 1, MU_EHR is associated with lower readmission rates for all patients.
This is a very encouraging sign that while hospitals reduce LOS via MU_EHR, they also
reduce readmissions for their patient population. In addition, as shown in columns 2 and
4 of Table 2.6, MU_EHR also reduces readmissions for patients with greater disease and
coordination complexity. The impact of MU_EHR on readmissions is not significantly
different between patients with higher and lower comorbidity complexity.. Managing
comorbidities is challenging as it may require adherence to a self-management program,
prioritizing care and initiating lifestyle changes (Kerr et al., 2007). Easy access to self-
management tools is not required in the first stage of MU_EHR, but is built into stage 3
requirements (which have not yet been finalized). We conjecture that this might be the
reason why we do not see an effect on readmissions for patients with higher comorbidity
complexity as this study looks at only the first stage of MU_EHRs.
Table 2.6: Post-Hoc Results for Readmissions
(1) (2) (3) (4)
Readmission Base
Model
Disease
Complexity
Comorbidity
Complexity
Coordination
Complexity
MU_EHR -0.514*** -0.542*** -0.517*** -0.520***
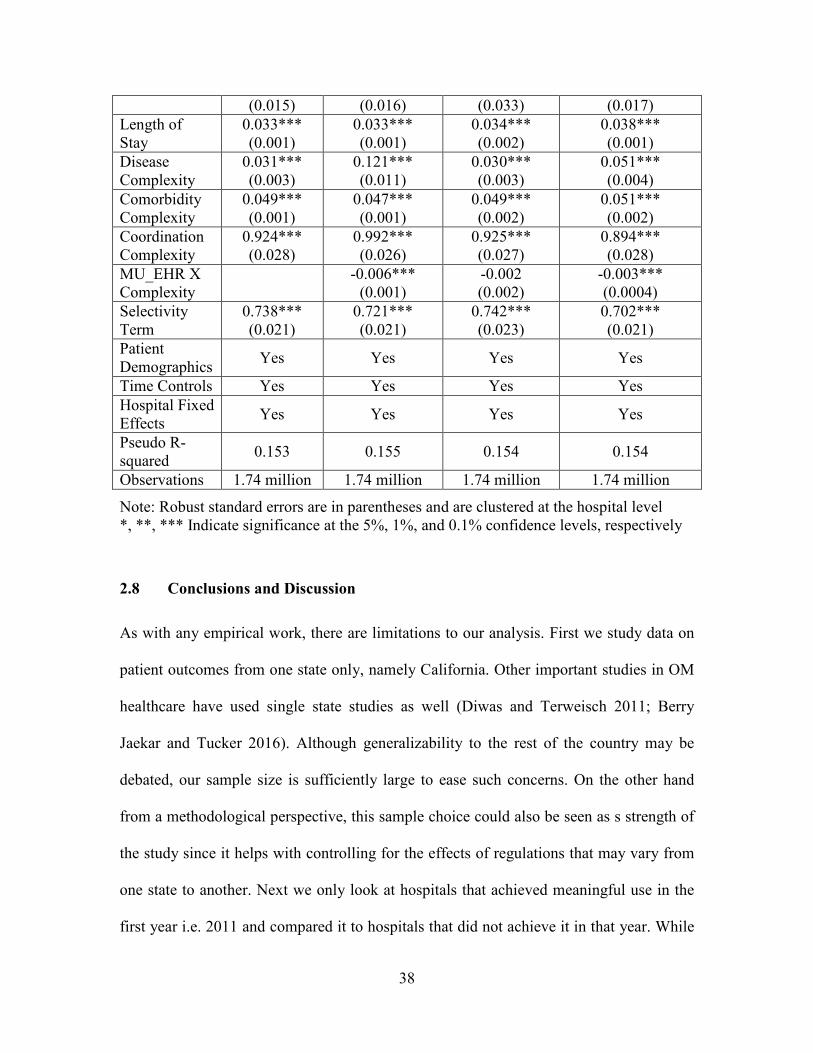
38
(0.015) (0.016) (0.033) (0.017)
Length of Stay
0.033*** (0.001)
0.033*** (0.001)
0.034*** (0.002)
0.038*** (0.001)
Disease Complexity
0.031*** (0.003)
0.121*** (0.011)
0.030*** (0.003)
0.051*** (0.004)
Comorbidity Complexity
0.049*** (0.001)
0.047*** (0.001)
0.049*** (0.002)
0.051*** (0.002)
Coordination Complexity
0.924*** (0.028)
0.992*** (0.026)
0.925*** (0.027)
0.894*** (0.028)
MU_EHR X Complexity
-0.006***
(0.001) -0.002 (0.002)
-0.003*** (0.0004)
Selectivity Term
0.738*** (0.021)
0.721*** (0.021)
0.742*** (0.023)
0.702*** (0.021)
Patient Demographics
Yes Yes Yes Yes
Time Controls Yes Yes Yes Yes
Hospital Fixed Effects
Yes Yes Yes Yes
Pseudo R-squared
0.153 0.155 0.154 0.154
Observations 1.74 million 1.74 million 1.74 million 1.74 million
Note: Robust standard errors are in parentheses and are clustered at the hospital level *, **, *** Indicate significance at the 5%, 1%, and 0.1% confidence levels, respectively
2.8 Conclusions and Discussion
As with any empirical work, there are limitations to our analysis. First we study data on
patient outcomes from one state only, namely California. Other important studies in OM
healthcare have used single state studies as well (Diwas and Terweisch 2011; Berry
Jaekar and Tucker 2016). Although generalizability to the rest of the country may be
debated, our sample size is sufficiently large to ease such concerns. On the other hand
from a methodological perspective, this sample choice could also be seen as s strength of
the study since it helps with controlling for the effects of regulations that may vary from
one state to another. Next we only look at hospitals that achieved meaningful use in the
first year i.e. 2011 and compared it to hospitals that did not achieve it in that year. While
39
this analysis helps us to understand the impact of MU_EHR, it does not tell us whether
the benefits were sustainable over subsequent years. Future research can use our study as
a building block and look into this issue. We also do not compare the performance of
hospitals that underwent MU_EHR certification in 2011 versus 2012 and so on.. Future
research can address this issue as well. Nevertheless, our study makes several important
theoretical and practical contributions to literature that can serve as a building block for
future work in this area. We highlight these contributions next.
2.8.1 Contributions to Theory
Our research is one of the first studies to examine the effect of the meaningful use
of EHRs, under a government mandate, on hospitals’ operating efficiency measured as
patients’ length of stay. Although the past literature has seen support for impact of IT
investments on hospital level patient outcomes (Angst et al. 2012), such support is not
clear when specific EHR technologies are investigated. (Agha 2011, Appari et al (2012),
Dranove et al. (2012), Freedman et al. 2014, Jones et al. (2010), McCullough (2010),
McCullough (2013)). Our study extends this line of research by looking at not just the
adoption, but rather the meaningful use of EHR technologies mandated under the
HITECH Act. Mandates can be an effective tool in improving outcomes (Horton et al.
2013; Halpin et al. 2013; Ioannou and Serafeim, 2014), and our research adds to this
stream of literature. Given that the effects of EHR adoption have been mixed in the past
literature, a mandate for meaningfully using EHRs may be a step in the right direction.
Past studies have used self-reported adoption by hospitals to evaluate the impact of
EHRs. Such adoption measures are susceptible to self-reporting bias, and which and
40
make it difficult to evaluate which clinical units in a hospital are actually using these
EHRs. The hospital-wide standardized criteria developed for MU_EHR attestation
highlights a need to use well-defined measures to clearly evaluate the impact of EHRs on
patient outcomes.
In this study, we have been able to delve into the specific mechanisms through
which EHR technologies impact hospital resource efficiency for a diverse group of the
patient population. To our knowledge, this is one of the first studies to consider the
effects of the meaningful use mandate HITECH Act on a hospital’s resource efficiency
using detailed patient level data. We look at MU_EHR as a group systems support
technology that helps in alleviating the cognitive load on healthcare providers, thus
extending the discussion on the benefits of such systems in the healthcare operations area.
We also conceptualize the task of treating a patient into three types of complexity profiles
based on the degree of difficulty in accomplishing the task of treating a patient i.e. a
patient’s disease complexity, the degree of patient severity i.e. comorbidity complexity,
and degree of coordination required among healthcare providers to accomplish the task of
treating the patient i.e. coordination complexity. While these dimensions of task
complexity have been conceptualized previously (Campbell, 1988; Wood, 1986), they
have been focused mostly in the behavioral sciences and typically studied in controlled
laboratory experiments or through case studies (Liu and Li 2012). We are one of the first
to do this in the context of healthcare operations management using objective large-scale
secondary data. Past healthcare literature has only controlled for patient demographics,
and has ignored these task complexities (which are not demographic specific) while
evaluating the impact of EHRs. Our study highlights the importance of including these
41
task complexities as they significantly increase the LOS in patients. We are thus able to
uncover the additional value that EHR technologies, when used meaningfully, add while
treating patients with greater complexities. Specifically, our analysis shows that while
MU_EHRs reduce LOS for all patients, these systems improve to a greater degree the
efficiency with which patients with a higher degree of disease complexity, comorbidity
complexity, and greater coordination needs, are treated. By integrating the literature on
task complexity and task-technology fit into the healthcare context, our study underscores
the importance of implementing and meaningfully using a hospital wide EHR system,
especially when hospitals treat patients with complex disease and comorbidity profiles
who require treatment from multiple healthcare providers. In doing so, our paper also
answers the call of various researchers on the use of more granular data for understanding
and advancing research on the performance impacts of information technology (Agarwal
et al. 2010, Athey and Stern 2002, and Himmelstein et al. 2010).
We also highlight that the decision to attest for MU_EHR is endogenous, and
driven by factors such as hospital size, complementary IT investments, profit goals, and
system membership. This underscores the importance of accounting for such self-
selection in future studies that seek to understand the impact of Stage 2 and Stage 3 of
meaningful use criteria (which focus on health information exchanges, electronic
transmission of patient care across multiple settings, patient access to self-management
tools, improving population health, etc.) on various outcomes. Finally, using our detailed
patient level data, we are able to show that a reduction in LOS does not come at the
expense of increased readmissions. While hospitals cannot control the sickness and
comorbidities that their patients come in with, they can certainly ensure that these

42
patients spend less time in the hospital, which may reduce hospital acquired infections,
and therefore readmissions. Providing the right treatment at the right time also ensures
that patients are less likely to be readmitted to hospitals.
2.8.2 Implications for Practice
This study is motivated by the government’s push to hospitals to adopt and use EHR
technologies in a meaningful way, and so is highly relevant to hospital management and
executives in the current healthcare environment characterized by cost containment
pressures and reduced reimbursement for services. Collectively, our results show that
MU_EHR, based on the first stage requirements that mandate hospitals to capture patient
information systematically in an electronic format and use built-in treatment protocols for
treating these patients, really helps in reducing overall length of stay and also readmission
rates. These gains are even more beneficial for certain patient populations. A study by
(Hillestad et al. 2005) noted that greater efficiency from EHRs could lead to potential
savings of more than $77 billion per year. Their study also noted that one of the most
important sources of these savings come from reduced hospital length of stay, a result
that our research confirms as well, though with a greater degree of granularity and
contingencies in empirically confirming that the MU_EHR mandate can help achieve
these projected savings by reducing the length of stay.
The results that we have presented previously in the results section are not just
hypothetical. Hospitals have actually reported cost savings from use of EHRs. For
example, Sentara Healthcare realized a return on investment of $53.7 million at the end
of 2011 of which 29% or $15.5 million savings came from reduced length of stay and
43
avoiding adverse drug events, and another 18% or $9.4 million of savings came from
increased unit efficiency (http://health.usnews.com/health-news/hospital-of-
tomorrow/articles/2013/11/05/taking-a-close-look-at-electronic-health-records). In view
of increased workloads that hospitals are now facing due to a greater number of insured
patients seeking hospital services under the Affordable Care Act, MU_EHR can facilitate
more effective bed management and efficient operations by freeing up capacity through
faster patient turnaround times. This approach will be preferable to making additional
investments in beds or human resources.
Finally, as our post hoc tests reveal, the use of MU_EHR reduces readmissions
for complex patients, which is an added benefit to hospitals that might otherwise face
additional penalties under the CMS’ Hospital Readmission Reduction Program. Thus
MU_EHR is an important component in achieving the triple aim of care, health, and cost
in patient population. Change in LOS is not at the expense of an increase in readmissions.
Even greater benefits are likely to accrue when hospitals get certified for later stages of
meaningful use that may focus on information exchanges among hospitals, patient self-
management tools, and greater decision support for high-priority conditions. Past
research suggests that returns to IT investments persist over time (Tambe and Hitt 2012)
and we hope that this will hold true in the case of healthcare as well. Generating
enthusiasm and participation for the use of EHR technologies among providers will be an
important task for hospital administrators going forward. Our study provides them the
empirical basis for doing so beyond just following the mandates of the HITECH Act.
44
CHAPTER 3
LONGITUDINAL IMPACT OF PROCESS IMPROVEMENT ON
PATIENT CARE UNDER COMPETITION AND ACA2
Abstract
Our study examines the impact of competition on process of care (PoC), and the role
process improvement factors play on affecting PoC within the altered competitive
landscape that has been created in the healthcare industry by the introduction of the
Affordable Care Act (ACA) of 2010. ACA acts as a catalyst in increasing competition
among all hospitals to attract more patients and improve PoC. A longitudinal analysis of
data combined from several different sources shows the contingent value of process
improvement factors. Their impact on PoC is positive in both more as well as less
competitive markets; however the marginal benefit is stronger in less competitive
markets. These results are robust to alternate specifications of competition. We find
similar results when considering the catalytic role played by ACA in enhancing
competition. We discuss the prescriptive implications of our findings for designing better
operational systems in the context of ACA and the increased financial burden that
hospitals are facing due to reimbursements shifting from a fee-for-service based system
to one based on the value of care provided.
Keywords: Slack, Skill Mix, Focused service strategy, Competition, ACA 2 Wani, D., M. Malhotra and S. Venkataraman. To be submitted to Journal of Operations Management
45
3.1. Introduction
The US healthcare system over time has evolved from a fee-for-service system which
traditionally focused on paying providers based on the volume and complexity of
services, to a prospective payment system which encouraged a reduction in excessive and
unnecessary care by providing a fixed payment for services rendered (James, 2012).
However, researchers conjecture that this led to a reduction in treatment intensity and
resulted in greater medical errors, readmissions and mortality (Cutler, 1995; Encinosa
and Bernard, 2005). The Affordable Care Act (ACA) was introduced in 2010 to rein in
such inefficiencies and to promote greater coordination across providers of services by
creating financial incentives that encourage organizations to deliver efficient and high
quality medical care (http://obamacarefacts.com/affordablecareact-summary/).
Transition from a cost-based reimbursement to a prospective payment system to
the current pay for performance (P4P) system has forced hospitals to become price-takers
instead of price-setters, and has reduced reimbursements for a majority of hospitals
(Werner 2010; Shen, 2003). It has also put greater constraints on hospitals’ financial
resources due to slower revenue growth and decline in profits (Bazzoli et al., 2008). One
of the key mechanisms that hospitals have used in the past to cope with such changes has
been to consolidate through mergers and acquisitions in an attempt to gain market share
and reduce their local competition (Cutler and Morton, 2013). However, it has been
argued that such consolidations, if left unchecked, can stifle innovation-stimulating
competition, have adverse effects on the access and quality of care, and add to the rising
healthcare costs (Xu et al., 2015). In recent times, the Federal Trade Commission – the
regulatory body overseeing business practices and consumer protection - has been
46
challenging and winning a number of recent attempts at consolidation in the healthcare
industry by arguing that such consolidations operate without the checks and balances of a
competitive marketplace (Brill, 2015; New York Times, 2014). So apart from
consolidations, hospitals are also forced to seek ways to attract insurers, referring
physicians, and patients to improve their revenues, and to improve profitability by
emphasizing efficiency in various areas of their operations (Devers et al. 2003; Cutler et
al., 2004; Tay, 2003). This competitive landscape is further enhanced by the ACA. It has
increased insurance coverage for millions of people causing hospitals to compete for
these patients, especially since demand for services is often localized (Tay 2003). In
addition, the ACA has also created the hospital value based purchasing (VBP) program
that provides financial bonuses to hospitals that improve the value delivered to patients
and penalizes others that do not.
How does such a shift toward more competitive conditions for capturing patient
demand affect process of care (PoC)? Further how should hospital managers make
resource allocation decisions based on their constrained finances to improve hospital
processes that ultimately improve patient outcomes? In particular, what is the value of
investing in process improvement factors when localized competition for attracting
patients is high? This is still an open issue. So in this study, we examine the effect of
competition on quality of patient care. Then we unbundle the benefits arising from
process improvement factors by validating a finer-grained contingency model that is
longitudinally tested with over seven years of panel data.
In section 3.2, we review the relevant literature and develop associated
hypotheses that flesh out our research model. In section 3.3, we describe our data sources,

47
along with the definition and operationalization of key variables, and our econometric
model. Results of our analysis and robustness tests are presented in section 3.4. We
discuss the impact of ACA on the quality of care in section 3.5. We finally conclude in
section 3.6 with a discussion on major theoretical and practical contributions of this
study, along with future research directions.
3.2. Literature Review and Hypothesis Development
In this section, we first discuss our choice of dependent variable, followed by a review of
the impact of localized competition in the hospital industry on our dependent variable.
Then we present theoretical arguments and hypotheses for how competition influences
the relationship between our choice of process improvement factors and process of care
(PoC).
3.2.1. Choice of Dependent Variable
We choose to study PoC as our dependent variable for the following reasons. First, PoC
assesses the degree to which healthcare providers adhere to processes that are
scientifically proven or “evidence based” (Jha 2006). Second, although PoC requires a
good definition of eligible patient population, it does not require extensive risk
adjustment modeling that are necessary for other outcome variables such as mortality and
readmissions. Risk adjustment models require extensive psychological, anatomical and
health status data that may not be captured or be readily available in a patient’s medical
record (Rubin et al., 2001). Third, PoC is under greater control of healthcare providers
and requires a shorter time frame for assessment, relative to other outcome measures that

48
may require longer time horizons to measure (Palmer 1997; Werner et al. 2008). Finally,
good PoC has been linked to better patient outcomes such as lower resource usage
(Andritsos and Tang 2014), lower readmissions and mortality (Newby et al. 2006; Ashton
et al. 1995), and lower rates of infections and complications (McCabe et al. 2009; Bozic
et al. 2010). Additionally, PoC leads to higher quality of care for patients because it is
also a marker for other unmeasured quality processes that improve patient safety,
coordination of care, emergency responsiveness, etc. (Werner et al. 2008). Thus we
believe that PoC is an appropriate and comprehensive dependent variable to model in our
study.
3.2.2. Choice of Independent Variables
We choose operational slack, nursing skill mix and focused service strategy as our key
independent variables, and which together constitute our process improvement factors.
We treat these structural and infrastructural choices not only as deliberate strategies that
hospitals pursue, but also as emergent choices that evolve over time. Given the
constraints that managers face with respect to resources, we believe that our choice of
these three variables is most important in improving PoC. Spear (2005) points out that
operational excellence in providing safe, efficient, reliable, timely and effective patient
care is possible through work redesign, collaborative experimentation among various
healthcare providers, and dissemination of knowledge through coaching, mentoring and
training activities. However, investing time in rethinking and improving PoC cannot
happen in an environment when people are constantly busy (De Marco 2001). Thus slack
is necessary for improved PoC. Registered nurses provide important resource flexibility
49
in an environment that faces demand fluctuations and patient heterogeneity. Further,
registered nurses are at the frontline of patient care and have the necessary technical
expertise and knowledge to understand the root causes of various problems, identify and
prioritize areas of PoC that need most attention, and conceptualize effective solutions
through appropriate training (Fields and Sinha 2005; Mukherjee et al. 1998). Finally, a
focused service strategy results in stable and standardized work processes through
repeated encounters with a homogeneous set of patients (Skinner 1974), which in turn
improve organizational learning capabilities as well as PoC (KC and Terweisch 2011).
The three process improvement factors of slack, skill mix, and focused service strategy
together represent the thrust of process improvement efforts that hospitals can leverage to
positively affect PoC.
3.2.3. Impact of Competition
The economics literature argues that when prices are above the marginal cost, greater
competition leads to higher quality (Tirole, 1988). In healthcare, roughly 50% of the
healthcare spending is financed through Medicare where prices are regulated, while the
remaining 50% is financed through commercial or private insurance (Gaynor, 2014).
Gaynor (2014) also shows that when prices are regulated, the equilibrium quality has a
positive association with the number of firms in the market. Even when prices are
determined in hospital markets, as in the case of private insurers, models show that
competition leads hospitals to offer higher quality (Gaynor and Town, 2011; Gravelle et
al., 2014). These theoretical results have been supported by econometric studies which
show that when markets are not concentrated i.e. when there are several competing
50
hospitals and prices are regulated, outcomes such as mortality and readmissions are better
(Kessler and Geppert, 2005; Kessler and McClellan, 1999; Shen, 2003). Both Gaynor
(2006) and Gaynor and Town (2011) provide a comprehensive review of studies that look
at the relationship between competition and quality.
High PoC and quality is imperative in competitive hospital markets as it is likely
to attract insurers, specialists, and referring physicians, which in turn results in higher
patient demand (Cutler et al., 2004; Devers et al. 2003; Tay, 2003). Hospitals located in
competitive markets choose to signal high quality through investments in innovative
technologies, and state of the art diagnostic and medical equipment (Dranove et al. 1992,
Tay 2003). Innovative technologies such as electronic medical records enable
information exchange about patient health among various providers, provide clinical
reminders, improve adherence to treatment guidelines and provide discharge instructions.
Diagnostic equipment such as imaging for cardiovascular conditions improve the
efficiency of diagnoses, which then results in less time needed to diagnose a patient’s
condition and provide correct treatment. Thus these investments play a significant role in
improving PoC (Appari et al. 2013; Douglas et al. 2009) In addition, hospitals in
competitive environments are also more likely to create organizational and structural
changes by creating a board level commission on quality, hiring senior personnel to
oversee quality improvement efforts, hiring hospitalists to improve care coordination, and
adopting exploration type of quality management practices (Bloom et al., 2015; Silow-
Carroll et al., 2007). Such actions lead to adoption of practices such as establishing
standardized care protocols and performance monitoring systems, setting targets for
improvements, and providing incentives to managers and employees to improve patient

51
outcomes. Such actions have been shown to improve process of care in cardiac patients
(McConnell et al. 2013). Thus constant innovation spurred by competition results in
continuous quality improvement (Teisberg et al., 1993) and better PoC. As a result, we
would expect PoC to be higher in more competitive markets.
H1: Greater competition in hospital markets is associated, on average, with better
PoC
3.2.4. Moderating Role of Competition on the Relationship between Process
Improvement Factors and Process of Care
It is well known that resource allocation decisions are largely influenced by the
resources’ ability to outperform competitors when firms are faced with dynamic and
changing environments (Sirmon et al., 2007). When hospitals in competitive markets take
such actions, they also face greater costs. Furthermore, despite investments in expensive
technology and increase in the number of referrals, an increase in hospital revenues is
likely to be modest under the fixed reimbursement system. As a result, hospitals in
competitive markets have lower profit margins (Dranove et al. 1993). Under greater cost
pressures and competitive threats, hospitals may focus on conserving their resources by
emphasizing efficiency in other areas of their operations (Staw et al., 1981). Because
hospitals encounter heterogeneity in patients and associated medical conditions as well as
demand fluctuations, process improvement factors are important to hospitals in their
resource allocation decisions. However, the role and value of these process improvement
factors discussed earlier under competition is yet unexplored, and which is what we focus
on next.
52
3.2.5. Slack
Operational slack, a key process improvement factor, refers to the flexibility available to
a firm to effectively manage variations in a dynamic environment (Anand and Ward,
2004). When utilization is high or slack is reduced, a greater number of patients have to
be treated at any given time. Such high utilization has been associated with reduced time
spent on each patient, a greater propensity for errors, reduced worker productivity, lower
medical treatment quality, lower length of stay, and increased mortality ( Berry Jaeker
and Tucker, 2013; Kc and Terwiesch, 2009 and 2012). Patients may be placed in less
appropriate units for recovery, because the primary unit that they need is unavailable
(Green and Nguyen, 2001). Due to greater mental strain on healthcare workers when
there is less slack, probability of adverse events unrelated to a patient’s underlying
medical condition is higher (Rudolph and Repenning, 2002; Weissman et al., 2007).
Lower slack may also inhibit the efforts of healthcare workers to find the root causes of
process failures (Tucker and Edmondson, 2003). Thus higher slack will improve PoC due
to better adherence to necessary protocols of care driven by evidence-based medicine.
Faced with cost pressures and declining profit margins, hospitals see lower slack
as a way to be efficient by spreading the fixed costs over a greater volume of patients
(Gaynor and Anderson, 1995; Kc and Terweisch, 2009). Hospitals in competitive markets
face significantly greater pressures to operate with high utilization rates as they try to
balance efficiency goals with costly investments in equipment, technology and
management. While these structural and infrastructural investments by hospitals in
competitive markets are important in improving quality, enhanced slack is expensive, but
likely to complement their quality improvement efforts.
53
Slack in less competitive markets can serve two purposes. First, it can serve as a
deterrent for other hospitals to increase capacity or to prevent new hospitals from opening
up i.e. slack creates entry barriers (Salop, 1979). Second, as hospitals in less competitive
markets may not face pressures to continually invest heavily in the latest equipment and
technologies, they may be able to tolerate more slack in their operations and use this
slack to engage in relatively less expensive quality improvement efforts such as imparting
training to existing workers on understanding correct protocols for reducing errors and
preventing infections, creating cross-functional teams, and using appropriate problem
identification and solving tools (Silow-Carroll et al., 2007). While the benefits of slack in
improving quality are unequivocal, slack is more readily available in less competitive
markets and so will provide relatively greater benefits.
H2A: Competition moderates the relationship between slack and PoC, such that the
positive relationship between slack and PoC, on average, is stronger in less
competitive markets
3.2.6. Nursing Skill Mix
Nurses have been recognized to be “at the front-line of patient care and in the best
position to detect problems, monitor conditions, and rescue when necessary” (Joint
Commission on Accreditation of Healthcare Organizations, 2002). A high nursing skill
mix i.e. higher proportion of registered nurses promotes greater resource flexibility that is
important in handling uncertainties in demand and managing system bottlenecks (Egger,
2000; Hopp et al., 2007; Jack and Powers, 2004). Higher knowledge and training
associated with a higher skill mix ensures that quality control practices and standards of
54
care are followed correctly, which in turn help in detecting and treating complications,
preventing adverse events such as surgical infections, pneumonia, wounds, etc.
(Needleman et al., 2006; Lang et al., 2004; Cho et al. 2003). Finally, registered nurses are
more productive than other nurses as they can perform the entire range of nurse related
tasks without supervision (Barkell et al., 2002).
But this high nursing skill mix can be expensive. Registered nurses have
significantly higher wages than licensed vocational nurses or nurse aids (Bureau of Labor
Statistics, 2014a, 2014b). As hospitals face cost pressures due to changing government
policies, nurse layoffs become more common (The Economist, 2014; The New York
Times, 1996) and hospitals resort to a lower skill mix i.e. registered nurses get replaced
with unlicensed assistive personnel in an attempt to reduce costs and improve
profitability (Rivers et al. 2004; Thungjaroenkul et al., 2007). Further, registered nurses
also have greater inter-employer mobility i.e. multiple hospital and non-hospital
employment options (Hirsch and Schumacher, 1995) in more competitive markets. While
increasing wages can be seen as a way to recruit more registered nurses in competitive
markets (May et al., 2006), this is less likely as its puts a greater strain on hospitals’
financial resources. Pressures to reduce costs are even more acute for hospitals in
competitive markets as they have to constantly make investments in purchasing,
maintaining and updating medical equipment and technology to improve the quality and
safety of care by reducing human errors (Bates et al., 2001; Silow-Carroll et al., 2007).
Greater investments in areas of information technology are also likely to reduce the
extent of routine manual tasks, while assisting registered nurses with non-routine
55
cognitive tasks (Autor et al., 2003). Thus technology investments in competitive markets
will likely complement a higher skill mix in improving PoC.
In less competitive markets, we have the opposite scenario where there are few
employers of RNs. Thus hospital employers have more market power and registered
nurse wages are lower (Bruggink et al. 1985; Robinson 1998). Hospitals in less
competitive markets are also likely to put more emphasis on training, development and
empowerment of their nurses than on providing high technology related services (Li and
Benton 2006). Given the importance of skilled registered nurses in improving PoC and a
less acute need to continually invest in new technology and equipment, we would expect
such hospitals to improve their PoC to a greater extent through investments in higher skill
mix. Thus greater benefits from high skill mix will be possible in less competitive
markets.
H2B: Competition moderates the relationship between skill mix and PoC, such that
the positive relationship between skill mix and PoC, on average, is stronger in
less competitive markets
3.2.7. Focused Service Strategy
The operations management literature has highlighted the benefits of focus on outcomes
such as reduced mortality, increased efficiency, and lower cost arising from reduced
variations in patient heterogeneity, greater organizational learning due to higher volumes,
and better alignment of people and processes (Ding, 2014; Huckman and Pisano, 2006;
Kc and Terwiesch, 2011; McDermott and Stock, 2011). A strategic emphasis on a
focused service strategy results in adoption of more standardized components and
56
processes, as well as better integration of processes which subsequently help in reducing
variations in the delivery of care as well as improving efficiency of care. Thus a focused
service strategy is likely to improve PoC.
Hospitals in more competitive markets may follow a focused service strategy to
achieve economies of scale. On the other hand, they may choose to add an extensive
range of complementary services and become a ‘one stop shop’ to achieve economies of
scope. This approach also enables hospitals to attract insurers by providing an array of
services thereby reducing contracting costs (Devers et al, 2003). While both scenarios are
plausible, findings from studies suggest that hospitals in competitive markets adopt the
latter approach (Baker and Phibbs, 2000; Friedman et al., 2002). We have argued earlier
that hospitals in more competitive markets are forced to constantly innovate in order to
improve their quality. While it is possible to use a focused strategy i.e. perform a narrow
set of procedures on a larger volume of patients and achieve higher quality through
organizational learning and exploitation of internal capabilities (Kc and Terweisch,
2009), focus on development of core capabilities in just a single area may lead to a
decayed competitive stance (Miller et al, 2007). Therefore hospitals in a more
competitive environment are likely to be less focused, and thus not be able to improve
PoC to the same extent as hospitals in less competitive environments.
The success of a focused service strategy depends partly on patient volume (Hyer
et al. 2009). Hospitals in less competitive markets may not have a sufficient pool of
patients to justify offering the entire range of possible services. Offering targeted services
i.e. a focused service strategy may be a better option for these markets where investments
can be made in specific clinical areas and specialized infrastructure, and a higher patient

57
throughput to ensure high quality of care. Also, hospitals in less competitive markets may
not be forced to constantly innovate, but they still need to improve their PoC. Focusing
on a narrow set of procedures may also result in simplified routines through which
knowledge can be acquired and exploited to treat patients. We would thus expect the
marginal benefit from a focused service strategy to be greater is less competitive markets.
H2C: Competition moderates the relationship between a focused service strategy and
PoC, such that the positive relationship between a focused service strategy and
PoC, on average, is stronger in less competitive markets
Our models for analysis based on these hypotheses are provided in Figure 3.1.
Figure 3.1: Theoretical Model

58
3.3. Data Sources, Variables and Econometric Model
Our data sample for this analysis is a comprehensive dataset that comes from three
different databases. Although measuring all important processes of care is virtually
impossible, we use the process of care measures reported on Center for Medicare and
Medicaid Services’ (CMS) Hospital Compare website as a proxy for our PoC. It should
be noted that although CMS reports only a subset of PoC, they are an important marker
for other measures of care that are equally important, but are not measured (Werner et al
2008). Data for the internal and external hospital factors are collected from California
Office of Statewide Planning and Development’s (OSHPD) Annual Financial database
(AFD). Various hospital characteristics are compiled from CMS’ Inpatient Prospective
Payment System (IPPS). Our unit of analysis is acute care hospitals in the state of
California. Our data is longitudinal in nature, covering years 2007 – 2013. We describe
below the key measures for the variables used in the study.
3.3.1. Dependent Variable
PoC measures collected from CMS refer to the technical quality of patient care for
common and serious health conditions including acute myocardial infarction (AMI or
heart attack), heart failure (HF), pneumonia (PN), and surgical care improvement/surgical
infection prevention (SCIP). Outcome measures related to these conditions are important
as they assess critical steps in the overall patient care process that are evidence based and
are correlated with lower mortality rates (Jha et al., 2007). We evaluate this outcome
measure by using process of care measures reported on the CMS Hospital Compare
website. We construct a composite measure of PoC based on the process quality

59
measures of AMI, HF, PN and SCIP used in the prior literature, and which are common
across all years (Senot et al., 2015). Each measure represents the percentage of each
hospital’s patients as a ratio of the number of people who actually received the treatment
to the number of patients that are eligible for the treatment. Following CMS guidelines,
only measures based on a sample of at least 25 patients are included in the study. The
PoC components used in this study are listed in Appendix B.
We compute a weighted composite measure across all selected measures. In order
to satisfy normality and homoskedasticity assumptions of regression analysis, we
transform this weighted measure into their Logit form similar to prior literature
(Chandrasekaran et al., 2012). Thus our PoC measure for hospital i at time t with the
weighted average percentage across process of care measures Pit is given by:
+���, = �- . +�,1 − +�,/
3.3.2. Key Variables
Our data for operational slack, skill mix and focused service strategy come from
California Office of Statewide Planning and Development’s (OSHPD) Annual Financial
database (AFD).
Slack
The AFD provides the annual licensed bed occupancy rate as the ratio of patient days to
the total available bed days for each hospital for each year. We calculate our slack
measure with the following equation, where higher values represent greater operational
slack.
!�0"1�, = 100 − 2�3 4""5�0-"� 60���,

60
Nursing Skill Mix
The AFD provides the annual number of productive hours spent in patient care by
registered nurses, licensed vocational nurses (LVN) and nurse aides and orderlies. Based
on prior literature (Cho et al., 2003), we calculate the skill mix as shown below, where
higher values indicate a greater proportion of hours spent by registered nurses as
compared to other nurses.
!1��� 7���,
= +$�35"���� 8�5$9 �� 6�:�9��$�3 ;5$9�9�,+$�35"���� 8�5$9 �� (6�:�9��$�3 ;5$9�9 + <=;9 + >�3�9 0-3 4$3�$���9)�,
Focused Service Strategy
Focused service strategy is measured based on the number of licensed beds in major
clinical areas (e.g. general medical and surgery, coronary care, intensive care, nursery,
etc.) Similar to prior literature (Ding, 2014), we measure focus as a Herfindahl-
Hirschman Index by summing the squared share of licensed beds in each major clinical
area, where higher values of the focus variable indicate a more focused or a less
diversified hospital strategy.
?�"59�, = @ . <�"�-9�3 2�39 �- 0$�0 � 0� ℎ�9���0� ℎ 0� ���� �#��0� -5�B�$ �� ��"�-9�3 B�39 0� ℎ�9���0� ℎ 0� ���� �/C
�
Competition
We measure competition as the number of competing acute care hospitals within a given
hospital service area (Shen 2003; Propper et al., 2003). We believe this measure to be
appropriate as demand for patients is localized i.e. restricted to a given service area (Tay
2003). Our measure of the hospital service area comes from the Dartmouth Atlas

61
(http://www.dartmouthatlas.org/). In our robustness test, we consider another measure of
competition - as measured by the Herfindahl -Hirschmann Index that is based on the
market share of providers in a given health service area.
3.3.3. Control variables
Previous studies have identified several hospital characteristics as potential sources of
heterogeneity, which may affect performance outcomes in hospitals. Accordingly, we
control for bed size (log value) and location (urban/rural) (Jha et al. 2009), case mix
index (Schwartz et al. 2011), multi-hospital membership (Ding 2014), teaching intensity
(Sloan et al. 2001), corporate goals (for profit/ non-profit) and ownership (public/private)
(Weiner et al. 2006), and magnet status of hospitals (Senot et al. 2015). We also control
for ACA. We capture this as a binary variable, where 0 represents the period prior to
2011; and 1 represents the period after and including 2011. Finally, we also control for
hospital and year fixed effects in our model. Our data for the control variables comes
from various data sources such as OSHPD’s AFD, CMS Inpatient Prospective Payment
System (IPPS), OSHPD’s Healthcare Atlas and American Nurses Credentialing Center
(ANCC) (www.nursecredentialing.org). We merge all datasets using the CMS Medicare
ID number, OSHPD hospital ID number, and the hospital zip code. After conjoining our
different datasets, we have 211 hospitals per year giving us a total of 1477 hospital-year
records for our analysis. Descriptive statistics and correlations for key variables are
provided in Tables 3.1 and 3.2 respectively.

62
Table 3.1: Descriptive Statistics
Variable Mean
Std.
dev. Minimum Maximum
Process of Care 3.27 0.98 0.44 7.73
Slack 0.39 0.13 0.01 0.78
Skill Mix 0.75 0.10 0.18 1.00
Focus 0.48 0.14 0.22 0.89
Competition 26.02 20.41 4 63
Multi-Hospital System 0.49 0.50 0.00 1.00
Ownership (0 = Private, 1 = Public) 0.18 0.38 0.00 1.00
Profit Status (0 = For-Profit, 1 = Non Profit) 0.61 0.49 0.00 1.00
Teaching Status 0.11 0.31 0.00 1.00
Case Mix Index 1.56 0.22 0.99 2.55
Location 1.77 0.46 1.00 3.00
Bed Size 285.05 149.64 47.00 958.00
Magnet Status (0 = No, 1 = Yes) 0.07 0.26 0.00 1.00

63
Table 3.2: Correlations
1 2 3 4 5 6 7 8 9 10 11 12 13 14
1 PoC 1
2 Focus 0.11 1
3 Skill Mix 0.2 0.12 1
4 Slack 0.22 0.24 0.14 1
5 Competition -0.11 -0.21 -0.14 -0.07 1
6 ACA 0.49 0.03' 0.04' 0.17 0.03' 1
7 MHS 0.25 0.09 0.29 0.18 -0.21 -0.002' 1
8 Ownership -0.11 -0.1 -0.15 -0.12 -0.11 -0.002' -0.25 1
9 Profit Status 0.12 -0.01' 0.15 0.03' -0.03' 0.01' 0.17 -0.59 1
10 Teach -0.11 -0.21 -0.02' -0.25 0.04' 0.04' -0.1 0.21 -0.02' 1
11 Case Mix Index 0.22 -0.06 0.23 -0.14 -0.001' 0.23 0.02' -0.05† 0.09 0.25 1
12 Location 0.08 -0.13 0.05' -0.04' 0.35 -0.004' -0.08 -0.02' -0.09 0.12 0.04' 1
13 Bed Size 0.03' -0.34 0.05† -0.31 0.17 0.04' -0.16 0.08 0.12 0.5 0.42 0.19 1
14 Magnet Status 0.04' 0.01' 0.09 -0.16 -0.03' 0.07 -0.14 0.06 0.06 0.2 0.31 0.14 0.38 1
Note: ’ indicates that the correlation is not significant. † indicates significance at the 0.1 level. All other correlations are significant at
the 0.01 level.

64
3.3.4. Econometric Research Models
Primary considerations in choosing an appropriate model for conducting our analysis
included an unbalanced panel data, as well as autocorrelation among consecutive years. A
fixed effect model can address autocorrelation and heteroscedasticity issues through
robust clustered standard errors (Hoechle 2007). To ensure that a fixed effect model is
appropriate over a random effects model, we conducted a Hausman test (Hausman,
1978). The p-value for the test is significant (p<0.001), suggesting that the fixed effects
model is more appropriate for this study (Wooldridge, 2010). We also checked for
heteroscedasticity in the residuals of the fixed effects model through a modified Wald test
(Baum et al., 2001). The Wald test indicates presence of heteroskedasticity in our model
(p<0.001). In order to address both autocorrelation and heteroskedasticity, we estimate
our models with clustered robust standard errors. We also checked for variance inflation
factors (VIFs) to ensure that there are no multicollinearity issues. As our VIFs were
below 2, we rejected the presence of multicollinearity in our analysis. While our main
model considers the key independent variables and competition as exogenous, we address
endogeneity issues with our modeling approach in the robustness test section. We use the
following equation to test hypotheses 1-3.
+���, = �D + �E ∗ +G?�, + �C ∗ ����������-�, + �H ∗ +G?�, ∗ ����������-�, + �I ∗>�> + �J ∗ 78!�, + �K ∗ 4L-�$9ℎ��� + �M ∗ +$���� !�0�59� + �N ∗#�0"ℎ�-: !�0�59�, + �O ∗ �09�7���, + �ED ∗ <�"0���-� + �EE ∗ 2�3 !�P��, + �EC ∗70:-���, + �� + Q, + 5�, (1)
Where PIF = Process Improvement Factor i.e. Slack, Skill Mix or Focused Service
Strategy, ACA = Affordable Care Act; MHS = Multi-Hospital System; i = Hospital; t =

65
Time; γ = hospital fixed effect; δ = year fixed effects; u = error term. Based on our
hypotheses, our main coefficient of interest is β3.
3.4. Results
Our regression results are shown in Table 3.3. Consistent with Carte and Russell (2003),
we first provide the baseline model with only the direct effects of the three process
improvement factors with control variables in column 1 of Table 3.3. We find support for
H1 i.e. competition is positively associated with PoC (p<.01). Although, we do not
postulate hypotheses for the direct effects of the process improvement factors, these
results are important in assigning strength and validity to our model. As expected, slack,
skill mix and focus have a positive effect on PoC.
We then add the three interaction terms serially in columns 2-4 and include all
interactions in column 5 of Table 3.3. We find support for all our moderating hypotheses.
The impact of slack, skill mix and a focused service strategy is stronger in less
competitive markets (p<0.05 for all three interaction terms). Our results should be
interpreted with caution. Our direct effects indicate that slack, skill mix and a focused
service strategy are positive indicating that these process improvement factors are
important in improving PoC after controlling for the competition level that a hospital
operates in. However, the marginal benefit that hospitals derive from these factors will
depend on the level of competition. We illustrate this point further in Figure 3.2.
Consider competition levels at the 25th and 75th percentiles. If we study the influence of
slack at the 25th percentile of competition, we see that the average change in PoC with
respect to slack i.e. the slope is 1.373. At the 75th percentile of competition, the average
66
change in PoC with respect to slack is 0.133. In both cases, the impact of slack on PoC is
positive. However, the average effect of slack is much higher in less competitive markets.
Similar effects for skill mix and focused service strategy are illustrated in Figure 3.2. To
get a better sense of our findings, we see that a 10% increase in slack improves PoC by
1.64% and 0.2% in low and high competitive markets respectively, on average. A 10%
increase in skill mix improves PoC by 3.13% and 0.1% in low and high competitive
markets respectively, on average. Finally, a 10% increase in a focused service strategy
improves PoC by 4.52% and 1.58% in low and high competitive markets respectively, on
average. Although, the impact of our process improvement factors may seem small in
competitive markets, we need to understand that there are ceiling effects on how much
PoC can improve (it is capped at 100%). So, it is more difficult to improve PoC from say
96% to 99% on any given measure than it is to improve the same quality measure from,
say 75% to 90%. Given this, factors such as slack, skill mix and focus still play an
important role in improving quality in these markets and should not be neglected.
In addition, we find that among our control variables, ACA has a positive impact
on improving PoC. This is expected as financial incentives are tied to improvements in
PoC. We also find that hospitals that treat patients with a higher average case mix index
have higher PoC possibly reflecting investments in resources and research. It is also
possible that more difficult to treat patients may choose to go to higher quality hospitals.
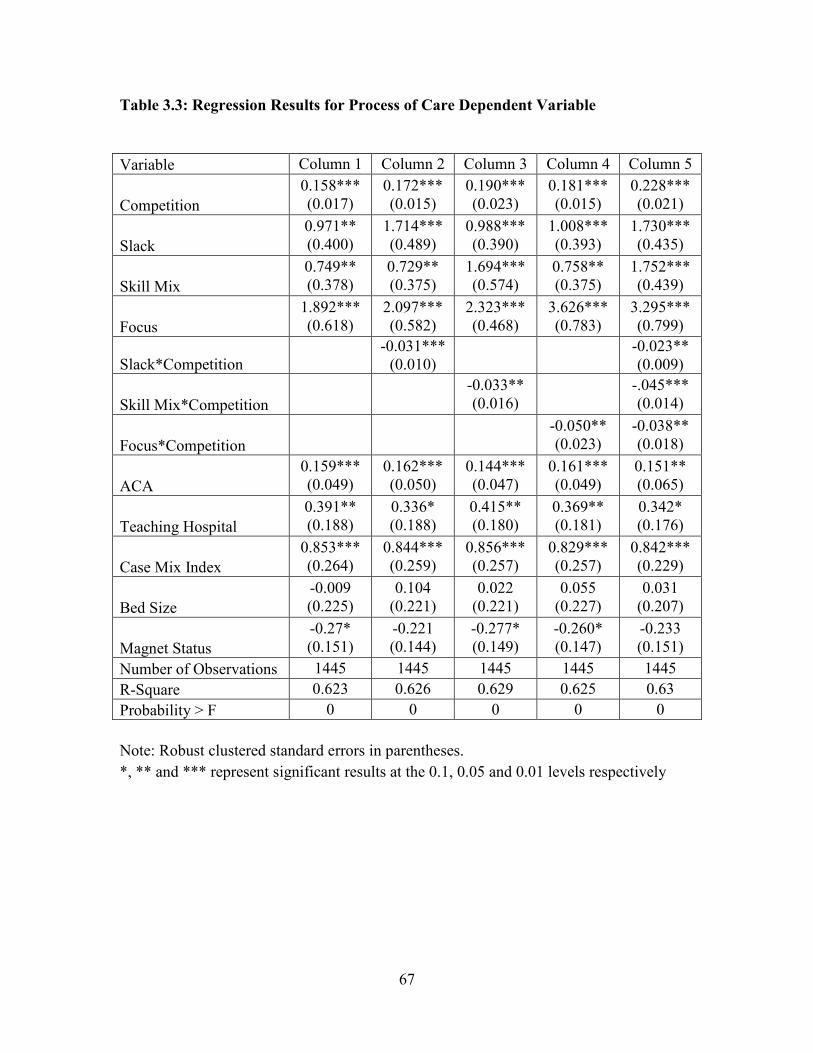
67
Table 3.3: Regression Results for Process of Care Dependent Variable
Variable Column 1 Column 2 Column 3 Column 4 Column 5
Competition
0.158*** (0.017)
0.172*** (0.015)
0.190*** (0.023)
0.181*** (0.015)
0.228*** (0.021)
Slack
0.971** (0.400)
1.714*** (0.489)
0.988*** (0.390)
1.008*** (0.393)
1.730*** (0.435)
Skill Mix
0.749** (0.378)
0.729** (0.375)
1.694*** (0.574)
0.758** (0.375)
1.752*** (0.439)
Focus
1.892*** (0.618)
2.097*** (0.582)
2.323*** (0.468)
3.626*** (0.783)
3.295*** (0.799)
Slack*Competition
-0.031*** (0.010)
-0.023** (0.009)
Skill Mix*Competition
-0.033** (0.016)
-.045*** (0.014)
Focus*Competition
-0.050** (0.023)
-0.038** (0.018)
ACA
0.159*** (0.049)
0.162*** (0.050)
0.144*** (0.047)
0.161*** (0.049)
0.151** (0.065)
Teaching Hospital
0.391** (0.188)
0.336* (0.188)
0.415** (0.180)
0.369** (0.181)
0.342* (0.176)
Case Mix Index
0.853*** (0.264)
0.844*** (0.259)
0.856*** (0.257)
0.829*** (0.257)
0.842*** (0.229)
Bed Size
-0.009 (0.225)
0.104 (0.221)
0.022 (0.221)
0.055 (0.227)
0.031 (0.207)
Magnet Status
-0.27* (0.151)
-0.221 (0.144)
-0.277* (0.149)
-0.260* (0.147)
-0.233 (0.151)
Number of Observations 1445 1445 1445 1445 1445
R-Square 0.623 0.626 0.629 0.625 0.63
Probability > F 0 0 0 0 0
Note: Robust clustered standard errors in parentheses.
*, ** and *** represent significant results at the 0.1, 0.05 and 0.01 levels respectively
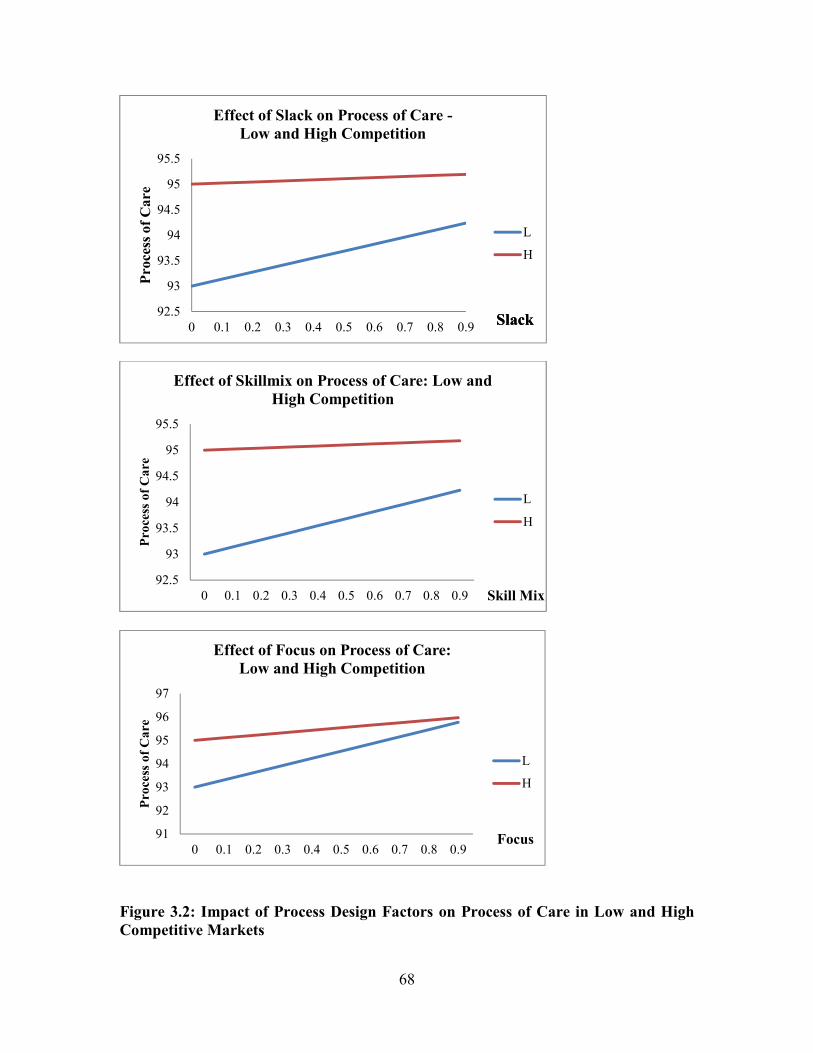
68
Figure 3.2: Impact of Process Design Factors on Process of Care in Low and High
Competitive Markets
92.5
93
93.5
94
94.5
95
95.5
0 0.1 0.2 0.3 0.4 0.5 0.6 0.7 0.8 0.9
Pro
cess
of
Ca
re
Effect of Slack on Process of Care -
Low and High Competition
L
H
SlackSlack
92.5
93
93.5
94
94.5
95
95.5
0 0.1 0.2 0.3 0.4 0.5 0.6 0.7 0.8 0.9
Pro
cess
of
Ca
re
Effect of Skillmix on Process of Care: Low and
High Competition
L
H
Skill Mix
91
92
93
94
95
96
97
0 0.1 0.2 0.3 0.4 0.5 0.6 0.7 0.8 0.9
Pro
cess
of
Ca
re
Effect of Focus on Process of Care:
Low and High Competition
L
H
Focus
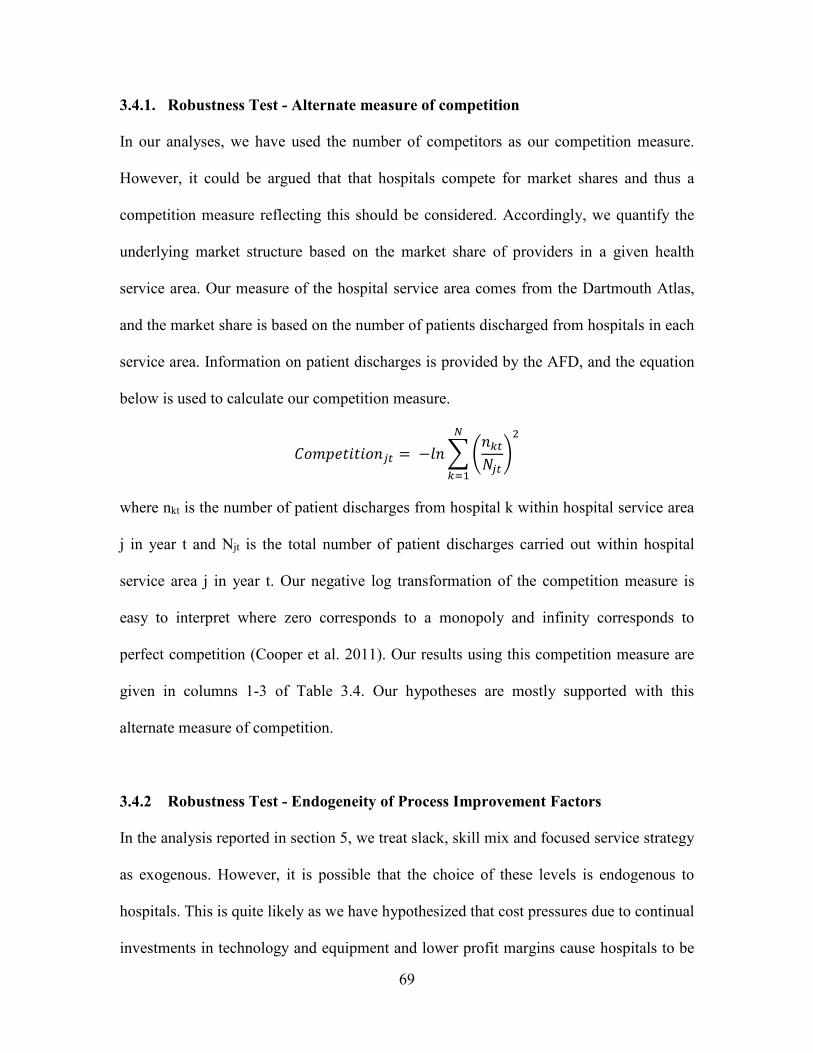
69
3.4.1. Robustness Test - Alternate measure of competition
In our analyses, we have used the number of competitors as our competition measure.
However, it could be argued that that hospitals compete for market shares and thus a
competition measure reflecting this should be considered. Accordingly, we quantify the
underlying market structure based on the market share of providers in a given health
service area. Our measure of the hospital service area comes from the Dartmouth Atlas,
and the market share is based on the number of patients discharged from hospitals in each
service area. Information on patient discharges is provided by the AFD, and the equation
below is used to calculate our competition measure.
����������-R, = −�- @ S-T,;R, UCV
TWE
where nkt is the number of patient discharges from hospital k within hospital service area
j in year t and Njt is the total number of patient discharges carried out within hospital
service area j in year t. Our negative log transformation of the competition measure is
easy to interpret where zero corresponds to a monopoly and infinity corresponds to
perfect competition (Cooper et al. 2011). Our results using this competition measure are
given in columns 1-3 of Table 3.4. Our hypotheses are mostly supported with this
alternate measure of competition.
3.4.2 Robustness Test - Endogeneity of Process Improvement Factors
In the analysis reported in section 5, we treat slack, skill mix and focused service strategy
as exogenous. However, it is possible that the choice of these levels is endogenous to
hospitals. This is quite likely as we have hypothesized that cost pressures due to continual
investments in technology and equipment and lower profit margins cause hospitals to be
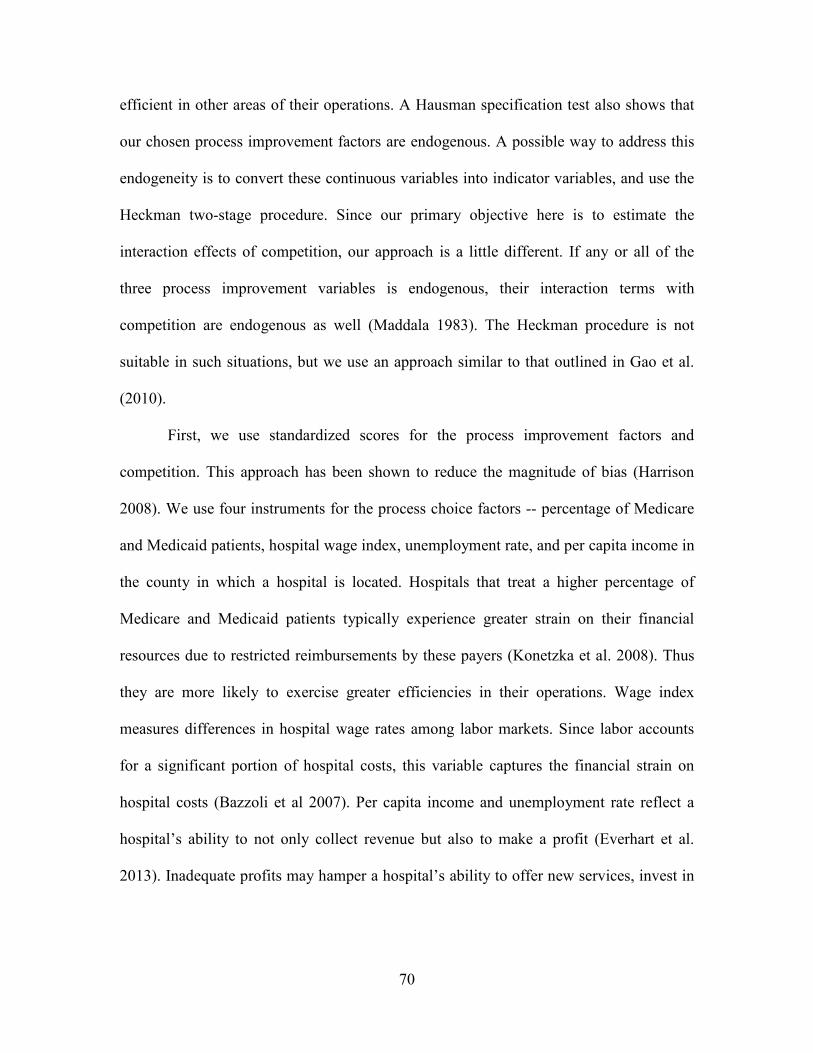
70
efficient in other areas of their operations. A Hausman specification test also shows that
our chosen process improvement factors are endogenous. A possible way to address this
endogeneity is to convert these continuous variables into indicator variables, and use the
Heckman two-stage procedure. Since our primary objective here is to estimate the
interaction effects of competition, our approach is a little different. If any or all of the
three process improvement variables is endogenous, their interaction terms with
competition are endogenous as well (Maddala 1983). The Heckman procedure is not
suitable in such situations, but we use an approach similar to that outlined in Gao et al.
(2010).
First, we use standardized scores for the process improvement factors and
competition. This approach has been shown to reduce the magnitude of bias (Harrison
2008). We use four instruments for the process choice factors -- percentage of Medicare
and Medicaid patients, hospital wage index, unemployment rate, and per capita income in
the county in which a hospital is located. Hospitals that treat a higher percentage of
Medicare and Medicaid patients typically experience greater strain on their financial
resources due to restricted reimbursements by these payers (Konetzka et al. 2008). Thus
they are more likely to exercise greater efficiencies in their operations. Wage index
measures differences in hospital wage rates among labor markets. Since labor accounts
for a significant portion of hospital costs, this variable captures the financial strain on
hospital costs (Bazzoli et al 2007). Per capita income and unemployment rate reflect a
hospital’s ability to not only collect revenue but also to make a profit (Everhart et al.
2013). Inadequate profits may hamper a hospital’s ability to offer new services, invest in

71
newer technology and equipment, or hire qualified nurses (McCue et al 2003). As a result
we use these as instruments in our robustness test.
The annual percentages of Medicare and Medicaid patients were calculated from
California’s AFD database. Annual hospital wage index values were collected from
CMS’ IPPS files. Annual county level unemployment rate and per capita income were
downloaded from the State of California’s Employment Development Department
(http://www.edd.ca.gov/). All instrument variables are lagged to reduce correlation with
the current variables. Following Wooldridge (2002), we devise another set of instruments
by multiplying the instruments for the process improvement factors with competition.
Together these instruments are used to identify the direct effects of the process
improvement factors and the interaction effect of competition on PoC. Other variables are
the same as in equation (1). The Sargan-Hansen test does not reject the null hypothesis
(p>.1) in our models indicating that the selected instruments are valid instruments, i.e.,
uncorrelated with the error term. The Kleibergen-Paap rk Test of under identification
shows that the selected instruments are valid (p<.1).
As seen in columns 4-6 of Table 3.4, the IV estimations of (Slack*Competition),
(Skill mix*Competition) and (Focus*Competition) on PoC are negative and significant,
consistent with our original hypothesis. We thus conclude that our results are robust even
after considering the endogeneity of process improvement decisions made by hospitals.

72
Table 3.4: Robustness Test for Process of Care Dependent Variable
Market Share Measure of
Competition Instrument Variable Approach
Variable Column
1 Column 2 Column 3
Column 4
Column 5 Column 6
Competition 5.024*** (0.627)
5.407*** (0.294)
5.753*** (0.670)
4.409*** (1.335)
7.222*** (2.516)
3.163*** (1.156)
Slack 4.115*** (1.392)
0.887** (0.148)
0.924** (0.402)
3.171* (1.935)
0.943 (2.304)
2.052* (1.107)
Skill Mix 0.958** (0.642)
4.217* (1.316)
0.925** (0.395)
1.152** (0.341)
1.694*** (0.574)
1.135*** (0.299)
Focus 1.958*** (0.051)
1.932 (0.726)
9.725*** (2.417)
1.600 (2.523)
6.304* (3.399)
2.291 (2.061)
Slack* Competition
-1.138** (0.486)
-0.461* (0.279)
Skill Mix* Competition
-1.285* (0.389)
-2.071* (1.242)
Focus* Competition
-2.737***
(0.902)
-1.781** (0.902)
ACA 0.046
(0.050) 0.041*** (0.033)
0.047 (0.050)
0.162*** (0.050)
0.144*** (0.047)
0.161*** (0.049)
Teaching Hospital
0.372** (0.183)
0.459 (0.206)
0.414** (0.171)
0.463 (0.697)
1.334* (0.799)
0.583 (0.560)
Case Mix Index
0.895*** (0.273)
0.947* (0.242)
0.887*** (0.271)
0.937 (0.685)
1.181 (0.804)
1.005* (0.575)
Bed Size -0.034 (0.227)
-0.058 (0.230)
0.023 (0.228)
-5.713 (4.044)
0.022 (0.221)
-1.774 (0.227)
Magnet Status -0.231 (0.145)
-0.263** (0.033)
-0.250* (0.143)
-0.221 (0.144)
-0.746 (0.496)
-0.260* (0.147)
Number of Observations
1445 1445 1445 1413 1413 1413
Probability > F 0 0 0 0 0 0
Note: Robust clustered standard errors in parentheses.
*, ** and *** represent significant results at the 0.1, 0.05 and 0.01 levels respectively

73
3.5. Impact of ACA on Process of Care and the Role of Process Improvement
Factors
The ACA introduced in 2010 emphasizes access to quality and affordable health
insurance to all Americans. However, critics argue that there are design flaws related to
patient enrollment and screening by insurers (Washington Post, 2013), that penalties are
too low to induce hospitals to make major changes (Zhang et al., 2015) and that low
performing hospitals may not have sufficient resources needed to improve quality (Joynt
and Rosenthal, 2012). By requiring insurance carriers to provide healthcare coverage to
everyone regardless of their medical condition, the ACA ensures greater insurance choice
for consumers. It lowers premiums through greater competition (Collins et al., 2014;
Wayne, 2014), which results in a greater number of people seeking services, and
hospitals can in turn compete for this increased pool of patients.
In order to achieve its goals of making patient care safer and improving access,
ACA has created the Pay for Performance (P4P) system. Under P4P, hospitals and other
healthcare providers are provided financial incentives to achieve optimal outcomes for
their patients. The P4P specifically establishes a Hospital Value Based Purchasing
Program (VBP), under which a portion of Medicare payments is withheld from hospitals
at the beginning of the year. A set of performance criteria comprising of clinical process
quality measures, patient experience measures and outcome measures are defined, and
hospitals are evaluated at the end of the year against these criteria. Hospitals are given
financial bonuses based on how well they do on these quality measures as well as how
much they improve over time. This program also penalizes hospitals that do not achieve

74
the specified goals, and encourages each hospital to improve its own quality over time, as
well as its quality compared to other hospitals (CMS, 2014).
Thus we see that the ACA has built in provisions that force hospitals to compete
for a larger patient pool, as well as a larger share of the bonuses that are tied to
improvements in hospital quality. The ACA thus acts as a catalyst in increasing
competition among all hospitals to attract more patients and improve their quality. As a
result, ACA in conjunction with competition is likely to moderate the way in which
internal factors in the hospital impact PoC. We test this theoretical argument by
considering the joint moderating effect of ACA and competition on the relationship
between internal factors and PoC. As ACA acts towards enhancing competition, we
would expect that our process improvement factors become more important in improving
quality under this new environment. Thus we would expect the direction of our joint
simultaneous moderating factors with ACA, competition and process improvement
factors to be similar to those with competition only as the moderator. These results
summarized in Table 3.5, lend support to our argument that ACA indeed acts toward
enhancing competition among hospitals.
Table 3.5: Joint Simultaneous Impact of Competition and ACA on Process of Care
Column 1 Column 2 Column 3
Competition 0.194*** (0.016)
0.222*** (0.021)
0.219*** (0.017)
Slack 1.371*** (0.407)
1.744*** (0.317)
1.759*** (0.317)
Skill Mix 0.514
(0.322) 0.847
(0.545) 0.575* (0.320)
Focus 2.012*** (0.554)
2.072*** (0.544)
3.622*** (0.856)
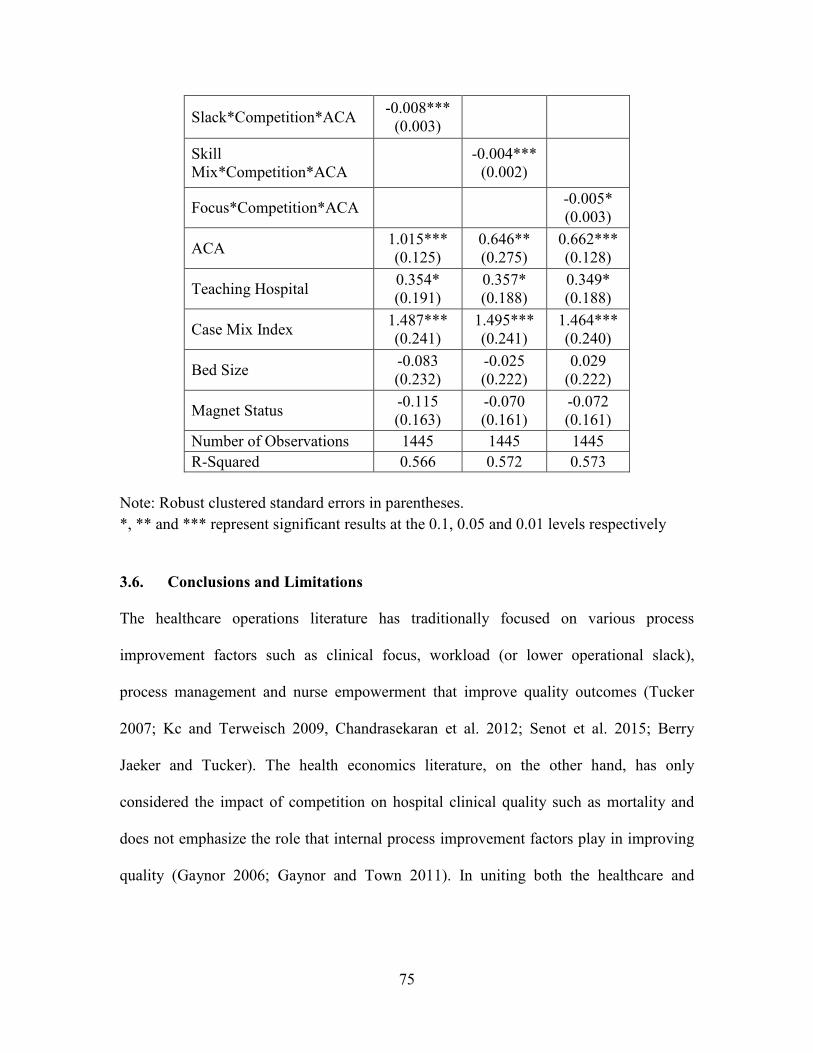
75
Slack*Competition*ACA -0.008***
(0.003)
Skill Mix*Competition*ACA
-0.004***
(0.002)
Focus*Competition*ACA -0.005* (0.003)
ACA 1.015*** (0.125)
0.646** (0.275)
0.662*** (0.128)
Teaching Hospital 0.354* (0.191)
0.357* (0.188)
0.349* (0.188)
Case Mix Index 1.487*** (0.241)
1.495*** (0.241)
1.464*** (0.240)
Bed Size -0.083 (0.232)
-0.025 (0.222)
0.029 (0.222)
Magnet Status -0.115 (0.163)
-0.070 (0.161)
-0.072 (0.161)
Number of Observations 1445 1445 1445
R-Squared 0.566 0.572 0.573
Note: Robust clustered standard errors in parentheses.
*, ** and *** represent significant results at the 0.1, 0.05 and 0.01 levels respectively
3.6. Conclusions and Limitations
The healthcare operations literature has traditionally focused on various process
improvement factors such as clinical focus, workload (or lower operational slack),
process management and nurse empowerment that improve quality outcomes (Tucker
2007; Kc and Terweisch 2009, Chandrasekaran et al. 2012; Senot et al. 2015; Berry
Jaeker and Tucker). The health economics literature, on the other hand, has only
considered the impact of competition on hospital clinical quality such as mortality and
does not emphasize the role that internal process improvement factors play in improving
quality (Gaynor 2006; Gaynor and Town 2011). In uniting both the healthcare and

76
economics perspectives, our research suggests that the benefits of internal process
improvement factors depend on the nature of competition.
By studying the impact of a focused service strategy, nursing skill mix and slack
on process of care from 2007 – 2013, we make several research and practical
contributions in better understanding whether the impact of these internal hospital factors
on quality outcomes changes in the presence of competition and ACA. These
contributions are particularly important due to the renewed focus on improving the
quality of care with the introduction of the ACA.
3.6.1 Contributions to Theory
Tying our results back to the existing healthcare operations and economics literature, our
H1 finding that hospitals in highly competitive environment are associated with better
process of care corroborates the past findings on mortality and readmissions outcome
measures (Kessler and Geppert, 2005; Kessler and McClellan, 1999; Shen, 2003).
However, since competition is largely localized, exogenous and out of control of the
hospitals, we examine three higher-level constructs that are the emergent characteristics
of hospitals: focused service strategy, slack, and nursing skill mix in the context of
competition and their impact on the process of care. We believe that focused service
strategy, slack, and nursing skill mix are a combination of endogenous and exogenous
factors. For instance, hospitals may choose to emphasize a few types of treatments based
on the demand profile of the region, and slack in terms of vacant bed capacity that may
vary over years based on the growth of a region. Similarly, although nursing skill mix is
largely endogenous and within hospital control, it may be more difficult for hospitals to
hire registered nurses in rural areas if there is a shortage in the availability of registered

77
nurses in such areas. By examining the contingency effects of competition on the main
effects of focused service strategy, slack, and nursing skill mix on the process of care (the
main effects have already been studied in the past healthcare operations literature), our
paper provides richer understanding of these three emergent characteristics. We also add
to other papers in the broader realm of service operations that study contingency effects
(see for e.g. Gao et al. 2010).
A broad conclusion that emerges from our findings is that the marginal returns
from investing in key process improvement factors such as slack, nursing skill mix and
focused service strategy on process of care are heterogeneous, and based on the nature of
competition within which a hospital operates; nevertheless the effects are still positive.
Given that hospitals in more competitive markets have a higher base quality to begin
with, as the result from our hypothesis H1 also confirms, the fact that we find that process
improvement factors enhance process of care in competitive markets is an important
finding.
Our paper is also one of the first to incorporate the impact of ACA on the
relationship between internal process improvement factors and process of care metrics.
By providing incentives and penalties, the ACA acts as a catalyst in increasing
competition among hospitals by making them compete for patients and financial
incentives. This further reinforces our theoretical arguments, and confirms our
predictions related to the value of these process improvement factors in improving
process of care metrics. Besides the use of technology, higher process of care is also the
result of better teamwork, management’s commitment to quality improvement through
organizational restructuring, and design of more efficient processes. As previously
78
discussed, improved processes of care also improve other downstream outcome measures
such as readmissions and mortality that are tied to bonuses and penalties under the VBP
program.
3.6.2 Contributions to Practice
There are several significant takeaways for hospital administrators and executives based
on our study, many of which are nuanced and not necessarily obvious at first blush. In
the face of increasing competition, choices made for the process improvement factors not
only affect both long-term and short-term cost structures, but also impact the hospital’s
responsiveness and ability to provide a high standard of care to its patients. For instance,
by having a focused service strategy, hospitals will have less heterogeneity in the patients
that they treat, and hence their tasks will be more standardized. This would allow more
latitude for designing standard work flows and deliver better care with a higher level of
efficiency. With respect to slack resources, clinical and non-clinical staff in hospitals that
have more slack will be less busy, and hence will have more time to get trained in
following established procedures and protocols for clinical treatment of different kind of
patients. This better training will enable better adherence to the standard operating
procedures, and hence will improve process of care score. Finally, hospitals that employ a
higher proportion of registered nurses in their nursing skill mix will have better flexibility
in using these nurses as and when required. Hospitals in the U.S. have a perennial nurse
shortage (Goodin 2003), and hospitals usually spend much more to hire agency nurses
when they experience nurse shortages (Kline 2003). Even though higher skill mix is more
expensive, hospitals that create more flexibility by investing in a higher proportion of
79
registered nurses would be less likely to incur extra expenditures in their operating cost
structure. Given the high cost associated with agency nurses, it may even lead to savings
in the long run. These hospitals will have the added advantage of a higher proportion of
better-trained registered nurses operating at the top of their license, which in turn will
lead to higher process of care scores.
Due to declining reimbursements and financial constraints, hospital executives
may be tempted to resort to lower slack and skill mix, erroneously thinking that quality
can be improved by emphasizing efficiency in these areas. However, improvements in
patient quality and care cannot happen when slack is low, because such hospitals will
lack the ability to rethink current processes, or to devote the time needed to making them
better and safer for patients (Demarco 2001), or to devote time for better training that will
lead to better adherence and higher process of care scores. Recent research has
highlighted the importance of better bed management, and has suggested optimizing
hospital wing formation (i.e. partitioning of beds and care types) as a potential way to
pool demand and bed capacity (Best et al., 2015). Slack is needed for developing
appropriate measures to determine bed needs and delays in getting patients to these beds,
doing adequate capacity planning by clinical unit after taking seasonality factors into
account, and developing appropriate scheduling of elective surgeries to smooth out peaks
and valleys in occupancy rates (Green and Nguyen, 2001; Litvak and Bisognano, 2011).
Only then can hospitals avoid treatment delays and optimize utilization without
compromising process of care. Better bed management decisions will enhance timely
service, improve patient satisfaction, and decrease the costs per patient (Donabedian,
1988).

80
Hospitals also face cost pressures in maintaining a higher cost labor related to a
high skill mix. However, a higher skill mix is more productive and efficient and more
likely to detect and treat abnormal conditions on time, thereby reducing the number of
patient complications and preventing adverse events (Cho et al. 2003). Thus even though
a high skill mix may increase hospital payroll expenditures, it actually reduces the cost of
patient care and ultimately contributes to hospital profitability (McCue et al., 2003). At
the same time, caution is urged. A McKinsey study recently estimated that more than a
third of routine patient related activities such as transporting patients, obtaining
medications from pharmacy, scheduling diagnostic tests, etc. can be safely performed by
non-RN healthcare providers (Mckinsey, 2014). Hospitals thus need to carefully map
work processes of both registered and other nurses to arrive at the optimal skill mix that
fits their needs. Following this approach would ensure that the hospitals have higher
flexibility, which would also allow the higher skilled RNs to spending more of their time
on improving quality of processes and applying their enhanced skill sets.
It must be noted in this context that slack and skill mix go hand in hand. Low
slack has been associated with nurse burnout and job dissatisfaction, threats to patient
safety, and high nurse turnover (Vahey et al. 2004). In an environment where nurse
shortages are reported and registered nurses are critical to providing patient care; creating
a better work environment is critical in retaining this highly skilled labor to ensure
continuity of quality improvement efforts, especially for hospitals in more competitive
markets where nurses have greater inter-employer mobility. Dissatisfaction with the work
environment is often cited for nurse turnover, which costs hospitals between $10,000 to
$60,000 per nurse (Hayes et al., 2006).
81
Finally, even though our study has recommended a focused service strategy to
improving process of care scores under higher competitive conditions, many hospitals
may find it difficult to become a highly focused factory like Shouldice hospital (Heskett
2003). However, it may be possible for most hospitals to develop certain specialty areas
as ‘centers of excellence’ to create differentiation, especially in markets that may have
several high-quality competitors. This strategy has several benefits – it helps develop
standardized and evidence-based protocols that enable hospitals to follow standard work
procedures due to less patient heterogeneity, provides greater engagement on the part of
physicians and nurses in the delivery of care, helps attract highly skilled physicians, and
sets industry standards and a reputation for innovation by establishing best practices
(Rodak, 2013). This strategy can be reputation enhancing, as it can help hospitals claim
higher level of patient care outcomes as well as market leadership in specific specialty
areas, while maintaining a full-service line (Devers et al., 2003).
3.6.3 Limitations and Future Research
We believe that our study can spur further work in this area. Our measures of slack, skill
mix and a focused service strategy are all at the hospital level. Future research can
examine more refined process of care measures at the department or unit level to
understand specific elements that can improve patient quality. Future studies can also
break down the various components of patient satisfaction quality to understand which of
our process factors have the most impact. A similar approach can be used to examine the
impact of these process improvement factors on other clinical outcomes such as
readmissions and mortality. Since our data sample is limited to California acute-care

82
hospitals only, future studies can expand this analysis to other states in USA. Such
studies may find interesting state-specific effects, and possibly use patient level data to
examine the impact of various strategies on patient outcomes.

83
CHAPTER 4
IMPACT OF HOSPITAL CHARACTERISTICS ON PATIENT CHOICE
BEHAVIOR FOR ELECTIVE SURGERIES3
Abstract
Studies in the healthcare operations management literature have typically focused on the
supply side of the equation. Much less attention has however been paid to how hospital
structural and infrastructural (SI) investments, reputational factors, and perceptual patient
satisfaction influence choice of a hospital when patients have to undergo elective
surgeries. Using detailed patient level data from California hospitals on elective hip and
knee surgeries, our results indicate that SI investments, third-party reputation signals, and
patient satisfaction influence patient choice, but to varying degrees. Our results reveal
that hip and knee patients are willing to travel an additional 7.5 miles for a 10% increase
in SI investments, an additional 2.2 miles for a more reputed hospital and an additional
1.5 miles for a 10% improvement in patient satisfaction scores. As the complexity of
comorbidities in patients increases, they are more likely to choose a hospital based on its
SI investments and reputation, and less likely to choose a hospital based on higher patient
satisfaction scores. Higher comorbidity patients are also willing to travel further for better
3 Wani, D. and M. Malhotra. To be submitted to Production and Operations Management

84
hospital attributes. Such findings are of managerial importance. Our expanded analysis
on elective heart surgery patients mostly support our results, but also indicates that the
complexity of disease and its treatment may play a role in the way various hospital
attributes are emphasized. Theoretical and practical implications of our results are
discussed.
Keywords: Elective Surgeries, Hospital Characteristics, Patient Choice, and Comorbidity
Complexity
4.1. Introduction
Changes in the government reimbursement system over time has put greater pressures on
hospitals’ financial resources due to slower revenue growth and decline in profits (Shen
2003; Bazzoli et al., 2008; Werner 2010). Thus hospitals have to seek ways to improve
their bottom line and have sufficient financial resources that can then be invested in better
quality of care for all patients. Some of the approaches adopted by hospitals to improve
their bottom line in the past has been via cost-cutting efforts e.g. reducing bed capacity,
replacing high cost of registered nurses with that of less qualified personnel, or through
quality improvement efforts (Green and Nguyen 2001; Cummings and Estabrooks 2003;
Lindenauer et al. 2007). Another potential way is to increase revenue by attracting more
patients to their hospitals. The Affordable Care Act (ACA) signed in 2010 has resulted in
a greater number of newly insured people seeking hospital services and provides an
avenue for hospitals to bring in more patients. A recent report suggests that hospitals in
several states have reported a significant decrease in unreimbursed costs of care and have
actually made a profit (http://www.reuters.com/article/us-usa-hospital-medicaid-insight-
idUSKCN0PX0CY20150723) as a result of increased volume of insured patients due to

85
ACA. Thus how and why patients choose a hospital can have a direct impact on its
revenues, and hospitals have to compete to attract this increased pool of patients.
In the manufacturing literature, there is little dispute about the importance of
quality in gaining competitive advantage. Studies have shown that markets react to both
tangible aspects of a product’s quality as well as to quality reputation of a firm that is
more perceptual in nature (Garvin 1988; Hendricks and Singhal 1995). The services
marketing literature considers factors such as responsiveness, competence,
communication, and employee effort to understand customer needs as some of the key
determinants of service quality (Parasuraman et al. 1985). Researchers have argued that
in healthcare, consumers lack good information about the quality of their healthcare
providers, and so are unable to make rational choices (Cutler 2010; Skinner 2011;
Chandra et al. 2015). Patients seeking hospital services can potentially be at a
disadvantage, as they may not have the necessary expertise to evaluate the clinical quality
of services (Berry and Bendapudi 2007). A question that naturally emerges is what
specific hospital attributes attract patients to hospitals?
In terms of increasing their profile, hospitals can make various structural and
infrastructural (SI) investments in state-of-the-art diagnostic equipment, and also hire
leading-edge healthcare providers to differentiate themselves from their competitors to
attract insurers, physicians and patients (Dranove et al. 1992; Cutler et al., 2004; Devers
et al. 2003; Tay, 2003). They may also choose to improve their patient experience by
focusing on the experiential aspects of health care delivery such as patient-provider
communication, and other non-care aspects (Manary et al. 2013). Reputation signaling, in
the form of third party agencies generating ratings to inform consumers about various
86
products and services, have been prevalent for several decades in areas such as car and
electronic gadgets buying, restaurant and hotel experience, etc. They have now been
extended to healthcare as well. In recent times, there has been a surge in the number of
private companies and non-profit organizations such as the US News and World Report
(USNWR), Centers for Medicare and Medicaid Services’ Hospital Compare website, the
Joint Commission, Leapfrog Group, etc. that signal a hospital’s reputation via rankings,
scores, and awards posted on their websites. This is being done in an attempt to help
patients make informed choices while selecting a hospital. It can also be confusing for
patients and hospitals, as there are many quality signals that can potentially influence a
patient’s decision of a hospital.
How should hospital allocate their scarce resources to get the biggest bang for the
buck in attracting patients? Should they make more SI investments that improve their
clinical quality of care? Should they put greater emphasis on the patient experience and
invest in resources that improve the communication, responsiveness and appearance of
their facilities? Should they invest more in marketing by highlighting their ratings and
awards in order to attract patients to their hospitals? Are some of these investments more
effective than others? This study offers a more holistic approach to understanding and
answering these questions by systematically evaluating the drivers behind patient choice.
In particular, we focus on three important attributes that can drive patient choice (i)
hospital’s SI investments, (ii) hospital’s perceptual quality as measured by patient
satisfaction and (iii) hospital reputation signaling by third parties to understand what is
important to patients as revealed by the patients’ choice of hospital.
87
When looking at dominant trends in profiles of patients in US seeking hospital
services, they are living longer and with a larger plethora of diseases that co-exist with
one another. Comorbidities such as hypertension, obesity, diabetes, etc. are on the rise in
the US. It is estimated that in 2010, over half of the US population had at least one
comorbidity and almost a third of the population had multiple comorbidities (Gerteis et
al. 2014). The same study also estimated that 86% of healthcare cost spending is for
patients with one or more such conditions. Policy makers who monitor the prevalence of
such conditions in the population are likely to develop new policies to slow down the
growth of such conditions. Hospitals will also have to participate in this process and help
develop more effective treatment protocols, design better care coordination and care
transitions, and hire appropriate mix of nurses and physicians to address this growing
problem (Bodonheimer et al. 2009; Hewner 2014). Knowing how patients with multiple
conditions choose hospitals will provide some insight to hospital managers on how to put
their financial resources to best use and provide high quality care to such patients in the
future. Thus the second research question that we address in the study is whether patients
with greater comorbidity complexity tend to emphasize certain hospital attributes over
others?
To answer our research questions, we choose to study choice in the context of
elective surgeries. These patients have sufficient time to talk to their primary healthcare
provider, seek opinions from friends and family and gather information from online
sources to deliberate various options, and hopefully make an informed choice. A study of
patient choice as conducted here in this paper is unique because the operations
management healthcare literature has traditionally focused at the supply side factors such
88
as investments in information technology, focus, nurses, etc. and their impact on various
quality outcomes (Tucker 2007; KC and Terweisch 2011; McDermott and Stock 2011;
Angst et al. 2012; Devaraj et al. 2013; Sharma et al., 2016; Gardner et al. 2015). Studies
have also looked at the impact of improving clinical and patient satisfaction quality on
outcomes such as cost and readmissions (Senot et al. 2015). The impact of third party
reputation signaling via awards and certifications on a firm’s financial performance has
been studied (Hendricks and Singhal 1996; Corbett et al., 2005), but not in the healthcare
context. To the best of our knowledge, the OM healthcare literature has not
simultaneously studied the impact of (SI) investments, patient satisfaction, and third party
reputation signaling on the demand side of the equation i.e. whether such factors enhance
demand for services. We also do not know what role patient characteristics, such as
comorbidity complexity, plays in shaping up patients’ choices.
In our study, we use revealed preference empirical data from California patient
discharge records. Our analysis focuses on elective hip and knee surgeries to test our
hypotheses, but subsequently we also validate and extend our results to elective heart
surgeries. Our study is one of the few that uses secondary data rather than surveys to
construct a choice model using patients’ revealed preferences to understand how patients
emphasize certain attributes of hospitals over others. More importantly, we emphasize
understanding patient choice from the perspective of a different patient segment i.e.
patients with complex comorbidities rather than focusing on differences based on age,
gender and race. This is especially important as the percentage of this segment in the
overall patient population is exhibiting an increasing trend.
89
To preview our findings, we find that patients undergoing elective hip and knee
surgeries emphasize SI investments, reputation, and patient satisfaction to varying
degrees, thus providing a more holistic treatment of revealed patient preferences. Our
analysis also reveals that as the complexity of comorbidities in patients increases, patients
are more likely to choose hospitals based on their SI investments and hospital reputation,
and less likely to select hospitals based on patient satisfaction scores. Extended analysis
of elective heart surgeries mostly confirms our findings for hip and knee surgeries, but
also shows some differences, which we surmise may be due to differences in the
complexity of disease and its treatment between these two different types of elective
surgeries.
The rest of the paper is structured as follows: In sections 4.2 and 4.3, we discuss
the literature on patient choice and develop our hypotheses. In section 4, we describe our
data and econometric modelling approach. Section 4.5 deals with the empirical
specification of the patient choice model. Results and robustness tests are discussed in
section 4.6. Conclusions and theoretical and managerial contributions are discussed in
section 4.7.
4.2. Literature Review
Although extensive research efforts have been devoted to understanding drivers of patient
choice in both primary care and hospital settings, most of these studies have been in the
health economics literature. These studies adopt a survey based or a stated choice
approach focusing on issues such as accessibility, qualification and communication style
of providers, type and size of institution, cost of service, waiting time and patient

90
demographics (see Victoor et al. (2012) for a recent review). Despite some studies in the
health economics literature, the analysis of revealed patient preference (RPP) data using
choice models (CM) is still rare in the healthcare operations management literature. Table
4.1 summarizes the RPP/CM studies in the health economics literature, datasets and data
period considered in the study, type of surgery (i.e. emergent or elective), variables and
controls (first and second lines in the column), main results and patient segments used in
the choice model. We are currently aware of only one study in the OM healthcare
literature by Wang et al. (2015) in this domain.
Table 4.1: Summary of Prior Revealed Patient Preference and Choice Model Studies
Study Datasets
and Data
Period
Type of
Surgery
Variables and
Controls
Patient
Segments
Results
Luft et al. (1990)
Patient discharge records from 3 geographic areas in California Year: 1983
Mix of elective and emergent surgical and medical procedures
Mortality rate for each procedure. Distance, Teaching hospital, Hospital ownership, Hospital charges
None 1. Mixed results - Mortality rates may increase or decrease likelihood of choice depending upon the surgery/ medical procedure
Tay (2003) Patient discharge records from California, Oregon and Washington Year: 1994
Medicare Heart Attack patients
Staff per bed, Specialty diagnostic equipment, Complication, Mortality rates. Distance, Teaching hospital, Hospital size
Patient age, Gender, Race
1. Patients prefer hospitals with specialty equipment, more staff per bed and lower mortality rates 2. Older and female patients are less likely to travel further
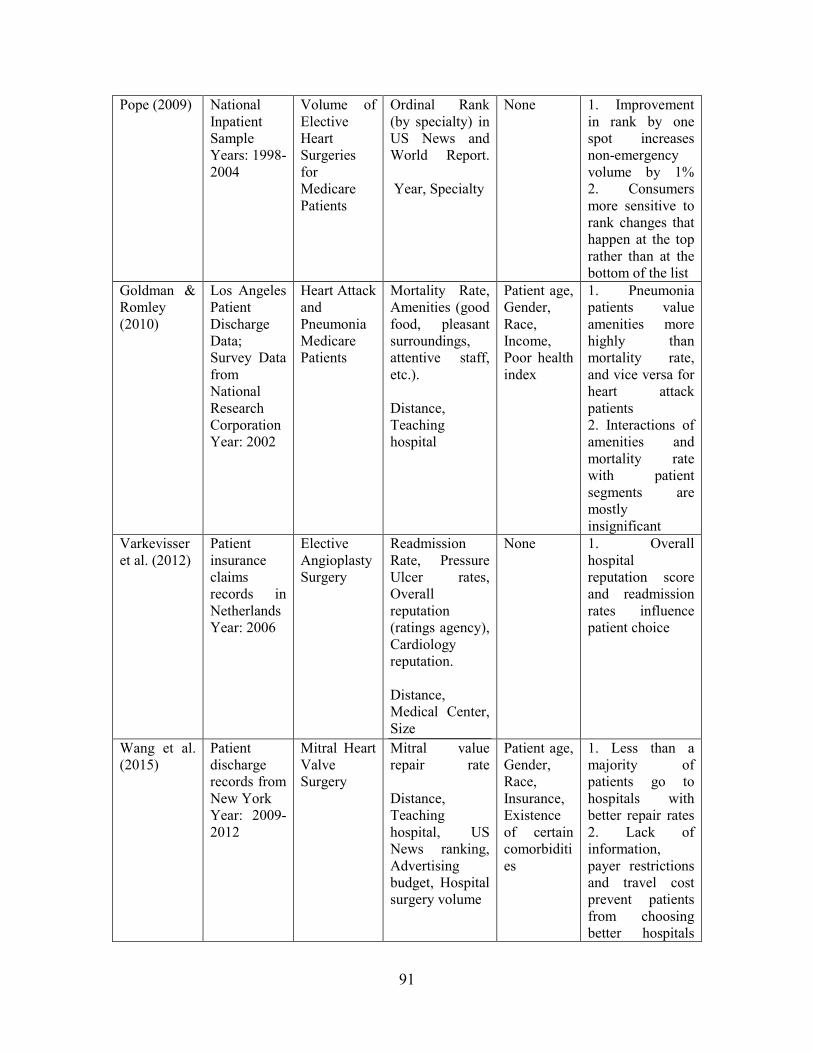
91
Pope (2009) National Inpatient Sample Years: 1998-2004
Volume of Elective Heart Surgeries for Medicare Patients
Ordinal Rank (by specialty) in US News and World Report. Year, Specialty
None 1. Improvement in rank by one spot increases non-emergency volume by 1% 2. Consumers more sensitive to rank changes that happen at the top rather than at the bottom of the list
Goldman & Romley (2010)
Los Angeles Patient Discharge Data; Survey Data from National Research Corporation Year: 2002
Heart Attack and Pneumonia Medicare Patients
Mortality Rate, Amenities (good food, pleasant surroundings, attentive staff, etc.). Distance, Teaching hospital
Patient age, Gender, Race, Income, Poor health index
1. Pneumonia patients value amenities more highly than mortality rate, and vice versa for heart attack patients 2. Interactions of amenities and mortality rate with patient segments are mostly insignificant
Varkevisser et al. (2012)
Patient insurance claims records in Netherlands Year: 2006
Elective Angioplasty Surgery
Readmission Rate, Pressure Ulcer rates, Overall reputation (ratings agency), Cardiology reputation. Distance, Medical Center, Size
None 1. Overall hospital reputation score and readmission rates influence patient choice
Wang et al. (2015)
Patient discharge records from New York Year: 2009-2012
Mitral Heart Valve Surgery
Mitral value repair rate Distance, Teaching hospital, US News ranking, Advertising budget, Hospital surgery volume
Patient age, Gender, Race, Insurance, Existence of certain comorbidities
1. Less than a majority of patients go to hospitals with better repair rates 2. Lack of information, payer restrictions and travel cost prevent patients from choosing better hospitals
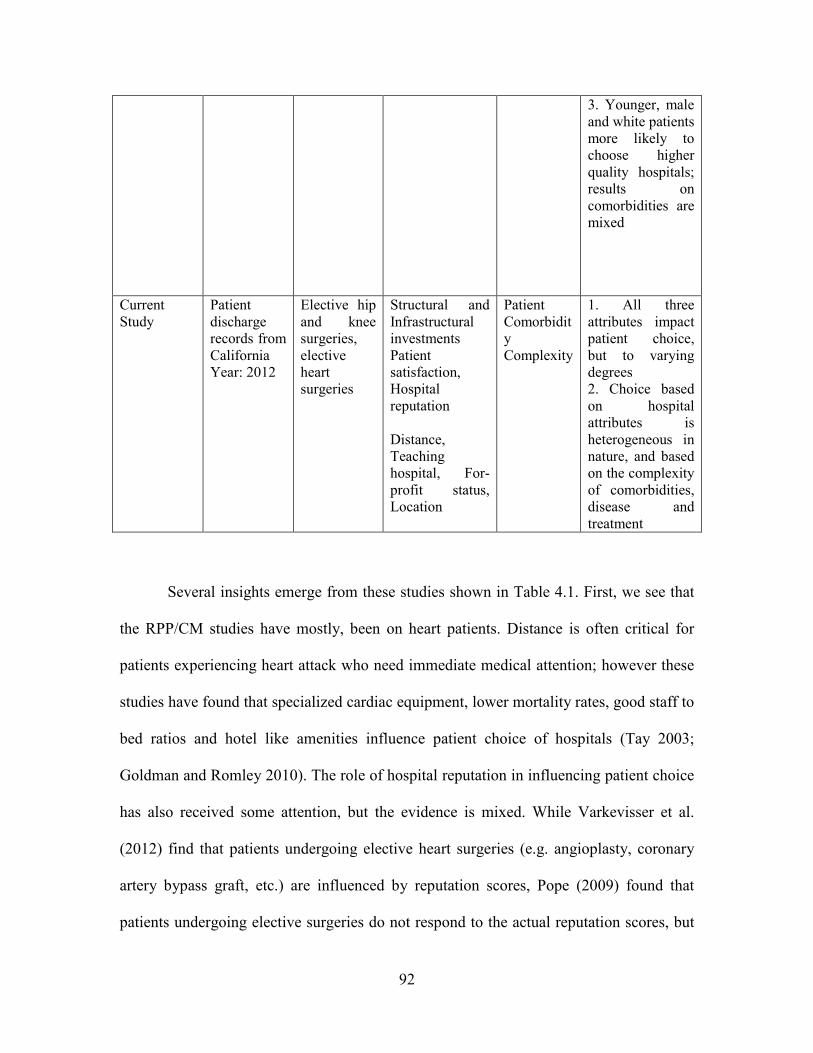
92
3. Younger, male and white patients more likely to choose higher quality hospitals; results on comorbidities are mixed
Current Study
Patient discharge records from California Year: 2012
Elective hip and knee surgeries, elective heart surgeries
Structural and Infrastructural investments Patient satisfaction, Hospital reputation Distance, Teaching hospital, For-profit status, Location
Patient Comorbidity Complexity
1. All three attributes impact patient choice, but to varying degrees 2. Choice based on hospital attributes is heterogeneous in nature, and based on the complexity of comorbidities, disease and treatment
Several insights emerge from these studies shown in Table 4.1. First, we see that
the RPP/CM studies have mostly, been on heart patients. Distance is often critical for
patients experiencing heart attack who need immediate medical attention; however these
studies have found that specialized cardiac equipment, lower mortality rates, good staff to
bed ratios and hotel like amenities influence patient choice of hospitals (Tay 2003;
Goldman and Romley 2010). The role of hospital reputation in influencing patient choice
has also received some attention, but the evidence is mixed. While Varkevisser et al.
(2012) find that patients undergoing elective heart surgeries (e.g. angioplasty, coronary
artery bypass graft, etc.) are influenced by reputation scores, Pope (2009) found that
patients undergoing elective surgeries do not respond to the actual reputation scores, but

93
only to the year-over-year changes in ordinal rating. Further, the authors of the first study
(Varkevisser et al. 2012) note that hospitals that are rated high on one quality dimension
are ranked low on other quality dimensions, thereby bringing into question the use of
multiple reputation scores to understand patient choice. As reported in a study by Luft et
al. (1990), better outcome measures also do not reliably predict patient choice. The
authors found that higher mortality rates may either increase or decrease the likelihood of
selection for different categories of elective surgeries. Finally, Wang et al.’s (2015) study
focuses on developing a methodology for determining the quality outcome for a specific
type of heart surgery known as the mitral valve surgery. Their study finds that lack of
information; travel costs and payer restrictions prevent patients from seeking better
hospitals. So patients do not overwhelmingly choose hospitals with better outcomes. To
summarize the studies listed in Table 4.1, patients may prefer hospitals that perform
better on quality outcome measures and reputation signals only under certain conditions.
But the evidence is not clear, especially for elective surgeries.
Our study extends the current literature on RPP/ CM along several important
dimensions. A central premise of the reported research in services marketing is that
examining only a limited subset of the direct effects of quality, or only considering one
variable at-a-time, may confound our understanding of consumers’ decision-making
(Cronin et al. 2000). This in turn can lead to strategies that either overemphasize or
underappreciate the importance of one or more of these variables. The RPP/CM studies
focus on either hospital characteristics or reputation measures, but do not study them
together. This approach is likely to overemphasize the impact of the key independent
variable under study. Moreover the role that “soft” factors such as patient-provider
94
communication, provider responsiveness, etc. play in determining revealed patient choice
has not been studied before. Second, a lot of emphasis has been placed on patients
requiring heart procedures, but relatively little is known about how patients choose
hospitals for other common elective surgeries e.g. hip and knee replacements. It is
important to understand the differences for different types of surgeries, because although
hospital and surgeon report cards and government based reports on mortality rates are
available for both elective and emergency heart surgery patients, such measures are not
readily available for other elective surgeries. In such situations, where publicly available
information is scarce, patients may spend a significant amount of time gathering
information from various sources such as physicians, family members and media before
selecting a hospital. We focus on three specific groups (or clusters) of hospital attributes:
(i) hospital SI investments, (ii) patient satisfaction and (iii) reputation signaling by third
parties. By focusing on one of the most common types of surgeries performed in the US
i.e. hip-knee surgeries, we are able to uncover the degree to which various hospital
attributes are emphasized. In addition, we also conduct our analysis on heart surgeries to
understand if any differences occur among different types, but commonly performed,
elective surgeries.
Heterogeneity in the way patients choose hospitals has received attention in some
studies, but the focus has mostly been on demographic differences based on age, gender
and race. When issues such as poor patient health or the presence of comorbidities are
considered, the results are either insignificant or mixed (Goldman and Romley 2010;
Wang et al. 2015). However, given the increased prevalence of comorbidities in the
patient population that we have previously highlighted, it is critical to understand whether
95
any heterogeneity in patient choice exists based on the comorbidity complexity of
patients. Patients with higher comorbidity complexity may emphasize certain attributes
more over others, and our study seeks to uncover such preferences.
4.3 Hypothesis Development
In our study, we assume that the decision to choose a hospital for an elective surgery
could be made by the patient himself or herself or in consultation with the primary
physician, family and friends. A similar assumption has also been made in previous
literature (Tay 2003). Revealed preferences of patients undergoing an elective surgery
based on three specific attributes: hospital SI investments, perceptual patient satisfaction,
and reputation of the hospital is more relevant to our study rather than who makes the
decision for the patient.
4.3.1 Role of Structural and Infrastructural Investments in Influencing Hospital
Choice
For our first attribute, we choose to focus on three specific hospital SI investments:
technology, registered nurse staffing, and hospital focus on specific elective surgeries.
These attributes have been known to have a positive impact on patient quality in the past
literature. Thus they serve as excellent proxies for hospital quality.
Technology here comprises of key clinical, administrative, and strategic
technologies that a hospital invests in an attempt to signal their state-of-the-art
technology preparedness and quality to potential insurers, physicians, and patients
(Robinson 1988; Devers et al. 2003). Clinical technologies have a direct impact on

96
patient outcomes (Angst et al. 2012, Sharma et al. 2016). However, a robust supporting
administrative and strategic IT infrastructure also signals that the hospital has good
organizational learning capabilities and can integrate IT into its processes. These help in
improving the efficiency and effectiveness with which patient flow occurs in the hospital,
and in turn improves patient outcomes and satisfaction (Queenan et al., 2011; Devaraj et
al. 2013; Gardner et al. 2015; Sharma et al. 2016). Thus we expect that patients are more
likely to select hospitals with more sophisticated technology.
It has been recognized that “nurses are at the front-line of patient care and are in
the best position to detect problems, monitor conditions, and rescue when necessary”
(Joint Commission on Accreditation of Healthcare Organizations 2002). In a hospital
setting, patients value competence, knowledge and technical skills associated with
registered nurses (Bassett, 2002). Registered nurse (RN) staffing (as defined by the
number of hours spent by registered nurses per patient day) is also associated with better
patient monitoring, detecting and treating complications, preventing adverse events such
as infections, and adhering to high standards of care as they have the necessary
knowledge and skill levels (Schultz et al. 1998; Provonost et al. 1999; Cho et al. 2003)
Given that the qualities associated with registered nurses (skilled personnel) are highly
valued, we would expect greater staffing of registered nurses to play a significant factor
in patient choice.
The operations management literature has previously highlighted the benefits of
focus on outcomes such as reduced mortality, increased efficiency, and lower cost arising
from reduced variations in patient heterogeneity, greater organizational learning due to
higher volumes, and better alignment of people and processes (Ding, 2014; Huckman and
97
Pisano, 2006; KC and Terwiesch, 2011; McDermott and Stock, 2011). A focused service
strategy is also the result of greater investment in upgraded operating rooms, medical
equipment, hiring and retaining of well-known specialists and physicians, investing in
specialized skills of nursing and hospital staff, and engaging with patients and providers
to understand how new therapies that could keep them healthy (McKinsey, 2008).
Hospitals may also hire additional staff and provide necessary training to improve patient
outcomes. Such actions taken by hospitals improve patients’ perceptions of technical
competency and responsiveness (Greenwald et al. 2006). All these factors are likely to
have a positive influence on patient choice. Thus we hypothesize:
H1: Revealed patient choice of hospital is positively associated with better structural
and infrastructural investments in technology, RN staffing, and hospital focus
4.3.2 Role of Perceptual Patient Satisfaction in Influencing Hospital Choice
Patient satisfaction in a hospital setting captures aspects such as communication and
responsiveness of caregivers. The services marketing literature argues that in the services
industry where quality is difficult to evaluate, a contact personnel’s knowledge to
perform a service, communication skills to keep customers informed in a language that
they can understand, and credibility to keep the customers’ best interests in mind have
emerged as top service quality determinants (Parasuraman et al. 1985, Bitner 1990,
Grönroos 1990). When firms invest in resources that improve the perceptual satisfaction
among customers, it generates positive word of mouth that influences other consumers’
future purchases (Anderson 1996). This in turn improves the firm’s market share and
profits (Rust and Zahorik 1993; Kamakura et al. 2002). While hotel-like amenities are
98
associated with patient choice of hospitals (Romley and Goldman 2010), the role of
perceptual patient satisfaction in influencing patient choice of hospitals has not been
studied previously.
A recent survey conducted by PricewaterhouseCoopers Health research found that
patients emphasize factors such as other patients’ experience with medications,
treatments and specific healthcare providers, and fast response time while making their
decision to choose a specific hospital (PwC Consulting, 2012). Patients may not be able
to judge technical quality of care, but they may be able to assess care through the
dimensions that they can see, feel, understand and value (Kenagy et al. 1999). Consumers
and patients are also known to have a high degree of interest in hospital quality;
especially in the form of patient satisfaction scores (Sofaer et al., 2015). Their study
found that potential patients considered items on the Hospital Consumer Assessment of
Healthcare Providers and Systems (HCAHPS) Survey to be so important that they would
consider changing hospitals in response to information about them (Sofaer et al., 2005).
We thus hypothesize that perceptual patient satisfaction is likely to have a positive impact
on patient choice.
H2: Revealed patient choice of hospital is positively associated with better
perceptual patient satisfaction
4.3.3 The Role of Third Party Reputation Signaling in Influencing Hospital Choice
The role of hospital rankings and report cards to convey important quality information,
and thereby influence patient choice, has been discussed previously in the health
economics literature (Dranove and Sfekas 2009; Pope 2009; Varkevisser et al. 2012).
99
However the results that have emerged from these studies are not consistent. For
example, Dranove and Sfekas (2009) found that people respond to report cards only when
such reports provide information that is contrary to prior beliefs. Pope (2009) found that
ordinal changes in hospital ranking near the top of the list are more influential in patient
choice than rank changes at the bottom of the list. The Centers of Medicare and Medicaid
Services (CMS) publishes data on hospital performance for certain conditions on its
Hospital Compare website. Such comparative performance data on hospitals is likely to
help consumers reduce the knowledge gap and increase control over their health care
experiences and outcomes. However, when an abundance of information is provided to
consumers, as is the case with the CMS website, it may not always translate to informed
choice partly because of the way the information is presented, the cognitive resources
required to process all the information, and whether the information is applicable to the
individual’s unique situation, preferences and needs (Marshall et al., 2000; Hibbard and
Peters 2003). For example, how should patients infer information between two hospitals
when one hospital has high scores on effectiveness but low scores on patient safety, and
the other hospital has high safety scores but average scores on effectiveness?
Recent research in behavioral economics shows that the simplicity with which
information is presented to the consumer is an important factor in predicting consumer
behavior (Bertrand et al. 2005). When people are faced with too much information, they
tend to take shortcuts and let a single factor dominate their thinking while leaving other
factors out of the decision-making process (Montgomery and Svenson 1989). The second
aspect in the decision making process are the cues that patients or consumers might
respond to. The marketing literature suggests that when product quality is not easily
100
observable, consumers face uncertainty. In such cases, they search within available
product related cues that are both marketing controlled (e.g. advertising, branding) or
non-marketing controlled (e.g. third party information) to make an informed choice
(Erdem and Swait, 2004; Baek et al., 2010). Third party information reduces information
symmetry when the true product quality is not observable. A survey suggests that a
majority of the people trust third party reviews when making a choice (Miller 2008).
Since giving incorrect information might hurt credibility, independent third party
information is also viewed as more objective and less biased than marketing cues that are
generated by the firms themselves (Darke et al., 1998; Hendricks and Singhal 1996).
Thus given the simplicity with which third parties provide credible information about a
hospital’s quality reputation, we hypothesize the following.
H3: Revealed patient choice of hospital is positively associated with hospitals’
reputation as signaled by third parties.
4.3.4 Moderating Role of Patient Comorbidity Complexity in Influencing Hospital
Choice
In addition to studying hospital choice for mostly heart patients, health economics has
also looked at how patient demographics affect choice. The research finds that women,
people with less education, and older patients are less willing to travel unless their health
condition is bad (Monstad et al., 2006; Varkevisser et al., 2010). However, missing from
this discussion is an important patient segment i.e. patients with complex comorbidities
such as obesity, diabetes, hypertension, etc. As the complexity of comorbidities increases,
such patients undergoing surgery have longer length of stay, greater incidence of
postoperative complications, and higher mortality risk (McAleese and Odling-Smee,
101
1994; Roques et al., 1999; Dindo et al., 2004). They may require more intensive care
management as compared to patients with fewer or no comorbidities. Presence of
comorbidity complexity may in turn affect their choice of hospital.
A priori, we expect patients with greater comorbidity complexity to prefer
hospitals with better SI investments based on the arguments that we present next. There is
a significant amount of literature on the role that technology can play in improving the
quality of health care (Halvorson et al., 2003; Health Affairs 2005). These technologies
enable healthcare providers to gain access to clinically relevant research, provide more
coordinated care, facilitate communication with patients, and provide them information
on various treatment options to create better patient engagement. Such features of
technology can be especially important for patients with comorbidities to ensure their
proper management through careful monitoring, timely information, cooperation and
good communications with teams of health professionals (Mechanic 2008). Thus
technology innovativeness is likely to play a bigger role in the choice of hospitals for
patients with greater comorbidity complexity. The medical literature has noted a positive
association between comorbidities and complications arising from a surgical procedure
(Luft et al., 1987; Roche et al., 2005; Deyo et al., 2010). Preventing or reducing the
incidence of perioperative complications relies heavily on the experience and expertise of
the hospital and surgeons performing the procedure, greater familiarity of hospital staff
with the correct protocols and procedures, and the skills, education and the amount of
time registered nurses spend with patients (Katz et al., 2004; Needleman et al., 2006).
Thus registered nurse staffing and hospital focus will also be more helpful when patient
comorbidity complexity is high. Taken together, these hospital SI investments are likely

102
to play an important role in determining hospital choice for patients with greater
comorbidities.
H4: The positive relationship between revealed patient choice and hospital SI
investments is amplified for patients with greater comorbidity complexity
The role of perceptual patient satisfaction in impacting hospital choice for people
with greater complexity of comorbidities is not clear a priori. It is possible that patients
with greater comorbidity complexity may attach greater value to provider communication
and responsiveness because their condition is more difficult to treat and has a greater
potential for post-surgery complication. However, if a choice has to be made between the
technical competency and patient satisfaction, it is more likely that such patients with
higher comorbidity complexity will put a lower premium on satisfaction simply because
higher satisfaction by itself does not guarantee that such patients will receive more
effective treatment. Limited research in this area also seems to suggest that patients put a
greater premium on the technical rather than interpersonal skills of the provider (Cheng et
al., 2003; Fung et al. 2005). Thus we hypothesize the following.
H5: The positive relationship between revealed patient choice and patient
satisfaction is weakened for patients with greater comorbidity complexity
Finally we consider the role of hospital reputation in impacting hospital choice for
people with greater comorbidities. We have previously hypothesized that patients may
find it easier to let one factor dominate their choice and trust the credibility of reputation
signaling generated by a third party source. However, the decision making process may
103
be a little more complicated for patients with greater comorbidity complexity because
there are greater risks associated with their surgery as previously discussed. They may
thus prefer hospitals with a better reputation for quality. A study argued that rural patients
with greater illness severity are likely to need treatment with advanced technology and
highly skilled personnel, and may thus prefer larger hospitals (because larger hospitals
may have more financial resources to invest in processes that improve quality), even
though such hospitals may be in more distant locations (Adams et al., 1991). Studies also
show that hospitals rated highly by third party sources have lower mortality risk and
better process adherence across a range of different measures (Chen et al., 1999; Osborne
et al., 2009). Thus third party generated hospital reputation is likely to play a stronger
role in hospital choice of patients with greater comorbidity complexity.
H6: The positive relationship between revealed patient choice and hospital
reputation (as signaled by third parties) is amplified for patients with
greater comorbidity complexity.
4.4 Data Description and Econometric Model
Our first and main source of data comes from California’s Office of Statewide Health
Planning and Development (OSHPD) for the year 2012. This dataset contains detailed
patient level discharge records, and includes information on patient demographics (e.g.
age, gender, race and insurance), procedures and discharge, diagnosis related group
(DRG) codes, dates of admission and discharge, patient and hospital zip codes, and
whether the surgery was elective or not i.e. scheduled in advance or emergent.
104
We focus our study on patients undergoing elective hip and knee surgery and who
are also Medicare patients for several reasons. First, hip and knee surgery is a high
impact area. The American Academy of Orthopedic Surgeons (AAOS) reports that the
percentage of total knee replacements increased by 120% from 2000 to 2009 while the
percentage of total hip replacements increased by 73% from 2000 to 2009, and that
Medicare pays for over 50% of these surgeries (http://newsroom.aaos.org/media-
resources/Press-releases/25-million-americans-living-with-an-artificial-hip-47-million-
with-an-artificial-knee.htm). In addition, Medicare patients have flexible coverage (i.e.
they are free to choose any hospital) and the price that hospitals get reimbursed for
Medicare procedures are fixed. This is in contrast to privately insured patients who may
have network-provider constraints and prices may vary significantly from one patient to
another. Also, in order to test the impact of hospital characteristics, perceptual patient
satisfaction, and reputation on patient demand, price has to be exogenous. If price
changes endogenously based on any of these three factors, then our estimates of hospital
characteristics, satisfaction, or reputation will be biased. Restricting our attention to just
Medicare patients avoids this problem. Other US based studies have also used a similar
logic in studying Medicare patients only (Tay 2003; Goldman and Romley 2010).
Finally, California is among the very few states with the highest number of both hip and
knee replacement patients as reported by AAOS, thus making it an ideal study setting.
We start with 48,869 Medicare patients undergoing elective hip-knee surgeries at 277
acute care hospitals. Based on past literature, we delete patient-hospital records where
hospitals performed less than 10 hip-knee replacement surgeries in a year (Pope 2009).
We also remove patients with missing unique patient identifier as missing values create

105
problems while building the choice set and running the analysis. Although the main focus
of our study is on elective hip and knee surgeries, we also create a similar dataset for
elective heart surgeries because it serves two purposes. First, it helps us evaluate whether
results of our study are consistent across different elective surgery types or whether
differences exist. Secondly, elective heart surgeries have been the major focus of
RPP/CM studies in the current literature, and analyzing them allows us to extend our
current knowledge of hospital attributes that drive choice of hospital by heart surgery
patients.
We measure a hospital’s innovativeness in the use of technology through the
Saidin Index. This Index has been used in prior literature, and is calculated as a weighted
sum of clinical, administrative and strategic technologies adopted by each hospital such
that the weights are inversely proportional to the number of hospitals adopting that
technology (Queenan et al. 2011; Sharma et al. 2016). Thus hospitals that are the
frontrunners in adopting new and more complex technologies receive a higher Saidin
Index score. We collect information on the various technologies available within a
hospital using the HIMSS 2011 database. The Saidin Index Si is then calculated as
follows:
!� = @ 0TX�,TZTWE where 0T = 1 − .1
;/ @ X�,TV�WE
where k = technologies available in a given year and indexed by k = 1, 2, …. K; ak =
weight for a given technology across all hospitals; N = number of hospitals in 2011; τi,k =
1 if hospital i has technology k in 2011, 0 otherwise. This dataset is joined with the

106
OSHPD database using the Centers for Medicare and Medicaid Services (CMS) unique
identifier.
We measure the staffing of registered nurses as the number of hours spent by
registered nurses per patient day per hospital (Cho et al., 2003). This measure is
computed from the 2011 California Annual Financial Database (AFD). A higher ratio
indicates that registered nurses spend more time with patients. This database is joined
with the OSHPD database using the CMS unique identifier. We measure hospital focus as
a ratio of the number of elective hip and knee surgeries performed by a hospital to the
total number of elective surgeries performed by that hospital. The operationalization of
this measure is similar to prior literature on focus (Diwas and Terweisch, 2011). We use
the OSHPD database again to compute this ratio. A higher ratio indicates that the hospital
has a greater focus on hip-knee surgeries and is a good proxy for substantial SI
investments made in this service line., We first convert each measure to z-score, and then
calculate the average value to get an overall measure of a hospital’s SI investments.
As discussed previously, factors such as provider communication, responsiveness,
and hospital environment pay an important role in perceptual patient satisfaction, and this
in turn may influence a patient’s hospital stay. We accordingly use the HCAPHS survey
items to create measures for communication and responsiveness based on prior literature
(Senot et al. 2015). We first consider only data that had survey responses from at least
100 patients. The response categories for the measures are “Never/Sometimes”,
“Usually” or “Always” and we use the percentage of patients who answered “Always” as
the measure for that survey item. We use COMP1-COMP4 measures to calculate the
average communication score; and COMP5-COMP6 measures to calculate the average
107
responsiveness measure. Our measure of hospital environment is based on patient
responses on measures of cleanliness (CLEAN) and quietness of rooms (QUIET) from
the HCAPHS survey, and we use a similar approach to get the average value for this
measure. To get the overall perceptual patient satisfaction, we first convert our scores of
communication, responsiveness and environment to z-scores and then calculate the
average.
Finally, we create a measure of reputation generated by third party as a binary 0/1
variable generated by US News and World Report (USNWR). Hospitals ranked as ‘best’
national or regional hospitals in their orthopedics specialty list (or in Cardiology and
Heart Surgery for our elective heart surgery analysis) are defined as 1, and 0 otherwise.
Our rationale for choosing this scheme is as follows. First, USNWR is the only rating
agency that creates a list of best hospitals by specialty, and which is used as a marketing
tool by hospitals to promote themselves as high quality providers on their websites. This
is important, since potential patients may not care about overall hospital reputation, but
they definitely consider hospital reputation in the specialty area for which they are getting
treatment. Second, USNWR has great name recognition and has provided ratings for the
past several decades. It has a wide circulation with over 20 million visitors and 120
million page views. The best hospitals list is available online and accessible to people for
free. Third, other rating agencies such as the Leapfrog Group, Joint Commission, and
Consumer Reports have also recently started generating hospital rankings. But their first
available ratings are after our study period, and hence were unusable. We join the
hospital reputation dataset with the OSHPD database using the OSHPD unique identifier.
108
We have argued that the complexity of patient comorbidities plays a moderating
role in the impact of various hospital related factors on the revealed preference of
patients. We calculate a patient’s comorbidity as an Elixhauser severity score based on
literature (Berry Jaeker and Tucker 2016). This score is calculated using two pieces of
information about a patient: (i) information on the Elixhauser Index which is a vector of
29 different variables where each variable is binary in nature and represents a specific
comorbidity; its value is 1 if the comorbidity is present and 0 otherwise and (ii)
information on the severity score on each comorbidity ranging from -7 to 12 with larger
weights representing more severe comorbidities (Elixhauser et al. 1998). Thus the
Elixhauser severity score is the dot product of the Elixhauser Index and the severity
score. Information on up to 20 comorbidities are provided in the OSHPD database. We
convert the comorbidity description as a 0/1 binary variable and use the severity score
published in literature to arrive at the severity score for each patient. The scores in our
sample range from -14 to 35. As with the other variables, we convert this to a z-score as
well.
In addition to comorbidity scores, we also compile information on hospital
characteristics such as teaching hospitals, profit status, size and location as they have
been used as controls in prior literature (Tay 2003; Varkevisser et al. 2012). We get this
data from CMS’ Inpatient Prospective Payment System Files (IPPS). Teaching hospital is
reflected in the teaching intensity as measured by the residents to bed ratio in the IPPS
database. Non-profit hospitals are assigned a value of 1, and 0 otherwise. Hospital size is
measured by the number of beds. Finally, location is assigned as 1 if the hospital is
located in an urban area and 0 otherwise. Finally, distance is an important factor in

109
choosing hospitals. The OSHPD data provides information on patient and hospital zip
codes. Accordingly, we calculate the distance between the patient’s home and hospital in
miles as a straight line distance between the centroids of the patient and hospital’s zip
codes (Goldman and Romley 2010; Chandra et al., 2015; Wang et al., 2015). We also
include the square of the distance in our specification under the assumption that the
willingness to travel further is concave in nature (Tay 2003; Chandra et al., 2015). We
have missing data in various datasets - missing zip code data in the OSHPD database,
missing CMS identifiers in the HIMSS, AFD, and IPPS databases or missing data on
technology, registered nurse hours or patient satisfaction. After accounting for missing
hospital level data and joining various datasets, we have 37,049 Medicare patients who
underwent elective hip-knee surgeries at 246 hospitals (and 21,172 patients who
underwent elective heart surgeries at 167 hospitals) in California in 2012.
4.5 Empirical Specification of the Demand Model
To estimate patient choice of hospital, we use a patient-level utility function in which
travel distance, hospital characteristics, and reputation reflecting quality differences are
the main determinants of patient hospital choice. When patients select hospitals, they are
assumed to weigh the cost of increased distance (in monetary costs and the opportunity
cost of family members’ time) against the benefits (better quality of hospital). The utility
of patient i who chooses hospital j is given by:
[�R = 3�R + �3�RC + @ �\]R\
+ @ Q\+�� · ]R\
+ @ _̂`R_
+ ��R (1)
110
Uij is the utility that a patient derives by choosing a hospital, dij is the distance
from the patient’s home to a hospital, Hj is a vector of hospital j’s quality attributes of SI
investments, perceptual patient satisfaction, and third party reputation signal. PCi is
patient comorbidity measured by the Elixhauser Index. This term is interacted with the
hospital quality attributes of interest in this study. Other patient demographics such as
age, race, gender, etc. do not enter into the equation as they are invariant across each
patient’s choice set. Rj represents hospital control variables such as teaching intensity,
size, location, and profit status. εij represents the idiosyncratic part of patient i’s
evaluation of hospital j. We assume that εij is a distributed Type I extreme value, which
means that the problem can be readily estimated as a conditional logit model (McFadden
1974). This is commonly used in the healthcare choice literature (Dranove and
Satterthwaite, 2000; Varkevisser et al. 2010; Tay 2003). Note that prices are not included
in this function because we study patient choice for Medicare patients only for whom
prices are fixed. We assert that patient i, given his or her needs and preferences, will visit
hospital j when visiting any alternative hospital in the choice set will result in a lower
utility.
For the actual empirical specification of equation (1), we define a dependent
variable Chosenij as a binary 0/1 variable. For each patient, we create a choice set based
on hospitals that are within a 50 mile radius of the patient’s zip code. Chosenij is assigned
a value of 1 if patient i chooses hospital j in the choice set, and 0 otherwise. We have 2.48
million patient-hospital pairs in this choice set. For this approach, we assume that for
each patient, the relative probabilities of choosing any two hospitals are independent of
any other available alternatives. This restriction, called the independence of irrelevant

111
alternatives (IIA) assumption, assumes that all systematic variation in patients’ taste is
captured sufficiently by the variables specified in the logit model. The remaining
unobserved portion of utility εij is just white noise, and is assumed to be independent
across observations. There is a large variation in the locations of both patients and
hospitals in our dataset, ensuring heterogeneity in our model. Thus restrictive substitution
patterns imposed by the conditional logit model will apply only to patients of similar
demographics (i.e. age, race, gender) and who live in the same zip code. Hence IIA is less
of a concern here, whereby when a patient makes a comparison between Hospitals 1 and
2, his or her decision-making process is not affected by the attributes of Hospital 3.
Similarly, choice between Hospitals 1 and 3 is not affected by the attributes of Hospital 2,
and so on. This logit model also has the advantage of being tractable. Also, we have two
ways of using different geographic definitions to construct the patient choice set, which
then serve as an additional check for violation of IIA. As a final check of IIA, we run the
Hausman-McFadden (1984) test. This is a chi-square test that rejects the restrictions
imposed by the conditional logit model if deletion of one hospital from the choice set
causes significant changes in the coefficient and covariance estimates. Results of this test
indicate that IIA is not a concern here.
Patient i’s probability of visiting hospital j is represented by:
+)�ℎ�9�-�R = 1* = exp (3�R + �3�RC + ∑ �R]RR + ∑ QR+��R · ]RR + ∑ R̂`RR ) ∑ exp (3�R + �3�RC + ∑ �R]RR + ∑ QR+��R · ]RR + ∑ R̂`RR )VeRWE
In order to assess whether hospital characteristics, perceptual patient satisfaction,
or third party reputation signaling play a role in determining hospital choice, and whether
patient comorbidities play a moderating role in influencing the relationship for elective

112
hip-knee surgeries (or elective heart surgeries), we proceed as follows. We first convert
our distance measure to a z-score similar to other hospital attributes of interest. We also
convert teaching intensity and bed size to z-scores. The advantage of using z-scores for
analysis is that it reduces the magnitude of bias of the estimates (Harrison 2008). While it
is difficult to get measures for every conceivable hospital characteristic or quality
measure, endogeneity of hospital attributes that attract patients to certain hospitals is a
potential issue in such estimations. Since we are only partially measuring hospital quality
via its characteristics, patient satisfaction, or reputation, the unobserved quality is
included in the error term. If this unobserved quality is correlated with other quality
measures that we have included in our model, the estimates of outcomes are likely to be
biased. By considering Medicare patients only, we have avoided using any price related
measures (e.g. insurance type) to be included in our model and also likely reduced the
magnitude of the bias. Secondly, as hypothesized in H1-H3, better hospital attributes are
likely to increase the probability of patient choice of the hospital.
With our endogeneity issue, the coefficients on hospital characteristics and
perceptual patient satisfaction may be upward biased. However, by making a holistic
examination of several quality attributes at once, this is less likely to be the case. Second,
by excluding unobserved quality, we are under measuring the overall quality anyway and
the upward biased estimates will offset this. Thus we do not expect our estimates to be
overly biased. Additionally, there can be systematic differences among patient
preferences for hospitals. In the conditional logit model, differences among hospital SI
investments, patient satisfaction and reputation are used to identify the model. Since
113
patient specific variables are constant across hospital choices for a given patient, these are
differenced out and do not affect our estimation process.
Our main patient specific variable of interest is patient comorbidity complexity,
which we capture as an interaction term with our hospital attributes of interest. Our use of
patient level data also ensures that endogeneity in the unmeasured quality is uncorrelated
with specific patient-hospital error term because only aggregate components in the error
terms lead to endogeneity issues. Thus bias (or endogeneity) in this error term is less
likely to be a concern when we use finer grained measures of patient level data in this
case as opposed to measuring choice via total number of patients choosing a given
hospital. Finally, perceptions of quality based on technology, staffing of registered
nurses, focus, satisfaction or reputation take time to adjust. So the endogeneity of
unmeasured quality is not a concern, as we consider a static model which draws data
from one year only. All these arguments help alleviate endogeneity related concerns in
our model estimation process.
4.6 Results
Descriptive statistics for elective hip-knee surgeries are reported in Table 4.2. As seen
here, the mean distance to the chosen hospital is about 9 miles. Hospital characteristics,
as measured by technology innovativeness, registered nurse staffing, and focused
operations in hip-knee surgery, vary widely among chosen hospitals. About 11% of the
hospitals are teaching hospitals, and a majority of hospitals are non-profit hospitals. Bed
size also varies considerably, with the mean value indicating preference for larger
hospitals.
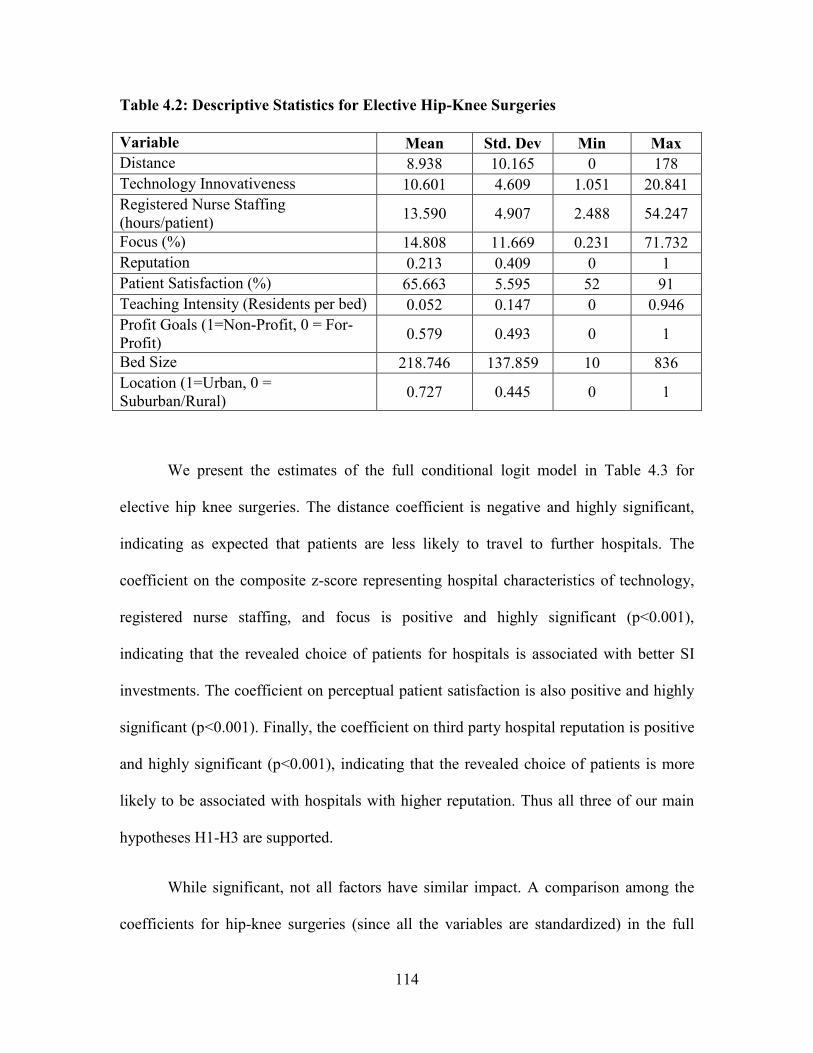
114
Table 4.2: Descriptive Statistics for Elective Hip-Knee Surgeries
Variable Mean Std. Dev Min Max
Distance 8.938 10.165 0 178
Technology Innovativeness 10.601 4.609 1.051 20.841
Registered Nurse Staffing (hours/patient)
13.590 4.907 2.488 54.247
Focus (%) 14.808 11.669 0.231 71.732
Reputation 0.213 0.409 0 1
Patient Satisfaction (%) 65.663 5.595 52 91
Teaching Intensity (Residents per bed) 0.052 0.147 0 0.946
Profit Goals (1=Non-Profit, 0 = For-Profit)
0.579 0.493 0 1
Bed Size 218.746 137.859 10 836
Location (1=Urban, 0 = Suburban/Rural)
0.727 0.445 0 1
We present the estimates of the full conditional logit model in Table 4.3 for
elective hip knee surgeries. The distance coefficient is negative and highly significant,
indicating as expected that patients are less likely to travel to further hospitals. The
coefficient on the composite z-score representing hospital characteristics of technology,
registered nurse staffing, and focus is positive and highly significant (p<0.001),
indicating that the revealed choice of patients for hospitals is associated with better SI
investments. The coefficient on perceptual patient satisfaction is also positive and highly
significant (p<0.001). Finally, the coefficient on third party hospital reputation is positive
and highly significant (p<0.001), indicating that the revealed choice of patients is more
likely to be associated with hospitals with higher reputation. Thus all three of our main
hypotheses H1-H3 are supported.
While significant, not all factors have similar impact. A comparison among the
coefficients for hip-knee surgeries (since all the variables are standardized) in the full

115
conditional logit model indicates that, after controlling for distance and other hospital
characteristics, the revealed choice of patients is highly influenced by third party hospital
reputation, followed by hospital SI investments, and finally by patient satisfaction. This is
an important finding and we are able to uncover it due to our holistic examination of
various different hospital characteristics.
The interaction term between hospital characteristics and patient comorbidity
complexity for hip-knee surgeries is positive and highly significant (p<0.001), indicating
that as complexity increases, patients emphasize hospital SI investments. Likewise, the
interaction term between hospital reputation and patient comorbidity complexity is also
positive and highly significant (p<0.001) indicating that hospital reputation is important
for patients with greater comorbidity complexity. Finally, the interaction between
perceptual patient satisfaction and patient comorbidity complexity is negative and
significant (p-value < 0.05) indicating that higher complexity patients are less likely to
choose hospitals based on patient satisfaction once other factors are taken into account.
These results support hypotheses H4 - H6.
In economics, the marginal rate of substitution (MRS) is defined as the rate at
which a consumer is ready to give up one good in exchange for another good while
maintaining the same level of utility. To understand the tradeoffs that patients are willing
to make among various hospital attributes and travelling further, we compute the MRS
derived from the full conditional logit model as follows:
76! = fgehfihfgehfjeh
116
Our results indicate that patients, on an average, will be willing to travel an additional 7.5
miles for a 10% increase in SI investments and willing to travel an additional 1.5 miles
for a 10% improvement in the patient satisfaction scores. We cannot similarly compute
the impact of a 10% increase in reputation on willingness to travel as our reputation
measure is not a continuous measure but a binary 0/1 measure. However, analysis of the
data indicates that for similar characteristics, patients are willing to travel an additional
2.2 miles on an average to get to a more reputed hospital. We calculate the MRS for
interaction terms for the 25% and 75% comorbidity complexity scores to represent low
and high comorbidity complexity patients. Our results indicate that low comorbidity
patients will be willing to travel an additional 5.4 miles, while high comorbidity
complexity patients will be willing to travel an additional 8.1 miles for a 10% increase in
a hospital’s SI investments. Patients with low comorbidity complexity will be willing to
travel an additional 1.7 miles, while patients with high comorbidity complexity will be
willing to travel an additional 1.3 miles for a 10% increase in patient satisfaction, thereby
indicating that the latter are less likely to travel further to hospitals with better scores.
Similarly, we cannot compute how much a 10% change in reputation would impact the
willingness to travel for low and high comorbidity patients as we do not have a
continuous reputation score. However, our data indicates that low comorbidity patients
would be willing to travel an additional 1.45 miles, while high comorbidity patients
would be willing to travel an additional 3.04 miles, on an average, to get treated at a
hospital with better reputation.
Among the control variables, the coefficient on teaching hospitals is negative
while the coefficient on hospital size is positive, indicating that once other hospital

117
characteristics have been controlled for, patients are less likely to choose teaching
hospitals and more likely to choose larger hospitals. This is in line with previous findings
(Tay 2003). Patients are more likely to choose hospitals located in urban areas than those
located in suburban and rural areas. Finally, the individual components that make up our
hospital SI investments i.e. technology innovativeness, RN staffing, and focus are also all
positive and highly significant.
Since several prior studies have looked at preferences for heart surgeries, we
perform similar analysis for elective heart surgery patients to further understand whether
patients’ preferences between the two types of elective surgeries are similar. These
results are summarized in Table 4.3. We find that hospital SI investments and reputation
are also important to heart surgery patients (p<0.001 for both attributes), but patient
satisfaction is not important (p>0.1). Between the two significant attributes, however,
hospital SI investments are more important to elective heart surgery patients as compared
to reputation.
We provide a potential explanation for the differences in results between hip-knee
and heart surgeries. First, these two types of surgeries are inherently different. While hip-
knee replacements are primarily done to improve the quality of life (www.aaos.org),
heart surgeries (such as coronary artery bypass grafting (CABG) or similar surgeries) are
done to lower the risks of more serious problems such as a heart attack or death
(http://www.nhlbi.nih.gov/). Second, treating patients for elective heart surgeries is more
resource intensive as compared to elective hip-knee surgeries. The average diagnosis
related group (DRG) weight (routinely used by Centers for Medicare and Medicaid
Services to determine resource intensity of a surgery/ procedure) for elective heart
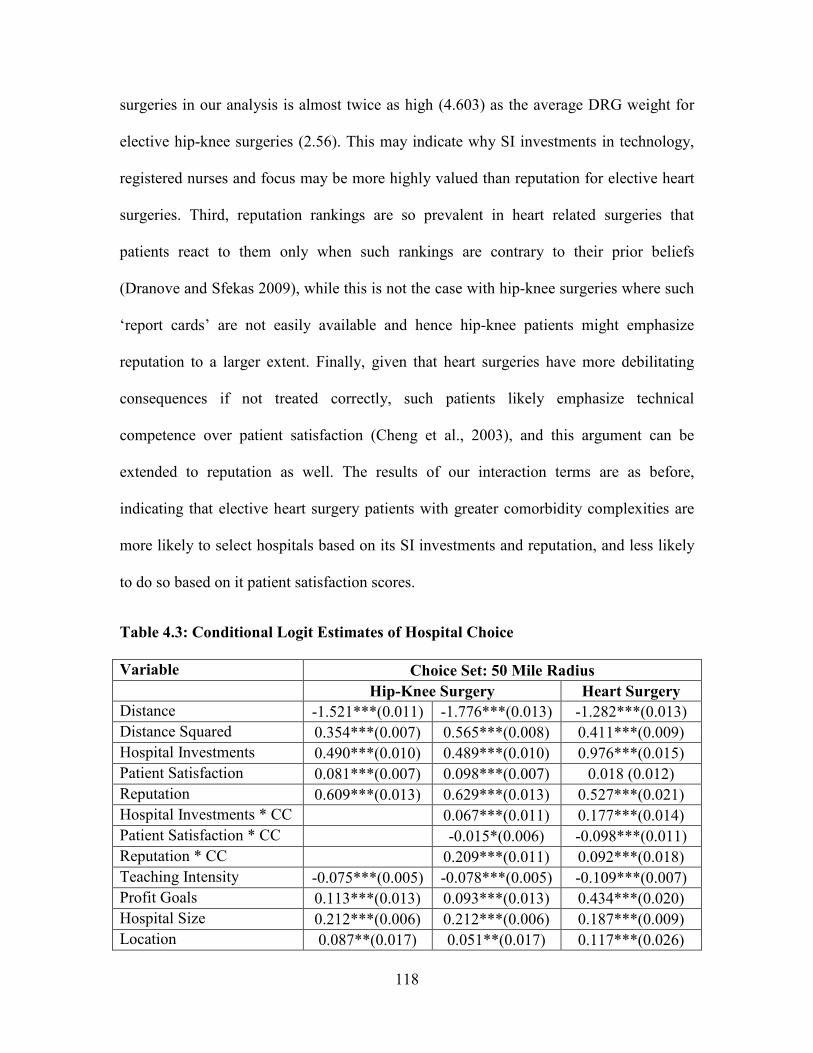
118
surgeries in our analysis is almost twice as high (4.603) as the average DRG weight for
elective hip-knee surgeries (2.56). This may indicate why SI investments in technology,
registered nurses and focus may be more highly valued than reputation for elective heart
surgeries. Third, reputation rankings are so prevalent in heart related surgeries that
patients react to them only when such rankings are contrary to their prior beliefs
(Dranove and Sfekas 2009), while this is not the case with hip-knee surgeries where such
‘report cards’ are not easily available and hence hip-knee patients might emphasize
reputation to a larger extent. Finally, given that heart surgeries have more debilitating
consequences if not treated correctly, such patients likely emphasize technical
competence over patient satisfaction (Cheng et al., 2003), and this argument can be
extended to reputation as well. The results of our interaction terms are as before,
indicating that elective heart surgery patients with greater comorbidity complexities are
more likely to select hospitals based on its SI investments and reputation, and less likely
to do so based on it patient satisfaction scores.
Table 4.3: Conditional Logit Estimates of Hospital Choice
Variable Choice Set: 50 Mile Radius
Hip-Knee Surgery Heart Surgery
Distance -1.521***(0.011) -1.776***(0.013) -1.282***(0.013)
Distance Squared 0.354***(0.007) 0.565***(0.008) 0.411***(0.009)
Hospital Investments 0.490***(0.010) 0.489***(0.010) 0.976***(0.015)
Patient Satisfaction 0.081***(0.007) 0.098***(0.007) 0.018 (0.012)
Reputation 0.609***(0.013) 0.629***(0.013) 0.527***(0.021)
Hospital Investments * CC 0.067***(0.011) 0.177***(0.014)
Patient Satisfaction * CC -0.015*(0.006) -0.098***(0.011)
Reputation * CC 0.209***(0.011) 0.092***(0.018)
Teaching Intensity -0.075***(0.005) -0.078***(0.005) -0.109***(0.007)
Profit Goals 0.113***(0.013) 0.093***(0.013) 0.434***(0.020)
Hospital Size 0.212***(0.006) 0.212***(0.006) 0.187***(0.009)
Location 0.087**(0.017) 0.051**(0.017) 0.117***(0.026)

119
Pseudo R-Squared 0.37 0.385 0.295
Note: CC = Comorbidity Complexity. DRGs for hip and knee surgery: 462, 466-470, 480-482, 486-489. DRGs for heart surgery: 216, 219-221, 227-229, 234-238, 243, 244, 246, 247, 249, 251-254, 264 Robust standard errors are reported in parentheses and are clustered at the patient level. *, **, *** Represent significance at the 5%, 1% and 0.1% levels respectively.
4.7 Robustness Test
To ascertain the robustness of our results, we consider a second choice set that is more
restrictive, and based on just 10 hospitals closest to the patient’s zip code. Building this
choice set gives us a total of 0.37 million hospital-patient pairs for hip-knee elective
surgery. Results with the alternate specification are consistent with the main analysis -
patients are more likely to choose hospitals with better reputation, SI investments, and
patient satisfaction in decreasing order of importance. Patients with increasing
comorbidity complexity are more likely to select hospitals with better SI investments and
reputation, and less likely to select hospitals based on perceptual satisfaction scores.
Results on elective heart surgery (0.21 million hospital-patient pairs) and other control
variables are also as before. These results are summarized in Table 4.4.
Table 4.4: Robustness Check
Variable Choice Set: Nearest 10 Hospitals
Hip-Knee Surgery Heart Surgery
Distance -8.798***(0.051) -8.789***(0.051) -12.983***(0.206)
Distance Squared 3.914***(0.041) 3.892***(0.041) 9.149***(0.574)
Hospital Investments 0.560***(0.013) 0.549***(0.013) 0.824***(0.015)
Patient Satisfaction 0.042***(0.008) 0.044***(0.008) 0.017 (0.011)
Reputation 0.703***(0.012) 0.710***(0.012) 0.488***(0.020)
Hospital Investments * CC 0.125***(0.012) 0.148***(0.014)
Patient Satisfaction * CC -0.074***(0.007) -0.081***(0.011)
Reputation * CC 0.181***(0.012) 0.095***(0.019)

120
Teaching Intensity -0.098***(0.006) -0.097***(0.006) -0.101***(0.007)
Profit Goals 0.178***(0.013) 0.026*(0.014) 0.292***(0.019)
Hospital Size 0.129***(0.007) 0.132***(0.007) 0.164***(0.009)
Location 0.245***(0.018) 0.241***(0.018) 0.171***(0.026)
Pseudo R-Squared 0.304 0.314 0.176
Note: CC = Comorbidity Complexity DRGs for hip and knee surgery: 462, 466-470, 480-482, 486-489. DRGs for heart surgery: 216, 219-221, 227-229, 234-238, 243, 244, 246, 247, 249, 251-254, 264 Robust standard errors are reported in parentheses and are clustered at the patient level. *, **, *** Represent significance at the 5%, 1% and 0.1% levels respectively.
4.8 Study Contributions and Conclusion
This is the first study of its kind that shows that the revealed preference of patients for
choosing a hospital is not homogenous, and that the complexity of patient comorbidities
plays an important role in determining factors are important to such patients. To
summarize our findings, hospital SI investments, patient satisfaction, and reputation are
important determinants of hospital choice but differ in their degree of importance.
Patients with greater comorbidity complexity emphasize hospital SI investments, as well
as its reputation as signaled by third parties. They are less likely to select hospitals based
on its perceptual satisfaction. Extending our analysis to elective heart surgery patients
further emphasizes the role of SI investments and reputation, but finds that the impact of
patient satisfaction on choice is insignificant. We find that such heart surgery patients
emphasize SI investments over reputation. These insights can help hospitals with better
SI investments and reputation to target such patients.
4.8.1 Theoretical and Practical Contributions
The impact that quality factors have on influencing patient demand has been an
understudied area. Past studies that have looked at consumer or patient behavior have
121
mostly focused on behavioral intentions using surveys (Victoor et al. 2012). It has been
suggested that models that utilize behavioral intentions only may exhibit low predictive
validity when compared to models using actual choice behavior (Cote and Umesh,
1988). Ours is one of the few studies that investigates the revealed choice of patients to
overcome this issue of predictive validity. Other studies that have investigated the
revealed preferences of patients have mostly been on the influence of quality outcome
measures and rankings as drivers of choice (Tay 2003; Pope 2009; Varkevisser et al.
2012; Wang et al., 2015). Outcome measures and rankings are not prevalent in most
kinds of elective surgeries. Further, a significant majority of the studies have mostly
considered choice issues related to elective and emergent heart surgeries where
information availability on hospitals, surgeons and outcomes through report cards and
public reporting are widely and easily accessible. In contrast, our study considers a
scenario where information availability on quality outcomes such as complications
arising from surgery, readmissions, mortality, etc. for elective surgeries is scarce. Under
this information vacuum situation, our study highlights the importance of SI
investments, perceptual patient satisfaction and third party hospital reputation, in
enhancing patient demand. It thus provides inputs to managers on how their financial
resources can be best utilized.
Extending our analysis of RPP/CM to elective heart surgery patients supports our
results that SI investments and reputation play an important role in hospital choice. Our
analysis also uncovers additional insights - complexity of the disease and its treatment
may drive the degree to which each hospital attribute is considered important from a
choice perspective for a given type of elective surgery. Such insights have been missing
122
in prior work on RPP/CM as studies have mostly considered a single type of surgery.
Even when multiple types of surgery are considered, the role of disease complexity has
not been explored.
Investments in technology or registered nurses are not cheap. Technology in
particular leads hospital expenditures as reported by a recent survey
(https://www.premierinc.com/shift-to-population-health-requiring-larger-provider-
investments-premier-inc-survey-finds/). However, besides its role in improving the
quality of patient care, it can also result in increased revenues for hospitals via increased
patient choice. Similarly, hospitals have been cutting back on registered nurses in an
attempt to reduce costs (Thungjaroenkul et al., 2007). But increased registered nurse
staffing, besides giving better quality outcomes, is also viewed favorably as revealed by
patient choice of hospitals. So the managers may have to take a second look at such
layoff practices. Finally, big companies such as Walmart, Lowe’s, Blue Cross Blue
Shield, etc. are increasingly tying up with certain hospitals to ensure that their employees
and insured patients get high quality care (http://corporate.walmart.com/_news_/news-
archive/2013/10/08/walmart-lowes-pacific-business-group-on-health-announce-a-first-of-
its-kind-national-employers-centers-of-excellence-network; http://www.bcbs.com/why-
bcbs/blue-distinction/?referrer=https://www.google.com/). These hospitals, recognized as
‘centers of excellence,’ emphasize the role that hospital focus can play in attracting more
patients.
The positive impact of patient satisfaction on revealed choice is also important to
note. The effort by CMS to provide this information via its Hospital Compare website is a
step in the right direction. A particular advantage of this measure is that it does not

123
require case-mix risk adjustment, and thus hospitals will not be tempted to engage in risk
selection to improve the patient satisfaction rating. This is particularly relevant as a
significant portion of the government incentives under its Value Based Purchasing Plan
are tied to patient satisfaction scores.
Third party reputation provides a valuable service to patients by helping such
patients identify top hospitals for care. Our study shows that a simple reputation signaling
system by third parties which recognizes best hospitals is just as effective (if not more)
than reporting multiple reputation scores or tracking year-on-year changes in the ordinal
rankings of hospitals. Other agencies have also stepped up efforts to bring more
information to patients. For example, CMS has been taking steps in this direction by
initiating the Comprehensive Care for Joint Replacement (CJR) Model that holds
hospitals accountable for the quality of care they deliver to Medicare patients undergoing
hip and knee surgery (http://www.hhs.gov/about/news/2015/11/16/cms-finalizes-
bundled-payment-initiative-hip-and-knee-replacements.html). However, the payment
model, which begins in April 2016, is currently limited to hospitals in 67 geographic
areas only. As such reporting matures; it will be interesting to see whether there is a shift
in the revealed patient preference towards such reporting programs.
Finally, our study also has policy implications. The merits of regionalization of
care, which refers to the creation of a regional health authority or board that assumes
responsibility for organizing and delivering health care services to a defined patient
population (Baker et al., 1998), have been debated (Rathore et al., 2005; Carr and Asplin
2010; Luke et al., 2011). The results of this study may point towards factors that should
be considered in the decision making process if regionalization of care is determined as
124
the best way forward. Such a formation is likely to improve the quality of care, as well as
help contain rising health care costs (Bunker et al., 1982; Gordon et al., 1995).
4.8.2 Limitations and Future Research
While interpreting our findings, it is possible that patient referrals to hospitals may have
been driven by physician preferences. Unfortunately, our dataset does not have any
identifiers related to the referring physician, and thus we cannot check for this situation.
In addition, although we have captured the main SI investments, future studies should
take a look at the impact of other characteristics such as magnet certification of hospitals
on revealed patient preferences.
We have used the USNWR list to determine reputation, as it is the only one that
we have found so far that publishes ratings by specialties. Other third party rating
agencies such as the Leapfrog Group, Joint Commission, Consumer Reports,
HealthGrades etc. have also started rating hospital level quality on a variety of outcome
measures but more ratings may not necessarily be better. Given that such agencies focus
on different measures and have different rating methodologies, they may end up
confusing patients rather than informing them. This was highlighted in a recent study by
Austin et al. (2015) which compared the ratings of 844 hospitals by four national rating
systems, and found that no hospital was rated as a high performer by the top four national
rating systems, and only 10% of the hospitals rated as a high performer by one rating
system were rated as a high performer by any of the other rating systems. Thus it remains
to be seen how much impact these ratings will have on the revealed choice of patients,
and which is a fruitful area for future research.

125
CHAPTER 5
CONLCUSION
This dissertation is motivated by various changes in the healthcare landscape over the last
several years. Policy initiatives such as the Meaningful of Technology under the
HITECH Act provide incentives to hospitals to use health information technology in a
meaningful way to improve patient outcomes. The Affordable Care Act has provided
insurance coverage to millions of previously uninsured people, but has also increased
competition among hospitals to attract these patients through various investments.
Hospitals are now also held accountable for providing high quality care via the Value
Based Purchasing initiative. In this dissertation, we have attempted to integrate the
economics and the operations management perspectives by investigating the role of
various structural and infrastructural factors in impacting hospital and patient level
quality outcomes, and in impacting patient choice of hospitals.
Electronic Health Records (EHRs) have the potential to transform healthcare
delivery through the use of built-in evidence based medical guidelines, and efficient
coordination of patient treatment and care. Meaningful use of EHRs can play an
especially important role in easing a health care provider’s cognitive load while working
on complex tasks. In the first study, we examine the impact of meaningful use of EHRs
after the mandated HITECH (Health Information Technology for Economic and Clinical

126
Health) Act on patients’ length of stay (LOS) in the context of treating patients with
varying dimensions of complexities: (i) complexity arising from the treatment of a
patient’s disease, (ii) complexity arising from a patient’s comorbidities and (iii)
complexity arising from coordination required from various healthcare providers to treat
the patient’s disease. We conduct our analysis by using a large-scale dataset with detailed
patient level data from acute care hospitals in California, which is also coupled with
relevant data from several other sources. After accounting for self-selection bias, our
analysis reveals that meaningful use of EHRs reduces the overall LOS by about 9%; and
that the magnitude of this effect is greater for patients with higher disease and
comorbidity complexity and for patients with higher coordination needs. Further, these
changes in LOS do not come at the expense of increased readmissions. In fact, we find an
overall decrease in readmissions and a greater reduction in readmissions for patients with
a higher disease and coordination complexity profile. These are important findings.
While hospitals cannot control the sickness and comorbidities that their patients come in
with for treatment, they can certainly ensure that these patients spend less time in the
hospital. Reduced length of stay may reduce hospital acquired infections, and therefore
readmissions. Providing the right treatment at the right time also ensures that patients are
less likely to be readmitted to hospitals.
Our second study examines the impact of competition on process of care (PoC),
and the role process improvement factors play on affecting PoC within the altered
competitive landscape that has been created in the healthcare industry by the introduction
of the Affordable Care Act (ACA) of 2010. ACA acts as a catalyst in increasing
competition among all hospitals to attract more patients and improve PoC. A longitudinal
127
analysis of California patient data combined from several different sources shows the
contingent value of process improvement factors such as operational slack, nursing skill
mix and focused strategy. Their impact on PoC is positive in both more as well as less
competitive markets; however the marginal benefit is stronger in less competitive
markets. These results are robust to alternate specifications of competition. Nevertheless,
the fact that process improvement factors can impact processes of care in more
competitive markets despite other investments in technology and equipment having
already being made that led to a higher quality to begin with, is an important finding. We
find similar results when considering the catalytic role played by ACA in enhancing
competition. Declining reimbursements and financial constraints may force hospital
executives to invest less in process improvement factors, erroneously thinking that
quality can be improved by emphasizing efficiency in these areas. Our results show that
these factors will continue to remain important under an increasingly competitive
environment, as they have an impact on a hospital’s responsiveness and ability to provide
a high standard of care to its patients.
Studies in the healthcare operations management literature have typically focused
on the supply side of the equation. Much less attention has however been paid to how
hospital structural and infrastructural (SI) investments (as a cluster of technology,
registered nurse staffing and focus), reputational factors, and perceptual patient
satisfaction influence choice of a hospital when patients have to undergo elective
surgeries. Our third study addresses this gap by focusing on the demand side of the
equation. Once again, using detailed patient level data from California hospitals on
elective hip and knee surgeries, we find that SI investments, third-party reputation
128
signals, and patient satisfaction influence patient choice, but to varying degrees. Our
results reveal that hip and knee patients are willing to travel an additional 7.5 miles for a
10% increase in SI investments, an additional 2.2 miles for a more reputed hospital, and
an additional 1.5 miles for a 10% improvement in patient satisfaction scores. As the
complexity of comorbidities in patients increases, they are more likely to choose a
hospital based on its SI investments and reputation, and less likely to choose a hospital
based on higher patient satisfaction scores. Higher comorbidity patients are also willing
to travel further for better hospital attributes. Such findings are of managerial importance.
Our expanded analysis on elective heart surgery patients mostly support our results on
hip-knee surgery patients, but also indicates that the complexity of disease and its
treatment may play a role in the way various hospital attributes are emphasized. While
hip-knee replacements are primarily done to improve the quality of life, surgeries (such
as coronary artery bypass grafting (CABG) or similar surgeries) are done to lower the
risks of more serious problems such as a heart attack or death which we surmise are
reasons for differences in different types of surgeries. Our study provides inputs to
managers on how their financial resources can be utilized to enhance patient demand,
especially in the light of increasing comorbidities in the US patient population.
To conclude, this dissertation provides additional building blocks towards
understanding how internal factors such as technology, operational slack, skilled
registered nurses, focused strategy, patient satisfaction, and external factors such as
competition and third party reputation signals play in enhancing both quality outcomes
and patient choice. It has important implications for the government, hospitals and
patients in light of the changes that are underway in healthcare.
129
REFERENCES
Adams, E.K., Houchens, R., Wright, G.E. and Robbins, J., 1991. Predicting hospital choice for rural Medicare beneficiaries: the role of severity of illness. Health Services
Research. 26(5): 583.
Agha, L., 2014. The Effects of Health Information Technology on the Costs and Quality of Medical Care. Journal of Health Economics. 34(3): 19–30
Anand, G. and Ward, P.T., 2004. Fit, flexibility and performance in manufacturing: coping with dynamic environments. Production and Operations Management. 13(4): 369-385.
Anderson, E.W., 1996. Customer satisfaction and price tolerance. Marketing letters. 7(3): 265-274.
Andritsos, D.A. and Tang, C.S., 2014. Linking process quality and resource usage: An empirical analysis. Production and Operations Management. 23(12): 2163-2177.
Angst, C.M., Devaraj, S. and D'Arcy, J., 2012. Dual Role of IT-Assisted Communication in Patient Care: A Validated Structure-Process-Outcome Framework. Journal of
Management Information Systems. 29(2): 257–92.
Appari, A., Carian, E.K., Johnson, M.E. and Anthony, D.L., 2012. Medication administration quality and health information technology: a national study of US hospitals. Journal of the American Medical Informatics Association 19(3): 360-367.
Appari, A., Eric Johnson, M. and Anthony, D.L., 2013. Meaningful Use of Electronic Health Record Systems and Process Quality of Care: Evidence from a Panel Data Analysis of US Acute Care Hospitals. Health services research. 48(2): 354-375.
Argote, L., Insko, C.A., Yovetich, N. and Romero, A.A., 1995. Group Learning Curves: The Effects of Turnover and Task Complexity on Group Performance. Journal of
Applied Social Psychology. 25(6): 512–29.
Ashton, C.M., Kuykendall, D.H., Johnson, M.L., Wray, N.P. and Wu, L., 1995. The association between the quality of inpatient care and early readmission. Annals of
internal medicine, 122(6): 415-421.
Austin, J.M., Jha, A.K., Romano, P.S., Singer, S.J., Vogus, T.J., Wachter, R.M. and Pronovost, P.J., 2015. National hospital ratings systems share few common scores and may generate confusion instead of clarity. Health Affairs. 34(3): 423-430.

130
Autor, D.H., Levy, H., Murnane, R. J., 2003 The Skill Content of Recent Technological Change: An Empirical Exploration. The Quarterly Journal of Economics 118(4): 1279-1333.
Baek, T.H., Kim, J. and Yu, J.H., 2010. The differential roles of brand credibility and brand prestige in consumer brand choice. Psychology & Marketing. 27(7): 662-678.
Baker, L.C. and Phibbs, C.S., 2000. Managed care, technology adoption, and health care: the adoption of neonatal intensive care. No. w7883. National Bureau of Economic
Research.
Barkell, N.P., Killinger, K.A., & Schultz, S.D., 2002. The relationship between nurse staffing models and patient outcomes: A descriptive study. Outcomes Management. 6(1): 27-33.
Bassett, C., 2002. Nurses' perceptions of care and caring. International journal of nursing
practice. 8(1): 8-15.
Bates, D.W., Cohen, M., Leape, L.L., Overhage, J.M., Shabot, M.M. and Sheridan, T., 2001. Reducing the frequency of errors in medicine using information technology. Journal of the American Medical Informatics Association. 8(4): 299-308.
Baum, C.F., Cox, N.J. and Wiggins, V., 2001. Tests for heteroskedasticity in regression error distribution. Stata Technical Bulletin. 10(55).
Bazzoli, G.J., Chen, H.F., Zhao, M. and Lindrooth, R.C., 2008. Hospital financial condition and the quality of patient care. Health economics. 17(8): 977-995.
Bazzoli, G.J., Clement, J.P., Lindrooth, R.C., Chen, H.F., Aydede, S.K., Braun, B.I. and Loeb, J.M., 2007. Hospital financial condition and operational decisions related to the quality of hospital care. Medical Care Research and Review. 64(2): 148-168.
Berry Jaeker, J.A. and Tucker, A.L., 2016. Past the Point of Speeding Up: The Negative Effects of Workload Saturation on Efficiency and Patient Severity. Management
Science.
Berry, L.L. and Bendapudi, N., 2007. Health care a fertile field for service research. Journal of Service Research. 10(2): 111-122.
Bertrand, M., Karlin, D., Mullainathan, S., Shafir, E. and Zinman, J., 2005. What's psychology worth? A field experiment in the consumer credit market. No. w11892. National Bureau of Economic Research.
Best, T.J., Sandıkçı, B., Eisenstein, D.D. and Meltzer, D.O., 2015. Managing hospital inpatient bed capacity through partitioning care into focused wings. Manufacturing &
Service Operations Management. 17(2): 157-176.
Bitner, M.J., 1990. Evaluating service encounters: the effects of physical surroundings and employee responses. The Journal of Marketing. 54(2): 69-82.

131
Bloom, N., Propper, C., Seiler, S. and Van Reenen, J., 2015. The impact of competition on management quality: evidence from public hospitals. The Review of Economic
Studies. 82(2): 457-489.
Bodenheimer, T., Chen, E. and Bennett, H.D., 2009. Confronting the growing burden of chronic disease: can the US health care workforce do the job?. Health Affairs. 28(1): 64-74.
Brill, J., 2015. Competition in Health Care Markets. Health Affairs. URL http://healthaffairs.org/blog/2015/01/26/competition-in-health-care-markets/
Bruggink, T.H., Finan, K.C., Gendel, E.B. and Todd, J.S., 1985. Direct and indirect effects of unionization on the wage levels of nurses: A case study of New Jersey hospitals. Journal of Labor Research. 6(4): 405-416.
Bunker, J.P., Luft, H.S. and Enthoven, A., 1982. Should surgery be regionalized?. The
Surgical clinics of North America. 62(4): 657-668.
Bureau of Labor Statistics, 2014a. Registered Nurses : Occupational Outlook Handbook : U.S. Bureau of Labor Statistics. http://www.bls.gov/ooh/healthcare/registered-nurses.htm
Bureau of Labor Statistics, 2014b. Licensed Practical and Licensed Vocational Nurses : Occupational Outlook Handbook: U.S. Bureau of Labor Statistics . http://www.bls.gov/ooh/healthcare/licensed-practical-and-licensed-vocational-nurses.htm
Califf, R.M. and Faxon, D.P., 2003. Need for centers to care for patients with acute coronary syndromes. Circulation. 107(11): 1467-1470.
Campbell, D.J. and Gingrich, K.F., 1986. The Interactive Effects of Task Complexity and Participation on Task Performance: A Field Experiment. Organizational Behavior and
Human Decision Processes 38(2): 162–180.
Campbell, D.K. 1991. Goal Levels, Complex Tasks, and Strategy Development: A Review and Analysis. Human Performance 4(1): 1–31.
Carr, B.G. and Asplin, B.R., 2010. Regionalization and emergency care: the institute of medicine reports and a federal government update. Academic Emergency
Medicine, 17(12): 1351-1353.
Carte, T. A., C. J. Russell. 2003. In pursuit of moderation: Nine common errors and their solution. MIS Quarterly. 25(3): 478–502.
Chandra, A., Finkelstein, A., Sacarny, A. and Syverson, C., 2015.Healthcare Exceptionalism? Performance and Allocation in the US Healthcare Sector. No. w21603. National Bureau of Economic Research.
132
Chandrasekaran, A., Senot, C. and Boyer, K.K., 2012. Process management impact on clinical and experiential quality: managing tensions between safe and patient-centered healthcare. Manufacturing & Service Operations Management. 14(4): 548-566.
Chen, J., Radford, M.J., Wang, Y., Marciniak, T.A. and Krumholz, H.M., 1999. Do “America's Best Hospitals” perform better for acute myocardial infarction?. New
England Journal of Medicine. 340(4): 286-292.
Cheng, S.H., Yang, M.C. and Chiang, T.L., 2003. Patient satisfaction with and recommendation of a hospital: effects of interpersonal and technical aspects of hospital care. International Journal for Quality in Health Care. 15(4): 345-355.
Cho, S.H., Ketefian, S., Barkauskas, V.H. and Smith, D.G., 2003. The effects of nurse staffing on adverse events, morbidity, mortality, & medical costs. Nursing research. 52(2): 71-79.
CMS.gov A. https://www.cms.gov/research-statistics-data-and-systems/statistics-trends-and-reports/nationalhealthexpenddata/nationalhealthaccountshistorical.html
CMS.gov B https://www.cms.gov/Medicare/Quality-Initiatives-Patient-Assessment- Instruments/hospital-value-based-purchasing/index.html?redirect=/hospital-value-based-purchasing/
Collins, S.R., Rasmussen, P.W., Doty, M.M., 2014. Gaining ground: Americans’ health insurance coverage and access to care after the Affordable Care Act’s first open enrollment period. Issue Brief Commonw. Fund 16, 1–23.
Cooper, Z., Gibbons, S., Jones, S. and McGuire, A., 2011. Does hospital competition save lives? evidence from the English NHS patient choice reforms. The Economic
Journal. 121(554): 228-260.
Corbett, C.J., Montes-Sancho, M.J. and Kirsch, D.A., 2005. The financial impact of ISO 9000 certification in the United States: An empirical analysis. Management science. 51(7): 1046-1059.
Cronin, J.J., Brady, M.K. and Hult, G.T.M., 2000. Assessing the effects of quality, value, and customer satisfaction on consumer behavioral intentions in service environments. Journal of retailing. 76(2): 193-218.
Culnan, M. J. 1983. Environmental Scanning: The Effects of Task Complexity and Source Accessibility on Information Gathering Behavior. Decision Sciences 14(2): 194–206.
Cummings, G. and Estabrooks, C.A., 2003. The effects of hospital restructuring that included layoffs on individual nurses who remained employed: A systematic review of impact. International Journal of Sociology and Social Policy. 23(8/9): 8-53.
Cutler, D. M. 2010. “Where Are the Health Care Entrepreneurs?” Issues in Science &
Technology. 27(1): 49–56.
133
Cutler, D., 1995. The Incidence of Adverse Medical Outcomes under Prospective Payment. Econometrica. 63: 29–50.
Cutler, D.M., Huckman, R.S. and Landrum, M.B., 2004. The role of information in
medical markets: an analysis of publicly reported outcomes in cardiac surgery. No. w10489. National Bureau of Economic Research.
Cutler, D.M., Morton, F.S., 2013. Hospitals, market share, and consolidation. JAMA 310, 1964–1970.
Darke, P.R., Chaiken, S., Bohner, G., Einwiller, S., Erb, H.P. and Hazlewood, J.D., 1998. Accuracy motivation, consensus information, and the law of large numbers: Effects on attitude judgment in the absence of argumentation. Personality and Social Psychology
Bulletin. 24(11): 1205-1215.
DeMarco, T., 2002. Slack: Getting past burnout, busywork, and the myth of total
efficiency. New York: Broadway Books.
Devaraj, S., and Kohli, K., 2003. Performance Impacts of Information Technology: Is Actual Usage the Missing Link? Management Science. 49(3): 273–89.
Devers, K.J., Brewster, L.R. and Casalino, L.P., 2003. Changes in hospital competitive strategy: a new medical arms race?. Health services research. 38(1-2): 447-469.
Deyo, R.A., Mirza, S.K., Martin, B.I., Kreuter, W., Goodman, D.C. and Jarvik, J.G., 2010. Trends, major medical complications, and charges associated with surgery for lumbar spinal stenosis in older adults. JAMA. 303(13): 1259-1265.
Dindo, D., Demartines, N. and Clavien, P.A., 2004. Classification of surgical complications: a new proposal with evaluation in a cohort of 6336 patients and results of a survey. Annals of surgery. 240(2): 205-213.
Ding, D.X., 2014. The effect of experience, ownership and focus on productive efficiency: A longitudinal study of US hospitals. Journal of Operations Management. 32(1): 1-14.
Donabedian, A., 1988. The quality of care: How can it be assessed?. Jama. 260(12): 1743-1748
Douglas, P.S., Taylor, A., Bild, D., Bonow, R., Greenland, P., Lauer, M., Peacock, F. and Udelson, J., 2009. Outcomes research in cardiovascular imaging: report of a workshop sponsored by the National Heart, Lung, and Blood Institute. JACC: Cardiovascular
Imaging, 2(7), pp.897-907.
Dranove, D. and Satterthwaite, M.A., 2000. The industrial organization of health care markets. Handbook of health economics. 1093-1139
Dranove, D. and Sfekas, A., 2008. Start spreading the news: a structural estimate of the effects of New York hospital report cards. Journal of health economics. 27(5): 1201-1207.

134
Dranove, D., Forman, C., Goldfarb, A. and Greenstein, S., 2012. The Trillion Dollar Conundrum: Complementarities and Health Information Technology. No w18281. National Bureau of Economic Research.
Dranove, D., Shanley, M. and Simon, C., 1992. Is hospital competition wasteful?. The
Rand journal of economics. 23(2): 247-262.
Dranove, D., Shanley, M. and White, W.D., 1993. Price and concentration in hospital markets: the switch from patient-driven to payer-driven competition. Journal of Law
and Economics. 36(1): 179-204.
Egger, E., 2000. Hospitals are beginning to make creative use of excess capacity. Health
care strategic management. 18(4): 16.
Elixhauser, A., Steiner, C., Harris, D.R. and Coffey, R.M., 1998. Comorbidity measures for use with administrative data. Medical care. 36(1): 8-27.
Encinosa, W.E. and Bernard, D.M., 2005. Hospital finances and patient safety outcomes. INQUIRY: The Journal of Health Care Organization, Provision, and
Financing, 42(1): 60-72.
Erdem, T. and Swait, J., 2004. Brand credibility, brand consideration, and choice. Journal of consumer research. 31(1): 191-198.
Everhart, D., Neff, D., Al-Amin, M., Nogle, J. and Weech-Maldonado, R., 2013. The effects of nurse staffing on hospital financial performance: Competitive versus less competitive markets. Health care management review. 38(2): 146-155.
Field, J.M. and Sinha, K.K., 2005. Applying Process Knowledge for Yield Variation Reduction: A Longitudinal Field Study. Decision Sciences. 36(1): 159-186.
Friedman, B., Devers, K.J., Steiner, C.A. and Fox, S., 2002. The use of expensive health technologies in the era of managed care: the remarkable case of neonatal intensive care. Journal of Health Politics, Policy and Law. 27(3): 441-464.
Fung, C.H., Elliott, M.N., Hays, R.D., Kahn, K.L., Kanouse, D.E., McGlynn, E.A., Spranca, M.D. and Shekelle, P.G., 2005. Patients' preferences for technical versus interpersonal quality when selecting a primary care physician. Health services
research. 40(4): 957-977.
Furukawa, M. F., 2011. Electronic medical records and the efficiency of hospital emergency departments. Medical Care Research and Review. 68(1): 75-95.
Gao, G., Gopal, A. and Agarwal, R., 2010. Contingent effects of quality signaling: Evidence from the Indian offshore IT services industry. Management Science. 56(6): 1012-1029.
Gardner, J.W., Boyer, K.K. and Gray, J.V., 2015. Operational and strategic information processing: Complementing healthcare IT infrastructure. Journal of Operations
Management. 33(1): 123-139.
135
Garvin, D.A., 1988. Managing quality: The strategic and competitive edge. Simon and Schuster.
Gaynor, M. and Anderson, G.F., 1995. Uncertain demand, the structure of hospital costs, and the cost of empty hospital beds. Journal of health economics. 14(3): 291-317.
Gaynor, M. and Town, R.J., 2011. Competition in health care markets. No. w17208. National Bureau of Economic Research.
Gaynor, M., 2006. What do we know about competition and quality in health care markets? No. w12301. National Bureau of Economic Research.
Gaynor, M., 2014. Competition policy in health care markets: Navigating the enforcement and policy maze. Health Affairs. 33(6): 1088-93.
Gerteis J., Izrael D., Deitz D., LeRoy L., Ricciardi R., Miller T., Basu J., 2014. Multiple Chronic Conditions Chartbook. AHRQ Publications No,Q14-0038. Rockville, MD.
Goldman, D. and Romley, J.A., 2008. Hospitals as hotels: the role of patient amenities in hospital demand. No. w14619. National Bureau of Economic Research.
Gordon, T.A., Burleyson, G.P., Tielsch, J.M. and Cameron, J.L., 1995. The effects of regionalization on cost and outcome for one general high-risk surgical procedure. Annals of surgery. 221(1): 43.
Gravelle, H., Santos, R. and Siciliani, L., 2014. Does a hospital's quality depend on the quality of other hospitals? A spatial econometrics approach. Regional science and
urban economics. 49(11): 203-216.
Green, L.V. and Nguyen, V., 2001. Strategies for cutting hospital beds: the impact on patient service. Health services research. 36(2): 421-442.
Greenwald, L., Cromwell, J., Adamache, W., Bernard, S., Drozd, E., Root, E. and Devers, K., 2006. Specialty versus community hospitals: referrals, quality, and community benefits. Health affairs. 25(1): 106-118.
Grönroos, C., 1990. Service management and marketing: managing the moments of truth in service competition. Jossey-Bass.
Halvorson, G.C. and Isham, G.J., 2003. Epidemic of care: A call for safer, better, and more accountable health care. San Francisco: Jossey-Bass.
Harrison, T. D. 2008. On the bias and consistency of OLS for an endogenous interaction coefficient. Working paper, Drexel University, Philadelphia.
Hausman, J., and McFadden, D. 1984. Specification tests for the multinomial logit model. Econometrica. 52(5): 1219–1240.
Hausman, J.A., 1978. Specification tests in econometrics. Econometrica. 46(6): 1251-1271.
136
Hayes, L.J., O’Brien-Pallas, L., Duffield, C., Shamian, J., Buchan, J., Hughes, F., Laschinger, H.K.S., North, N. and Stone, P.W., 2006. Nurse turnover: a literature review. International journal of nursing studies. 43(2): 237-263.
Health Affairs. 2005. Health Information Technology (special issue) 24(5): entire issue.
Hendricks, K.B. and Singhal, V.R., 1996. Quality awards and the market value of the firm: An empirical investigation. Management science. 42(3): 415-436.
Heskett, J. L. 1983. Shouldice Hospital Limited. HBS Case 9-683-068. Harvard Business School, Boston.
Hewner, S., 2014. A Population-Based Care Transition Model For Chronically III Elders. Nursing Economics. 32(3): 109.
HHS. 2009. http://www.hhs.gov/.
Hibbard, J.H. and Peters, E., 2003. Supporting informed consumer health care decisions: data presentation approaches that facilitate the use of information in choice. Annual
Review of Public Health. 24(1): 413-433.
Hirsch, B.T. and Schumacher, E.J., 1995. Monopsony power and relative wages in the labor market for nurses. Journal of Health Economics. 14(4): 443-476.
Hoechle, D., 2007. Robust standard errors for panel regressions with cross-sectional dependence. Stata Journal. 7(3): 281
Hopp, W.J., Iravani, S.M. and Yuen, G.Y., 2007. Operations systems with discretionary task completion. Management Science. 53(1): 61-77.
Huckman, R.S., Pisano, G.P., 2006. The Firm Specificity of Individual Performance: Evidence from Cardiac Surgery. Management Science. 52(4): 473–488.
Hyer, N.L., Wemmerlöv, U. and Morris, J.A., 2009. Performance analysis of a focused hospital unit: The case of an integrated trauma center. Journal of Operations
Management. 27(3):.203-219.
Ingwersen, P.E.R., 1992. Information Retrieval Interaction. Taylor Graham.
Jack, E.P. and Powers, T.L., 2004. Volume flexible strategies in health services: a research framework. Production and Operations Management. 13(3): 230-244.
James, J., 2012. Health policy brief: pay-for-performance. Health Affairs. 11: 2043-2050.
Janiszewski Goodin, H., 2003. The nursing shortage in the United States of America: an integrative review of the literature. Journal of advanced nursing. 43(4): 335-343.
Jha, A. K. 2006. Measuring hospital quality what physicians do? How patients fare? Or both? JAMA J. Am. Med. Assoc. 296(1): 95–97.
137
Jha, A.K., E.J. Orav, A. Dobson, R.A. Book, and A.M. Epstein. 2009. Measuring efficiency: The association of hospital costs and quality of care. Health Affairs. 28(3): 897-906.
Jha, A.K., Orav, E.J., Li, Z. and Epstein, A.M., 2007. The inverse relationship between mortality rates and performance in the Hospital Quality Alliance measures. Health
affairs. 26(4): 1104-1110.
Joint Commission on Accreditation of Healthcare Organizations, 2002. Health care at the crossroads: strategies for addressing the evolving nursing crisis. Joint Commission on
Accreditation of Healthcare Organizations. Oakbrook Terrace, Ill.
Jones, S.S., Adams, J.L., Schneider, E.C., Ringel, J.S. and McGlynn, E.A., 2010. Electronic health record adoption and quality improvement in US hospitals. The
American journal of managed care, 16(12 Suppl HIT) SP64-71.
Joynt, K.E. and Rosenthal, M.B., 2012. Hospital Value-Based Purchasing Will Medicare's New Policy Exacerbate Disparities?. Circulation: Cardiovascular Quality
and Outcomes. 5(2): 148-149.
Kamakura, W.A., Mittal, V., de Rosa, F. and Mazzon, J.A. 2002. Assessing the Service-Profit Chain. Marketing Science. 21(3): 294-317.
Katz, J.N., Barrett, J., Mahomed, N.N., Baron, J.A., Wright, R.J. and Losina, E., 2004. Association between hospital and surgeon procedure volume and the outcomes of total knee replacement. Journal of Bone and Joint Surgery. 86(9): 1909-1916.
Kc, D.S. and Terwiesch, C., 2009. Impact of workload on service time and patient safety: An econometric analysis of hospital operations. Management Science. 55(9): 1486-1498.
Kc, D.S. and Terwiesch, C., 2012. An econometric analysis of patient flows in the cardiac intensive care unit. Manufacturing & Service Operations Management. 14(1): 50-65.
Kenagy, J.W., Berwick, D.M. and Shore, M.F., 1999. Service quality in health care. JAMA. 281(7): 661-665.
Kessler, D.P. and Geppert, J.J., 2005. The effects of competition on variation in the quality and cost of medical care. Journal of Economics & Management Strategy. 14(3): 575-589.
Kessler, D.P. and McClellan, M.B., 1999. Is hospital competition socially wasteful? No. w7266. National Bureau of Economic Research.
Kline, D.S., 2003. Push and pull factors in international nurse migration. Journal of
nursing scholarship. 35(2): 107-111.
Konetzka, R.T., Stearns, S.C. and Park, J., 2008. The staffing–outcomes relationship in nursing homes. Health services research. 43(3): 1025-1042.

138
Lang, T.A., Hodge, M., Olson, V., Romano, P.S. and Kravitz, R.L., 2004. Nurse–patient ratios: a systematic review on the effects of nurse staffing on patient, nurse employee, and hospital outcomes. Journal of Nursing Administration. 34(7-8): 326-337.
Li, L. and Benton, W.C., 2006. Hospital technology and nurse staffing management decisions. Journal of Operations Management. 24(5): 676-691.
Lindenauer, P.K., Remus, D., Roman, S., Rothberg, M.B., Benjamin, E.M., Ma, A. and Bratzler, D.W., 2007. Public reporting and pay for performance in hospital quality improvement. New England Journal of Medicine. 356(5): 486-496.
Litvak, E. and Bisognano, M., 2011. More patients, less payment: Increasing hospital efficiency in the aftermath of health reform. Health Affairs. 30(1): 76-80.
Locke, E.A., Shaw, K.N., Saari, L.M. and Latham, G.P., 1981. Goal setting and task performance: 1969–1980. Psychological bulletin. 90(1): 125.
Luft, H.S., Garnick, D.W., Mark, D.H., Peltzman, D.J., Phibbs, C.S., Lichtenberg, E. and McPhee, S.J., 1990. Does quality influence choice of hospital?. Jama. 263(21): 2899-2906.
Luft, H.S., Hunt, S.S. and Maerki, S.C., 1987. The volume-outcome relationship: practice-makes-perfect or selective-referral patterns?. Health services research. 22(2): 157.
Luke, R.D., Luke, T. and Muller, N., 2011. Urban hospital ‘clusters’ do shift high-risk procedures to key facilities, but more could be done. Health Affairs. 30(9): 1743-1750.
Maddala, G. S. 1983. Limited-Dependent and Qualitative Variables in Econometrics. Cambridge University Press, Cambridge, UK
Manary, M.P., Boulding, W., Staelin, R. and Glickman, S.W., 2013. The patient experience and health outcomes. New England Journal of Medicine. 368(3): 201-203.
Marshall MN, Shekelle PG, Leatherman S, Brook RH. 2000. The public release of performance data: What do we expect to gain? A review of the evidence. JAMA. 283(14): 1866–1874
May, J.H., Bazzoli, G.J. and Gerland, A.M., 2006. Hospitals’ responses to nurse staffing shortages. Health Affairs. 25(4): W316-W323.
McAleese, P. and Odling-Smee, W., 1994. The effect of complications on length of stay. Annals of surgery. 220(6): 740.
McCabe, C., Kirchner, C., Zhang, H., Daley, J. and Fisman, D.N., 2009. Guideline-concordant therapy and reduced mortality and length of stay in adults with community-acquired pneumonia: playing by the rules. Archives of Internal Medicine. 169(16): 1525-1531.

139
McConnell, K.J., Lindrooth, R.C., Wholey, D.R., Maddox, T.M. and Bloom, N., 2013. Management practices and the quality of care in cardiac units. JAMA internal
medicine, 173(8): 684-692.
McCue, M., Mark, B.A. and Harless, D.W., 2003. Nurse staffing, quality, and financial performance. Journal of health care finance. 29(4): 54-76.
McCullough, J.S., Casey, M., Moscovice, I. and Prasad, S., 2010. The effect of health information technology on quality in US hospitals. Health Affairs. 29(4): 647-654.
McCullough, J.S., Parente, S. and Town, R., 2013. Health information technology and
patient outcomes: The role of organizational and informational
complementarities. No. w18684. National Bureau of Economic Research.
McDermott, C.M. and Stock, G.N., 2011. Focus as emphasis: conceptual and performance implications for hospitals. Journal of Operations Management. 29(6): 616-626.
McKinsey 2008. Service Line Strategies for US Hospitals. http://healthcare.mckinsey.com/sites/default/files/737801_Serviceline_strategies_for_US_hospitals__.pdf
Mckinsey, 2014. Optimizing the nursing skill mix: A win for nurses, patients, and hospitals http://healthcare.mckinsey.com/optimizing-nursing-skill-mix-win-nurses-patients-and-hospitals
Mechanic, D., 2008. Rethinking medical professionalism: the role of information technology and practice innovations. Milbank Quarterly. 86(2): 327-358.
Miller D.J., Fern M.J., Cardinal L.B., 2007. The use of knowledge for technological innovation within diversified firms. Academy of Management Journal. 50(2): 307-325.
Miller, A.R. and Tucker, C., 2011. Can healthcare IT save babies?. Available at SSRN
1080262.
Miller, S. 2008. Kudzu.com survey reveals online reviews significantly impact consumer spending. Available at http://www.reuters.com/article/idUS159105+09-Dec-2008+PRN20081209
Monstad, K., Engesæter, L.B. and Espehaug, B., 2006. Patients' preferences for choice of hospital. Health Economics Bergen Working Paper. 5(06).
Montgomery, H. and Svenson, O., 1989. A think-aloud study of dominance structuring in decision processes. Process and structure in human decision making, 135-150.
Mukherjee, A.S., Lapré, M.A. and Van Wassenhove, L.N., 1998. Knowledge driven quality improvement. Management Science. 44(11-part-2): S35-S49.

140
Needleman, J., Buerhaus, P., Mattke, S., Stewart, M., Zelevinsky, K., 2002. Nurse Staffing Levels and the Quality of Care in Hospitals. New England Journal of
Medicine. 346(22): 1715-1722
Needleman, J., Buerhaus, P.I., Stewart, M., Zelevinsky, K. and Mattke, S., 2006. Nurse staffing in hospitals: is there a business case for quality?.Health Affairs. 25(1): 204-211.
New York Times, 2014. F.T.C. Wary of Mergers by Hospitals. The New York Times. http://www.nytimes.com/2014/09/18/business/ftc-wary-of-mergers-by-hospitals-.html?_r=0
Newby, L.K., LaPointe, N.M.A., Chen, A.Y., Kramer, J.M., Hammill, B.G., DeLong, E.R., Muhlbaier, L.H., Califf, R.M., 2006. Long-term adherence to evidence-based secondary prevention therapies in coronary artery disease. Circulation. 113(2): 203-212.
Osborne, N.H., Nicholas, L.H., Ghaferi, A.A., Upchurch, G.R. and Dimick, J.B., 2010. Do popular media and internet-based hospital quality ratings identify hospitals with better cardiovascular surgery outcomes?. Journal of the American College of
Surgeons. 210(1): 87-92
Palmer, R.H., 1997. Process-based measures of quality: the need for detailed clinical data in large health care databases. Annals of Internal Medicine. 127(8_Part_2): 733-738.
Parasuraman, A., Zeithaml, V.A. and Berry, L.L., 1985. A conceptual model of service quality and its implications for future research. The Journal of Marketing. 49(4): 41-50.
Payne, J.W. 1976. Task Complexity and Contingent Processing in Decision Making: An Information Search and Protocol Analysis. Organizational Behavior and Human
Performance. 16(2): 366–87.
Pope, D.G., 2009. Reacting to rankings: evidence from “America's Best Hospitals”. Journal of health economics. 28(6): 1154-1165.
Pronovost, P.J., Jenckes, M.W., Dorman, T., Garrett, E., Breslow, M.J., Rosenfeld, B.A., Lipsett, P.A. and Bass, E., 1999. Organizational characteristics of intensive care units related to outcomes of abdominal aortic surgery. Jama. 281(14): 1310-1317.
Propper, C., Burgess, S. and Gossage, D., 2008. Competition and quality: Evidence from the NHS internal market 1991–9*. The Economic Journal. 118(525): 138-170.
PwC Consulting, 2012. http://www.pwc.com/us/en/press-releases/2012/moment-of-truth-for-healthcare.html
Queenan, C.C., Angst, C.M. and Devaraj, S., 2011. Doctors’ orders––If they’re electronic, do they improve patient satisfaction? A complements/substitutes perspective. Journal of Operations Management. 29(7): 639-649.
141
Queenan, C.C., Kull, T.J. and Devaraj, S., 2016. Complements or Substitutes? Culture–Technology Interactions in Healthcare. Decision Sciences.
Rathore, S.S., Epstein, A.J., Volpp, K.G. and Krumholz, H.M., 2005. Regionalization of care for acute coronary syndromes: more evidence is needed. JAMA, 293(11): 1383-1387.
Richardson, W.C., Berwick, D.M., Bisgard, J., Bristow, L.R., Buck, C.R. and Cassel, C.K., 2001. Crossing the quality chasm: a new health system for the 21st century
Rivers, P.A., Tsai, K.L. and Munchus, G., 2004. The financial impacts of the nursing shortage. Journal of health care finance. 31(3): 52-64.
Robinson, J.C., 1988. Hospital quality competition and the economics of imperfect information. The Milbank Quarterly. 66(3): 465-481.
Robinson, J.C., 1988. Market structure, employment, and skill mix in the hospital industry. Southern Economic Journal. 55(2): 315-325.
Roche, J.J.W., Wenn, R.T., Sahota, O. and Moran, C.G., 2005. Effect of comorbidities and postoperative complications on mortality after hip fracture in elderly people: prospective observational cohort study. Bmj. 331(7529): 1374.
Rodak, 2013. http://www.beckershospitalreview.com/hospital-key-specialties/is-center-of-excellence-investment-the-silver-bullet-healthcare-has-been-looking-for.html
Roques, F., Nashef, S.A.M., Michel, P., Gauducheau, E., De Vincentiis, C., Baudet, E., Cortina, J., David, M., Faichney, A., Gavrielle, F. and Gams, E., 1999. Risk factors and outcome in European cardiac surgery: analysis of the EuroSCORE multinational database of 19030 patients. European Journal of Cardio-thoracic Surgery. 15(6): 816-823.
Rubin, H.R., Pronovost, P. and Diette, G.B., 2001. The advantages and disadvantages of process based measures of health care quality. International Journal for Quality in
Health Care. 13(6): 469-474.
Rudolph, J.W. and Repenning, N.P., 2002. Disaster dynamics: Understanding the role of quantity in organizational collapse. Administrative Science Quarterly. 47(1): 1-30.
Rust, R.T. and Zahorik, A.J., 1993. Customer satisfaction, customer retention, and market share. Journal of retailing. 69(2): 193-215.
Salop, S.C., 1979. Strategic entry deterrence. The American Economic Review. 69(2): 335-338.
Schultz, M.A., van Servellen, G., Chang, B.L., McNeese-Smith, D. and Waxenberg, E., 1997. The relationship of hospital structural and financial characteristics to mortality and length of stay in acute myocardial infarction patients. Outcomes Management for
Nursing Practice. 2(3): 130-136.
142
Senot, C., Chandrasekaran, A. and Ward, P.T., 2015. Role of Bottom-Up Decision Processes in Improving the Quality of Health Care Delivery: A Contingency Perspective. Production and Operations Management. 25(3): 458-476
Senot, C., Chandrasekaran, A., Ward, P.T., Tucker, A.L. and Moffatt-Bruce, S.D., 2015. The Impact of Combining Conformance and Experiential Quality on Hospitals’ Readmissions and Cost Performance. Management Science. 62(3): 829:848.
Sharma, L., Chandrasekaran, A., Boyer, K., and McDermott, C., 2016. The Impact of Health Information Technology Bundles on Performance: An Econometric Study. Journal of Operations Management. 41(1): 24-41.
Shen, Y.C., 2003. The effect of financial pressure on the quality of care in hospitals. Journal of health economics. 22(2): 243-269.
Shwartz, M., A.B. Cohen, J.D. Restuccia, Z.J. Ren, A. Labonte, C. Theokary, R. Kang, and J. Horwitt. 2011. How Well Can We Identify the High-Performing Hospital?
Medical Care Research and Review. 68(3): 290-310.
Silow-Carrol S, Alteras T, Meyer JA. Hospital Quality Improvement: Strategies and
Lessons From U.S. Hospitals. New York, NY: The Commonwealth Fund; 2007
Sirmon, D.G., Gove, S. and Hitt, M.A., 2008. Resource management in dyadic competitive rivalry: The effects of resource bundling and deployment. Academy of
Management Journal. 51(5): 919-935.
Skinner, Jonathan S. 2011. “Causes and Consequences of Regional Variations in Health Care.” In Handbook of Health Economics. Vol. 2, ed. Mark V. Pauly, Thomas G. Mcguire and Pedro P. Barros, 45–93. Elsevier
Skinner, W., 1974. The focused factory. Harvard Business Review. 52(3): 113–121.
Sloan, F.A., Picone, G.A., Taylor, D.H. and Chou, S.Y., 2001. Hospital ownership and cost and quality of care: is there a dime’s worth of difference?. Journal of health
economics. 20(1): 1-21.
Sofaer, S., Crofton, C., Goldstein, E., Hoy, E. and Crabb, J., 2005. What do consumers want to know about the quality of care in hospitals?. Health services research. 40(6p2): 2018-2036.
Spear, S.J., 2005. Fixing health care from the inside, today. Harvard business review. 83(9):78.
Staw, B.M., Sandelands, L.E. and Dutton, J.E., 1981. Threat rigidity effects in organizational behavior: A multilevel analysis. Administrative science quarterly. 26(4): 501-524.
Tay, A., 2003. Assessing competition in hospital care markets: the importance of accounting for quality differentiation. RAND Journal of Economics. 34(4): 786-814.

143
Teisberg, E.O., Porter, M.E. and Brown, G.B., 1993. Making competition in health care work. Harvard Business Review. 72(4): 131-141.
The Economist, 2014. http://www.economist.com/blogs /democracyinamerica /2014 /07/ health-care-jobs
The New York Times, 1996. http://www.nytimes.com/1996/08/19/nyregion/once-in-big-demand-nurses-are-targets-for-hospital-cuts.html?pagewanted=all
The New Yorker. 2011. Ask the Author Live: Atul Gawande on Medical Costs. The New
Yorker. January 14. http://www.newyorker.com/books/ask-the-author/ask-the-author-live-atul-gawande-on-medical-costs.
Thungjaroenkul, P., Cummings, G.G., Embleton, A., 2007. The impact of nurse staffing on hospital costs and patient length of stay: a systematic review. Nursing
Economics. 25(5): 255-265.
Tirole, J., 1988. The theory of industrial organization. MIT press.
Tucker, A.L. and Edmondson, A.C., 2003. Why hospitals don't learn from failures: Organizational and psychological dynamics that inhibit system change. California
Management Review. 45(2): 55-72.
Tucker, A.L., 2007. An empirical study of system improvement by frontline employees in hospital units. Manufacturing & Service Operations Management. 9(4): 492-505.
Umesh, U.N. and Cote, J.A., 1988. Influence of situational variables on brand-choice models. Journal of Business Research. 16(2): 91-99.
Vahey, D.C., Aiken, L.H., Sloane, D.M., Clarke, S.P. and Vargas, D., 2004. Nurse burnout and patient satisfaction. Medical care. 42(2 Suppl): II57.
Van de Ven, A.H. and Ferry, D.L., 1980. Measuring and assessing organizations. John Wiley & Sons.
Varkevisser, M., van der Geest, S.A. and Schut, F.T., 2012. Do patients choose hospitals with high quality ratings? Empirical evidence from the market for angioplasty in the Netherlands. Journal of Health Economics. 31(2): 371-378.
Victoor, A., Delnoij, D.M., Friele, R.D. and Rademakers, J.J., 2012. Determinants of patient choice of healthcare providers: a scoping review. BMC health services
research. 12(1):1
Wang, G., Li, J., Hopp, W.J., Fazzalari, F.L. and Bolling, S., 2015. Hospital Quality and Patient Choice: An Empirical Analysis of Mitral Valve Surgery. Available at SSRN.
Washington Post, 2013. Design flaws in the Affordable Care Act. https://www.washingtonpost.com/opinions/design-flaws-in-the-affordable-care-act/2013/12/13/905571ce-636e-11e3-aa81-e1dab1360323_story.html
144
Wayne, A., 2014. Obamacare Rate Increases Low as Insurer Competition Grows [WWW Document]. Bloomberg.com. URL http://www.bloomberg.com/news/articles/2014-10-31/obamacare-rate-increases-low-as-insurer-competition-grows.
Weiner, B. J., J. A. Alexander, S. M. Shortell, L. C. Baker, M. Becker, and J. J. Geppert. 2006. Quality improvement implementation and hospital performance on quality indicators. Health Services Research. 41(2): 307-34.
Weissman, J.S., Rothschild, J.M., Bendavid, E., Sprivulis, P., Cook, E.F., Evans, R.S., Kaganova, Y., Bender, M., David-Kasdan, J., Haug, P. and Lloyd, J., 2007. Hospital workload and adverse events. Medical care. 45(5): 448-455.
Werner, R.M., 2010. Does pay-for-performance steal from the poor and give to the rich?. Annals of internal medicine, 153(5): 340-341.
Werner, R.M., Bradlow, E.T. and Asch, D.A., 2008. Does hospital performance on process measures directly measure high quality care or is it a marker of unmeasured care?. Health services research. 43(5p1):1464-1484.
Wood, R. E., 1986. Task Complexity: Definition of the Construct. Organizational
Behavior and Human Decision Processes 37(1): 60–82.
Wooldridge, J.M., 2010. Econometric analysis of cross section and panel data. MIT press.
Xu T., Wu A.W., Makary M.A., 2015 The Potential Hazards of Hospital Consolidation: Implications for Quality, Access, and Price. JAMA. 314(13): 1337-1338.
Zeithaml, V.A., 1988. Consumer perceptions of price, quality, and value: a means-end model and synthesis of evidence. The Journal of marketing, 52(3): 2-22.
Zhang, D.J., Gurvich, I., Mieghem, V., A, J., Park, E., Young, R.S., Williams, M.V., 2015. Hospital Readmissions Reduction Program: An Economic and Operational Analysis. Management Science, Forthcoming

145
APPENDIX A
SUMMARY OF KEY PAPERS ON THE IMPACT OF EHRS AND INFORMATION
TECHNOLOGY
Study Study Period
Main Independent
Variable
Quality Dimensions
Findings
Agha 2011
1998 - 2005
EMR Adoption Medical Expenditure, LOS, Readmission
No change in outcomes even after several years of adoption
Angst et al. (2011)
NA Technologies for Cardiology
Cost/Patient, LOS
Sequence of adoption impacts costs and LOS
Angst et al. (2012)
NA Cardiology and Administrative Technologies
Process Quality, Patient Satisfaction, Mortality
Administrative technology impacts patient ratings while cardiology technologies impact process quality
Appari et al (2012)
2009 EMR and CPOE Adoption
Process Quality
Mixed, adopters benefit from EMR but not CPOE adoption.
Appari et al (2013)
2006 - 2010
EMR Capability
Process Quality
Positive
Aron et al. (2011)
NA Automation of sensing, control and monitoring systems
Error Rates Automation of error prevention functions reduces medical errors
Devaraj et al (2013)
NA IT Investment Mean and Standard Deviation of LOS, Patient Revenues
Patient Flow is an important mediating variable in improving financial performance
Dranove et al. (2012)
1996 - 2009
EHR Adoption Hospital Operating Costs
Mixed, No reduction in costs in the first three years of adoption. Cost reduces in later years only after certain conditions are met
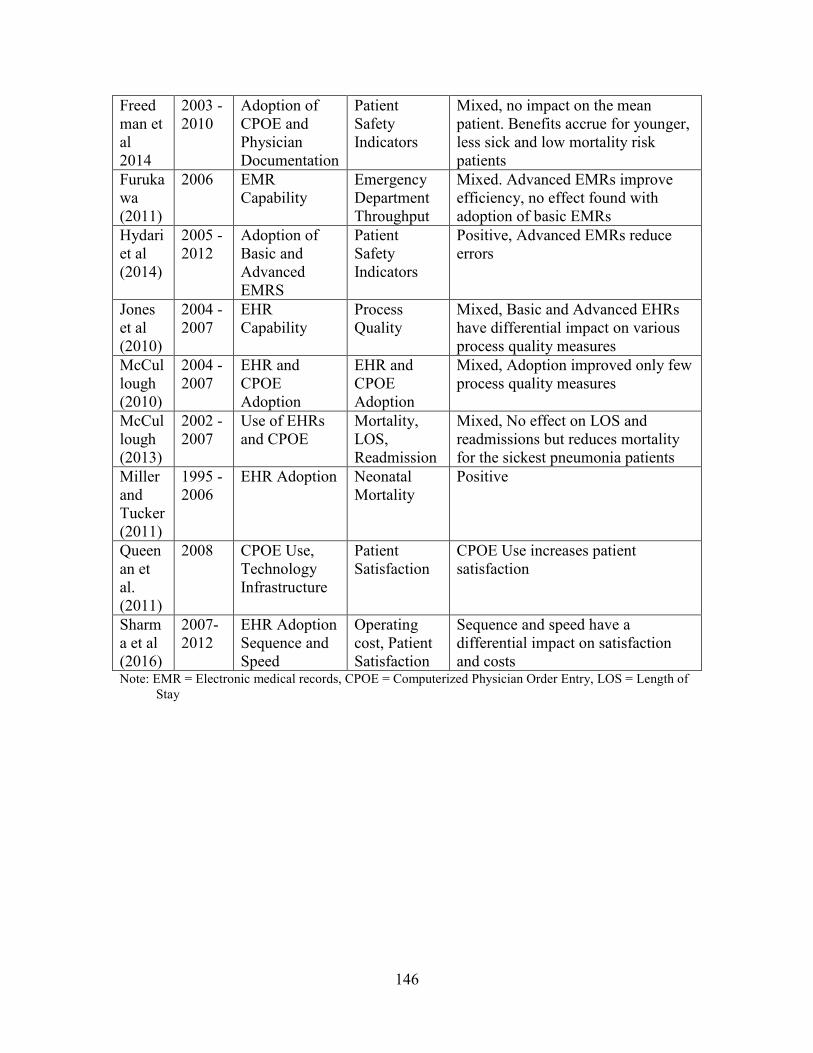
146
Freedman et al 2014
2003 - 2010
Adoption of CPOE and Physician Documentation
Patient Safety Indicators
Mixed, no impact on the mean patient. Benefits accrue for younger, less sick and low mortality risk patients
Furukawa (2011)
2006 EMR Capability
Emergency Department Throughput
Mixed. Advanced EMRs improve efficiency, no effect found with adoption of basic EMRs
Hydari et al (2014)
2005 - 2012
Adoption of Basic and Advanced EMRS
Patient Safety Indicators
Positive, Advanced EMRs reduce errors
Jones et al (2010)
2004 - 2007
EHR Capability
Process Quality
Mixed, Basic and Advanced EHRs have differential impact on various process quality measures
McCullough (2010)
2004 - 2007
EHR and CPOE Adoption
EHR and CPOE Adoption
Mixed, Adoption improved only few process quality measures
McCullough (2013)
2002 - 2007
Use of EHRs and CPOE
Mortality, LOS, Readmission
Mixed, No effect on LOS and readmissions but reduces mortality for the sickest pneumonia patients
Miller and Tucker (2011)
1995 - 2006
EHR Adoption Neonatal Mortality
Positive
Queenan et al. (2011)
2008 CPOE Use, Technology Infrastructure
Patient Satisfaction
CPOE Use increases patient satisfaction
Sharma et al (2016)
2007-2012
EHR Adoption Sequence and Speed
Operating cost, Patient Satisfaction
Sequence and speed have a differential impact on satisfaction and costs
Note: EMR = Electronic medical records, CPOE = Computerized Physician Order Entry, LOS = Length of
Stay

147
APPENDIX B
PROCESS OF CARE COMPONENTS
Process of Care Components (Number of Hospitals =
308) Mean
Standard
Deviation
Heart Attack (AMI)
AMI2 Patients given aspirin at discharge 95.87 8.22
AMI7 Patients given fibrinolytic medication within 30 minutes of arrival 69.27 26.78
AMI8 Patients given PCI within 90 minutes of arrival 83.08 19.32
Heart Failure (HF)
HF1 Patients given discharge instructions 84.92 19.12
HF2 Patients given an evaluation of LVS function 95.23 10.99
HF3 Patients given ACE inhibitor or ARB for LVSD 93.13 9.26
Pneumonia (PN)
PN3
Patients whose initial ER blood culture was performed prior to administration of first antibiotic 93.71 6.39
PN6 Patients given the most appropriate initial antibiotic(s) 91.54 8.27
Surgical Care Improvement Project (SCIP)
SCIP1 Surgery patients who received preventative antibiotic(s) 1 hour prior to incision 91.84 12.16
SCIP2
Surgery patients who received appropriate preventative antibiotic(s) for surgery antibiotic(s) 1 hour prior to incision 95.02 7.00
SCIP3 Surgery patients with previous antibiotic(s) stopped within 24 hours after surgery 88.06 14.71