investigating the role of calcium in the biomechanical
TRANSCRIPT

Investigating the Role of Calcium in the BiomechanicalResponse of Neutrophils to Mechanical Deformation
Experienced in the Pulmonary Capillaries
by
Jeffrey J. Hsu
S.B. Mechanical EngineeringS.B. Biology
Massachusetts Institute of Technology, 2005
SUBMITTED TO THE BIOLOGICAL ENGINEERING DIVISION IN PARTIALFULFILLMENT OF THE REQUIREMENTS FOR THE DEGREE OF
MASTER OF ENGINEERING IN BIOMEDICAL ENGINEERINGAT THE
MASSACHUSETTS INSTITUTE OF TECHNOLOGY
SEPTEMBER 2006
C) 2006 Massachusetts Institute of Technology. All rights reserved.
The author hereby grants to MIT permission to reproduce and to distribute publicly paperand electronic copies of this thesis document in whole or in part.
Signature of Author. ................. ,,,. ...
Biological Engineering DivisionJuly 26, 2006
Certified by ................................. v..............................Roger D. Kamm
Professor of Mechanical Engineering and Biological Engineering, MITAssociate Head, Department of Mechanical Engineering, MIT
Thesis Supervisor
A ccep ted by ................ , ... ... ......................................................Bevin P. Engelward
AssACHusETTr s I'NSltiTE Associate Professor of Biological Engineering, MITOF TECHNOLOGY Chair, Master of Engineering in Biomedical Engineering Program
NOV 15 2006ALIRARHVES
LIBRARIES

This page intentionally left blank.

Investigating the Role of Calcium in the BiomechanicalResponse of Neutrophils to Mechanical Deformation
Experienced in the Pulmonary Capillaries
by
Jeffrey J. Hsu
Submitted to the MIT Biological Engineering Division onJuly 26, 2006
in Partial Fulfillment of the Requirements for the Degree ofMaster of Engineering in Biomedical Engineering
ABSTRACT
Neutrophils in the pulmonary microcirculation are subjected to mechanical deformationwhile traveling through capillaries of sizes much smaller than the mean neutrophil diameter.This deformation has been shown to result in significant reductions in both the shear storageand shear loss moduli of the cell, with subsequent recovery towards their initial values. Also,deformation above a threshold stimulus results in neutrophil activation, evidenced bypseudopod projection from the cell. These two events are thought to occur via independentpathways, yet little is known about the mechanosensing signaling involved. Other work hasdemonstrated that physiological deformation of neutrophils induces a marked increase in thelevels of cytosolic calcium, suggesting that this occurrence may trigger the biomechanicalresponse observed in the cell.
The aim of this thesis was to elucidate the role of calcium in the neutrophil response to themechanical deformation experienced during transit through the pulmonary capillaries.Chelating intracellular calcium in neutrophils resulted in (i) decreased deformability of thecells into a microchannel, (ii) attenuation of the drop in shear storage modulus (G') observedin untreated cells upon deformation, and (iii) shorter activation times. These findingssuggest that cytosolic calcium holds an important function in the neutrophil transit throughthe capillaries, and inhibition of normal calcium release within the cell can lead toleukostasis-like conditions.
Thesis Supervisor: Roger D. Kamm, Ph.D.Tide: Professor of Mechanical and Biological Engineering
Associate Head, Department of Mechanical Engineering

This page intentionally left blank.

TABLE OF CONTENTS
ABSTRACT .............................................................................................................................................. 3
ACKNOWLEDGMENT S........................................................ 7
1.0 INTRODUCTION .................................................................................. 9
1.1 Background .......................................................................................................................................... 91.1.1 Neutrophil Morphology ........................... . .. ...... .................................... 91.1.2 Cytoskeletal Structure ................................. .................... ........... 11.1.3 Neutrophils in the Inflammatory Process ................... ............................... 12
1.2 Studying the Mechanical Behavior of Neutrophils.......................................................................... 161.2.1 Micropipette Aspiration .............................................................................. 161.2.2 O ptical T rapping ............................ ....... .. .... .. ..... .... .. .. .. .................................... 181.2.3 Particle-Tracking Microrheology ....................................... ...................... 19
1.3 Neutrophil Response to Stimuli........................................................................................................ 191.3.1 Activation by Biochemical Agents ...................................... ..................... 191.3.2 Response to Mechanical Deformation .................................................... 211.3.3 Analogous Responses in Other Cell Types.......................................................221.3.4 Calcium Activity in Neutrophil Activation ..................................... ................. 23
1.4 Soft Lithography Microfabrication for Biological Studies ....................................... ...... 24
1.5 Physiological Significance of the Present Study .................................................... 261.5.1 Objective .......................................... ............................ 27
2.0 MATERIALS AND METHODS ...................................... ..... ....... 29
2.1 Neutrophil Isolation .................................................................................................................... 29
2.2 Calcium Chelation ................................................................................................................... 302.2.1 Assessing the Effectiveness of Calcium Chelation Qualitatively ..................................... 3 12.2.2 Quantifying the Calcium Levels in BAPTA-treated Neutrophils ..................................... 32
2.3 Design and Microfabrication of Experimental System ............................................ 332.3.1 Patterning the Channel Design onto a Silicon Wafer ................... .. ...... 332.3.2 Production of PDMS Microchannel Chips ................................................ 362.3.3 Permanent Bonding of PDMS Chips to Coverslip ...................... .......... 372.3.4 Setup of Macrofluidic System ......................... ..................................................... 382.3.5 Im aging Setup ........................................ ........... .......... ...................................402.3.6 N eutrophil D eform ation Assay................................................................................................ 412.3.7 Multiple Particle Tracking Microrheology Analysis of Neutrophils..................422.3.8 Statistical Analysis of Data..............................................44
3.0 RESULTS .................................................................................................... 45
3.1 Effectiveness of Calcium Chelation ............................................................................................ 453.1.1 Fluorescent Imaging of Ca2 + Levels ....................................... 453.1.2 Quantitative Measurements of [Ca2+]i with Flow Cytometry ...................................... 46

3.2 Shear Modulus Measurements with Particle Tracking............................................................483.2.1 Measurements of Round Passive Neutrophils ........................ ............ 483.2.2 Measurements of Deformed Neutrophils .................................... 50
4.1 Neutrophil Deformability ................................................................................................................ 59
4.2 G' Response After Deformation ............................................................................................. 624.2.1 Potential Mechanisms for the Observed Response........................................................... 62
4.3 G" Response After Deformation ............................................................................................ 65
4.4 Deformation-induced Activation............................................................................................ 66
4.5 Summary and Recommendations for Future Development............................. ...... 68
APPENDIX..............................................................................................................80
A.1 IDL Commands for First Frame ............................................................................................ 80
A.2 IDL Commands for All Frames .............................................................................................. 81
A.3 IDL Codes ...............................................................................................................................83A .3.1 bpass ........................................ ...... ... ... ... ............. .......... ............... 83A.3.2 eclip ................................................. ................ ................ 85A .3.3 featu re ......................... ... .............................................. ... .. ............................ 86A.3.4 fover2d ................ ...... . ...... ....................................... 94A.3.5 jpretrackm od................................. ................................................... 97A .3.6 m onitor_m od ............................................ ............................. . ............................. 99A .3.7 part find_m odl............... ........ ............................. ........................... ................... .. 100A.3.8 part_ in put................... ... .......... ............ ...... .... .... .............. ..... ............ ......... 102A.3.9 plothist.... ................... ..... ............... ............... 102A .3.10 plot tr ......................... ................................... .. ............................. 105A.3.11 read_ gdf ................... ... ...................... ............... .................................. 109A.3.12 read nih..... .................. ........ ... ............................. ............................. IIIA.3.13 region_time_blocks_front ................ ................... ...................... ....... 112A.3.14 writegdf .............................. .... ..... ..... ..... ....... ............ .......... 114A.3.15 write_textmod .......................................... ................................... 115
A.4 Matlab m-files............................................................................................................... 116A.4.1 Shear modulus calculation at 30 Hz ........................................ 116
A.5 Pseudopod Projection Times in 6 iun-wide Channel ............................................................... 118
A.6 Individual Cell Data ................................................... 119
A.7 Flow Cytometry Histograms ........................................ 121

ACKNOWLEDGMENTS
The completion of this thesis would not have been possible without the help of the
numerous people that have supported me along the way.
First, I would like to thank Prof. Roger Kamm. As my thesis supervisor, he has
given me invaluable feedback on my work, helping me to more fully understand the
fundamental principles behind the project. The door to his office is almost always open, as
he is readily available to answer any questions that his students might have for him. This
constant guidance, coupled with his kindness and patience, has made this past year of
graduate school an immensely enriching experience.
Many others in Prof. Kamm's laboratory have assisted me greatly during the course
of this work. TaeYoon Kim and Hyungsuk Lee assisted me with my calculations of the
shear moduli. Alisha Siemienski was always ready to answer various questions I had about
experimental procedures and theory. Sid Chung was incredibly helpful throughout the
course of my research; he assisted me with the design of my silicon wafers, the patterning of
my microchannels onto them, and the plasma treatment for bonding my PDMS chip. He
also shared his vast knowledge of microfluidics and microfluidic fabrication. Vernella
Vickerman offered useful advice and collaborated with me on a neutrophil transmigration
experiment that is not presented in this thesis. Nur Aida Abdul Rahim, Peter Mack, Terry
Gaige, and Nathan Hammond also offered helpful advice throughout the duration of my
research. Furthermore, the rest of the Kamm Lab (a.k.a. the "Kammsters") provided a
friendly and cooperative research environment that made my research experience enjoyable
as well as education.
Also, members of collaborating laboratories were extremely helpful to this work. Dr.
Richard Lee and Hayden Huang kindly assisted with the isolation of neutrophils, and

allowed me to use the equipment in Dr. Lee's laboratory. Jan Lammerding (Lee Lab)
offered his help with the flow cytometry experiments. Dr. F. William Luscinskas, Richard
Froio, and Gail Newton donated HL-60 cells and their excess neutrophils for use in my
experiments. Jorge Ferrer (Lang Lab) taught me how to use the microscope and readily
answered questions I had about imaging. Yu Yao (Dewey Lab) provided me with agents I
needed for my experiments. Judith Su (So Lab) loaned the objective heater used to provide
physiological temperatures in my experiments, and also donated the microbeads used to
calibrate pressures in my setup.
Lastly, I would like to thank my parents, Paul and Nellie Hsu, my brother and sister,
Kenneth and Melisa Hsu, and my friends for their compassionate support during this past
year. Their encouragement and continuous prayers were invaluable to the completion of this
work.

1.0 INTRODUCTION
1.1 Background
Neutrophils, also known as polymorphonuclear leukocytes (PMiN), play a vital role in
the primary human immune response to tissue injury and infection. Produced in the bone
marrow, only a very small percentage (-/3%) of the total number of neutrophils in the body
is present in the circulation; the majority remains sequestered in the bone marrow, likely for
storage purposes. Nevertheless, neutrophils make up most of the white blood cell
population in the blood (approximately 50-70%). Once released from the bone marrow,
PMNNs travel through the circulation for 7-10 hours. At this point, neutrophils may become
activated, initiating their migration into adjacent tissue, where the average neutrophil lifespan
is no more than a few days. [1] In addition, neutrophils are terminally differentiated,
enabling them to devote their resources to their immune responsibilities instead of cell
division.
1.1.1 Neutrophil Morphology
Along with eosinophils and basophils, neutrophils belong to the granulocytic family
of cells. As their name implies, granulocytic cells have a granulated cytoplasm, containing
granules that aid in the digestion and elimination of bacteria during the immune response.
Neutrophil granules typically range in size from 0.1-0.8 .tm in diameter, [2, 3] and are
classified as either azurophil or specific granules. Azurophilic granules are the larger and
denser of the two, and contain enzymes (such as peroxidase and lysozyme) that assist in
killing phagocytosed microorganisms. The smaller, rod-shaped specific granules contain the
enzymes collagenase and lysozyme, as well as the bacteriocidal agent lactoferrin. [1]

Additionally, characteristic of neutrophils are their multilobed, segmented nuclei, as seen in
Figure 1.1 below. The segments are connected by thin strands of chromatin, and the
resulting morphology serves an important purpose in the cell's physiologic actions. To
migrate to sites of infection, neutrophils must squeeze through endothelial cells that line the
circulatory vessel wall. With their segmented nuclei, neutrophils are able to more easily
accomplish this process of transmigration, contributing to their being among the first of the
immune cells to arrive at sites of inflammation.
~QbL Jra!kFigure 1.1: Neutrophil image.
This neutrophil was stained with a Wright Giemsa stain, giving the segmented, multilobed nucleus a purple tint.(Adapted from [41. )
Another morphological feature of neutrophils that renders them amenable to the
deformations they experience is the folding of their membranes. The cell, its nucleus, and its
numerous granules exhibit membranous folds; scanning electron microscopy reveals the
numerous folds that exist on the cell membrane (Figure 1.2). As the neutrophil squeezes
between or through endothelial cells or through a narrow capillary, these folds provide the
additional surface area needed by the neutrophil and its constituents as they deform.
Nonetheless, the membrane surface area remains constant, setting an upper bound for both
deformation and swelling. [51 Furthermore, the outer membranous folds (microvilli) have

been suggested to enable the neutrophils to physically interact with endothelial cells through
the --0.5 gtm glvcocalvyx layer that coats the apical surface of the endothelium. [6, 7]
Figure 1.2: Scanning electron microscopy (SEIM) of neutrophil.In this SEM image, the folded membrane of the neutrophil can be seen as the cell migrates through the bone
marrow endothelium. [81
1.1.2 Cytoskeletal Structure
Like most cells, the neutrophil cytoskeletal network primarily consists of actin (at an
estimated concentration of 200 ýIM, [9] along with much lower concentrations of
intermediate filaments and microtubules. [10] In the resting state, approximately 60-700 o of
the actin in neutrophils exist in the monomeric, globular form (G-actin), [11] and the cell
takes on a roughly spherical shape, with an average diameter of 6.8 Am. [12] Upon
neutrophil activation by chemoattractants like formyl-methionyl-leucyl-phenylalanine
(FLMLP), the actin cytoskeleton undergoes dramatic changes; in a dynamic process involving
both actin depolymerization and polymerization, net G-actin content decreases by 26.5%0 ,
while the net amount of polymerized, filamentous actin (F-actin) experiences a two-fold
increase. [131 Accompanying these changes are changes in cell shape and a redistribution of
F-actin, particularly into the pseudopods at the leading edge of the neutrophil. [14]

1.1.3 Neutrophils in the Inflammatory Process
As one of the immune system's first responders to infection, neutrophils migrate to
sites of inflammation within thirty minutes of injury onset. Much of this highly complex
process remains to be elucidated, yet research in the past two decades has given tremendous
insight into the mechanisms by which neutrophils reach the inflammation site.
Emigration of neutrophils into tissue is a multi-stage process (see Figure 1.3) that
primarily occurs in the postcapillary venules. Upon entering this region of the vasculature,
neutrophils are pushed towards the vessel wall by flowing red blood cells (RBC), which exist
at a much higher concentration in the blood than that of neutrophils. Near the wall,
neutrophils are able to engage in a process known as "neutrophil rolling," in which they
weakly adhere to endothelial cells through interactions between selectin membrane proteins
on both cells (L-selectin on neutrophils; P- and E-selectin on endothelial cells). Forces
imposed on the neutrophil by the flowing blood push it forward along the endothelial wall as
it "patrols" for a nearby infection. In inflamed tissues, bacterial byproducts cause the
upregulation of P- and E-selectin on nearby endothelial cells, resulting in increased rolling.
[15]
Yet increased neutrophil rolling alone is insufficient for transmigration; for
neutrophils to migrate into the tissue space, integrins on the neutrophil surface must first be
activated to allow for firm adhesion to the endothelial wall. Two f 2-integrins in particular -
CDlla/CD18 (also referred to as LFA-1, or a,,_) and CD1 lb/CD18 (Mac-1, or af,_) -
have been implicated in this process. [16-18] In the normal state, these integrins exist in an
inactive conformation, unable to strongly bind to constitutively expressed surface proteins
on the endothelium, such as ICAM-1, and thus preventing non-specific binding. Near the
site of infection, however, endothelial cells are stimulated to express chemokines (such as

PAF [191 and IL.,-8 [201) on their apical surface, which, upon contact with a rolling
neutrophil, will transduce a signal that subsequently results in a conformational change in
certain integrins. For instance, work by Shamri et al. has shown that immobilized
chemokines on the apical surface of endothelial cells can trigger a conformational change in
LFA- 1, from a bent (inactive) state to an extended (partially activated) one. [21) For
activation of LFA-1 to be completed, it has to immediately bind to ICAM-1 after extension.
This, along with association of the integrin to the focal adhesion protein talin, results in firm
adhesion and cell arrest on the endothelium.
Bas-e
Tramiuilian
Figure 1.3: Endothelial cell - neutrophil interaction cascade in the inflammation process.(A) After release from the bone marrow, neutrophils travel through the arteriole circulation remaining relativelynon-adherent to the vessel wall. (B) Once the neutrophils enter the post-capillary venules, they travel along theendothelial wall in a selectin-mediated process termed "neutrophil rolling." Approximately 100 Jlm from a site
of infection, upregulation of E-selectin on endothelial cells is induced by cytokines from the infection site,resulting in increased rolling. (C) Once the neutrophil reaches the vessel region closest to the site of infection,chemokines on the endothelial surface induce conformational changes in integrins on the neutrophil, activatingthem to bind to [CAM-I on endothelial cells and firmly adhere to the surface. (D) After the neutrophil arrests
on the endothelium, a chemotactic gradient is required for transmigration to occur. If such a gradient ispresent, the neutrophil will migrate through the cell laver and up the gradient towards the inflammation site.
[181

Given the right conditions (flow-imposed shear stress [22], chemotactic gradient
[23]), the arrested neutrophil will migrate through the endothelial layer, as well as through
the layer of pericytes that surround the blood vessel, in a complex and coordinated process
called diapedesis. [24]1 Remarkably but not surprisingly, the emigration process is quite
selective; endothelial cells ensure that only the appropriate cells are getting through the
vessel wall, thereby preventing a deluge of irrelevant substances from hampering the
immune response at the inflammation site. This selectivity is a result of interactions between
several proteins on the neutrophil and on endothelial cell membranes, which serve to form
tight seals around the migrating neutrophil. Over the past few years, the signaling pathways
and relevant proteins of transendothelial migration have been elucidated (see Figure 1.4 for a
schematic of these pathways). CD99 and PECAM-1 (or CD31) have been shown to form
homophilic interactions during the transmigration process. [25, 26] Ostermann et al
discovered that junctional adhesion molecule 1 (JAM1) at endothelial cell junctions is a
ligand for LFA-1 on leukocytes, [27] and Ma et al have used real-time imaging to suggest that
JANM1 plays a key role in forming a seal around the migrating neutrophil. [28] Additionally,
the same method of real-time imaging has allowed for the visualization of VE-cadherin
dynamics during transmigration; situated at endothelial cell junctions, it acts as a gatekeeper
and encircles neutrophils as they migrate through. [29]
Interestingly, neutrophils have been observed to migrate not only at cell-cell
junctions (known as paracellular transmigration), but also through the body of an endothelial
cell (transcellular transmigration). The latter had only been observed in vivo [30] until
recently [31], and further suggests the active role that endothelial cells play in the migration
process. One of the earlier studies of cellular events during transmigration found that the
neutrophil adhesion and transmigration process coincide with increased levels of intracellular
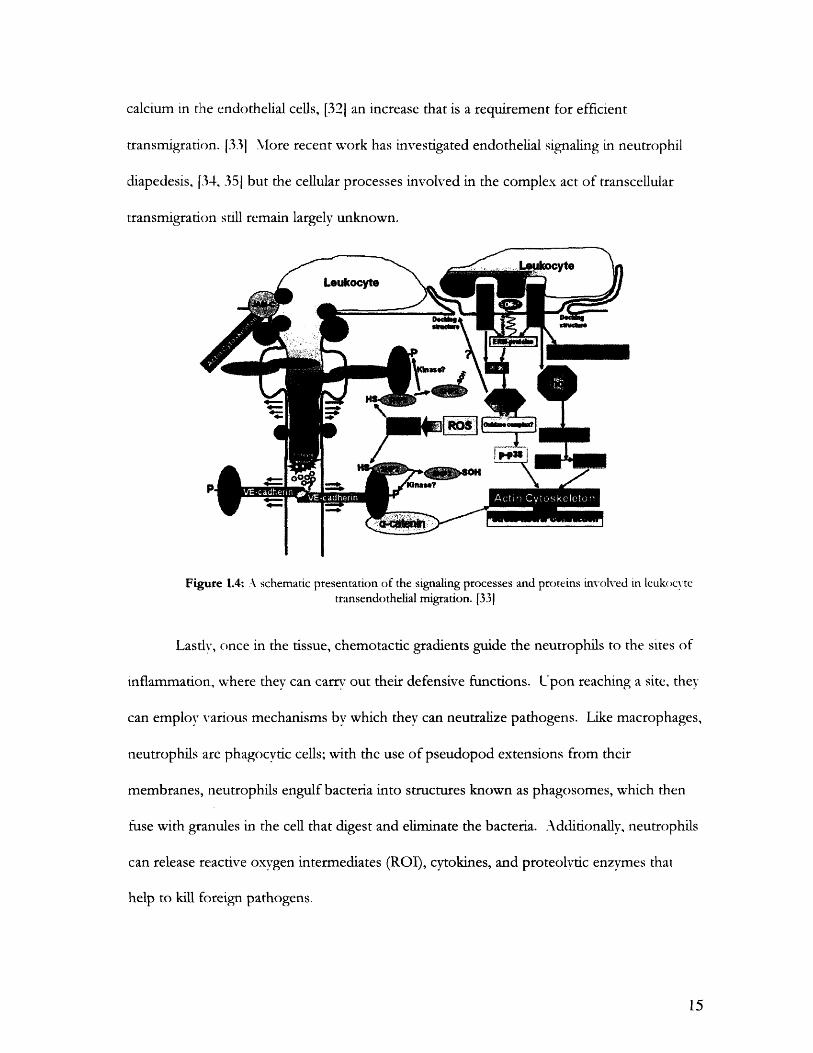
calcium in the endothelial cells, [321 an increase that is a requirement for efficient
transmigration. [33] More recent work has investigated endothelial signaling in neutrophil
diapedesis, [34, 351 but the cellular processes involved in the complex act of transcellular
transmigration still remain largely unknown.
I IFigure 1.4: A schematic presentation of the signaling processes and proteins involved in leuk(ocvte
transendothelial migration. [33)
Lastly, once in the tissue, chemotactic gradients guide the neutrophils to the sites of
inflammation, where they can carry out their defensive functions. Upon reaching a site, they
can employ various mechanisms by which they can neutralize pathogens. Like macrophages,
neutrophils are phagocytic cells; with the use of pseudopod extensions from their
membranes, neutrophils engulf bacteria into structures known as phagosomes, which then
fuse with granules in the cell that digest and eliminate the bacteria. Additionally, neutrophils
can release reactive oxygen intermediates (ROI), cytokines, and proteolvtic enzymes that
help to kill foreign pathogens.

1.2 Studying the Mechanical Behavior of Neutrophils
The study of neutrophils offers the advantage of investigating the properties of
cell that normally exists in isolation. Studies of adherent cells, such as fibroblasts and
endothelial cells, are often complicated by the need to understand the numerous and
dynamic interactions between the cell and the matrix to which it is adhered. Neutrophils,
on the other hand, flow through the circulatory system unbound to a matrix, and while the
migration process results in neutrophil interaction with cells and matrices in the tissue,
studying the neutrophil in isolation still allows for relevant insight into the physiological
properties of the cell, at least during the time leading up to endothelial adhesion. Several
experimental methods have been used to uncover the mechanical properties of
neutrophils.
1.2.1 Micropipette Aspiration
A classical experiment used to study the mechanical behavior of the passive
neutrophil is micropipette aspiration, in which a micropipette is placed in close proximity
to a resting neutrophil (see Figure 1.5). A negative pressure drop is imposed inside the
micropipette, such that the neutrophil is trapped at the mouth; decreasing the pressure
beyond this threshold pressure results in further deformation of the neutrophil into the
micropipette. After removing the imposed negative pressure, the neutrophil is released
from the pipette and eventually recovers its original spherical shape.

Figure 1.5: Micropipette aspiration of neutrophils.lA) Imposing a negative pressure in the pipette equal to the threshold pressure traps the neutrophils at thepipette tip. with a hemispherical portion of the cell inside the pipette. (B) Decreasing the pressure beyondthe threshold pressure results in further deformation into the pipette. (C) The neutrophils recovers to its
original spherical shape after being released from the pipette.(Pipette caliber: 3.4 um Figure modified from [361.)
Micropipette aspiration of neutrophils has helped to reveal elements of their
complex rheology. Upon entering the micropipette, the neutrophil undergoes an
instantaneous deformation, characteristic of an elastic material. After it is released from
the pipette, however, it exhibits a viscoelastic, time-dependent recovery of its original
shape. Early attempts to model this mechanical behavior considered the cell to be a
homogeneous standard viscoelastic solid. [37, 381 and while these models were able to
capture various characteristics, the neutrophil's non-homogeneous structure called for a
more complex description.
More recently, a compound drop model description of the neutrophil has become
prominent in the area of leukocyte modeling. [391 It consists of three layers: a thin
cortical shell (with persistent isotropic surface tension), a viscoelastic or viscous interior
(cytoplasm), and an inner core (nucleus). Unlike the models that had preceded it (such as
the Maxwell liquid model with constant cortical tension [40], and the power-law fluid
model [411), the compound drop model is able to capture the rapid initial recoil phase of
recovery without having to continuously change the material properties of the cell. This
model has thus been shown to be more representative of leukocyte mechanical behavior

than the prior, simpler models. Yet it still has its shortcomings: for one, the shape of the
neutrophil's segmented nucleus is not explicitly represented in the compound drop
model's core. Experiments performed to validate the compound drop model for
neutrophils made use of lymphocytes, which have a symmetrical, non-segmented
nucleus. Thus, while many features of the neutrophil behavior in the micropipette
aspiration experiment are explained in the compound drop model, there remains much
room for improvement in the modeling of these complex cells.
1.2.2 Optical Trapping
The development of the laser optically trap has proven to be a valuable advance in
our ability to make rheological measurements on cells. Optical trapping, often referred to as
"optical tweezers," has been used to apply controlled picoNewton level forces onto cells via
beads adhered to their surfaces. This method has been used, for example, to study the
deformability of erythrocytes, [42] and subsequently, the increased erythrocyte stiffness that
results from the onset of malaria. [43]
Using this technique, Yanai et al. measured the intracellular elasticity and viscosity of
migrating neutrophils. [44, 45] Trapping intracellular granules within different regions of the
cell (leading edge, body, and trailing edge), they applied both oscillatory and stepwise forces
onto the granules, and measured their subsequent amplitudes or displacements. Results
from the experiment showed significantly different stiffness values between the leading edge
(pseudopodal region) and the body/trailing edge of the locomoting neutrophil, with
respective stiffness values of - 5 Pa and -1 Pa (using a timescale of 100 ms). Longer
timescales of roughly 10 s produced lower stiffness values, in the range of 0.04 - 0.7 Pa
according to their method.

1.2.3 Particle-Tracking Microrheology
A major disadvantage of many mechanical measurement methods is their active
nature; experiments such as AFM and cell poking disturb the cell, making it difficult to
determine the properties of the cell in its passive state. One method that has been used to
make passive measurements of the mechanical properties of cells, particularly neutrophils,
[46] is particle-tracking microrheology. This technique, developed by Mason et al. [47, 48]
extrapolates the frequency-dependent complex shear modulus G*(O)) from the time-
dependent mean square displacement <Ar2> of particles within the cell. Assuming that the
internal composition of the cell is a viscoelastic material, particle-tracking microrheology
allows for a passive measurement of the storage (G'(w)) and loss (G"(co)) moduli of cells.
Neutrophils are particularly amenable to particle-tracking measurements of their
mechanical properties because of the granules found in their cytoplasm. The motions of
these granules, which are approximately spherical in shape and nearly constant in diameter,
can be tracked, their time-dependent mean square displacement measured, and the cell's
complex shear modulus extracted. In this study, multiple particle-tracking microrheology is
used to determine the effects of mechanical deformation on the neutrophil's mechanical
properties.
1.3 Neutrophil Response to Stimuli
1.3.1 Activation by Biochemical Agents
When exposed to biochemical agents involved in the inflammatory process, such as
cytokines (tumor necrosis factor-a, or TNF-a), chemokines (interleukin-8, or IL-8), and
FNLLP, neutrophils are activated to migrate. Subsequently, the cells begin to form

pseudopods along their periphery and attain an irregular shape, losing the spherical shape
characteristic of their passive state (see Figure 1.6)
Figure 1.6: Increase in F-actin content upon stimulation with FILP.Rat neutrophils isolated from the circulation were stained with rhodamine-phalloidin to visualize F-actin using
a confocal microscope. A: Non-stimulated cells were generally spherical, with some cells exhibiting pseudopodformation. F-actin content was found to be high in these newly formed pseudopods. B: After stimulation with
FMLP, neutrophils attained a distorted, irregular shape. P actin content in the center of the cell was seen todecrease, while high F actin content was seen in the pseudopod regions.
Scale bar: 2 kIm (Adapted from [491)
Studying the characteristics of activated neutrophils is a difficult task: upon
stimulation, neutrophils can behave in a variety of ways. Nevertheless, some general
properties of activated cells have been uncovered. After stimulation with FIMLP, neutrophils
have been shown to be markedly stiffer and more likely to be retained in the pulmonary
vasculature. [50) This stiffening can likely be explained by an increase in F-actin
polymerization that is observed in human neutrophils within 10 s of being exposed to
FMLP. [51] Similarly, rat neutrophils respond to FMLP challenging with an increase in F-
actin formation, as well as increased sequestration within the pulmonary capillaries
(neutropenia). [491

1.3.2 Response to Mechanical Deformation
Neutrophils in the microcirculation must undergo some degree of mechanical
deformation in order to traverse through systems such as the muscle, renal, pulmonary
capillary microvasculature. While neutrophils have diameters which range from 6 - 8 tm,
pulmonary capillaries have been shown to have diameters that range from 2 - 15 ýtm. [12]
Thus, in traveling from the arteriole to venule sections of the circulation, neutrophils are
subjected to mechanical deformation through the capillary bed.
Physiological levels of mechanical deformation have been shown to stimulate
functional changes in neutrophils. [52] After being deformed through 3- and 5 p.m pore
filters, the cells exhibited a transient increase in their cytosolic free calcium concentration
that peaked 30 seconds after deformation. Also, the neutrophils that underwent a larger
degree of deformation (through the 3 jpm filter) expressed higher levels of the
CD1 lb/CD18 adhesion protein. Further research found that deformation also increases
neutrophil adhesiveness to ICAM- 1, an adhesion molecule found on endothelial cells, due to
the upregulation of CD1 b/CD18. [531 The combined results of these studies hints at a
possible role for the mechanical deformation experienced by neutrophils in small capillaries;
the increased adhesiveness to the vessel wall stimulated by deformation could explain why
neutrophils tend to transmigrate primarily in the postcapillary venules.
Additionally, recent work has revealed that neutrophils exhibit interesting
biomechanical and cellular responses to mechanical deformation. [46, 54] First, deformation
causes a significant drop in both the shear and loss moduli of the cell; within approximately
10 sec after deformation, these properties are reduced by roughly half their initial values.
Within one minute, however, both the shear and loss moduli recover to nearly their initial
values. This change in the viscoelastic properties of the cell is possibly due to a

deformation-induced disruption of the cytoskeleton, but it remains unclear whether these
cytoskeletal events involve the rupture of binding proteins between actin filaments or the
depolymerization of the actin filaments. Secondly, above a threshold deformation rate,
neutrophil activation was observed, with newly-formed, granule-free pseudopods seen
projecting from the deformed neutrophil. This activation is dependent on the deformation
rate, exhibiting an inverse relationship. These two responses are thought to be independent
of each other, but the pathways involved have not yet been discovered.
Furthermore, the same work revealed the dynamic effects that mechanical
deformation has on the neutrophil cytoskeleton, namely F-actin. After being deformed
through a 3 Lm pore filter, neutrophils exhibited an initial drop in F-actin content to
approximately 80% of its initial value. Within 1 minute, however, this value recovers to
nearly its initial level (95%). This drop-and-recovery response of F-actin content resembles
that of the neutrophil moduli values described above, suggesting an important role for
cytoskeletal rearrangement in the mechanical properties of the cell.
1.3.3 Analogous Responses in Other Cell Types
Interestingly, similar responses to deformation have been observed in another cell
type: human fibroblasts. Work by Pender and McCulloch has shown that human gingival
fibroblasts exhibit dynamic changes in F-actin content in response to substrate stretching.
[55] Quantifying the F-actin content with FITC-phalloidin, they found that 10 s after
stretching, F-actin content was reduced by 50%. Additionally, F-actin increased to
approximately 150% of its initial value 50 s after stretching, and recovers its initial value
at approximately 80 s. The addition of EGTA (chelator of extracellular Ca 2+) and
pertussis toxin (inhibitor of GTP-binding proteins) in separate experiment altered the

normal actin response, suggesting roles for both calcium influx and GTP-binding proteins
in fibroblast mechanotransduction.
Although the experiments with fibroblasts measured F-actin content rather than
shear and loss modulus values, the initial drop and subsequent recovery resemble the
trend seen in the neutrophil response to deformation. As actin is a significant component
of the cytoskeleton, which in effect gives the cell its mechanical characteristics, a
comparison between F-actin content and modulus values is conceivable and is commonly
suggested in the literature. [561 Calcium and GTP-binding proteins have been implicated
in the cytoskeletal response of fibroblasts, yet similar experiments have not been
performed on neutrophils undergoing mechanical deformation.
1.3.4 Calcium Activity in Neutrophil Activation
Cytosolic calcium is an important second messenger in numerous signaling pathways
within cells, [57] where the endoplasmic reticulum holds stores of Ca'- ions for quick
release into the cytoplasm upon receiving appropriate cues. Extracellular calcium can also
enter the cell through ligand-gated or stretch-activated ion channels, such as those found in
endothelial cells. [581 Although it is clearly an important part of proper cell function, the
role of Ca -' in the cytosol of unstimulated and stimulated neutrophils is not completely
understood.
Previous work by others has examined the dynamics of neutrophil Ca> levels upon
stimulation with chemoattractants, particularly FMLP. Exposure to FMLP has been shown
to induce a dramatic but transient increase in [Ca2-]i, which recovers to resting values within
minutes. [59, 60] This rise in cytosolic Ca> levels was previously thought to initiate the
signal for the concomitant occurrences of increased actin polymerization and activation

upon FNLLP stimulation. Yet other work, which buffered and/or depleted intracellular Ca2 ,
found that actin polymerization and cell activation (as indicated by chemotaxis, exocytosis,
or superoxide generation) were independent of a rise in [Ca 2 1. [59, 61, 621
In addition to chemical stimulants, mechanical deformation of neutrophils has also
produced transient rises in [Ca2-]. As mentioned earlier, Kitagawa et al. showed that
deformation through micrometer-sized pores produced an increase in [Ca2-] that peaked 30
seconds after deformation. [521 This increase was not as sharp as that seen after FNLP
stimulation, but significant nonetheless. Also, Laffafian and Hallett "poked" neutrophils
with a blunt micropipette, inducing a small-scale membrane deformation. [62] Within
seconds after mechanically perturbing the cell membrane, they noticed a local increase in
Ca 2- levels.
The response of intracellular Ca2- to both chemical and mechanical stimuli suggests
that it plays an important role in the neutrophil's response. Exactly what this role is,
however, remains unclear.
1.4 Soft Lithography Microfabrication for Biological Studies
Over the past several years, the use of soft lithography microfabrication in the
fields of biology and medicine has burgeoned. [63, 64] The process of microfabrication
takes advantage of technology that has been used in the manufacturing of semiconductors
for over 30 years to produce systems on the micrometer size scale. Among the many
advantages of the microfabrication method is its ability to accurately reproduce small
geometries, allowing researchers greater control over their experiments.
Soft lithography microfabrication couples this size control with a remarkable
flexibility to design biological systems. From "lab-on-a-chip" biosensors to cell

manipulation devices, numerous possibilities for experiments have arisen due to the
advent of this fabrication method. Unlike the photolithographic methods primarily used
to produce microfabricated products, soft lithography microfabrication (after its initial
step) does not require elaborate laboratory facilities or equipment and is thus relatively
inexpensive and efficient. The process begins with the patterning of a positive relief of
the design onto a silicon wafer using the methods of photolithography, which allows for
geometric resolution of approximately 1 ýpm. Once the pattern is made, an elastomer is
poured onto the wafer and cured, producing an elastomeric mold or a stamp that can be
used to pattern chemicals onto various surfaces.
The elastomer most commonly used in biological experiments is
polydimethylsiloxane (PDMS); as an optically transparent (wavelengths between 230-
700 nm), nontoxic, and gas-permeable elastomer, it is highly compatible with imaging of
biological samples without undesired surface interactions. Compared to the etching
processes of microfabrication, the replica molding of PDMS is fast and simple. PDMS
also bonds well and easily to surfaces such as glass and other PDMS layers, providing
tight seals that prevent leakage of fluid.
One application of soft lithography microfabrication has been the study of the
forces exerted by endothelial cells. Tan et al. produced a pattern of microneedle-like
elastomeric posts, onto which they seeded endothelial cells. [65] Once the cells had
adhered to the top surfaces of the posts and spread, the forces exerted by the cells at
different regions of the cell body were extrapolated from the deflection of each post.
With this assay, the subcellular distribution of forces throughout the cell could be
determined.

Additionally, a common application for soft lithography microfabrication is in the
production of microfluidic channels and networks. [661 The micrometer-sized patterns
that soft lithography is capable of producing render the method amenable to the creation
of microchannel systems, which offer many experimental advantages: small sample
volumes, use of fewer cells, potential for high-throughput parallel designs, and shorter
reaction times. Using this technology, groups have developed microfluidic flow
cytometers, immunoassay systems, capillary electrophoresis devices, and combinatorial
screening devices, among others.
In this study, a microfluidic channel produced by soft lithography
microfabrication is used to study the rheological response of single neutrophils to
mechanical deformation. Unlike the commonly used method of micropipette aspiration,
which can have marked variability due to various micropipette dimensions, the accuracy
of replica molding provides us with a repeatable test that can be performed on multiple
single cells.
1.5 Physiological Significance of the Present Study
After their release from the bone marrow, circulating neutrophils first encounter
the pulmonary microvasculature, a complex network of 50-100 capillary segments that
circulating cells must deform through to travel from the arterial to the venous side of the
pulmonary circulation. [67] While erythrocytes readily deform through these narrow
vessels (with diameters as small as 2 gm), neutrophils have a relatively low
deformability; as a result, the pulmonary microvasculature contains a high concentration
of neutrophils, with 75% of all intravascular neutrophils residing in this system. [681
This margination of cells in this region occurs in the normal physiological state, and as
the lungs are constantly exposed to foreign pathogens inhaled during normal breathing, it
makes sense to have a high concentration of immune cells readily available to combat
such bacteria.
Yet the sequestration of neutrophils in the pulmonary system can pose a serious,
life-threatening problem in the pathological state. For instance, patients with acute
myeloid leukemia have been shown to have leukocytes with decreased deformability.
[69] A condition known as leukostasis results, in which leukocytes aggregate in the
vasculature at supraphysiological levels. Leukostasis can have tragic consequences:
respiratory failure (such as in acute respiratory distress syndrome, or ARDS), intracranial
hemorrhage, myocardial infarction, metabolic abnormalities, etc. The excessive
margination and activation of these immune cells can cause them to carry out their
defensive functions against the body's own tissues, which results in the recruitment of
more white cells in a positive feedback loop manner. Overall, however, leukostasis
remains poorly understood, and further research is needed to elucidate its mechanisms.
1.5.1 Objective
The results of previous studies have suggested that neutrophils do not merely
passively deform through narrow capillaries; rather, active intracellular responses to
deformation appear to occur, possibly facilitating neutrophil transit. For instance,
Kitagawa et al. revealed that upregulation of adhesion receptors, as well as transient rises
in [Ca 2 li, were part of the deformation response. [52] Yap and Kamm have shown that
physiologic mechanical deformation can produce dynamic rheological changes in

neutrophils, consisting of initial drops in stiffness and viscosity that subsequently recover
towards their pre-deformation values. Concurrently, the F-actin content of neutrophils
decreased immediately following deformation, suggesting the occurrence of actin
depolymerization events. Additionally, they found that the same mechanical stimulus
can induce neutrophil activation. [46, 54, 70]
Considering these observations, neutrophils presumably respond to deformation
in an active manner that assists them in repeatedly negotiating the small diameters of
microvascular networks. Impairment of such processes may result in decreased cell
deformability, leading to excessive sequestration of neutrophils in these microcirculatory
systems. Among the many implications of this pathological margination of neutrophils
are destructive inflammation, produced by the overabundance of activated cells, and
tissue ischemia, resulting from the obstruction of capillary blood flow by rigid
leukocytes. The key first step to preventing such conditions is understanding the cellular
events that occur in response to deformation. Yet, the signaling interactions involved in
this response are currently unclear.
This study aims to further the current understanding of the deformation response
by determining whether a connection exists between the findings of Kitagawa et al. and
Yap and Kamm. More specifically, it investigates the role of intracellular Ca ' + in the
shear modulus and activation responses to deformation. With extensive evidence of
calcium's ability to modulate the cytoskeleton, [71, 721 we hypothesize that the reported
increase in [Ca 2 ]i is a critical element of the observed biomechanical response of the
neutrophil. Hopefully this work will provide insight that will help augment the
treatments currently available for pathological inflammation and its related conditions.

2.0 MATERIALS AND METHODS
2.1 Neutrophil Isolation
In accordance with a protocol approved by the Brigham and Women's Hospital
(BWH) Institutional Review Board (IRB) and the MIT Committee on the Use of Humans as
Experimental Subjects (COUHES), approximately 30 mlr of human venous blood was
drawn from healthy volunteers at the BWH. The blood draw procedure involved
venipuncture into syringes containing 3 ml. of 0.1 NI of sodium citrate, which served as an
anticoagulant. After diluting the blood with 20 mL Hank's Balanced Salt Solution (HBSS),
the diluted blood was split and carefully layered onto 10 mL of Ficoll-Paque PLUS
(Amersham Biosciences, Uppsala, Sweden). Both tubes were placed in a centrifuge and spun
at 1400-1500 rpm at room temperature for 30 min. This spin step separated the erythrocytes
and neutrophils (pellet) from the monocytes and blood plasma, as shown in Figure 2.1
below.
I I I I
Diluted whole blood - centrifugation- Plasma
-Mononuclear cellsI *-I- Hi~tnnnmuoe-1077
III A i H tr-p . ..
- RBCandneurophil pellet
Figure 2.1: Schematic of separation laver contents after first step of neutrophil isolation.Figure taken from [541 with permission.
After spinning, approximately 10 ml, of plasma was saved for later use, and the
remaining supernatant (plasma, mononuclear cells, and Histopaque layer) were aspirated,
Histopaque -1077 -
and the RBC/neutrophil pellet was resuspended in -7 mL HBSS (without Ca 2- and Mg-)
and - 15 mL 2%'0 Dextran (Pharmacia Corp., Peapack, NJ) to create a 1:1 dextran solution.
The tubes were left to sit at room temperature for 30 min, during which the RBCs
sedimented at the bottom of the tubes. The neutrophil-rich supernatant was collected,
diluted in HBSS, and spun down at 1400-1500 rpm for 5 min at room temperature. After
aspirating the supernatant, the remaining pellet was exposed to 3 mL of cold water for 30
sec, to induce lysis of the remaining RBCs. Approximately 45 mL HBSS was quickly added
after the 30 sec period to prevent the neutrophils from being lysed as well. The solution was
then spun down again, resuspended in 10 mL of HBSS, and counted with a
haemotocytometer. The cell suspensions contained > 950/o neutrophils, and cells were used
within 5 hours after the isolation was completed.
2.2 Calcium Chelation
To chelate intracellular calcium in neutrophils, the acetoxymethyl ester derivative of
1,2-bis(o-aminophenoxy)ethane-•N,N, ',N '-tetraacetic acid, or BAPTA-AM, (Invitrogen,
Inc., Carlsbad, CA) was added to neutrophils at a concentration of 3.5 ýtM In its original
form, this calcium-chelating agent is non-active, uncharged, and can readily permeate the cell
membrane. Once inside the cell, non-specific esterases within the cell cleave the lipophilic
blocking groups, rendering the agent active and less likely to exit the cell.
Loading the chelating agent first required dissolving it in DMSO, followed by
addition to the cell solution. The amount of DMSO present in the final loading solution was
0.035%. Neutrophils were incubated in the chelator loading solution for 20-30 minutes at
37 0C, and then added to the macrofluidic setup for analysis. To differentiate the effects of

BAPTA-AM and its loading vehicle, DMSO, a control group of cells were exposed to a
concentration of DMSO equivalent to that used to load BAPTA into the cells.
Extracellular calcium was also chelated for part of this experiment. The neutrophil
isolation process involves the addition of citrate to freshly drawn blood. As an
anticoagulant, citrate chelates calcium. To further ensure that extracellular calcium was not
present in this portion of the study, ethylenediaminetetraacetic acid (Sigma-Aldrich, Co., St.
Louis, MO), or EDTA, was added to the plasma saved from the isolation procedure, at a
concentration of 2 mM. EDTA was added to the autologous plasma instead of directly to
the cell solution because of its effect of lowering pH. Since the isolated neutrophils are
washed several times in Ca>-free HBSS, it was assumed that the cell solution was already
Ca>-free, and the only source of extracellular Ca> would be from the plasma. By adding
EDTA solely to the plasma, the pH effects were minimized. Additionally, cells were
suspended in a saline solution that lacked both calcium and magnesium.
2.2.1 Assessing the Effectiveness of Calcium Chelation Qualitatively
To determine if BAPTA-AM was in fact chelating intracellular Ca 2- , Fluo-3-AM
(Invitrogen Corp., Carlsbad, CA) was loaded into both untreated and BAPTA-treated
neutrophils (2mnM, 30 min at 370 C). Inside cells, Fluo-3 does not fluoresce until it binds to
Ca , after which it fluoresces maximally at -525nm. Untreated and BAPTA-treated cells,
both loaded with Fluo-3, were visualized under a fluorescent microscope (Eclipse TE300,
40x, Melville, NY) to observe the effects of BAPTA treatment on Ca'-levels inside cells.
2.2.2 Quantifying the Calcium Levels in BAPTA-treated Neutrophils
Fluo-3 does not enter all cells equally; consequently, there are fluctuations in the
amount of fluorescence seen between cells, preventing quantification of Ca>- levels. To
circumvent this deficiency, another Ca2- dye, Fura Red (Fura Red AM, Invitrogen Corp.,
Carlsbad, CA) was co-loaded with fluo-3 (30 min at 370 C), at a concentration of 4mM. Fura
Red is typically used with Fluo-3 to quantify intracellular Ca> levels, [73, 74] and the ratio of
Fluo-3/Fura Red is taken to be the measure of [Ca"]•. Fura Red is spectrally different from
Fluo-3: upon excitation at 488nm, Fura Red emits maximally at -650nm when not bound to
Ca . Upon binding to Ca , Fura Red's fluorescence is reduced dramatically. Since both
dyes are assumed to be present at approximately equal levels inside each cell, the Fluo-3 /
Fura Red ratio should remain relatively consistent from cell to cell, and provides a high
sensitivity, low noise measure of [Ca2-]. [75]
Two groups of cells were co-loaded with Fluo-3 and Fura Red: untreated and
BAPTA-treated (3.5 tM). After incubating the cells in the appropriate loading solution, the
cells were subjected to flow cytometry analysis (Cytomics FC500, Beckman Coulter, Inc.,
Fullerton, CA). Untreated cells were analyzed for autofluorescence, serving as a negative
control. As a positive control, both sets of cells were stimulated with FNMLP (200nM)
immediately before flow cytometry analysis, as FNLLP has been shown to elicit an increase in
[Ca'2]i. [76] Fluorescence was measured within 30 seconds after FMLP addition.
Additionally, the stimulated cells were again analyzed several minutes after FMNLP addition,
to inspect the transience of the stimulated response. All analyses were performed at 230 C,
and 30,000 cells were examined during each experimental run.

2.3 Design and Microfabrication of Experimental System
2.3.1 Patterning the Channel Design onto a Silicon Wafer
The microfluidic system used in the experiment was designed to allow neutrophils to
experience deformations similar to those experienced in the pulmonary microcirculation. To
accomplish this, the basic design was comprised of two reservoirs connected by a
microchannel, which had dimensions similar to those of pulmonary capillaries. This design,
which was drawn in AutoCAD (Autodesk, Inc., San Rafael, CA), is shown below in Figure
2.2A.
Three different designs were created for the microchannel, and they can be seen in
Figure 2.2B below. The first was a straight channel with constant dimensions throughout its
length. The next two designs were meant to solve problems experienced with clustering of
cells near the channel entrance. One consisted of a graduated entrance for the cell into the
channel, with an initial entrance width that was approximately twice the size of the rest of
the channel. The other design was similar, except for an asymmetric positioning of the
graduated portion of the channel entrance.

Figure 2.2: Design of microfluidic device.(A) The design of one "chip" includes two elliptical reservoirs, which are 1mm x 3.5 mm in size,
connected by a microchannel of varying widths (3 - 7 trm), heights (2 - 3 pm), and channelentrance designs. The chip has dimensions of 15 mm x 10 mm. (B) The three channel entrance
designs include: (top) constant width, (middle) graduated entrance, and (bottom) asymmetricgraduated entrance. (Images courtesy of S. Chung.)
To allow for flexibility in the experiment, many different combinations of channel
width and channel type (straight, graduated, or asymmetric) were designed to be patterned
onto the silicon wafer, from which the devices would be made. In this study, however, only
the first channel design (straight) was used. Nevertheless, future experiments can make use
of the other designs. The wafer design can be seen in Figure 2.3 below.
The design was fabricated onto chromium masks (Phototronics, Inc., Brookfield,
CT) using a process known as two-level photolithography. [77, 781 The process begins with
the spin-coating of a thin layer of SU-8 2002 photoresist (Microchem Corp., Newton, MA)
onto a silicon wafer (Wafernet, Inc., San Jose, CA). The thickness of this first layer is
desired to be approximately 2-3 [im, or the desired height of the microchannel. The coated
wafer is then prebaked at 95 C for 2 minutes, and exposed to UV light for 11.5 seconds
through the first chromium mask (microchannel). To crosslink the SL-8 photoresist in the
areas exposed to LV light, the wafer is postbaked at 95 C for 2 minutes.
Figure 2.3: Design of pattern on silicon wafer.The design for a single wafer includes 36 chips, with 15 different designs of various combinations of channelwidth and entrance geometry. The boxes on the left and right sides of the design are for alignment purposes.
(Image courtesy of S. Chung.)
To pattern the reservoirs onto the wafer, the wafer was spin-coated with SU-8 2015
to a thickness of approximately 15 gim, and pre-baked at 95 C for 4 minutes. Using an
alignment grid found on both chromium masks, the second chromium mask (reservoirs) was
aligned over the patterned microchannels, and exposed to UV light for 20 seconds. The
wafer was then post-baked for 3 minutes at 95: C to cross-link the exposed regions.
Afterwards, SU-8 developer (Mlicrochem Corp., Newton, WLA) was added on top of the

wafer for 5 minutes to develop the channel features. Lastly, the heights of the
microchannels were measured with a Dektak 2 profilometer (Veeco Instruments, Woodbury,
NY). A picture of a finished wafer can be seen in Figure 2.4.
Figure 2.4: Microchannel-patterned silicon wafer.Left: Full image of a silicon wafer with 36 microchannel systems patterned onto it.
Right: Close-up image of microchannels, as well as labeling system for individual channel characteristics (lowerleft hand corner of each rectangle). (Images courtesy of S. Chung.)
2.3.2 Production of PDMS Microchannel Chips
To prevent adhesion of PDMS to the wafers during the curing process, all master
wafers were treated once with trimethylchlorosilane (Sigma-Aldrich, St. Louis, MNO), which
involves incubating the wafer in a Petri dish along with a few drops of trimethylchlorosilane.
PDMS was prepared by mixing a 1:10 (weight) solution of curing agent and PDMS
prepolymer (SYLGARD 184 Silicone Elastomer Kit, Dow Corning, Midland, Nil). After the
solution was degassed for approximately 20-30 minutes to remove trapped air bubbles, the
PDLMS was poured on top of the master wafer and cured at 80 'C for 2-3 hours. After the
PDMS had cured, it was carefully peeled from the master wafer, and the desired chips were
cut out. Images of the PDMS microfluidic channel and channel entrances can be found in

Figure 2.5. "Two holes were bored in each reservoir with a 16-gauge adaptor needle to
provide inlet: and outlet ports for tubing.
Figure 2.5: PDMS microfluidic system.Left: An image of the microchannel connecting the upstream and downstream reservoirs, fabricated withPDIMS. Right: A view of the channel entrance at higher magnification. (Images courtesy of S. Chung.)
2.3.3 Permanent Bonding of PDMS Chips to Coverslip
To complete the construction of the microfluidic system, the PDMS chips had to be
permanently bonded to a glass coverslip. First, the coverslip was coated in PRIME Coat
(Dow Corning, Midland, MI) to promote stronger adherence between the glass and PDMS.
The coverslip was then spin-coated at 6000 rpm with a thin laver of PDMS, and cured at
80 "C for 2-3 hours.
Using a plasma cleaner and sterilizer (Harrick Scientific Corporation, Ossining, NY),
the PDMS chip and the coated coverslip were subjected to plasma oxidation for 1 minute.
Immediately afterwards, the exposed surfaces were placed into contact, forming a permanent
bond between the two pieces. A schematic of the entire chip production process, from
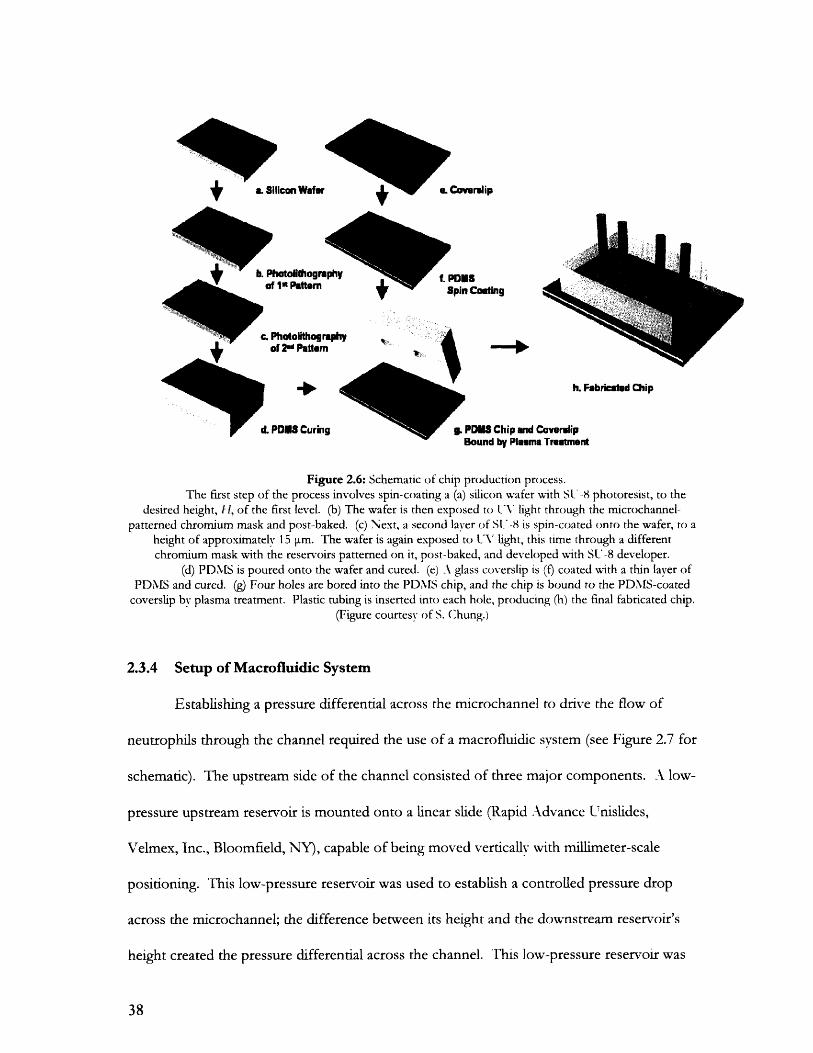
photolithography to plasma treatment, can be seen in Figure 2.6 below.
a. Silicon Wafer
in nnBin £anminn
-r·· --- · ·
h. Fi
PDMS Chip and Coverlipdul1au J b- Illa T0 IUUIsU
abricated Chip
Figure 2.6: Schematic of chip production process.The first step of the process involves spin-coating a (a) silicon wafer with S- 8 photoresist, to the
desired height, [1, of the first level. (b) The wafer is then exposed to LV light through the microchannel--patterned chromium mask and post-baked. (c) Next, a second layer of Sl -8 is spin-coated onto the wafer, to a
height of approximately 15 .m. The wafer is again exposed to UV light, this time through a differentchromium mask with the reservoirs patterned on it, post-baked, and developed with SU -8 developer.
(d) PDMS is poured onto the wafer and cured. (e) A glass coverslip is (f) coated with a thin laver ofPDMS and cured. (g) Four holes are bored into the PDMS chip, and the chip is bound to the PDMS-coated
coverslip by plasma treatment. Plastic tubing is inserted into each hole, producing (h) the final fabricated chip.(Figure courtesy of S. Chung.)
2.3.4 Setup of Macrofluidic System
Establishing a pressure differential across the microchannel to drive the flow of
neutrophils through the channel required the use of a macrofluidic system (see Figure 2.7 for
schematic). The upstream side of the channel consisted of three major components. A low-
pressure upstream reservoir is mounted onto a linear slide (Rapid Advance Unislides,
Velmex, Inc., Bloomfield, NY), capable of being moved vertically with millimeter-scale
positioning. This low-pressure reservoir was used to establish a controlled pressure drop
across the microchannel; the difference between its height and the downstream reservoir's
height created the pressure differential across the channel. This low-pressure reservoir was
wtolithogunlit Pattern
hatolithagraphyof ZEN raesm
PDMS Curing
Coveralip
....
OI Zn" Pil•lem
w
Boun y asma
reat t

connected via a three-way valve to the PDNIS chip, as well as a high-pressure upstream
reservoir, mounted approximately 50 cm above the microfluidic system. Additionally, a
syringe, used to purge air bubbles from the system as well as introduce neutrophils into the
channel, was also connected to the PDMS chip. The downstream end of the channel
consisted of two components: the downstream reservoir, which rested at a fixed height, and
a syringe. The syringe on the downstream end was used to clear trapped air bubbles from
this side of the microchannel. All components were connected to each other with plastic
tubing (I.D. 0.5 mm) and 23-gauge adapter needles. Furthermore, the reservoirs had
dimensions much larger than those of the microchannel (cm vs. rtm), allowing for the
assumption that the height of the fluid in each reservoir remained constant during the time-
course of the experiment.
amaze- ppram
m1scr-
IRSEM
Figure 2.7: Macrofluidic system setup.The schematic shows the reservoirs and syringes placed at the downstream (left side) and upstream
(right) sides of the microchannel.(Figure modified slightly from [54], with permission)
Or sial

2.3.5 Imaging Setup
To view the microchannel and entering neutrophils, the microfluidic system was
mounted onto the stage of a differential interference contrast (DIC) microscope (Eclipse
TE2000, Nikon, Inc., Melville, NY). The DIC microscope was equipped with an oil
immersion condenser lens (N.A. 1.4) and a 100x / 1.4 N.A. Plan Apochromat objective lens.
The objective was fitted with an objective heater (Bioptech, Inc., Butler, PA) that was set to
37(0C. Using a video camera (CCD-100, Dage-MTI, Inc., Michigan City, IN), live video was
recorded onto an SVHS cassette at 30 frames per second with a video cassette recorder
(SVO-9500MD, Sony Corporation, New York, NY). The videos were transferred to a
computer using a frame grabber card (Scion LG-3, Frederick, MD), and converted to digital
format using Scion Image (Version 4.0.2, Scion Corporation, Frederick, MD) and ImageJ
(Version 1.36b, National Institute of Health, Bethesda, MiD). A schematic of the imaging
setup can be seen below in Figure 2.8.
SVHS ecrderam• micar
I l-.-.-'"--"'-- " '.- I m .l
II"
MierIpeI Video cameraeyepuce
Figure 2.8: Imaging setup.With the microfluidic system mounted on the microscope stage, the resulting image was split between the
microscope eye-piece and the video camera. Live video was recorded onto an SVHS cassette, and subsequentlytransferred to a computer. (Figure from [54J, with permission.)
IP e t
Kip PC eqojqped with

2.3.6 Neutrophil Deformation Assay
Before each experiment, a 1% solution of Pluronic F108 (PEO2,,/PPO,5/PPO,,1
triblock copolymers, BASF Corp., Mount Olive, NJ) in Ca'2/Mg>2 -free HBSS was injected
into the microfluidic system, and incubated for 2 hours. Coating of the PDMS surfaces with
this compound served to reduce adhesion between PDMS and the proteins on the
neutrophil surface. After the incubation period, the microfluidic system was flushed with
medium (Ca>-/Mg>2-free HBSS + 2%0 autologous plasma obtained from the neutrophil
isolation process) for 15 minutes.
With medium in each of the three reservoirs, air bubbles were removed from the
microfluidic and macrofluidic systems with the use of the syringe ports. Medium was drawn
through the upstream and downstream sides of the microchannel with the syringes, using
negative pressure to prevent high pressure from being applied to the microfluidic reservoirs.
To adjust the reservoirs for zero flow (and zero pressure drop) conditions through
the microchannel, 0.5 ptm yellow-green fluorescent beads (Molecular Probes, Eugene, OR)
were added to the upstream microfluidic reservoir with the syringe. With the three-way
valve open to the high-pressure reservoir, the beads flowed rapidly through the
microchannel into the downstream reservoir. After a sufficient number of beads were near
the channel, the valve was switched, such that the channel was exposed to the low-pressure
upstream reservoir. The height of this reservoir was adjusted until a bead was approximately
stationary inside the channel, and this height served as the zero pressure drop height.
During the course of each experiment, this zero pressure drop height was re-measured, to
account for any possible changes that may have occurred during the course of the
experiment.

Setting the three-way valve to the high-pressure reservoir, the beads were mostly
cleared from the microfluidic system, and neutrophils were added to the high-pressure
reservoir. The cells were introduced into the microfluidic system with the syringe. When
cells were seen near the microchannel, the three-way valve was set to the low-pressure
reservoir, and this reservoir was set to the desired pressure drop height. Once a neutrophil
entered the channel completely, the low-pressure reservoir was moved to its zero pressure
height, trapping the neutrophil inside the microchannel.
2.3.7 Multiple Particle Tracking Microrheology Analysis of Neutrophils
After the video images were transferred to a computer, multiple particle tracking was
performed on the granules found in the neutrophils. Using particle-tracking algorithms [79]
(particle-tracking commands and code scripts can be found in Appendices A and B,
respectively) written for RSI-IDL Software (Version 5.0, ITT Visual Information Solutions,
Boulder, CO), the Brownian motion of granules within the neutrophil was tracked between
the time the trapped neutrophil came into focus and the time that a pseudopod formed.
When analyzing the images, the regions between the nucleus and the cell's leading and
trailing edges were divided into two zones: Zone 1 (/4 of the length from the nucleus to the
cell edge) and Zone 2 (the remaining 3/ of the distance). Granules chosen for tracking were
found in this latter region, farther away from the nucleus (see Figure 2.9). Additionally,
granules located near the wall and at the cell periphery were excluded from tracking,
avoiding wall effects.
Within the RSI IDL software, other criteria for granule selection were established.
Only granules in frame for at least 30 frames (1 second) were chosen. Granules had to be
circular, with an eccentricity of 0.3 or less (corresponding to a <5%o difference between

major and minor axes). Using a visualization feature in the software, each selected granule
was visually examined, ensuring that only a single particle was being tracked by the
algorithm, and preventing granules exhibiting directed motion from being tracked.
Figure 2.9: Location criterion for granule selectionThe neutrophil's cytoplasm was divided into two regions: Zone 1 and Zone 2. Granules chosen for
particle-tracking were found in Zone 2. Figure from [54], with permission.
From the RSI IDL algorithms, a mean square displacement (MISD) for each particle
was computed. After averaging the NISD of all the selected particles, the two components
of the complex shear modulus (G'(o) and G"((O)) were calculated using the methods of
Mason et al. [47, 481 This procedure was performed in Matlab (Version 7.0.4, The
Mathworks, Inc., Natick, NLk), and the m-files used for the modulus calculation can be
found in Appendix A.3. For these analyses, the granule radius was taken to be 300 nm [44]

and the time lag was chosen to be 1/30 second (corresponding to a frequency measurement
of 30 Hz). The analysis was performed on the deformed neutrophil every 5 seconds.
To obtain initial values of G'(cO) and G"(w), neutrophils suspended in medium were
introduced between a glass slide and a glass coverslip (attached by double-sided tape).
Round, passive cells were imaged for several seconds, and the particle-tracking analysis was
performed on them. Granules located at the periphery of the cell were excluded from the
track to avoid the effects of the cell edge.
2.3.8 Statistical Analysis of Data
To compare results with one another, data were subjected to two-tailed student's t-
tests; p-values of less than 0.05 were considered to be a statistically significant difference.
Results below are expressed in average values ± standard error (SE).

3.0 RESULTS
3.1 Effectiveness of Calcium Chelation
The following section presents the results of the assays performed to test the
effectiveness of the Ca2 2 chelation procedure.
3.1.1 Fluorescent Imaging of Ca2' Levels
To assess the effectiveness of the Ca2 -chelator, BAPTA-AM, on the neutrophils,
Hluo-3, AM (lnvitrogen Corp., Carlsbad, CA) was loaded into both untreated and BAPTA-
treated cells, at a concentration of 2mM. Fluo-3, AM is able to penetrate the cell membrane,
and is activated to bind Ca'2 upon entering the intracellular environment. Upon binding,
VFluo-3 fluoresces (Excitation: 488 nm, Emission: -~525 nm), and is thus a reporter of Ca>-
levels inside the cell. Ak qualitative analysis of the Ca 2-' -chelating effects of BAPTA-AM
reveals a marked decrease in Fluo-3 fluorescence in 5 t.M BAPTA-treated cells (see Figure
3.1). Increasing the concentration of BAPTA (10 1 1N) further diminishes the fluorescence
of Fluo--3.
Figure 3.1: Qualitative assessment of Ca2'-chelation, using fluo-3.(A) ULntreated neutrophils loaded with 2mM, fluo-3. (B) Neutrophils loaded with 5 .M1 BAPTA-AM
and 2mM fluo-3. (C) Neutrophils loaded with 10 .tM BAPTA-AM and 2 mM fluo-3. Cells were plated atequal densities, and images were taken at the same microscope settings (40x) and at 230 C. Scale bar: 10 km.
3.1.2 Quantitative Measurements of [Ca2+]i with Flow Cytometry
To obtain a more quantitative measurement of the effects of BAPTA on Ca 2- levels
inside the cells, neutrophils were subjected to flow cytometry analysis. Two sets of cells
were tested: one loaded with 2 ýAL Fluo-3 and 5 tM Fura Red, and another loaded with 3.5
ptM BAPTA, 2 ý.M Fluo-3, and 5 ItM Fura Red. Both Fluo-3 and Fura Red are Ca2> dyes,
and the ratio of Fluo-3 to Fura Red is commonly used to quantify [Ca ]i. [75] Absolute
concentrations, however, require an instrument calibration that was unable to be performed
for this work. Nevertheless, the relative values of the Fluo-3/Fura Red ratio between sets
allow a quantification of changes in Ca" levels.
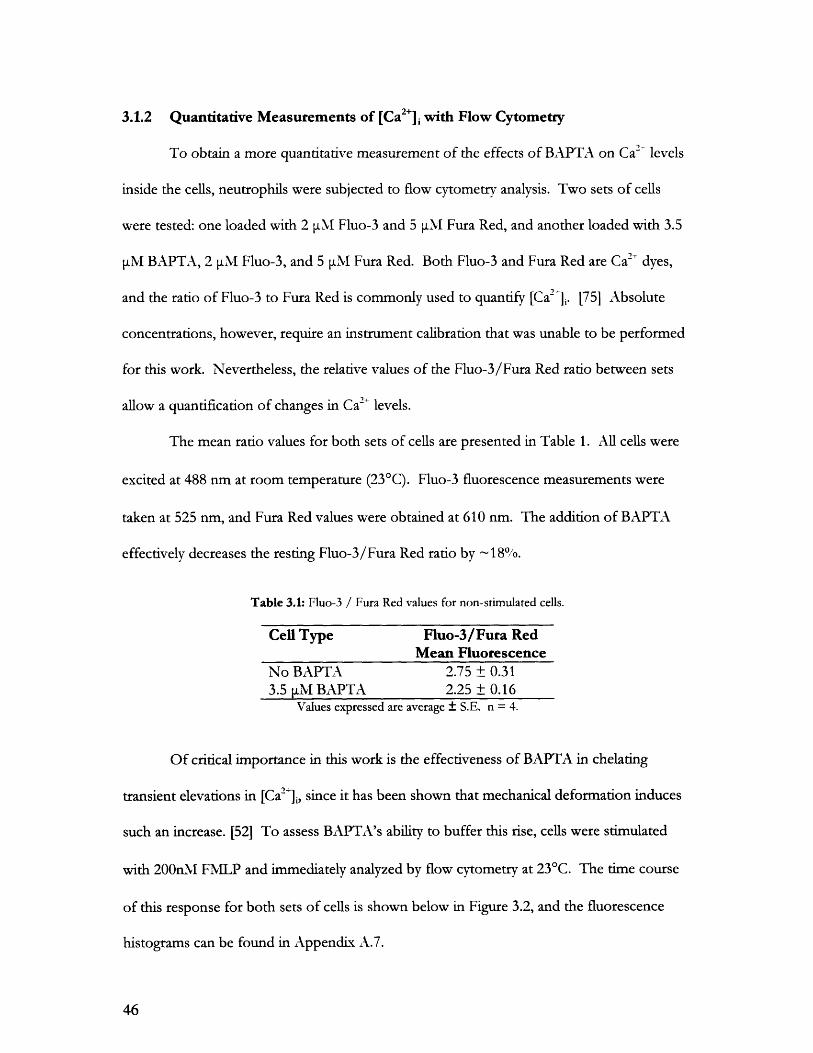
The mean ratio values for both sets of cells are presented in Table 1. All cells were
excited at 488 nm at room temperature (230 C). Fluo-3 fluorescence measurements were
taken at 525 nm, and Fura Red values were obtained at 610 nm. The addition of BAPTA
effectively decreases the resting Fluo-3/Fura Red ratio by 18%'0.
Table 3.1: Fluo-3 / Fura Red values for non-stimulated cells.
Cell Type Fluo-3/Fura RedMean Fluorescence
No BAPTA 2.75 + 0.313.5 .tM BAPTA 2.25 ± 0.16
Values expressed are average ± S.E. n = 4.
Of critical importance in this work is the effectiveness of BAPTA in chelating
transient elevations in [Ca2 ]i, since it has been shown that mechanical deformation induces
such an increase. [52] To assess BAPTA's ability to buffer this rise, cells were stimulated
with 200nM FNE[LP and immediately analyzed by flow cytometry at 230 C. The time course
of this response for both sets of cells is shown below in Figure 3.2, and the fluorescence
histograms can be found in Appendix A.7.

0
U)il160
M~n
E 0 BAPTA, 2pM Fluo-3, 5pM6 Fura Red
- '~ ~.*W.A r\A rA ~*SZ I.. _ f3.5pM BAPTA, 2pM Fluo-3,
5pM Fura
Red
02
1
0
Os -30s -5min
Time after FM LP stimulation
Figure 3.2: Ca2 " levels upon FMLP stimulation.F'[or measurements at Os, n=4. For 30s and 5 min, n=2 Each test analyzed 30,000 cells at 230C(
Stimulation with FMLP induces an -100% increase in the Fluo--3/Fura Red ratio in
untreated cells, while neutrophils treated with BAPTA abrogate approximately 900% of rise in
the ratio. Both increases are transient, as analyses several minutes after stimulation reveal
Ca 2 levels that are near the initial values for each cell type.
The Fluo-3/ Fura Red ratio values and their changes are not necessarily directly
proportional to the changes in [Ca '-,. [75] Environmental conditions (particularly
temperature and instrumental setup) largely determine the values of fluorescent
measurements obtained, and thus, quantification of [Ca']• requires calibration of the
instrument used for the experiment. This calibration was not performed in this work, but
the objective of this part of the project was to determine the effectiveness of BAPTA in
curbing stimulated increases in [Ca2 ],. These results show that the chelating agent was
indeed effective at buffering the FMLP-induced rise.

3.2 Shear Modulus Measurements with Particle Tracking
[The shear modulus values of three sets of neutrophils (untreated, 0.035" )o DMS()
treated, and 3.5 itl[ BAPTA-AM) were measured in their passive state and in their
mechanically deformed state. The following results are from experiments conducted at
370(]
3.2.1 Measurements of Round Passive Neutrophils
Multiple particle tracking analyses were performed on neutrophils in their passive
state, as determined by their spherical morphology and lack of pseudopod or uropod
formation (seen in Figure 3.3).
Figure 3.3: Round passive neutrophil.-n image of the round passive neutrophils subjected to multiple particle-tracking analysis. The arrows point to
granules that are typically tracked during the analyses. Scale bar: 5 itm.
The particle tracking analysis was performed on: untreated cells, cells treated with 3.5
ýiM B.\PTA-AM, and cells exposed to 0.03500 DNISO (loading vehicle for BAPTA).
Calculating the shear modulus required measurements of the *MSD values of the particles
selected for tracking. Typical MSD plots obtained in this work are shown in Figure 19
below Particles that were selected for tracking stayed in focus for at least 30 frames (1 sec);
while some particles were in focus for much longer, many of them were tracked for only
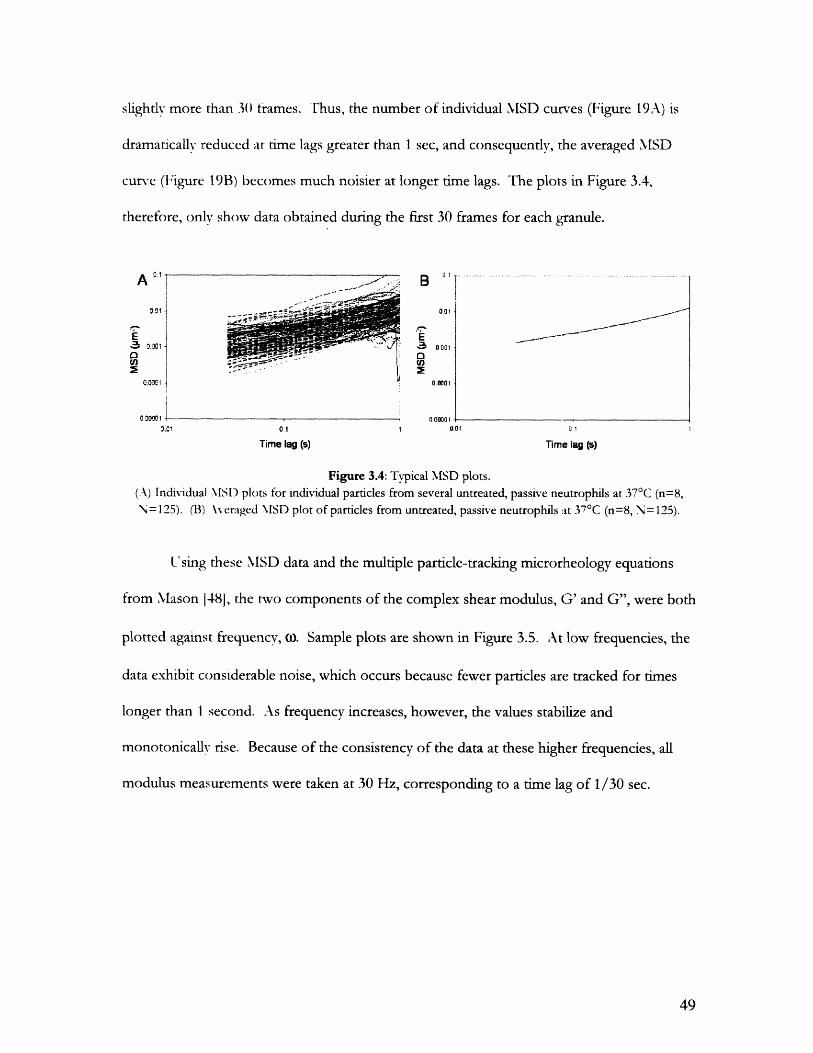
slightly more than 3(0 frames. Thus, the number of individual MSD curves (Figure 19A) is
dramatically reduced at time lags greater than 1 sec, and consequently, the averaged MSD
curve (Figure 19B) becomes much noisier at longer time lags. The plots in Figure 3.4,
therefore, only show data obtained during the first 30 frames for each granule.
1,, , 0 .0
C·.0,,1I oM.o1
. ,nn ¢•. i •
.C1 0 00001 01
Time lag (s) Time lag (s)
Figure 3.4: Typical MSD plots.(A) Individual NSI) plots for individual particles from several untreated, passive neutrophils at 370 C (n=8,N= 125). (B) \veraged \MSD plot of particles from untreated, passive neutrophils at 370 C (n=8, N= 125).
L'sing these MISD data and the multiple particle-tracking microrheology equations
from Mason 1481, the two components of the complex shear modulus, G' and G", were both
plotted against frequency, o). Sample plots are shown in Figure 3.5. At low frequencies, the
data exhibit considerable noise, which occurs because fewer particles are tracked for times
longer than 1 second. As frequency increases, however, the values stabilize and
monotonicallv rise. Because of the consistency of the data at these higher frequencies, all
modulus measurements were taken at 30 Hz, corresponding to a time lag of 1/30 sec.
S. . . . .. . .... ... ... .............. .. ... . . . . . .. . ... . . .... . . . .. I.... .. ...... I. ....... ......... -... . . .
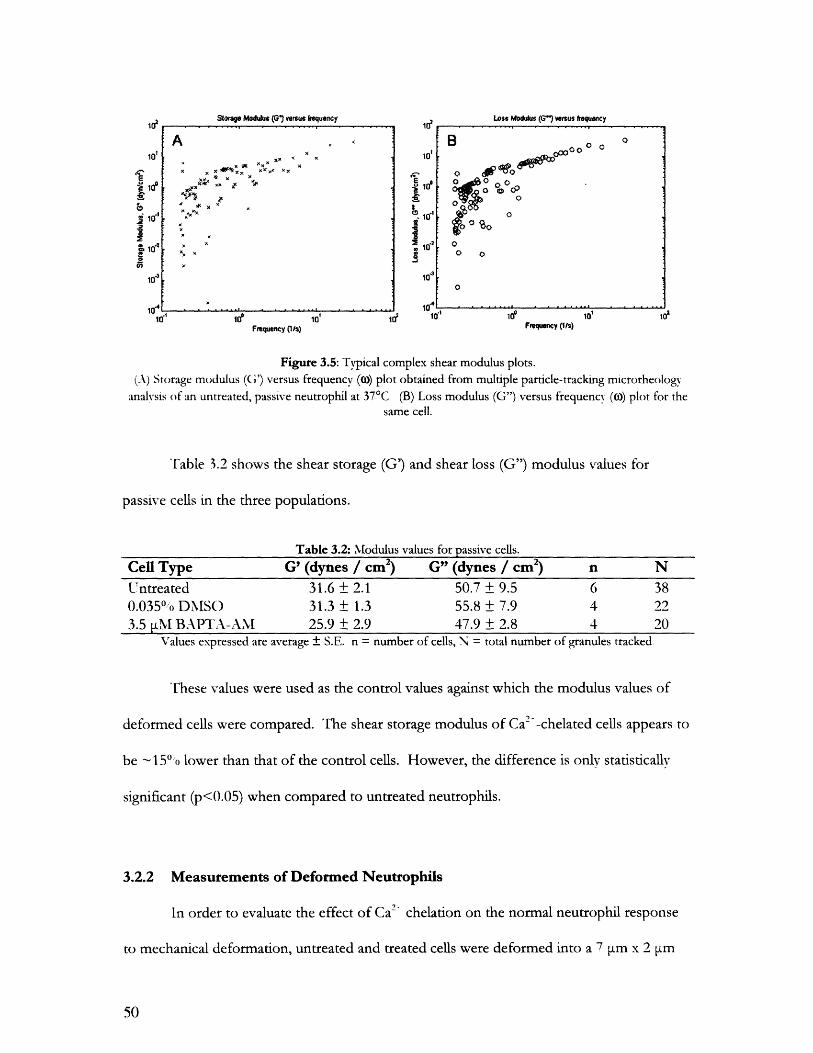
Storge Modulus (GI versus frquency
A
xx 3*x
x, *
xx
YA r
1
10'
10
id'10 .13
10
-4'
Loss Modulus (G") versus equency
10f 101
Frequency OI1s) Irmnf" U-1
Figure 3.5: Typical complex shear modulus plots.(A) Storage modulus (G') versus frequency (0) plot obtained from multiple particle-tracking microrheology
analysis of an untreated, passive neutrophil at 370C (B) Loss modulus (G") versus frequency ((0) plot for thesame cell.
T'able 3.2 shows the shear storage (G') and shear loss (G") modulus values for
passive cells in the three populations.
Table 3.2: Modulus values for passive cells.Cell Type G' (dynes / cm 2) G" (dynes / cm 2) n NUntreated 31.6 ± 2.1 50.7 ± 9.5 6 380.0350'0 DMSO 31.3 ± 1.3 55.8 ± 7.9 4 223.5 ýOM BAPTA-AM 25.9 ± 2.9 47.9 ± 2.8 4 20
Values expressed are average ± S.E. n = number of cells, N = total number of granules tracked.
These values were used as the control values against which the modulus values of
deformed cells were compared. The shear storage modulus of Ca2 -chelated cells appears to
be - 150 lower than that of the control cells. However, the difference is only statistically
significant (p<0.05) when compared to untreated neutrophils.
3.2.2 Measurements of Deformed Neutrophils
In order to evaluate the effect of Ca2 chelation on the normal neutrophil response
to mechanical deformation, untreated and treated cells were deformed into a 7 pm x 2 pm
10
10'
10-
* .
at 1
oCP0
0o 0
~ -- --- ~- - - ------- ~- ----------
' '-'""' ' ' """' ' ' """III10'1

(width x height) microchannel. Using the equation for effective diameter, D. = , the
effective diameter for the channel was calculated to be 4.22 urm. This value was larger than
the effective diameters of the channel used by Yap and Kamm (3.1 uLm and 4.0 uLm) [46], but
was found to be necessary in order to deform Ca'--chelated cells into the microchannel at a
reasonable driving pressure. A pressure drop of AP = 30mm H,O was used to introduce the
neutrophils into the channel, which is within the range used by Yap and Kamm [46], as well
as the range of pressures experienced in the pulmonary capillaries. [80] Figure 3.6 shows a
sample image sequence of the deformation process. Inside the channel, the neutrophils
possessed a length-to-width ratio of approximately 2.7-2.8, which is consistent with what is
expected for the dimensions of the channels used in these experiments.
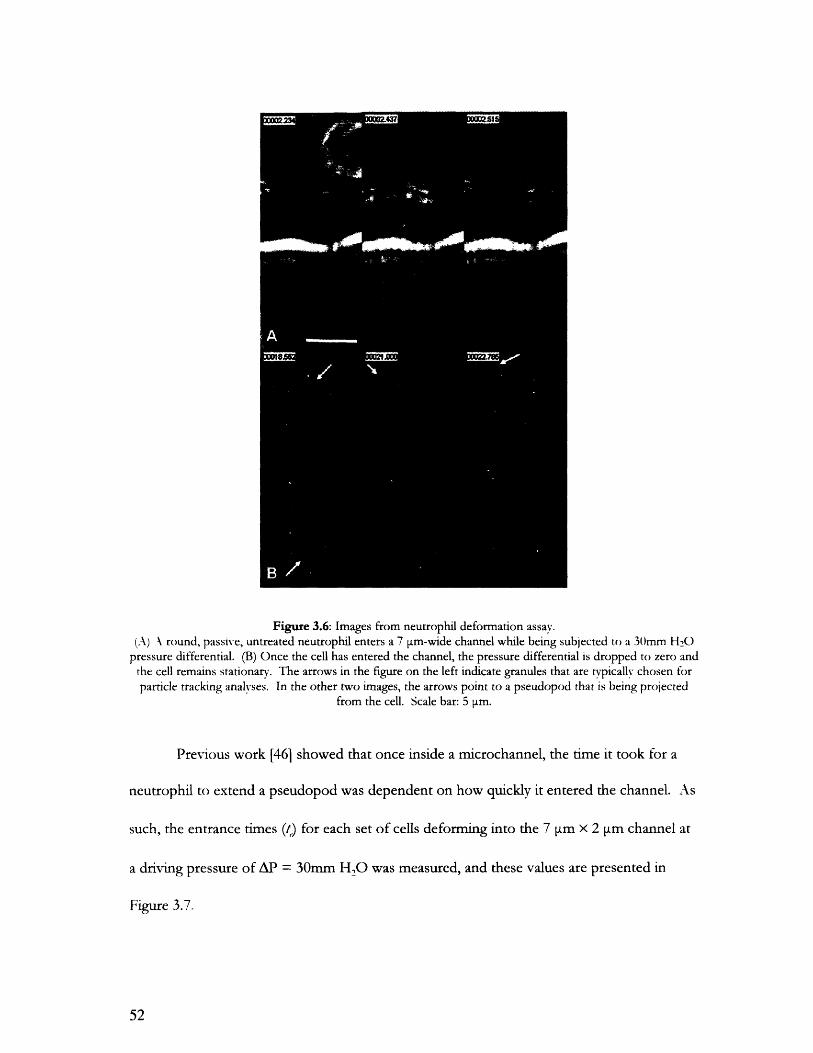
Figure 3.6: Images from neutrophil deformation assay.(A) \ round, passive, untreated neutrophil enters a 7 pm-wide channel while being subjected to a 30mm H2O
pressure differential. (B) Once the cell has entered the channel, the pressure differential is dropped to zero andthe cell remains stationary. The arrows in the figure on the left indicate granules that are typically chosen forparticle tracking analyses. In the other two images, the arrows point to a pseudopod that is being projected
from the cell. Scale bar: 5 pm.
Previous work [46] showed that once inside a microchannel, the time it took for a
neutrophil to extend a pseudopod was dependent on how quickly it entered the channel. As
such, the entrance times (t) for each set of cells deforming into the 7 I.m x 2 ýtm channel at
a driving pressure of AP = 30mm H,O was measured, and these values are presented in
Figure 3.7.
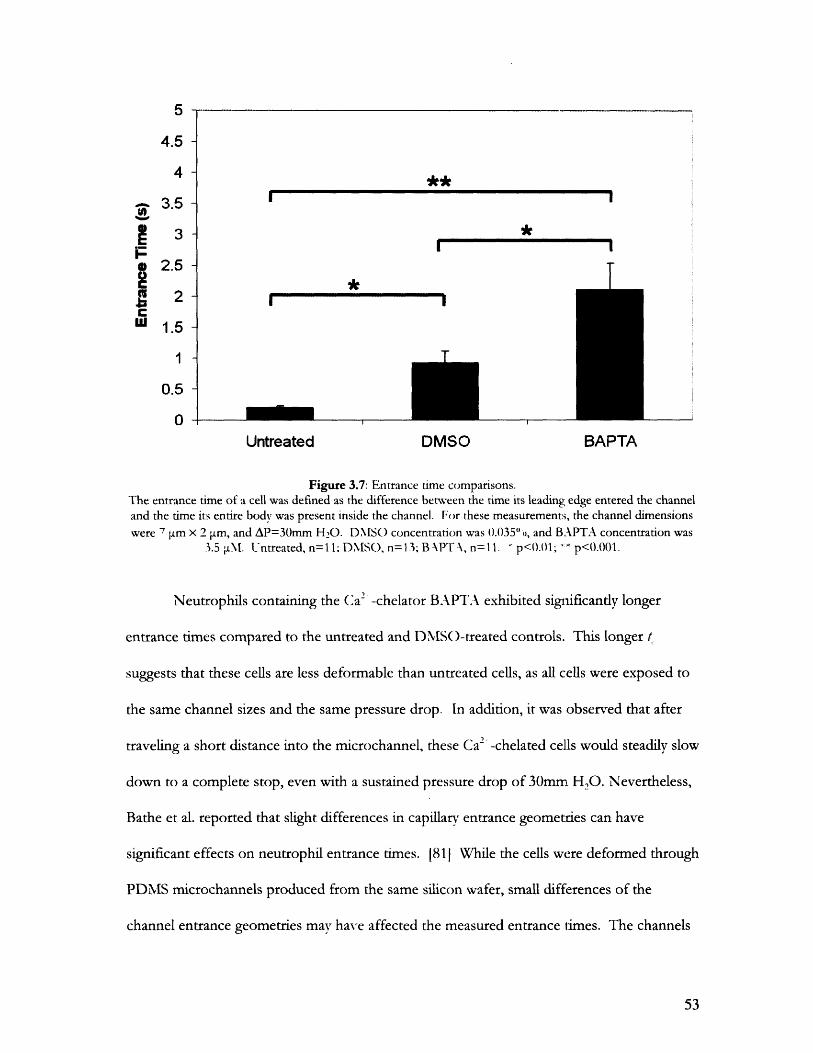
**~
JrI
*T
4.5
4-
- 3.5
a 2.5 n
) 2-2m 1.5 -
1-
0.5 -
0-
Untreated DMSO BAPTA
Figure 3.7: Entrance time comparisons.The entrance time of a cell was defined as the difference between the time its leading edge entered the channeland the time its entire body was present inside the channel. For these measurements, the channel dimensionswere 7 tm x 2 .m, and AP=30mm HO. DMS() concentration was 0.03500, and BAPTA concentration was
3.5 t.M. Lntreated, n=11; DMSO, n= 1; B PT\, n= 11. p<0.; p<0.001.
Neutrophils containing the Ca 2 -chelator BAPTA exhibited significantly longer
entrance times compared to the untreated and DMSO-treated controls. This longer t
suggests that these cells are less deformable than untreated cells, as all cells were exposed to
the same channel sizes and the same pressure drop. In addition, it was observed that after
traveling a short distance into the microchannel, these Ca 2- -chelated cells would steadily slow
down to a complete stop, even with a sustained pressure drop of 30mm H,O. Nevertheless,
Bathe et al. reported that slight differences in capillary entrance geometries can have
significant effects on neutrophil entrance times. 1811 While the cells were deformed through
PDMS microchannels produced from the same silicon wafer, small differences of the
channel entrance geometries may have affected the measured entrance times. The channels
T
r
I

used in these experiments were produced from the same master wafer, however, so any
differences in these geometries and their effects on channel entrance times were likely slight.
Although these entrance time comparisons alone may not be definitive evidence of
the decreased deformability of BAPTA-treated cells, other experiments conducted during
this work further support this observation. Prior to switching to a 7 tm-wide channel, a
61tm-wide channel with the same height was used, with D., = 3.9 ýtm (within the range of
diameters used by Yap and Kamm 1461). Yet while untreated cells deformed readily into this
smaller channel at AP = 10mm H,O, BAPTA-treated cells rarely were able to fully enter the
channel, even at AP values as high as 50cm H,O.
In addition to entrance times, the time it took for the deformed neutrophils to form
pseudopods was measured. These values are plotted against deformation rate (1/entrance
time) in Figure 3.8.
= 100
o * Urtreeted
"2 0 DM SOA BAPTA
o
0
0.1 1 10
Deform ation rate (1ts)
Figure 3.8: Effect of deformation rate on pseudopod projection time.
Cells from each group were deformed into a 7 im x 2 ýtm channel at 370C. Time to pseudopod projection wasmeasured from the time the cell began entering the channel. DNMSO controls were exposed to 0.0350"o DMSO,
while BAPTA was loaded at a concentration of 3.5 iiM. Untreated, n = 17; DMSO, n = 13; BAPTA, n = 11.Black and blue curves displayed in graph are logarithmic fits to the control cells and the BAPTA-treated cells,
respectively. p<i)0.5. comparing projection times between BAPTA and control populations for the samerange of deformation rates.

The downward slopes in pseudopod projection times for the control populations are
consistent with the trend seen by Yap and Kamm, [46] although the values are somewhat
different. The discrepancy is likely due to the difference in experimental conditions of the
current work, including a larger channel and different driving pressure. Experiments
performed on untreated cells with a 6 ktm-wide channel (D,,1 = 3.9 •tm) at AP = 10mm H,O
produced values more similar to their results (see Appendix 5 for graph).
Unlike the control cells, the BAPTA-treated cells do not appear to exhibit a
downward trend. While low deformation rates would result in longer times to pseudopod
projection in normal cells, the Ca2--chelated cells project pseudopods at short times, even at
low deformation rates. There seems to be a positive relationship between pseudopod
projection time and deformation rate in these BAPTA-treated cells, but the upward slope is
only slight. These data suggest that intracellular Ca2--chelation results in a faster activation
of deformed neutrophils that may potentially be independent of deformation rate.
Lastly, multiple particle-tracking analyses were performed on deformed cells from
each experimental set to determine values for the shear storage and shear loss moduli, G'
and G". Graphs that depict the temporal changes in these mechanical properties can be
found in Figure 3.9 below.

40
35 -
30-
25
20 -
15 -
10 -
5-
0 12.5
Time after deformation (s)
60 -
50 -ES40-
S30 -
020 -
10 -
0-
R T
*k **
T
12.5
17.5
* Untreatedm DMSOEBAPTA
**~
17.5
Time after deformation (s)
Figure 3.9: Temporal changes in (;' and C; following neutrophil deformation.(A) Shear storage moduli, G', and (B) shear loss moduli, G(;", for cells before and after deformation. Some cellsprojected pseudopods before a measurement could be made at 17.5s, but their moduli values at 12.5s were stillincluded. At 12.5s, Untreated: n=8, N=75; DNMSO: n=4, N=29; BAPTA: n= 1, N=57, At 17 .5s, Untreated:n=6, N=44; DMSO: n=2, N=8; BAPTA: n=5, N=20. - p<).05, " p<0.001 compared to pre-deformation
\-alues.
"I _
im=, I
Cells from the control populations (untreated and DMSO) behave similarly and
exhibit deformation responses comparable to those observed by Yap and Kamm [46];
following deformation, there is a drop in both G' and G". The drop in G' (-350;') was not
quite as dramatic as the decreases previously observed, a difference that might be explained
by differences in channel dimensions and driving pressures. The change in G" (-42' 0),
however, was comparable to the published work. Furthermore, a recovery in G' was
observed in these control cells, and there even seemed to be a stiffening of the cells beyond
their original G'. The error bars at this later time are rather large, however, so it is uncertain
whether this excess stiffening is actually occurring. G" values, on the other hand, did not
appear to recover with time, which is consistent with the observations of Yap and Kamm for
their larger channel experiments.
The BAPTA-treated cells exhibited a G' response that was markedly different from
that of the control populations. There was no significant drop in G' in these Ca 2 -chelated
neutrophils after deformation; rather, there appeared to be a slight stiffening of the cells
beyond their resting values. This increase was not statistically significant, however, and the
cells may have just retained their passive G' values. Contrarily, the G" response was similar
to that of the control cells, falling a statistically significant 600 /o after 12.5 seconds and
recovering slightly with time.
Particle-tracking analyses could only be performed on the cell before it extended a
pseudopod; measurements afterwards would not be representative of a passive cell. During
the experiments, pseudopods would most often form only on one end of the cell, and the
neutrophil would then proceed to migrate in that direction that the pseudopod projected.
This observation is consistent with what was observed by Yap and Kamm. [46, 54, 70]
However, occasionally cells would project pseudopods from both ends, although not

simultaneously. These cells would either begin migrating in one direction, or the opposite
ends would appear to migrate away from each other. The central portions of the latter cells
would subsequently begin to decrease in width as it was subjected to apparent forces in
opposite directions. One explanation for why this occurred in these experiments but not in
the previous work may be the significantly larger channel width used here (7 ýtm, as opposed
to 5 itm used by Yap and Kamm), but a precise explanation is unclear.

4.0 DISCUSSION
While traveling through the pulmonary microcirculation, neutrophils are driven
through capillaries that often have diameters much smaller than the neutrophil's. [12, 67]
The resulting deformation stimulates significant changes in the cell, including an increase in
[Cal2]i and sharp decreases in both the shear storage (G') and shear loss (G") moduli. [46,
52, 62, 70] The aim of this project was to determine whether a correlation existed between
these two events.
Neutrophils were loaded with BAPTA-AM, an intracellular Ca2 -chelating agent, and
individual cells were deformed into a microchannel by a physiological driving pressure.
Once the cell was stationary inside the channel, its mechanical properties (G' and G") were
measured by multiple particle-tracking analysis, in which the neutrophil's endogenous
granules were tracked by a computer program.
4.1 Neutrophil Deformability
A major difference between the BAPTA-treated neutrophils and the control cells
was their respective entrance times: BAPTA-treated cells took significantly longer to deform
into the 7 pm--wide channel at the same pressure drop (AP = 30mm H20). Additionally,
earlier experiments conducted with 6 rim-wide channels further demonstrated the decreased
deformability of these neutrophils. While untreated cells entered this smaller channel rather
quickly (t, - 0.1-0.5 sec, AP = 10mm H,O), most of the Ca>2-chelated neutrophils were
unable to fully enter the channel at a significantly higher pressure drop (AP - 50cm HO0).
As shown in Figure 4.1, these cells only partially entered the channel, while a portion of the
cell body remained stuck at the channel entrance.
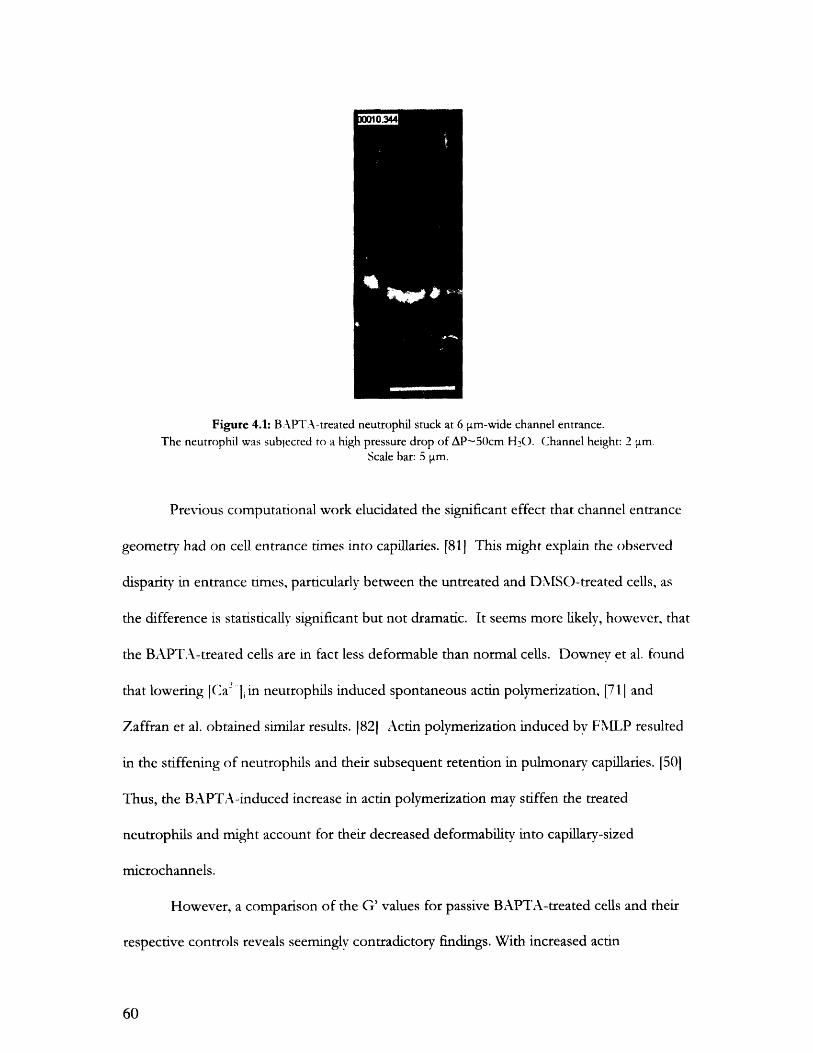
Figure 4.1: BAPTA-treated neutrophil stuck at 6 .tm-wide channel entrance.
The neutrophil was sublected to a high pressure drop of AP-50ccm H20. Channel height: 2 iým.Scale bar: 5 )tm.
Previous computational work elucidated the significant effect that channel entrance
geometry had on cell entrance times into capillaries. [811 This might explain the observed
disparity in entrance tmes, particularly between the untreated and DMSO-treated cells, as
the difference is statistically significant but not dramatic. It seems more likely, however, that
the BAPTA-treated cells are in fact less deformable than normal cells. Downey et al. found
that lowering (Ca2' 1 in neutrophils induced spontaneous actin polymerization, [711 and
Zaffran et al. obtained similar results. [821 Actin polymerization induced by FMLP resulted
in the stiffening of neutrophils and their subsequent retention in pulmonary capillaries. 1501
Thus, the BAPTA-induced increase in actin polymerization may stiffen the treated
neutrophils and might account for their decreased deformability into capillary-sized
microchannels.
However, a comparison of the G' values for passive BAPTA-treated cells and their
respective controls reveals seermngly contradictory findings. With increased actin

polymerization, the Ca --chelated cells might be expected to be stiffer than the controls.
Yet, the mean G' for the control cells was measured to be -31 dynes/cm 2, while the G' for
BAPTA-treated cells was found to be lower, at -26 dynes/cm . This unexpected difference
might be explained by the relatively small sample size of the BAPTA-treated neutrophils
(n=4), as there was no statistically significant difference between the DNISO control and the
BAPTA-treated cells. Another explanation may be the method by which the passive cells
were analyzed. Since modulus calculations involved tracking the motion of endogenous
granules, passive cells were only chosen if they were stationary. These cells probably
adhered slightly to the cover-slip surface, but refrained from spreading. This slight
adherence may have caused a local polymerization of actin to stabilize the cell, as is observed
in fibroblasts [83] and endothelial cells [84] when microbeads bound to the cell membrane
are subjected to force. In the fibroblast experiments, chelation of Ca-' ions inhibits this
force-induced localized polymerization. While such forces are not imposed on these passive
neutrophils, the focal adhesion might still promote a small amount of polymerization, which
would be abrogated in the Ca2--chelated cells. As a result, the measured stiffness value for
the minimally adherent untreated cells would be greater than that of the BAPTA-treated
cells. This explanation is hypothetical, however, and a localized polymerization might not
account for the measured -6 dynes/cm 2 difference. One other potential explanation is a
disparity in the locations of tracked particles, although efforts were made to exclude particles
near the center of the cell to avoid wall effects of the nucleus. Nevertheless, it remains
unclear why this particular discrepancy in stiffness values was observed.
4.2 G' Response After Deformation
Another remarkable observation of this work was the behavior of Ca2 -chelated
neutrophils inside the microchannel. Unlike the control cells, the BAPTA-treated
neutrophils were not found to experience a significant drop in G'. Rather, they appeared to
retain their initial stiffness, and possibly even stiffened further beyond their original G' once
inside the channel. Thus, these results suggest that a deformation-induced increase in [Ca 2]i
(as demonstrated in [62] and [52]) plays a role in the stiffness reduction seen in normal
neutrophils as they squeeze into microvessels.
4.2.1 Potential Mechanisms for the Observed Response
The mechanisms for the elevated [Ca 2'],'s effect on the deformed neutrophil's
stiffness may lie in the actions of Ca 2-sensitive cytoskeletal proteins. As proposed by
Janmey in an excellent review of the effects of intracellular Ca'- on the cytoskeleton, the
overall effect of Ca>' increases appears to be solation of the cortical filament layer, rendering
the cell more amenable to deformation. [72] Proteins potentially involved in this general
response include gelsolin, x(-actinin, spectrin, caldesmon, and NLLARCKS.
Gelsolin is an actin-regulating-protein that, at micromolar concentrations of Ca ,
can cleave and cap F-actin, and also inhibit microfilament assembly. [85-87] Additionally,
gelsolin can bind to actin monomers, and these complexes appear to serve as nucleation
points that promote actin filament assembly. [51] Such actions have led many to believe that
gelsolin serves an important role in allowing for the cytoskeletal remodeling needed during
neutrophil motility. Other proteins (fragmin, severin, villin) carry out similar functions, and
are also Ca 2--dependent.

Another protein that is directly affected by Ca-- is an F-actin cross-linking protein
known as a-actinin. High levels of Ca2' have been shown to inhibit several isoforms of this
protein, including macrophage, brain, and Dictyostelium discoideum a-actinin. [88-90] This
latter isoform, which is a typical non-muscle type of a-actinin, displays exquisite sensitivity at
the physiological [Ca-] i range in neutrophils; in an in vitro experiment, Witke et al. showed
that its cross-linking activity decreased by -~800 ' when [Ca 2 ] was increased from --60nM to
-600nM. [90] (Resting neutrophil [Ca-'li is roughly 100nM.)
Calcium can also have indirect effects on actin-binding proteins. When Ca- is
bound to calmodulin, the calcium/calmodulin complex can dissociate myristoylated C-kinase
substrate (ML-\RCKS) from F-actin, inhibiting its ability to bundle actin filaments. [91]
Similarly, calcium/calmodulin induces the dissociation of caldesmon from the sides of actin
filaments. [92] When bound to F-actin, caldesmon prevents gelsolin's binding to and
cleaving of the filament. The calcium/calmodulin inhibition of caldesmon thereby promotes
actin depolymerization.
Also, calcium/calmodulin has been shown to affect the activity of spectrin,
particularly the spectrin/4.1 complex. This complex is found in the cortical networks of
erythrocytes, which have to undergo the same deformations that neutrophils experience in
the microcirculation. In this cortical layer, it serves to cross-link actin filaments both to each
other and to the cellular membrane, strengthening the cytoskeleton and supporting the
membrane's integrity. [57] These activities are disrupted by calcium/calmodulin, however,
and it is possible that increased calcium/calmodulin activity thereby promotes the loss of
these cross-links and increases the deformability of the cell. A spectrin homologue, fodrin,
has been identified in neutrophils, and its proteolysis by Ca'--dependent proteases has been
implicated in the degranulation activity of the cell. [93j Calcium chelation in neutrophils
inhibits this exocytosis. [94]
It should be noted that these proposed mechanisms for Ca'- action have their
limitations. First, the diffusion of Ca 2 is considerably small: in experiments performed in
cytoplasmic extracts of Xenopus oocytes, the effective range of free Ca2 diffusion was
calculated to be approximately 100 nm. [951 Moreover, the concentration of Ca2- needed to
activate some of the proteins mentioned above in vitro is rather high. While the in vivo resting
[Ca 2]i is -~ 100nM, levels needed to activate gelsolin, for instance, are in the micromolar
range. [96] In light of the results of Kitagawa et al., in which the deformation-induced
increase in [Ca 2 ]i stimulated a Ca 2- dye fluorescence that was only twice the resting value , it
is questionable whether deformation activates actin depolymerization events. Nonetheless,
Downey et al. found that raising [Ca '-2 from 100nM to 500nM results in a -60% reduction
in the F-actin content of electropermeabilized neutrophils, which occurs at the same
timescale as the drop in shear modulus (< 30 sec). [711 Calcium concentrations between
100nM and 500nM were not tested, but if a linear fit existed between these two
measurements, a doubling of the resting [Ca 2 ]i to 200nM could reduce F-actin content by
~30%. Thus, despite the ion's limited diffusivity in the cytoplasm and the high
concentrations needed to activate certain depolymerizing proteins, relatively small increases
in [Ca ']i can still affect the actin network. Heterogeneity of the Ca2- release and the ion's
spatiotemporal distribution within the cell may resolve these seemingly contradictory
observations. [97]
In summary, the chelation of Ca2- in this work may have attenuated the solation of
the neutrophil cytoskeleton by inhibiting Ca>2 from acting through one or several of the
mechanisms discussed above. The multiple pathways by which Ca -- can depolymerize and

dissociate the cytoskeletal network emphasize the importance of remodeling the
cytoskeleton in a cell like the neutrophil. As an immune cell that must travel relatively
quickly to sites of infection, neutrophils are highly motile, and such robust involvement of
Ca2 in the remodeling process is likely crucial for them to meet their migratory needs. Also,
as they are continuously forced to squeeze through numerous small vessels during their
transit through the pulmonary circulation, neutrophils repeatedly experience significant
physical strain. It would be reasonable to believe that the cells possess an active mechanism
to ease this harsh process; such action could operate in concert with force-induced rupture
of cross-links and/or actin filaments, as might be inferred from the work of Tseng et al. [98]
These needs to migrate rapidly and deform readily possibly led to the evolution of the
chemoattractant- and deformation-induced increases in [Ca'-]i, and the subsequent
dependency of the cytoskeletal softening and remodeling processes on this calcium rise.
4.3 G" Response After Deformation
Although the shear storage modulus in Ca2 -chelated neutrophils behaved differently
from the control group, the G" response was roughly the same. Following deformation, the
G" value dropped by -40% for the control cells and by -50% for the BAPTA-treated cells.
This latter group exhibited a slight recovery at measurements made 5 seconds later, while the
control group values approximately remained the same.
Considering the results for the G' response of BAPTA-treated neutrophils, it seems
unusual that the G" value would significantly decrease, while G' is hardly affected. If the
Ca 2'-dependent mechanisms discussed in the previous sections are actively involved in the
deformation response, it is intuitive to think that Ca'--chelation would also abrogate the
drop in G". For instance, in normal cells, actin depolymerization induced by gelsolin activity

would potentially reduce the number of actin filaments in the cell, thereby reducing
cytoplasmic viscosity. Chelating calcium would inhibit this depolymerization, and as G" is
considered an indication of viscosity, G" would remain largely unchanged.
However, a precise description of the factors that contribute to G" has not been
developed. The concentration of cytoskeletal filaments may be part of this viscous
component, but it is not the sole determinant of viscosity. Influx of fluid into the cell, for
example, may produce changes in intracellular viscosity. Thus, Ca'--independent
mechanisms may be at work in the observed reduction of G" in both normal and Ca> -
chelated neutrophils.
4.4 Deformation-induced Activation
Sustained mechanical deformation of neutrophils in capillary-sized microchannels,
above a threshold stimulus, activates the cells to extend pseudopods and migrate. [46, 70, 991
The time it takes for neutrophils to become activated is inversely proportional to their
deformation rates into a microchannel, as is seen in previous work and in the current results.
This dependency and the existence of a threshold stimulus suggest that normal neutrophils
can sense the rate and magnitude of their deformation.
Ca2+-chelated neutrophils, on the other hand, demonstrate different behavior. At
low deformation rates (0.1 - 1 s -), these treated neutrophils become activated -30% more
quickly than normal cells. A general trend over a wide range of deformation rates was
difficult to determine, however, as BAPTA-treated cells exhibited relatively long entrance
times even at high pressure drops. Nevertheless, it appears that these Ca'2 -chelated cells are
more prone to become activated compared to the control cells. The observation that Ca 2 -
chelated cells retain the ability to extend pseudopods and migrate is not surprising, as others

have found that actin polymerization, cell locomotion, and shape change can occur
independently of [Ca'-]i increases. [61, 82, 94, 100] Yet an explanation for their relatively
shorter activation times remains left to speculation.
Cellular mechanisms for the triggering of pseudopod extensions have yet to be fully
determined. Others have studied the effects of fluid shear stress on pseudopod activity in
neutrophils; they found that such stresses stimulate pseudopod projection in passive
neutrophils, while inducing pseudopod retraction in activated cells. [101-103] In these
results, it appears that the initial state of the cell determines how mechanical stress affects its
pseudopod behavior. Furthermore, passive neutrophils were demonstrated to require an
intact actin network for pseudopod projection to occur. [102]
Given these previous findings and the observations of this work, one possible
explanation for the relatively shorter activation times of Ca 2--chelated neutrophils is a
dependency of pseudopod projection on the mechanical status of the actin network.
Assuming that a deformation-induced increase in [Ca2-], depolymerizes and/or dissociates
elements of the actin network, normal neutrophils experience a certain level of "softening"
of their cytoskeleton. This is followed by cell stiffening, as evidenced by the recovery of
both G' and F-actin levels to near initial values, and subsequent pseudopod projection. [46,
70] Meanwhile, BAPTA-treated neutrophils maintain their original stiffness and proceed to
stiffen via actin polymerization, which is independent of increased [Ca2-]1 and is potentially
initiated by cell deformation. [61, 82] The time at which a pseudopod is projected may be
influenced by the stiffness state of the actin cytoskeleton, in a mechanism that involves the
actin network achieving a certain level of stiffness for pseudopod projection to occur. Since
Ca,2-chelated cells begin their response with a greater G', they may be able to reach this
threshold more quickly.

Experimental observations motivated the development of this hypothesis. In the
seconds prior to pseudopod projection, granules near the projection site would exhibit less
motion and occasionally appear to become stationary. After the extension of the
pseudopod, granules would soon move into the newly formed space and again begin to
demonstrate reduced movement. Pseudopod projection would then follow, and the cycle
would repeat as the cell began to migrate towards one end of the channel. This is consistent
with the observations of Yap, [54] and with the finding that pseudopod projection occurs as
the deformed neutrophil stiffens inside the channel. [46, 70]
This explanation remains subject to debate, however. Pseudopod projections
observed in this work were found to occur at a range of G' values, weakening the support
for the existence of a threshold stiffness for projection. Yet, G' measurements were made
by tracking particles throughout the cell, while pseudopod projection may be strongly
influenced by local stiffness values.
Nevertheless, it is clear that more work is needed to determine the exact mechanisms
of deformation-induced neutrophil activation and calcium's actions within them.
4.5 Summary and Recommendations for Future Development
The aim of this study was to investigate calcium's role in the neutrophil response to
mechanical deformation, and the results suggest that rapid and transient increases in [Ca2 ]i
may help to facilitate neutrophil transit by effectively "softening" the cytoskeleton as the cell
squeezes through a narrow capillary. Ca2'-chelated cells exhibited decreased deformability
into a microchannel, did not experience the drop in G' seen in normal cells, and became
activated more quickly. This work thereby provides further insight into the signaling
mechanisms involved in the presumably active response of neutrophils to deformation.

Continued experiments are needed to further elucidate calcium's role in this
mechanotransduction response, and to determine the signaling events that occur both
upstream and downstream of Ca'-action. One particular experiment that would strongly
support the results of this thesis, as well as further the work of Kitagawa et al. [52], is the
quantification of the increase in [Ca 2'], during the deformation process. As mentioned
earlier, rather high concentrations are needed to activate actin depolymerizing proteins like
gelsolin. Kitagawa et al. demonstrated that a small, transient rise in the fluorescence of a
Ca 2 indicator occurred after deformation, but were unable to capture and quantify Ca>
dynamics during the deformation process, which is more relevant to this work. Laffafian
and Hallett found that poking a neutrophil membrane with a micropipette immediately
increased intracellular Ca- levels, but they did not quantify this response in terms of [Ca ]i.
[62] Additionally, free Ca * has been shown to have very limited diffusivity in cytoskeletal
extracts, signifying the importance of locating where Ca 2- increases are occurring within the
cell. [95] Thus a quantitative and spatial analysis of the deformation-induced increase in
[Ca2+]i would be of tremendous value in determining how Ca>2 is involved in neutrophil
mechanotransduction.
Once a method to visualize and quantify Ca2- dynamics during deformation is
developed, a worthy pursuit would be identifying whether the source of Ca> is intracellular
stores, the extracellular medium, or both. In response to stretching, the F-actin content of
fibroblasts exhibits behavior that is remarkably similar to the neutrophil's mechanical
response to deformation, and extracellular Ca" has a significant role in this fibroblast
response. [55] These results point to a role for stretch-activated Ca" channels, which may
mediate an influx of Ca> ions upon stretching of the fibroblast membrane. It is very likely
that neutrophils employ a similar mechanism, as their membranes are considerably deformed
when the cells squeeze through small capillaries. To determine whether this is indeed the
case, a rather straightforward experiment would include the observation of Ca 2 dynamics
during the neutrophil's deformation into a microchannel, both in the presence and absence
of extracellular Ca 2 .
Such experiments would also reveal whether or not mobilization of Ca 2 from
intracellular stores occurs during the deformation process. If this is the case, then it would
be useful to perform experiments that illuminate the signaling events responsible for the
observed release of intracellular Ca . With deformation of the cell as the stimulus in these
experiments, it is likely that any intracellular signaling would be initiated by the
engagement/activation of membrane proteins. Several membrane proteins have been
shown to elicit an increase in [Ca'-]i upon activation in neutrophils. The P2Y, receptor, for
instance, causes elevated intracellular Ca 2 - levels upon extracellular activation by either ATP
or UTP. [104] Interestingly, the same receptor is also implicated in the generation of cAMP
via adenylyl cyclase stimulation. [1051 Previous work has found that intracellular increases of
cA[MP serve to modulate neutrophil stiffening responses to stimuli, and in conjunction with
prostaglandins released from endothelial cells, it can assist with cell body deformation and
facilitate transmigration. [106] Furthermore, the receptor possesses an RGD sequence in its
extracellular domain that can interact with a4.P, integrins on the surface of endothelial cells,
[107] hinting at a potential physical engagement of the receptor during the neutrophil's
transit through endothelial cell-lined capillaries. Experiments to test for the involvement of
the P2Y, receptor would include ATP/UTP depletion and pertussis toxin treatment (P2Y,-
stimulated Ca>2 signaling operates through a pertussis-toxin sensitive phospholipase C
pathway).

Other possible avenues of investigation include the CD1 lb/CD18 integrin and two
Fc receptors, FcyRIIA (CD32) and FcyRIIIB (CD16B). CD1 lb/CD18 is the most abundant
P,-integrin in neutrophils, and deformation upregulates its expression on the neutrophil
surface. [52] P,-integrins have been shown to be capable of transiently increasing [Ca'-]> in
neutrophils through both the release of Ca 2> from intracellular stores and the influx of Ca-
from the surrounding medium. [108, 109] The signaling mechanisms that are responsible for
this increase occur through a phospholipase C pathway that is sensitive to phorbol myristate
acetate (PNLA) and U73122. [110, 111]
The Fc receptors are more commonly associated with the phagocytic and
degranulation activities of neutrophils. Although the other membrane proteins mentioned
above seem to be more likely targets, the capability of the Fc receptors to induce similar
transient Ca> responses is worth investigating. Their signaling pathways have been shown
to be sensitive to the PI3K inhibitor, wortmannin.
Lastly, it would be interesting to conduct further studies that might relate the work
conducted in this thesis more intricately with pathological conditions. Leukostasis, for
example, has been associated with acute myeloid leukemia (AML), [112-114] and while the
sheer magnitude of the number of leukocytes present in AiNL patients contributes to
leukostasis, there could very well be a role for leukocyte stiffness and deformation response
as well. Additionally, neutrophils exhibit altered behavior in patients afflicted with trauma,
septic shock, acute respiratory distress syndrome (ARDS), and acute ischemic stroke.
Passive neutrophils in septic shock and ARDS patients demonstrate decreased deformability,
[115] similar to the passive neutrophils examined in this thesis. Tissue damage of the brain
in acute ischemic stroke may be the result of the reduced deformability of leukocytes,
combined with their increased adhesiveness to vessel walls. [116] Others have shown that

trauma conditions can impair normal neutrophil function, reducing their chemotactic
capabilities and rendering them more likely to damage bystander tissue. [117] Dysregulation
of Ca'- signaling may be involved in these pathological mechanisms, and continued studies
of neutrophil mechanotransduction may lend tremendous insight into these debilitating
conditions.

REFERENCES
1. Goldsby RA, K.T., Osborne BA, and Kuby J., Immunology. 5 ed. 2003: WHFreeman.
2. Pryzwansky, K.B. and J. Breton-Gorius, Identification ofa subpopulation ofprimary granules in human neutrophils based upon maturation and distribution.Study by transmission electron microscopy cytochemistry and high voltageelectron microscopy of whole cell preparations. Lab Invest, 1985. 53(6): p. 664-71.
3. Pryzwansky, K.B., Human leukocytes as viewed by stereo high-voltageelectronmicroscopy. Blood Cells, 1987. 12(3): p. 505-30.
4. http://Imedocs.ucdavis.edu/cha/402/xpix/1724/1724054. ipg. 2006.5. Schmid-Schonbein, G.W., Y.Y. Shih, and S. Chien, Morphometry of human
leukocytes. Blood, 1980. 56(5): p. 866-75.6. Schmidtke, D.W. and S.L. Diamond, Direct observation of membrane tethers
.formed during neutrophil attachment to platelets or P-selectin underphysiological flow. J Cell Biol, 2000. 149(3): p. 719-30.
7. Zhao Y, C.S., Weinbaum S., Dynamic contact forces on leukocyte microvilli andtheir penetration of the endothelial glycocalyx. Biophys J, 2000. 80: p. 1124-40.
8.http://wwwl.imperial.ac. uk/medicine/about/divisions/nhli/respiration/leuk
ocvte/molecular/defiault.html. 2006.9. Southwick, F.S., et al., Polymorphonuclear leukocyte adherence induces actin
polymerization by a transduction pathway which differs from that used bychemoattractants. J Cell Biol, 1989. 109(4 Pt 1): p. 1561-9.
10. Anderson, D.C., et al., Cytoplasmic microtubules in polymorphonuclearleukocytes: effects of chemotactic stimulation and colchicine. Cell, 1982. 31(3 Pt2): p. 719-29.
11. Fechheimer, M. and S.H. Zigmond, Changes in cytoskeletal proteins ofpolymorphonuclear leukocytes induced by chemotactic peptides. Cell Motil, 1983.3(4): p. 349-61.
12. Doerschuk, C.M., et al., Comparison of neutrophil and capillary diameters andtheir relation to neutrophil sequestration in the lung. J Appl Physiol, 1993. 74(6):p. 3040-5.
13. Howard, T.H. and W.H. Meyer, Chemotactic peptide modulation of actinassembly and locomotion in neutrophils. J Cell Biol, 1984. 98(4): p. 1265-71.
14. Howard, T.H. and C.O. Oresajo, The kinetics of chemotactic peptide-inducedchange in F-actin content, F-actin distribution, and the shape of neutrophils. JCell Biol, 1985. 101(3): p. 1078-85.
15. Bevilacqua, M.P., et al., Endothelial leukocyte adhesion molecule 1: an induciblereceptor for neutrophils related to complement regulatory proteins and lectins.Science, 1989. 243(4895): p. 1160-5.
16. Anderson, D.C., et al., The severe and moderate phenotypes of heritable Mac-I,LFA-1 deficiency: their quantitative definition and relation to leukocytedysfunction and clinical features. J Infect Dis, 1985. 152(4): p. 668-89.

17. Von Andrian, U.H., et al., L-selectin function is required for beta 2-integrin-mediated neutrophil adhesion at physiological shear rates in vivo. Am J Physiol,1992. 263(4 Pt 2): p. H1034-44.
18. Albelda, S.M., C.W. Smith, and P.A. Ward, Adhesion molecules andinflammatory injury. Faseb J, 1994. 8(8): p. 504-12.
19. Zimmerman, G.A., S.M. Prescott, and T.M. McIntyre, Endothelial cellinteractions with granulocytes: tethering and signaling molecules. ImmunolToday, 1992. 13(3): p. 93-100.
20. Rot, A., Endothelial cell binding of NAP-1/IL-8: role in neutrophil emigration.Immunol Today, 1992. 13(8): p. 291-4.
21. Shamri, R., et al., Lymphocyte arrest requires instantaneous induction of anextended LFA-1 conformation mediated by endothelium-bound chemokines. NatImmunol, 2005. 6(5): p. 497-506.
22. Kitayama, J., et al., Shear stress affects migration behavior of polymorphonuclearcells arrested on endothelium. Cell Immunol, 2000. 203(1): p. 39-46.
23. Rosengren, S., et al., Leukotriene B4-induced neutrophil-mediated endothelialleakage in vitro and in vivo. J Appl Physiol, 1991. 71(4): p. 1322-30.
24. Liu, Y., et al., Regulation of leukocyte transmigration: cell surface interactionsand signaling events. J Immunol, 2004. 172(1): p. 7-13.
25. Schenkel, A.R., et al., CD99 plays a major role in the migration of monocytesthrough endothelial junctions. Nat Immunol, 2002. 3(2): p. 143-50.
26. Mamdouh, Z., et al., Targeted recycling of PECAM from endothelial surface-connected compartments during diapedesis. Nature, 2003. 421(6924): p. 748-53.
27. Ostermann, G., et al., JAM-i is a ligand of the beta(2) integrin LFA-1 involved intransendothelial migration of leukocytes. Nat Immunol, 2002. 3(2): p. 151-8.
28. Ma, S., S. K. Shaw, L. Yang, T. Jones, Y. Liu, A. Nusrat, C. A. Parkos, and F. W.Luscinskas, Dynamics of junctional adhesion molecule 1 (JAMI) during leukocytetransendothelial migration under flow in vitro. FASEB J, 2003. 17: p. Al 1189.
29. Shaw, S.K., et al., Real-time imaging of vascular endothelial-cadherin duringleukocyte transmigration across endothelium. J Immunol, 2001. 167(4): p. 2323-30.
30. Feng, D., et al., Neutrophils emigrate from venules by a transendothelial cellpathway in response to FMLP. J Exp Med, 1998. 187(6): p. 903-15.
31. Yang, L., et al., ICAM-1 regulates neutrophil adhesion and transcellularmigration of TNF-alpha-activated vascular endothelium under flow. Blood, 2005.106(2): p. 584-92.
32. Huang, A.J., et al., Endothelial cell cytosolic free calcium regulates neutrophilmigration across monolayers of endothelial cells. J Cell Biol, 1993. 120(6): p.1371-80.
33. van Buul, J.D. and P.L. Hordijk, Signaling in leukocyte transendothelialmigration. Arterioscler Thromb Vasc Biol, 2004. 24(5): p. 824-33.
34. Hordijk, P., Endothelial signaling in leukocyte transmigration. Cell BiochemBiophys, 2003. 38(3): p. 305-22.
35. Wang, Q. and C.M. Doerschuk, The signaling pathways induced by neutrophil-endothelial cell adhesion. Antioxid Redox Signal, 2002. 4(1): p. 39-47.
36. Evans, E. and A. Yeung, Apparent viscosity and cortical tension of bloodgranulocytes determined by micropipet aspiration. Biophys J, 1989. 56(1): p.151-60.
37. Schmid-Schonbein, G.W., et al., Passive mechanical properties of humanleukocytes. Biophys J, 1981. 36(1): p. 243-56.
38. Sung, K.L., et al., Leukocyte relaxation properties. Biophys J, 1988. 54(2): p.331-6.
39. Kan, H.C.U., H.S.; Shyy, W.; and Tran-Son-Tay, R., Hydrodynamics of acompound drop with application to leukocyte modeling. Physics of Fluids, 1998.10: p. 760-774.
40. Dong, C., et al., Passive deformation analysis of human leukocytes. J BiomechEng, 1988. 110(1): p. 27-36.
41. Tsai, M.A., R.S. Frank, and R.E. Waugh, Passive mechanical behavior of humanneutrophils: power-lawfluid. Biophys J, 1993. 65(5): p. 2078-88.
42. Dao, M.L., CT; Suresh S., Mechanics of the human red blood cell deformed byoptical tweezers. Journal of the Mechanics and Physics of Solids., 2003. 51: p.2259-2280.
43. Li, J., et al., Spectrin-level modeling of the cytoskeleton and optical tweezersstretching of the erythrocyte. Biophys J, 2005. 88(5): p. 3707-19.
44. Yanai, M., et al., Intracellular elasticity and viscosity in the body, leading, andtrailing regions of locomoting neutrophils. Am J Physiol, 1999. 277(3 Pt 1): p.C432-40.
45. Yanai, M., et al., Regional rheological differences in locomoting neutrophils. AmJ Physiol Cell Physiol, 2004. 287(3): p. C603-1 1.
46. Yap, B. and R.D. Kamm, Mechanical deformation of neutrophils into narrowchannels induces pseudopod projection and changes in biomechanical properties.J Appl Physiol, 2005. 98(5): p. 1930-9.
47. Mason, T.G., K; van Zanten, JH; Wirtz, D; Kuo, SC., Particle trackingmicrorheology of complexfluids. Phys Rev Lett, 1997. 79(17): p. 3282-3285.
48. Mason, T., Estimating the viscoelastic moduli of complex fluids using thegeneralized Stokes-Einstein equation. Rheol Acta, 2000. 39: p. 371-378.
49. Saito, H., et al., Mechanical properties of rat bone marrow and circulatingneutrophils and their responses to inflammatory mediators. Blood, 2002. 99(6): p.2207-13.
50. Worthen, G.S., et al., Mechanics of stimulated neutrophils: cell stiffening inducesretention in capillaries. Science, 1989. 245(4914): p. 183-6.
51. Howard, T., et al., Gelsolin-actin interaction and actin polymerization in humanneutrophils. J Cell Biol, 1990. 110(6): p. 1983-91.
52. Kitagawa, Y., et al., Effect of mechanical deformation on structure and functionofpolymorphonuclear leukocytes. J Appl Physiol, 1997. 82(5): p. 1397-405.
53. Anderson, G.J., et al., Effect of mechanical deformation of neutrophils on theirCD18/ICAM-1-dependent adhesion. J Appl Physiol, 2001. 91(3): p. 1084-90.
54. Yap, B., Mechanical Deformation of Neutrophil into Pulmonary CapillariesInduces Cytoskeletal Remodeling, Pseudopod Projection and Changes inBiomechanical Properties. 2005, Massachusetts Institute of Technology.

55. Pender, N. and C.A. McCulloch, Quantitation of actin polymerization in twohuman fibroblast sub-types responding to mechanical stretching. J Cell Sci, 1991.100 (Pt 1): p. 187-93.
56. Elson, E.L., Cellular mechanics as an indicator of cytoskeletal structure andfunction. Annu Rev Biophys Biophys Chem, 1988. 17: p. 397-430.
57. Lodish, H.B., A; Matsudaira, P; Kaiser, CA; Krieger, M; Scott, MP; Zipursky,SL; and Darnell, J., Molecular Cell Biology. 5th ed. 2004: W.H. Freeman andCompany.
58. Hoyer, J., et al., Ca2+ influx through stretch-activated cation channels activatesmaxi K+ channels in porcine endocardial endothelium. Proc Natl Acad Sci U SA, 1994. 91(6): p. 2367-71.
59. Pozzan, T., et al., Is cytosolic ionized calcium regulating neutrophil activation?Science, 1983. 221(4618): p. 1413-5.
60. Marks, P.W. and F.R. Maxfield, Transient increases in cytosolic free calciumappear to be required for the migration of adherent human neutrophils. J CellBiol, 1990. 110(1): p. 43-52.
61. al-Mohanna, F.A. and M.B. Hallett, Actin polymerization in neutrophils istriggered without a requirement for a rise in cytoplasmic Ca2+. Biochem J, 1990.266(3): p. 669-74.
62. Laffafian, I. and M.B. Hallett, Does cytosolic free Ca2+ signal neutrophilchemotaxis in response toformylated chemotactic peptide? J Cell Sci, 1995. 108(Pt 10): p. 3199-205.
63. Voldman, J., M.L. Gray, and M.A. Schmidt, Microfabrication in biology andmedicine. Annu Rev Biomed Eng, 1999. 1: p. 401-25.
64. Whitesides, G.M., et al., Soft lithography in biology and biochemistry. Annu RevBiomed Eng, 2001. 3: p. 335-73.
65. Tan, J.L., et al., Cells lying on a bed of microneedles: an approach to isolatemechanical force. Proc Natl Acad Sci U S A, 2003. 100(4): p. 1484-9.
66. Sia, S.K. and G.M. Whitesides, Microfluidic devices fabricated inpoly(dimethylsiloxane) for biological studies. Electrophoresis, 2003. 24(21): p.3563-76.
67. Hogg, J.C., et al., Erythrocyte and polymorphonuclear cell transit time andconcentration in human pulmonary capillaries. J Appl Physiol, 1994. 77(4): p.1795-800.
68. Hogg, J.C. and C.M. Doerschuk, Leukocyte traffic in the lung. Annu Rev Physiol,1995. 57: p. 97-114.
69. Lichtman, M., Rheology of leukocytes, leukocyte suspensions, and blood inleukemia. J Clin Invest, 1973. 52: p. 350-358.
70. Yap, B. and R.D. Kamm, Cytoskeletal remodeling and cellular activation duringdeformation of neutrophils into narrow channels. J Appl Physiol, 2005. 99(6): p.2323-30.
71. Downey, G.P., et al., Actin assembly in electropermeabilized neutrophils: role ofintracellular calcium. J Cell Biol, 1990. 110(6): p. 1975-82.
72. Janmey, P.A., Phosphoinositides and calcium as regulators of cellular actinassembly and disassembly. Annu Rev Physiol, 1994. 56: p. 169-91.

73. Lipp, P. and E. Niggli, Ratiometric confocal Ca(2+)-measurements with visiblewavelength indicators in isolated cardiac myocytes. Cell Calcium, 1993. 14(5): p.359-72.
74. Floto, R.A., et al., IgG-induced Ca2+ oscillations in differentiated U937 cells; astudy' using laser scanning confocal microscopy and co-loaded fluo-3 and fura-red fluorescent probes. Cell Calcium, 1995. 18(5): p. 377-89.
75. Novak, E.J. and P.S. Rabinovitch, Improved sensitivity inflow cytometricintracellular ionized calcium measurement using fluo-3/Fura Red fluorescenceratios. Cytometry, 1994. 17(2): p. 135-41.
76. Alteraifi, A.M. and D.V. Zhelev, Transient increase offree cytosolic calciumduring neutrophil motility responses. J Cell Sci, 1997. 110 (Pt 16): p. 1967-77.
77. Anderson, J.R., et al., Fabrication of topologically complex three-dimensionalmicrofluidic systems in PDMS by rapid prototyping. Anal Chem, 2000. 72(14): p.3158-64.
78. Juncker, D.S., H; Bernard, A; Caelen, I; Michel, B; de Rooij, N; and Delamarche,E., Soft and rigid two-level microfluidic networks for patterning surfaces. Journalof Micromechanics and Microengineering, 2001. 11: p. 532-541.
79. Crocker, J., and Grier, DG., Methods of digital video microscopy for colloidalstudies. Journal of Colloid and Interface Science, 1996. 179: p. 298-310.
80. Huang, Y., C.M. Doerschuk, and R.D. Kamm, Computational modeling of RBCand neutrophil transit through the pulmonary capillaries. J Appl Physiol, 2001.90(2): p. 545-64.
81. Bathe, M., et al., Neutrophil transit times through pulmonary capillaries: theeffects of capillary geometry and fMLP-stimulation. Biophys J, 2002. 83(4): p.1917-33.
82. Zaffran, Y., et al., F-actin content and spatial distribution in resting andchemoattractant-stimulated human polymorphonuclear leucocytes. Which role forintracellularfree calcium? J Cell Sci, 1993. 105 (Pt 3): p. 675-84.
83. Glogauer, M., et al., Calcium ions and tyrosine phosphorylation interactcoordinately with actin to regulate cytoprotective responses to stretching. J CellSci, 1997. 110 (Pt 1): p. 11-21.
84. Matthews, B.D., et al., Cellular adaptation to mechanical stress: role of integrins,Rho, cytoskeletal tension and mechanosensitive ion channels. J Cell Sci, 2006.119(Pt 3): p. 508-18.
85. Yin, H.L. and T.P. Stossel, Purification and structural properties of gelsolin, aCa2+-activated regulatory protein of macrophages. J Biol Chem, 1980. 255(19):p. 9490-3.
86. Yin, H.L., K.S. Zaner, and T.P. Stossel, Ca2+ control of actin gelation.Interaction of gelsolin with actin filaments and regulation of actin gelation. J BiolChem, 1980. 255(19): p. 9494-500.
87. Janmey, P.A., et al., Interactions of gelsolin and gelsolin-actin complexes withactin. Effects of calcium on actin nucleation, filament severing, and end blocking.Biochemistry, 1985. 24(14): p. 3714-23.
88. Bennett, J.P., K.S. Zaner, and T.P. Stossel, Isolation and some properties ofmacrophage alpha-actinin: evidence that it is not an actin gelling protein.Biochemistry, 1984. 23(21): p. 5081-6.

89. Duhaiman, A.S. and J.R. Bamburg, Isolation of brain alpha-actinin. Itscharacterization and a comparison of its properties with those of muscle alpha-actinins. Biochemistry, 1984. 23(8): p. 1600-8.
90. Witke, W., et al., The Ca(2+)-binding domains in non-muscle type alpha-actinin:biochemical and genetic analysis. J Cell Biol, 1993. 121(3): p. 599-606.
91. Hartwig, J.H., et al., MARCKS is an actin filament crosslinking protein regulatedby protein kinase C and calcium-calmodulin. Nature, 1992. 356(6370): p. 618-22.
92. Matsumura, F. and S. Yamashiro, Caldesmon. Curr Opin Cell Biol, 1993. 5(1): p.70-6.
93. Harris, A.S. and J.S. Morrow, Calmodulin and calcium-dependent protease Icoordinately regulate the interaction offodrin with actin. Proc Natl Acad Sci U SA, 1990. 87(8): p. 3009-13.
94. Baggiolini, M.a.K., P., Neutrophil Activation: Control of Shape Change,Exocytosis, and Respiratory Burst. NIPS, 1992. 7: p. 215-219.
95. Allbritton, N.L., T. Meyer, and L. Stryer, Range of messenger action of calciumion and inositol 1,4,5-trisphosphate. Science, 1992. 258(5089): p. 1812-5.
96. Lamb, J.A., et al., Modulation of gelsolin function. Activation at low pH overridesCa2+ requirement. J Biol Chem, 1993. 268(12): p. 8999-9004.
97. Brundage, R.A., et al., Calcium gradients underlying polarization and chemotaxisof eosinophils. Science, 1991. 254(5032): p. 703-6.
98. Tseng, Y., et al., The bimodal role offilamin in controlling the architecture andmechanics of F-actin networks. J Biol Chem, 2004. 279(3): p. 1819-26.
99. Evans, E. and B. Kukan, Passive material behavior of granulocytes based onlarge deformation and recovery after deformation tests. Blood, 1984. 64(5): p.1028-35.
100. Bengtsson, T., O. Stendahl, and T. Andersson, The role of the cytosolic free Ca2+transient for fMet-Leu-Phe induced actin polymerization in human neutrophils.Eur J Cell Biol, 1986. 42(2): p. 338-43.
101. Moazzam, F., et al., The leukocyte response to fluid stress. Proc Natl Acad Sci US A, 1997. 94(10): p. 5338-43.
102. Coughlin, M.F. and G.W. Schmid-Schonbein, Pseudopod projection and cellspreading of passive leukocytes in response to fluid shear stress. Biophys J, 2004.87(3): p. 2035-42.
103. Makino, A., et al., Control of neutrophil pseudopods by fluid shear: role of Rhofamily GTPases. Am J Physiol Cell Physiol, 2005. 288(4): p. C863-71.
104. Meshki, J., et al., Molecular mechanism of nucleotide-induced primary granulerelease in human neutrophils: role for the P2Y2 receptor. Am J Physiol CellPhysiol, 2004. 286(2): p. C264-71.
105. Huang, N.N., et al., Multiple signal transduction pathways lead to extracellularATP-stimulated mitogenesis in mammalian cells: II. A pathway involvingarachidonic acid release, prostaglandin synthesis, and cyclic AMP accumulation.J Cell Physiol, 1991. 146(3): p. 483-94.
106. Downey, G.P., et al., Biophysical properties and microfilament assembly inneutrophils: modulation by cyclic AMP. J Cell Biol, 1991. 114(6): p. 1179-90.

107. Erb, L., et al., An RGD sequence in the P2Y(2) receptor interacts withalpha(V)beta(3) integrins and is required for G(o)-mediated signal transduction.J Cell Biol, 2001. 153(3): p. 491-501.
108. Ng-Sikorski, J., et al., Calcium signaling capacity of the CDI b/CD18 integrin onhuman neutrophils. Exp Cell Res, 1991. 195(2): p. 504-8.
109. Petersen, M., J.D. Williams, and M.B. Hallett, Cross-linking of CD11 b or CD18signals release of localized Ca2+ from intracellular stores in neutrophils.Immunology, 1993. 80(1): p. 157-9.
110. Hellberg, C., et al., The Ca2+ signaling capacity of the beta 2-integrin on HL60-granulocytic cells is abrogated following phosphorylation of its CD18-chain:relation to impaired protein tyrosine phosphorylation. Exp Cell Res, 1995.217(1): p. 140-8.
111. Hellberg, C., et al., Ca2+ signalling mechanisms of the beta 2 integrin onneutrophils: involvement of phospholipase C gamma 2 and Ins(1,4,5)P3. BiochemJ, 1996. 317 (Pt 2): p. 403-9.
112. McKee, L.C., Jr. and R.D. Collins, Intravascular leukocyte thrombi andaggregates as a cause of morbidity and mortality in leukemia. Medicine(Baltimore), 1974. 53(6): p. 463-78.
113. Lichtman, M.A. and J.M. Rowe, Hyperleukocytic leukemias: rheological, clinical,and therapeutic considerations. Blood, 1982. 60(2): p. 279-83.
114. Stucki, A., et al., Endothelial cell activation by myeloblasts: molecularmechanisms of leukostasis and leukemic cell dissemination. Blood, 2001. 97(7): p.2121-9.
115. Skoutelis, A.T., et al., Neutrophil deformability in patients with sepsis, septicshock, and adult respiratory distress syndrome. Crit Care Med, 2000. 28(7): p.2355-9.
116. Grau, A.J., et al., Granulocyte adhesion, deformability, and superoxide formationin acute stroke. Stroke, 1992. 23(1): p. 33-9.
117. Tarlowe, M.H., et al., Prospective study of neutrophil chemokine responses intrauma patients at risk for pneumonia. Am J Respir Crit Care Med, 2005. 171(7):p. 753-9.

APPENDIX
A.1 IDL Commands for First Frame
The following is taken from the Appendix of [54], with permission.
'he commands used in the tracking of particles is shown below together with a briefdescription of the utility of each command (in blue). Part of the command lines arehighlighted in red; which indicates the parameters that could be varied for each command.
Particle Identification
window, O,xsize=740,ysize=252Creates an image window number 0, with horizontal pixel size of 740 and vertical pixel sizeof 252.
wset, OSets image window 0 as the current active window.
a=read_nih( 'c:\RSI\IDL60\reslicel\frame0000.tif')Reads in a single NIH image from file named 'frame0000.tif in the c:\RSI\IDL60\resliceldirectory.
tvscl, aI)Displays the image file that has been read in the active window.
temp=2 5 5b-aInverts the image color (i.e. white becomes black and vice-versa).
b=bpass (temp, 1, 9)bpass is the spatial bandpass filter which smooths the image and substracts the backgroundoff. The two numbers are the spatial wavelength cutoffs in pixels. The first one is almostalways '1'. The second number is set to be approximately the size of the granules in pixels.
f=feature (b, 9)Finds the coordinates of the particles. The parameter (9) is again the diameter of the granulesin pixels, similar to that used in the bpass upper cutoff above.
fo=fover2d(a, f)Plots dots where each particle was found.
plot, f(2,*),f(3,*), psym=6Plots the graph of radius of gyration (vertical axis) vs. brightness (horizontal axis). Thebrightness helps to distinguish the dots that represent the granules, which are brighter, fromthe dimmer dots that are due to random noise in the starting image.
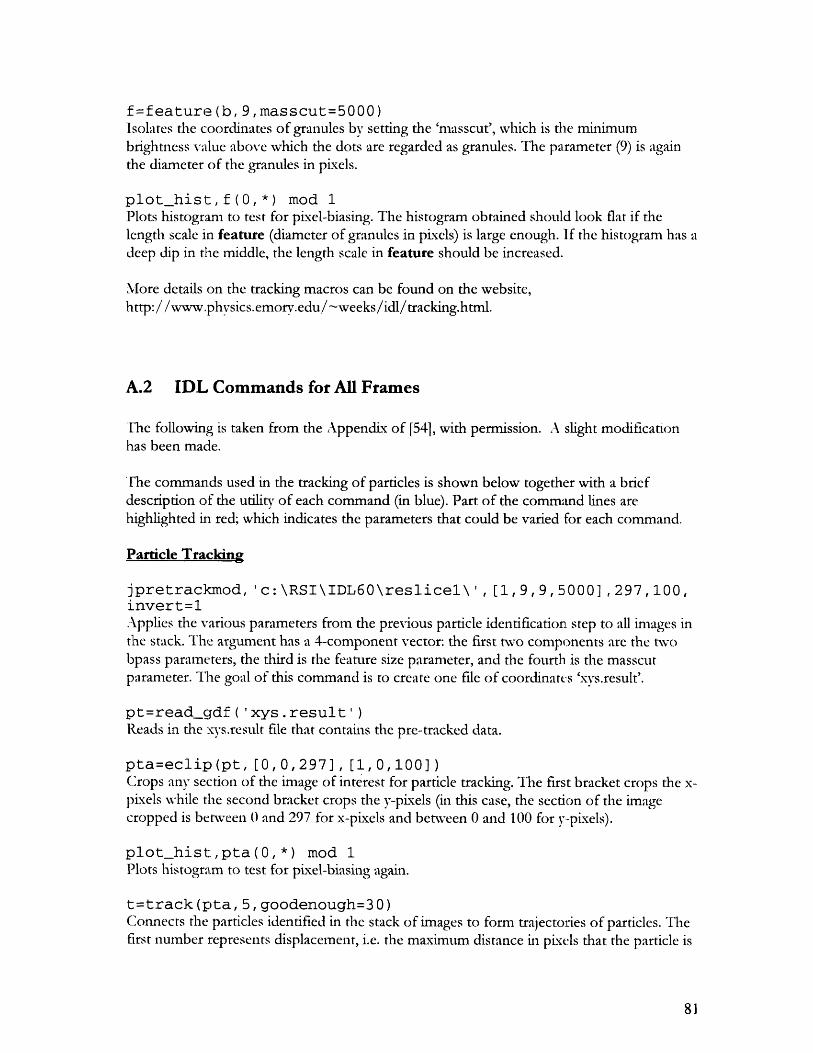
f=feature (b, 9,masscut=5000)Isolates the coordinates of granules by setting the 'masscut', which is the minimumbrightness value above which the dots are regarded as granules. The parameter (9) is againthe diameter of the granules in pixels.
plot_hist,f(0, *) mod 1Plots histogram to test for pixel-biasing. The histogram obtained should look flat if thelength scale in feature (diameter of granules in pixels) is large enough. If the histogram has adeep dip in the middle, the length scale in feature should be increased.
More details on the tracking macros can be found on the website,http: //www.phvsics.emorv.edu/-weeks/idl/tracking.html.
A.2 IDL Commands for All Frames
The following is taken from the Appendix of [54], with permission. A slight modificationhas been made.
The commands used in the tracking of particles is shown below together with a briefdescription of the utility of each command (in blue). Part of the command lines arehighlighted in red; which indicates the parameters that could be varied for each command.
Particle Tracking
jpretrackmod, 'c:\RSI\IDL60\reslicel\', [1,9,9,5000],297,100,invert=1Applies the various parameters from the previous particle identification step to all images inthe stack. The argument has a 4-component vector: the first two components are the twobpass parameters, the third is the feature size parameter, and the fourth is the masscutparameter. The goal of this command is to create one file of coordinates 'xys.result'.
pt=read_gdf ( 'xys. result ' )Reads in the xys.result file that contains the pre-tracked data.
pta=eclip(pt,[0,0,297],[1,0,100])(Crops any section of the image of interest for particle tracking. The first bracket crops the x-pixels while the second bracket crops the y-pixels (in this case, the section of the imagecropped is between 0 and 297 for x-pixels and between 0 and 100 for y-pixels).
plot_hist::,pta(0,*) mod 1Plots histogram to test for pixel-biasing again.
t=track (pta, 5, goodenough=30)Connects the particles identified in the stack of images to form trajectories of particles. Thefirst number represents displacement, i.e. the maximum distance in pixels that the particle is

expected to move between frames. "Goodenough" specifies the minimum duration for theparticle trajectory (in no. of frames) for it to be accepted as a valid trajectory.
write_gdf, t, ' track.resultCreates a file of coordinates 'track.result' that contains the individual trajectories.
write_textmod,t, 'result.txt'Writes the 'track.result' file in text format so that it can be opened in Excel.
plottr,t,goodenough=30Plots all the trajectories that are tracked for at the least the duration specified in"goodenough".
window, 1Opens a new window. Prevents particle-tracking video from being placed over the particletrajectory plot.
info=monitor_mod (t)Rearranges and extracts information out from the track.results file for part find_modlcommand below.
write_gdf, info, 'info.result'Creates a file of coordinates 'info.result' from the monitor_mod command above.
write_textmod,info,'info.txt'Writes the 'info.result' file in text format so that it can be opened in Excel.
part_find_modl,info, 30,797,297,100Animates each granule trajectory separately. Each granule is given a unique particleidentification (ID) number. Observation of the individual trajectory animation ensures thatthe granules do not exhibit directed motion and that the trajectory of each granule is notmistaken for that of neighboring granules that might cross its path. The first numberrepresents the "goodenough" value; The second number specifies the number of frames inthe stack of images tracked; while the third and fourth number denotes the number of x-pixels and y-pixels in the images respectively.
particle_IDs=part_input (62)After verifying and selecting the granules that satisfies all requirements for tracking, the IDInos of these granules are noted down and input back into the program with this command.The number (in this case 62) represents the total number of granule IDs that has beenchosen. After execution of the command, the program returns a commad asking the user toinput the ID nos of this particles one after another until all (62 in this case) IDs nos havebeen keyed in.
write_gdf,particle_IDs, 'particle_IDs.result'Creates a file of coordinates 'particle_IDs.result' which contain the particle ID nos that wasinput in the step above.

region_time_blocks_front,t,info,particle_Ids,30,O, 297,0,100,1,797,150This command generates the MSD for each granule selected in the steps above. The firstnumber represents the "goodenough" value, the second and third numbers specify thecropped x-pixel values, the fourth and fifth numbers denote the cropped V-pixel values, thefifth and sixth numbers specify the start and end frames for the MSD calculation, and thelast number indicates the interval (in no of frames) for each "MSD blocks. After execution,the command will return the MSD values at each time interval specified (in this case, 150frames, i.e. 5 s)
A.3 IDL Codes
The following section is taken directly from 1541, with permission.
T'he following section lists the codes used in the various IDL commands in section A. 1 andA.2. Most of the codes were either newly written or modified from their original form to suitthe particle tracking requirements for the present study.
A.3.1 bpass
; ********start of bpass.pro
; see http://www.physics.emory.edu/-weeks/idl; for further documentation
;NAME:; bpass;PURPOSE:; Implements a real-space bandpass filter which suppress; pixel noise and slow-scale image variations while; retaining information of a characteristic size.
;CATEGORY:; Image Processing;CALLING SEQUENCE:; res = dgfilter( image, Inoise, lobject);INPUTS:; image: The two-dimensional array to be filtered.; Inoise: Characteristic lengthscale of noise in pixels.; Additive noise averaged over this length should; vanish. MAy assume any positive floating value.; lobject: A length in pixels somewhat larger than a typical; object. Must be an odd valued integer.;OUTPUTS:; res: filtered image.;PROCEDURE:; simple 'wavelet' convolution yields spatial bandpass filtering.;NOTES:; MODIFICATION HISTORY:; Written by David G. Grier, The University of Chicago, 2/93.

; Greatly revised version DGG 5/95.;Added /field keyword JCC 12/95.; Revised & added 'stack','voxel' capability JCC 5/97.
; This code 'bpass.pro' is copyright 1997, John C. Crocker and; David G. Grier. It should be considered 'freeware'- and may be; distributed freely in its original form when properly attributed.
function bpass, image, Inoise, lobject, field = field, noclip=noclip
nf = n_elements(image(0,0,*))
;on_error, 2 ; go to caller on error
b = float( Inoise )w = round( Iobject > (2. * b) )N = 2*w + 1
r = (findgen( N ) - w)/(2. * b)xpt = exp( -rA2 )xpt = xpt / total(xpt)factor = (total(xptA2) - 1/N )
gx = xptgy = transpose(gx)
bx = fltarr(N) - 1./Nby = transpose(bx)
if keyword_set( field ) then beginif N mod 4 eq 1 then indx = 2*indgen(w+l)$
else indx = 1+ (2*indgen(w))gy = gy(indx)gy = gy/total(gy)
nn = n_elements(indx)by = fltarr(nn) - 1.Inn
endif
res = float(image); do x and y convolutionsfor i = O,nf-1 do begin
g = convol( float(image(*,*,i)), gx )g = convol( g, gy )
b = convol( float(image(*,*,i)), bx )b = convol( b, by)
res(*,*,i) = g-bendforif keywordset( noclip ) then $
return,res/factor $else $
return,res/factor > 0end;,** ....... end of bpass.pro

A.3.2 eclip
; eclip Eric Weeks, 9-22-98; see http://glinda.lrsm.upenn.edu/-weeks/idl/
function eclip,data,fl ,f2,f3,f4,f5,f6,invert=invert; data in form (*,*)
;datanew=eclip(data,[A,B,C]); w=where(data(A,*) ge B and data(A,*) le C);datanew=data(*,w)
if (keyword_set(inrvert)) then flag=lindgen(n_elements(data(0,*)))
s:=size(fl )if (s(1) gt 1) then begin
w=where((data(fl (0),*) ge f 1(1)) and (data(f 1(0),*)) le f 1(2),nw)if (nw gt 0) then begin
result=data(*,w)if keyword set(invert) then flag=flag(w)
endifendifs=size(f2)if (s(1) gt 1) then begin
w=where((result(f2(0),*) ge f2(1)) and (result(f2(0),*)) le f2(2),nw)if (nw gt 0) then beginresult=result(*,w)if keyword_set(invert) then flag=flag(w)endif
endifs=size(f3)if (s(1) gt 1) then begin
w=where((result(f3(0),*) ge f3(1)) and (result(f3(0),*)) le f3(2),nw)result=result(*,w)if keywordset(invert) then flag=flag(w)s=size(f4)if (s(1) gt 1) then begin
w=where((result(f4(0),*) ge f4(1)) and (result(f4(0),*)) le f4(2),nw)if (nw gt 0) then begin
result=result(*,w)if keyword_set(invert) then flag=flag(w)
endifendifs=size(f5)if (s(1) gt 1) then begin
w=where((result(f5(0),*) ge f5(1)) and (result(f5(0),*)) le f5(2),nw)if (nw gt 0) then begin
result=result(*,w)if keywordset(invert) then flag=flag(w)
endifendifs=size(f6)if (s(1) gt 1) then begin
w=where((result(f6(0),*) ge f6(1)) and (result(f6(0),*)) le f6(2),nw)if (nw gt 0) then begin

result=result(*,w)if keyword_set(invert) then flag=flag(w)
endifendif
endif
if (keyword_set(invert)) then beginflag2=lindgen(n elements(data(O,*)))flag2(flag) = -1w=where(flag2 ge 0)result=data(*,w)
endif
return,resultend
A.3.3 feature
;see http://www.physics.emory.edu/-weeks/idl; for more information
;NAME:Feature
;PURPOSE:Finds and measures roughly circular 'features' withinan image.
;CATEGORY:Image Processing
;CALLING SEQUENCE:f = feature( image, diameter [, separation, masscut = masscut,
min = min, iterate = iterate, /field, /quiet ]);INPUTS:
image: (nx,ny) array which presumably contains somefeatures worth finding
diameter: a parameter which should be a little greater thanthe diameter of the largest features in the image.Diameter MUST BE ODD valued.
separation: an optional parameter which specifies theminimum allowable separation between featurecenters. The default value is diameter+l.
masscut:Setting this parameter saves runtime by reducing theruntime wasted on low mass 'noise' features.
min: Set this optional parameter to the minimum allowedvalue for the peak brightness of a feature. Usefulfor limiting the number of spurious features innoisy images.
field: Set this keyword if image is actually just one fieldof an interlaced (e.g. video) image. All the maskswill then be constructed with a 2:1 aspect ratio.
quiet: Supress printing of informational messages.iterate: if the refined centroid position is too far from
the initial estimate, iteratively recalc. the centroid

;OUTPUTS:
SIDE EFFE
using the last cetroid to position the mask. Thiscan be useful for really noisy data, or data withflat (e.g. saturated) peaks. Use with caution- itmay 'climb' hills and give you multiple hits.
f(O,*): this contains the x centroid positions, in pixels.f(1,*): this contains the y centroid positions, in pixels.f(2,*): this contains the integrated brightness of the
features.f(3,*): this contains the square of the radius of gyration
of the features.f(4,*): this contains the eccentricity, which should be
zero for circularly symmetric features and orderone for very elongated images.
CTS:Displays the number of features found on the screen.
RESTRICTIONS:To work properly, the image must consist of bright,circularly symmetric regions on a roughly zero-valuedbackground. To find dark features, the image should beinverted and the background subtracted. If the imagecontains a large amount of high spatial frequency noise,performance will be improved by first filtering the image.BPASS will remove high spatial frequency noise, andsubtract the image background and thus provides a goodcomplement to using this program. Individual featuresshould NOT overlap.
PROCEDURE:First, identify the positions of all the local maxima inthe image (defined in a circular neighborhood with diameterequal to 'diameter' ). Around each of these maxima, place acircular mask, of diameter 'diameter', and calculate the x & ycentroids, the total of all the pixel values, and the radiusof gyration and the 'eccentricity' of the pixel values withinthat mask. If the initial local maximum is found to be morethan 0.5 pixels from the centroid and iterate is set, the maskis moved and the data are re-calculated. This is useful fornoisy data. If the restrictions above are adhered to, and thefeatures are more than about 5 pixels across, the resulting xand y values will have errors of order 0.1 pixels forreasonably noise free images.
**....*.. READ THE FOLLOWING IMPORTANT CAVEAT! **********'feature' is capable of finding image features with sub-pixelaccuracy, but only if used correctly- that is, if thebackground is subtracted off properly and the centroid maskis larger than the feature, so that clipping does not occur.It is an EXCELLENT idea when working with new data to plota histogram of the x-positions mod 1, that is, of thefractional part of x in pixels. If the resulting histogramis flat, then you're ok, if its strongly peaked, then you'redoing something wrong- but probably still getting 'nearestpixel' accuracy.
For a more quantitative treatment of sub-pixel positionresolution see:

J.C. Crocker and D.G. Grier, J. Colloid Interface Sci.*179*", 298 (1996).
;MODIFICATION HISTORY:This code is inspired by feature_stats2 written by
David G. Grier, U of Chicago, 1992.Written by John C. Crocker, U of Chicago, optimizing
runtime and measurement error, 10/93.Added field keyword, 4/94.Added eccentricity parameter, 5/95.Added quiet keyword 12/95.Added iteration, fixed up the radius/diameter fiasco anddid some debugging which improves non-centroid data. 4/96.
This code 'feature.pro' is copyright 1997, John C. Crocker andDavid G. Grier. It should be considered 'freeware'- and may bedistributed freely in its original form when properly attributed.
produce a parabolic mask
function rsqd,w,h
if n_params() eq 1 then h = wr2 = fltarr(w,h,/nozero)xc = float(w-1) /2.yc = float(h-1) / 2.x = (findgen(w) - xc)x = x^2y = (findgen(h)- yc)y = yA2
for j = 0, h-1 do beginr2(*,j) = x + y(j)
endfor
return,r2end
produce a 'theta' mask
function thetarr,w
theta = fltarr(w,w,/nozero)xc = float(w-1) / 2.yc = float(w-1) / 2.
x = (findgen(w) - xc)x(xc) = le-5y = (findgen(w) - yc)for j = 0, w-1 do begin
theta(*,j) = atan( y(j),x)endfor
return,thetaend

This routine returns the even or odd field of an image
function fieldof,array,odd=odd,even=even
sz = size(array)if sz(O) ne 2 then message,"Argument must be a two-dimensional array!"if keyword_set(odd) then f=1 else f=O
ny2 = fix( (sz(2)+(1-f))/2 )rows = indgen(ny2)*2 + freturn,array(*,rows)
end
barrel "shifts" a floating point arr by a fractional pixel amount,by using a 'lego' interpolation technique.
function fracshift,im,shiftx,shifty
ipx = fix( shiftx )ipy = fix( shifty )fpx = shiftx - ipxfpy = shifty - ipyif fpx It 0 then begin
fpx=fpx+l & ipx=ipx-1endifif fpy It 0 then begin
fpy=fpy+l & ipy=ipy-1endif
image = im
imagex = shift( image,ipx+l,ipy)imagey = shift( image,ipx ,ipy+l )imagexy = shift( image,ipx+l ,ipy+1 )image = shift( image,ipx ,ipy)
res =((1. - fpx) * (1. - fpy) * image ) + $((fpx)*(1. -fpy)* imagex)+ $( (1.- fpx) * (fpy) * imagey ) + $( (fpx) * (fpy) * imagexy)
return,resend
John's version of local_max2, which supports the field keywordand is otherwise identical.
function Imx, image, sep, min = min, field = field
range = fix(sep/2)a = bytscl(image)w = round( 2 * range + 1 ) ; width of sample regions = rsqd( w ) ; sample region is circulargood = where( s le rangeA2 )mask = bytarr( w, w )

mask(good) = lbyrange = rangeif keyword_set( field ) then begin
mask = fieldof( mask, /even )yrange = fix(range/2.) +1
endif
b = dilate( a, mask, /gray) ;find local maxima in given range; but don't include pixels from the
; background which will be too dimif not keyword_set( min ) then begin
h = histogram( a )for i = 1, n_elements(h) - 1 do $
h(i) = h(i) + h(i-1)h = float( h ) / max( h )min = 0while h(min) It 0.64 do $min = min + 1min = min + 1endif
r = where( a eq b and a ge min )
; Discard maxima within range of the edgesz = size( a)nx = sz(1) & ny = sz(2)x = r mod nx & y = r / nxxO = x - range & xl = x + rangeyO = y - yrange & yl = y + yrangegood = where( x0 ge 0 and xl It nx and yO ge 0 and yl It ny,ngood )if ngood It 1 then $
return,[-1]r = r(good)x = x(good) & y = y(good)xO = x0(good) & xl = xl(good)yO = y0(good) & yl = yl (good)
; There may be some features which get; found twice or which have flat peaks; and thus produce multiple hits. Find; and clear such spurious points.
c = Ob * ac(r) = a(r)center = w * yrange + rangefor i = OD, n_elements(r) - 1D do begin
b = c(x0(i):xl (i),yO(i):yl (i))b = b * mask ; look only in circular regionm = max( b, location )if location ne center then $
c(x(i),y(i)) = Obendfor
; Ideally, the above routine would shrink; clusters of points down to their center.; As written, this will leave the lower; right (?) pixel of a cluster.
r = where( c ne 0) ; What's left are valid maxima.
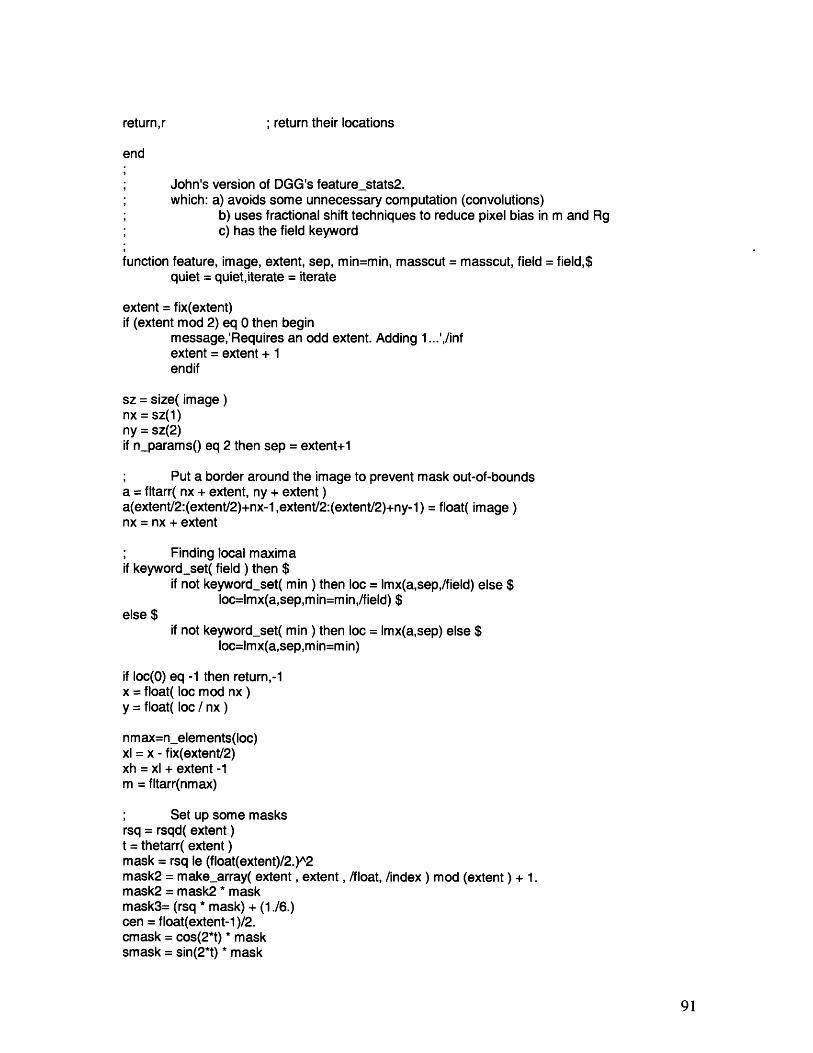
; return their locations
end
John's version of DGG's feature_stats2.which: a) avoids some unnecessary computation (convolutions)
b) uses fractional shift techniques to reduce pixel bias in m and Rgc) has the field keyword
function feature, image, extent, sep, min=min, masscut = masscut, field = field,$quiet = quiet,iterate = iterate
extent = fix(extent)if (extent mod 2) eq 0 then begin
message,'Requires an odd extent. Adding 1...',/infextent = extent + 1endif
sz = size( image)nx = sz(1)ny = sz(2)if n_params() eq 2 then sep = extent+1
Put a border around the image to prevent mask out-of-boundsa = fltarr( nx + extent, ny + extent )a(extent/2:(extent/2)+nx-1 ,extent/2:(extent/2)+ny-1) = float( image)nx = nx + extent
Finding local maximaif keyword_set( field ) then $
if not keyword_set( min ) then loc = Imx(a,sep,/field) else $loc=lmx(a,sep,m in=m in,/field) $
else $if not keyword_set( min ) then loc = Imx(a,sep) else $
loc=lmx(a,sep,min=m in)
if loc(0) eq -1 then return,-1x = float( loc mod nx )y = float( loc / nx )
nmax=n_elements(loc)xl = x - fix(extent/2)xh = xl + extent -1m = fltarr(nmax)
Set up some masksrsq = rsqd( extent)t = thetarr( extent)mask = rsq le (float(extent)/2.)^2mask2 = make_array( extent, extent , /float, /index) mod (extent) + 1.mask2 = mask2 * maskmask3= (rsq * mask) + (1./6.)cen = float(extent-1)/2.cmask = cos(2*t) * masksmask = sin(2*t) * mask
return,r

cmask(cen,cen) = 0.smask(cen,cen) = 0.
Extract fields of the masks, if necessaryif keyword_set( field ) then begin
suba = fltarr(extent , fix(extent/2) , nmax)mask = fieldof(mask,/odd)xmask = fieldof(mask2,/odd)ymask = fieldof(transpose(mask2),/odd)mask3 = fieldof(mask3,/odd)cmask = fieldof(cmask,/odd)smask = fieldof(smask,/odd)
halfext = fix( extent /2 )yl = y - fix(halfext/2)yh = yl + halfext -1yscale = 2ycen = cen/2
endif else beginsuba = fltarr(extent, extent, nmax)xmask = mask2ymask = transpose( mask2)
yl = y - fix(extent/2)yh = yl + extent -1yscale = 1ycen = cen
endelse
; Estimate the massfor i=0,nmax-1 do m(i) = total( a(xl(i):xh(i),yl(i):yh(i)) * mask )
if keyword_set( masscut ) then beginw = where( m gt masscut, nmax)if nmax eq 0 then begin
message,'No features found!',/infreturn,-1
endifxl = xl(w)xh = xh(w)yl = yl(w)yh = yh(w)x = x(w)y = y(w)m = m(w)
endif
if not keyword_set(quiet) then message, strcompress( nmax ) + 'features found.',/inf
Setup some result arraysxc = fltarr(nmax)yc = fltarr(nmax)rg = fltarr(nmax)e = fltarr(nmax)
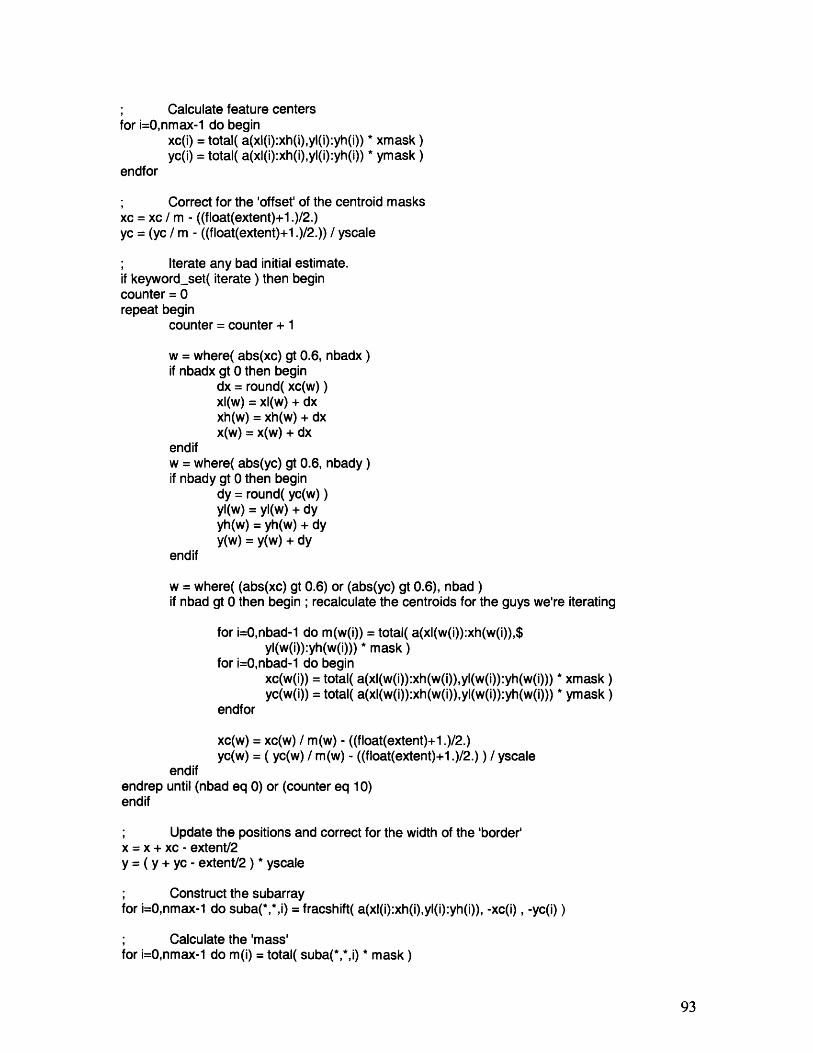
Calculate feature centersfor i=O,nmax-1 do begin
xc(i) = total( a(xl(i):xh(i),yl(i):yh(i)) * xmask )yc(i) = total( a(xl(i):xh(i),yl(i):yh(i)) * ymask )
endfor
Correct for the 'offset' of the centroid masksxc = xc / m - ((float(extent)+1.)/2.)yc = (yc / m - ((float(extent)+1.)/2.)) / yscale
Iterate any bad initial estimate.if keyword_set( iterate ) then begincounter = 0repeat begin
counter = counter + 1
w = where( abs(xc) gt 0.6, nbadx )if nbadx gt 0 then begin
dx = round( xc(w))xl(w) = xl(w) + dxxh(w) = xh(w) + dxx(w) = x(w) + dx
endifw = where( abs(yc) gt 0.6, nbady)if nbady gt 0 then begin
dy = round( yc(w))yl(w) = yl(w) + dyyh(w) = yh(w) + dyy(w) = y(w) + dy
endif
w = where( (abs(xc) gt 0.6) or (abs(yc) gt 0.6), nbad )if nbad gt 0 then begin ; recalculate the centroids for the guys we're iterating
for i=0,nbad-1 do m(w(i)) = total( a(xl(w(i)):xh(w(i)),$yl(w(i)):yh(w(i))) * mask )
for i=0,nbad-1 do beginxc(w(i)) = total( a(xl(w(i)):xh(w(i)),yl(w(i)):yh(w(i))) * xmask )yc(w(i)) = total( a(xl(w(i)):xh(w(i)),yl(w(i)):yh(w(i))) * ymask )
endfor
xc(w) = xc(w) / m(w) - ((float(extent)+1 .)/2.)yc(w) = ( yc(w) / m(w) - ((float(extent)+1.)/2.)) / yscale
endifendrep until (nbad eq 0) or (counter eq 10)endif
Update the positions and correct for the width of the 'border'x = x + xc - extent/2y = ( y + yc - extent/2) * yscale
Construct the subarrayfor i=0,nmax-1 do suba(*,*,i) = fracshift( a(xl(i):xh(i),yl(i):yh(i)), -xc(i) , -yc(i) )
Calculate the 'mass'for i=0,nmax-1 do m(i) = total( suba(*,*,i) * mask)

Calculate radii of gyration squaredfor i=0,nmax-1 do rg(i) = total( suba(*,*,i) * mask3) / m(i)
Calculate the 'eccentricity'for i=0,nmax-1 do e(i) = sqrt(( total( suba(*,*,i) * cmask )A2 ) +$
(total( suba(*,*,i) * smask )A2 )) / (m(i)-suba(cen,ycen,i)+le-6)
params = [transpose(x),transpose(y),transpose(m),transpose(rg),transpose(e)]return,paramsend
A.3.4 fover2d
;function fover2d,image,points,radius=radius,big=big,nodot=nodot,circle=circle
; see http://www.physics.emory.edu/~weeks/idl; for more information and software updates
;NAME:fover2d
;PURPOSE:Overlay points onto a 2d image.
;CALLING SEQUENCE:newimage=foverlay,image,points
;INPUTS:image: 2D data set onto which the points should be overlaidpoints: (2,npoints) array of overlay points
;OUTPUTS:returns an image ready for 'tv'. The color paletteis adjusted to be the foverlay palette. Redraws screen.
;KEYWORDS:radius sets size of circles
/big doubles the picture in size in each direction/nodot turns off the black dot at the center of each circle/circle draws a circle around each point, rather than a disk
;PROCEDURE:Rescale the image to leave some color table indices free.Make the rest of the color table into a grey ramp andturn the 3 highest indices into 3 new colors. Plot adisk at each particle position.
;MODIFICATION HISTORY:Lookup table code taken from David G. Grier's f_overlayroutine. Mostly written by Eric Weeks in summer '98.Ability to handle movies added 2-20-99.
;First a utility function....; circarray.pro, started 6-22-98 by ERW; shortened into fo_circ 2-20-99 by ERW
function fo_circ,array,radius=radius,center=center,circle=circle; returns an array, size equal to "array" variable, with value 1; everywhere within a circle of diameter of the array size. Circle; is at center of array.
;'radius' sets a radius different from the default radius (half the array size)

; 'center' overrides the default center of the circle
s=size(array)result=array*0
sx=s(1) & sy=s(2)minsize = (sx < sy)cx=(sx-1)*0.5 & cy=(sy-1)*0.5if keyword_set(center) then begin
cx=center(0)cy=center(1)
endifif keyword_set(radius) then begin
irad=radiusendif else begin
irad=m insize/2endelsejrad=(irad-1.2)*(irad-1.2)irad = irad*iradif (keyword_set(circle)) then begin
for j=O,sy-1 do beginrad2 = (cy-j)*(cy-j)for k=0,sx-1 do begin
rad3 = rad2 + (cx-k)*(cx-k)result(k,j) = ((rad3 le irad) and (rad3 ge jrad))
endforendfor
endif else beginfor j=O,sy-1 do begin
rad2 = (cy-j)*(cy-j)for k=0,sx-1 do begin
rad3 = rad2 + (cx-k)*(cx-k)result(k,j) = (rad3 le irad)
endforendfor
endelse
return,resultend
function fover2d,image,points,radius=radius,big=big,nodot=nodot,circle=circleif not keyword set(radius) then radius=5if (not keyword_set(nodot)) then nodot=0if not keyword_set(circle) then begin
circle=0endif else begin
nodot=1endelse
nc = !d.tablesizeif nc eq 0 then message,'Device has static color tables: cannot adjust'red = byte(indgen(nc))green = redblue = redgreen(nc-1) = Ob;blue(nc-1)=128b

tvlct,red,green,blue
output = byte ( ((image*0.98) mod (nc-5)) + floor(image / (nc-5))*256)x=reform (points(O,*))y=reform(points(1 ,*))s = size(output)if (s(O) eq 3) then begin
; 3-D arraynel=n_elements(points(*,O))t = reform(points(nel-1,*))tmax=max(t,min=tmin)
endifif (keyword_set(big)) then begin
if (s(O) eq 2) then beginoutput=rebin(output,s(1)*2,s(2)*2); 2-D array
endif else beginoutput=rebin(output,s(1 )*2,s(2)*2,s(3)); 3-D array
endelsex=x*2&y=y*2
endifx2=n_elements(output(*,0,0)) ; 3rd array index just for safetyy2=n_elements(output(0,*,0))w=where((x ge 0) and (x It x2))x=x(w) & y=y(w)w=where((y ge 0) and (y It y2))x=x(w) & y=y(w)
for i = 0,n_elements(x)-1 do beginminx = long((x(i)-radius) > 0)miny = long((y(i)-radius) > 0)maxx = long((x(i)+radius) < (x2-1))maxy = long((y(i)+radius) < (y2-1))foo=[x(i)-minx,y(i)-miny]blob=fo_circ(output[minx:maxx,miny:maxy], $
center=foo,radius=radius,circle=circle)blob = (blob < 1) * (nc - 1 b)if (s(0) eq 2) then begin
;2-D imageoutput(minx:maxx,miny:maxy) = $
output(minx:maxx,miny:maxy) > blobif (nodot eq 0) then begin
if (x(i) gt 1) and (x(i) It (x2-1)) then $output(x(i)-1 :x(i)+1,y(i))=Ob
if (y(i) gt 1) and (y(i) It (y2-1)) then $output(x(i),y(i)-1:y(i)+1)=0b
endifendif else begin
; 3-D imagetnow=t(i)-tminoutput(minx:maxx,miny:maxy,tnow) = $
output(minx:maxx,m iny:maxy,tnow) > blobif (nodot eq 0) then begin
if (x(i) gt 1) and (x(i) It (x2-1)) then $output(x(i)-l:x(i)+l,y(i),tnow)=0b
if (y(i) gt 1) and (y(i) It (y2-1)) then $output(x(i),y(i)-1 :y(i)+1 ,tnow)=Ob

endifendelse
endfor
tv,outputreturn, outputend
A.3.5 jpretrackmod
;see http://www.physics.emory.edu/-weeks/idl; for more information
; dead simple routine to analyse 2+1d 'stacks' into trackable files; whammy = [Inoise,extentl ,extent2,masscut]
; ppretrack -- Peter's version (begun 7/8/97);jpretrack -- John's version (begun 7/8/98)
pro jpretrackmod,name,whammy,horpix,verpix,invert=invert,field=field,first=firstfskip=fskip,$gdf=gdf
if n_elements(whammy) ne 4 then $message,'usage: pretrack,fname,[Inoise,extentl ,extent2,masscut],invert=invert,field=field'
Inoise = whammy(0)extent1 = whammy(1)extent2 = whammy(2)masscut = whammy(3)
filetotal = findfile(name +'*.tif')if filetotal(0) eq " then message,"No file '"+name+"' found"ns = n_elements(filetotal)
filen=strarr(ns)
if (ns gt 1000) then beginfor k=1000,ns-1 do begin
I=string(k)m=strcompress(l,/remove_all)filen(k)=findfile(name +'frame'+ m + '.tif')
endforfor k=100,999 do begin
I=string(k)m=strcompress(l,/remove_all)filen(k)=findfile(name +'frameO'+ m + '.tif')
endforfor k=10,99 do begin
I=string(k)m=strcompress(I,/remove_all)filen(k)=findfile(name +'frame00'+ m + '.tif')
endfor

for k=0,9 do beginI=string(k)m=strcompress(l,/remove_all)filen(k)=findfile(name +'frame000'+ m + '.tif')
endforendif else begin
if (ns gt 100) then beginfor k=100,ns-1 do begin
I=string(k)m=strcompress(I,/removeall)filen(k)=findfile(name +'frameO'+ m + '.tif')
endforfor k=10,99 do begin
I=string(k)m=strcompress(l,/removeall)filen(k)=findfile(name +'frame00'+ m + '.tif')
endforfor k=0,9 do begin
I=string(k)m=strcompress(l,/remove all)filen(k)=findfile(name +'frame000'+ m + '.tif')
endforendif else begin
for k=10,ns-1 do beginI=string(k)m=strcompress(l,/removeall)filen(k)=findfile(name +'frame00'+ m + '.tif')
endforfor k=0,9 do begin
I=string(k)m=strcompress(l,/remove all)filen(k)=findfile(name +'frame000'+ m + '.tif')
endforendelse
endelse
; fskip is the frame/field # increment during time lapse videoif not keywordset(fskip) then fskip=1
stk=bytarr(horpix,verpix,ns)
for j=0,ns-1 do begin
print,'reading image stack: '+filen(j)if keyword_set(gdf) then stk = read_gdf(filen(j)) else $
frame = read_nih(filen(j))if keyword_set(invert) then frame = 255b-framestk(*,*,j)=framens = n_elements(stk(0,0,*))
endforss=size(stk(*,*,0))sx = ss(1)
if keyword_set(first) then ns = 1 ;handy for a quick looksee...
res = fltarr(6)

if keyword_set(field) then beginfor i = O,ns-1 do beginprint,'processing fields of frame'+strcom press(i)+' out of'+$
strcompress(ns)+'....'irn = bpass(fieldof(stk(*,*,i)),lnoise,extentl ,/field)f = feature(im(2*extentl :sx-2*extentl ,*),extent2,masscut = masscut,/field)if f(O) ne -1 then begin
f(O,*,*) = f(O,*,*)+2*extentlnf = n_elements(f(O,*))res = [[res],[f,fltarr(1 ,nf)+2*i*fskip]]
endifirn = bpass(fieldof(stk(*,*,i)),lnoise,extentl ,/field)f = feature(im(2*extentl :sx-2*extentl ,*),extent2,masscut = masscut,/field)if f(O) ne -1 then begin
f(O,*,*) = f(O,*,*)+2*extentlf(1,*) = f(1,*)+1nf = n_elements(f(O,*))res = [[res],[f,fltarr(1 ,nf)+2*i*fskip+1]]
endifendfor
endif else beginfor i = O,ns-1 do beginprint,'processing frame'+strcom press(i)+' out of'+$
strcompress(ns)+'....'irn = bpass(stk(*,*,i),lnoise,extentl)f = feature(im,extent2,masscut = masscut)rf = n_elements(f(O,*))if (f(O) ne -1) then res = [[res],[f,fltarr(1 ,nf)+i*fskip]]endfor
endelse
wname = 'xys.result'print,'writing output file to:' + wnamewrite_gdf,res(*,1 :*),wname
end
A.3.6 monitor mod
function monitor_mod,tsz=size(t)nrows=sz(2,0)extract=extrac(t,6,0, 1,n_rows)max_track=max(extract)max_track_int=uint(max_track)info=fltarr(7,max__track_int+1)for i=O,max_track_int do begin
w=where(t(6,*) eq i)nf=n_elements(w)first_frame=w(O)info(O, i)=t(O,first_frame)info( 1,i)=t(1 ,first_frame)info(2, i)=t(4,first_frame)info(3,i)=nfinfo(4, i)=t(5,first_frame)+1

info(5,i)=info(4,i)+nf-1info(6, i)=t(6,first_frame)
endforreturn,infoend
A.3.7 part_find_modl
pro part_find_modl ,info,goodenough,total_frames,xpixel,ypixel
for i=l,total_frames-goodenough+l1 do beginp=string(i)w=where (info(4,*) eq i)sz=size(w)type=sz(0,0)
if type ne 0 then beginn=n_elements(w)for j=0,n-1 do begin
print,'start frame = '+pparticle_no=w(j)s=info(4,particle_no)-1frame_no=long(s)
if (frame_no It 10) then beginI=string(frame_no)m=strcompress(I,/remove_all)no='000'+ma=read_nih('c:\RSI\IDL60\reslicel \frame'+no+'.tif')tvscl,a
endif
if (frame_no ge 10) and (frame_no It 100) then beginI=string(frame_no)m=strcompress(I,/remove_all)no='00'+ma=read_nih('c:\RSI\I DL60\reslicel \frame'+no+'.tif')tvscl,a
endif
if (frame_no ge 100) and (frame_no It 1000) then beginI=string(frame_no)m=strcompress(I,/remove_all)no='0'+ma=read_nih('c:\RSI\lDL60\reslicel \frame'+no+'.tif')tvscl,a
endif
if (frame_no ge 1000) then beginI=string(frame_no)m=strcompress(I,/remove_all)no=ma=read_nih('c:\RSI\IDL60\reslicel \frame'+no+'.tif')tvscl,a
100

endif
fo=fover2d(a, info(*,particle_no),/circle,rad=7)d=long(info(5,particleno))end_frame=string(d)particle_info=string(particle_no)print,'end frame= '+end_frameprint,'particle no= '+particle_infono_f ram es=info(3, particle_no)
if no_frames ge 230 then no_frames=230
base = WIDGET_BASE(TITLE = 'Animation Widget')animate = CW_ANIMATE(base, xpixel, ypixel, no_frames,/track)WIDGET_CONTROL, /REALIZE, basefor k=0,no_frames-1 do beginif (frame_no It 10) then begin
I=string(frame_no)m=strcompress(I,/remove_all)no='000'+ma=read_nih('c:\RSI\lDL60\reslicel \frame'+no+'.tif')CW_ANIMATE_LOAD, animate, FRAME=k, IMAGE=a
endif
if (frame_no ge 10) and (frame_no It 100) then beginI=string(frame_no)m=strcompress(I,/remove_all)no='00'+ma=read_nih('c:\RSI\1DL60\reslicel \frame'+no+'.tif')CW_ANIMATE_LOAD, animate, FRAME=k, IMAGE=a
endif
if (frame_no ge 100) and (frame_no It 1000) then beginI=string(frame_no)m=strcompress(I,/remove_all)no='0'+ma=read_nih('c:\RSI\lDL60\reslicel \frame'+no+'.tif')CW_ANIMATE_LOAD, animate, FRAME=k, IMAGE=a
endif
if (frame_no ge 1000) then beginI=string(frame_no)m=strcompress(I,/remove_all)no=ma=read_nih('c:\RSI\IDL60\reslicel \frame'+no+'.tif')CW_ANIMATE_LOAD, animate, FRAME=k, IMAGE=a
endif
frame_no=frame_no+l
endfor
CW_ANIMATE_RUN, animate,40XMANAGER, 'CW_ANIMATE Demo', base, EVENT_HANDLER = 'EHANDLER'
prom="
101

read, prom
endforendif
endforend
A.3.8 part_input
function part_input,no_particle
particles=intarr(no_particle)for i=1,no_particle do begin
read,aparticles(i-1 )=a
endfor
return, particles
end
A.3.9 plot_hist; plothist
; see http://www.physics.emory.edu/-weeks/idl;for more information and software updates
; A user-friendly way to plot roughly normal distributed histograms; easily with optional gaussian fits.; The relevant data can be returned with the optional parameter 'data'; and coff. set number of terms in fit (must be 3 or more) using nterms
; original version by John C. Crocker; slightly revised, Feb '99, Eric R. Weeks; /log added 2-23-99
pro plothist,d,data,coff,nterms=nterms,fit=fit,xrange=xrange,binsize=binsize,$noplot=noplot,oplot=oplot,jitter = jitter,center=center,log=log
if keyword_set(fit) then center=1; ERW 2-22-99if not keyword_set(jitter) then jitter = 0if keyword_set(nterms) then begin
if (nterms It 3 or nterms gt 6) then beginprint,'Resetting nterms to 6. nterms must be 3, 4, 5, or 6! See gaussfit.'nterms = 6
endifendifif not keyword_set(nterms) then nterms = 3
; don't know why, just gotta do itdata = float(d)
; get a little info about the distributionn=n_elements(data)
102

logn=alogl 0(n)min = min(data,max=max)stdev = stdev(data,mean)min = min([min,mean-(6*stdev)])max = max([max,mean+(4*stdev)])if keyword_set(xrange) then begin
min = xrange(0)max = xrange(1)w=where(data ge min and data le max,ndata)logn = alog 0(ndata)stdev=stdev(data(w))
endif
; calculate a nice binsize if the user doesn't give us oneif not keyword._set(binsize) then begin
binsize=stdev/Iogn; reduce the binsize slightly so that its either 1,2 or 5 times a power of tenlogbin=alogl 0(binsize)fp = (logbin-fix(logbin))ip = fix(logbin)if (fp It 0) then begin
fp = fp+1 & ip = ip-1endifcoeff = 10 (fp)if (coeff It 2) then fp = 0if (coeff ge 2) AND (coeff It 5) then fp = alog10(2)if (coeff ge 5) then fp = alog10(5)binsize = 10A(float(ip + fp))
endif
; adjust the min value down so that 0 is at the center of a partitionminbin = long(min/binsize)if minbin It 0 then minbin = minbin-1min = minbin * binsizeif (keyword_set(center) and (not keyword_set(xrange))) then xrange=[min,max]
; oh yeah, calculate the histogramhist = histogram(data,binsize=binsize,m in=m inin-(binsize*jitter),max=max+binsize*jitter)
; pad out the hist with a zero so the plot doesn't hang in the air!hist=[hist,[0]]np = n_elements(hist)
; make an 'x' vector for the plot and the fitx = (findgen(np)*binsize) + min - (binsize*jitter)
if (not keyword_set(center)) then beginw=where(hist gt 0,nw)minw=w(0) > 1maxw=w(nw-1) < (n_elements(hist)-2)hist=hist(minw-1 :maxw+l )x=x(minw-1:maxw+1)
endif; plot the histogramif not keyword_set(noplot) then begin
if keyword_set(oplot) then begin
103

oplot,x,hist,psym=10endif else begin
w=where(hist gt 0)if (keyword_set(xrange)) then begin
if (keyword_set(log)) then beginplot,x(w),hist(w),xrange=xrange,psym=4,/ylog
endif else beginplot,x, hist,xrange=xrange,psym=10
endelseendif else begin
if (keyword_set(log)) then beginplot,x(w),hist(w), psym =4,/ylog
endif else beginplot,x,hist,psym=l 0
endelseendelse
endelseendifdata = [transpose(x),transpose(hist)]
; do the fit, if desiredif keyword_set(fit) then begin
ft = gaussfit(x,hist,coff,nterms=nterms)data = [transpose(x),transpose(hist),transpose(ft)]if not keyword_set(noplot) then begin
oplot,x,ft,linestyle=3dy = !y.crange(1)-!y.crange(0)dx = !x.crange(1)-!x.crange(0)yy = !y.crange(0)xx = !x.crange(0)if (keyword_set(log)) then begin
xyouts, xx + (dx*0.15), 10(yy + (dy*.90)), "Height = "+$strcompress(string(coff(O),format='(g9.4)')) ,alignment=0.5
xyouts, xx + (dx*0.15), 10A(yy + (dy*.85)), "Offset = "+$strcom press(string(coff(1 ),format='(g9.4)')) ,alignment=0.5
xyouts, xx + (dx*0.15), 1 OA(yy + (dy*.80)), "Sigma = "+$strcompress(string(coff(2),format='(g9.4)')) ,alignment=0.5
endif else beginxyouts, xx + (dx*0.15), yy + (dy*.90), "Height = "+$
strcom press(string(coff(0),format='(g9.4)')) ,alignment=0.5xyouts, xx + (dx*0.15), yy + (dy*.85), "Offset = "+$
strcompress(string(coff(1 ),format='(g9.4)')) ,alignment=0.5xyouts, xx + (dx*0.15), yy + (dy*.80), "Sigma = "+$
strcom press(string(coff(2),form at='(g9.4)')) ,alignment=0.5endelseif (nterms gt 3) then begin
if (keyword_set(log)) then beginxyouts, xx + (dx*0.15), 10^(yy + (dy*.75)), "Polynomial:" ,alignment=0.5xyouts, xx + (dx*0.15), 10^(yy + (dy*.70)), $
strcom press(string(coff(3),format='(gl 0.4)')) ,alignment=0.5endif else begin
xyouts, xx + (dx*0.15), yy + (dy*.75), "Polynomial:" ,alignment=0.5xyouts, xx + (dx*0.15), yy + (dy*.70), $
strcom press(string(coff(3),format='(g 10.4)')) ,alignment=0.5endelse
104

if (nterms gt 4) then beginif (keyword_set(log)) then begin
xyouts, xx + (dx*0.15), 10O(yy + (dy*.65)), "+ "+$strcompress(string(coff(4),format='(g9.4)'))+" x" ,alignment=0.5endif else begin
xyouts, xx + (dx*0.15), yy + (dy*.65), "+ "+$strcompress(string(coff(4),format='(g9.4)'))+" x" ,alignment=0.5endelse
if (nterms gt 5) then beginif (keywordset(log)) then begin
xyouts, xx + (dx*0.15), 10^(yy + (dy*.60)), "+ "+$strcompress(string(coff(5),format='(gl 0.4)'))+" xA2" ,alignment=0.5endif else begin
xyouts, xx + (dx*0.15), yy + (dy*.60), "+ "+$strcompress(string(coff(5),format='(g10.4)'))+" xA2" ,alignment=0.5endelse
endif ; fiveendif ; fourendif ; three
endifendif
end
A.3.10 plot_tr
;pro plottr,tarray,result,goodenough=goodenough,tv=tv,noconnect=noconnect, $;x=x,y=y,_extra=eee
; see http://www.physics.emory.edu/-weeks/idl;for more information and software updates
; plottr.pro (formerly ericplot2.pro)
; started 6-15-98 Eric R. Weeks;/tv added 8-13-98; /noconnect added 8-13-98; uberized 9-21-98
; duplicates somewhat "plot_tracks"
; lentrk Eric Weeks 9-22-98
; modified from JCC's len_trk.pro
function ptlentrk,t; works for either uber or normal tracked data
; returns (2,*) array: (0,*) is the length, (1,*) is particle #
s=size(t)if (s(0) eq 2) then begin
; UBER TRACKER; get the indices of the unique id's
105

ndat=n_elements(t(*,0))u = uniq(t(ndat-1 ,*))ntracks = n_elements(u)u = [-1,u]
res = fltarr(2,ntracks)for i = 1L,ntracks do begin
res(0,i-1) = t(ndat-2,u(i))-t(ndat-2,u(i-1 )+1)res(1,i-1) = t(ndat-1,u(i))
endforendif else begin
; OLD TRACKERntracks=n_elements(t(0,*,0))res=fltarr(2,ntracks)for i=0,ntracks-1 do begin
w=where(t(0,i,*) ge 0)res(0,i)=w(n_elements(w)-1 )-w(0)+1res(1 ,i)=i
endforendelse
return,resend; first a utility function:; eline.pro started 8-13-98 by Eric Weeks
; linearray=eline(ptl,pt2); ptl, pt2 are n-dimensional pofloors (integers); result is an array of pofloors connecting them
; vectorized 11-2-98;turned into pt_eline 2-25-99
function pt_eline,ptl,pt2
ndim=n_elements(ptl)ndim2=n_elements(ptl)if (ndim ne ndim2) then message,"error! pts must be same dimension"result=floor(ptl)
delta=pt2-ptlmax=max(abs(delta))epsilon=float(delta)/float(max)if (max le 0) then begin
message,"warning! begin and end pts are identical",/infendif else begin
ptO=float(ptl)temp=epsilon # findgen(max+1)n=n_elements(ptl )result=intarr(n,max+1 )for i=0,n-1 do begin
result(i,*)=floor(pt0(i)+temp(i,*))endfor
endelse
return,result
106

end
pro plottr,tarray, result,goodenough=goodenough,tv=tv,noconnect=noconnect, $x=x,y=y,_extra=eee; tarray is an array of tracked data (2D for the moment);goodenough works like plottracks -- only tracks at least 'goodenough';in duration will be plotted;/tv uses tv mode to plot, rather than axes; use x and y to adjust size; result gets picture from /tv
;WARNING: tracked data must be "uberize'd" before using! (if ubertracker)
s = size(tarray)if (s(0) eq 2) then uber=1
if (not keyword_set(x)) then x=512if (not keyword_set(y)) then y=480if (not keyword_set(noconnect)) then connect=1
if (not keyword_set(uber)) then begin; REGULAR TRACKERif not keyword_set(goodenough) then goodenough=s(3); default is number of framesww=where( total(tarray(0,*,*) ge 0,3) ge goodenough ); ww locates all valid data pts (not equal to -1)if (keyword_set(tv)) then begin
; added 8-13-98picture=bytarr(x,y)if (keyword_set(connect)) then begin
for i=0,s(2)-i do begin; loop over each particlewl=where(tarray(0,i,*) gt 0)pt0=tarray(0:1,i,wl (0))for j=1,n_elements(wl)-1 do begin
; loop over each valid frameptl =tarray(0:1 ,i,wl (j))lineline=pt_eline(ptO,ptl )picture(lineline(0,*),linelinene(1 ,*)) = 255pt0=ptl
endforendfor
endif else beginfor i=0,s(3)-i do begin
; loop over each frameif (ww(0) ge 0) then begin
w = where(tarray(0,ww,i) gt 0)ptrs=ww(w)picture(tarray(0,ptrs,i),tarray(1,ptrs,i)) = 255
endifendfor
endelsetv,pictureresult=picture
endif else begin; original pre-August 1998 routineif (ww(0) ge 0) then begin
107

w = where(tarray(0,ww,0) gt 0)ptrs=ww(w)plot,tarray(0, ptrs,0),tarray( 1, ptrs,0),/nodata, $
extra=eee,/ynozero,/ysty,/xsty,/isotropic; loop over each frameif (keyword_set(connect)) then begin
for i=0,s(3)-1 do beginw = where(tarray(0,ww,i) gt 0)ptrs=ww(w)oplot,tarray(0,ptrs,i),tarray(1,ptrs,i),psym=3
endforendif else begin
for i=0,s(3)-1 do beginw = where(tarray(0,ww,i) gt 0)ptrs=ww(w)oplot,tarray(0,ptrs,i),tarray(1,ptrs,i),psym=3
endforendelse
endifendelse
endif else begin; UBER-TRACKERndat=n_elements(tarray(*,0))ntime=max(tarray(ndat-2,*))if not keyword_set(goodenough) then goodenough=ntimelength=pt_lentrk(tarray)w=where(length(0,*) ge goodenough,nw)if (keyword_set(tv)) then begin
picture=bytarr(x,y)u=uniq(tarray(ndat-1,*))ntracks=n_elements(u)u=[-1 ,u]if (keyword_set(connect)) then begin
for i=OL,nw-1L do beginj=length(1,w(i))traj=tarray(*,u(j)+ 1:u(j+1))k=n_elements(traj(0,*))pt0=traj(0:1,0)for kk=1 L,k-1L do begin
ptl =traj(0:1 ,kk)lineline=pt_eline(pt0,ptl)picture(lineline(0,*),Iineline(1,*)) = 255pt0=ptl
endforendfor
endif else beginfor i=OL,nw-1L do begin
j=length(1,w(i))traj=tarray(*,u(j)+1 :u(j+1))picture(traj(0,*),traj(1,*)) = 255b
endforendelsetv,pictureresult=picture
endif else beginplot,tarray(0,*),tarray(1, *),/nodata,/ynozero,_extra=eee, $
108

/ysty,/xsty,/isotropicu=uniq(tarray(ndat-1 ,*))ntracks=n_elements(u)u=[-1,u]if (keyword_set(connect)) then begin
for i=OL,nw-1L do beginj=length(1,w(i))traj=tarray(*,u(j)+1 :u(j+1))oplot,traj(0,*),traj(1 ,*)
endforendif else begin
for i=OL,nw-1L do beginj=length(1 ,w(i))traj=tarray(*, u(j)+ 1:u(j+1))oplot,traj(0,*),traj(1 ,*),psym=3
endforendelse
endelseendelse
end; this ends the procedure
A.3.11 read_gdf
function read_gdf,filespec
; see http://www.physics.emory.edu/-weeks/idl; for more information
;+;NAME:;read_gdf;PURPOSE:; Read in data files created by WRITE_GDF.;CATEGORY:; General Purpose Utility;CALLING SEQUENCE:; data = read_gdf(file);INPUTS:; file: Complete pathname of the file to be read.;OUTPUTS:; data: Data structure. For example, if the original; data was stored as an array of bytes, then; DATA will be returned as an array of bytes also.;RESTRICTIONS:; Current implementation does not support structures or; arrays of structures.;PROCEDURE:; Reasonably straightforward.; Determines if the file is ASCII or binary, reads the size; and dimension info from the header, and reads in the data;MODIFICATION HISTORY:
109
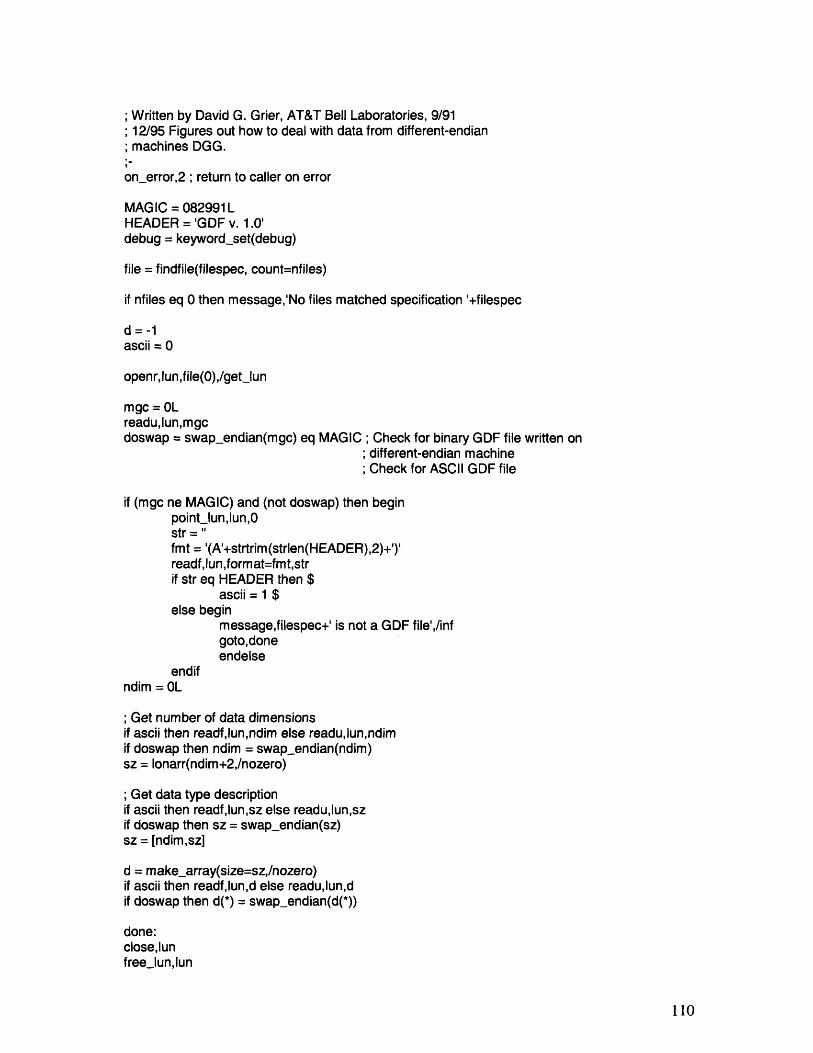
;Written by David G. Grier, AT&T Bell Laboratories, 9/91; 12/95 Figures out how to deal with data from different-endian; machines DGG.
on_error,2 ; return to caller on error
MAGIC = 082991LHEADER = 'GDF v. 1.0'debug = keyword_set(debug)
file = findfile(filespec, count=nfiles)
if nfiles eq 0 then message,'No files matched specification '+filespec
d=-1ascii = 0
openr, lun,file(0),/get_lun
mgc = OLreadu,lun,mgcdoswap = swap_endian(mgc) eq MAGIC; Check for binary GDF file written on
;different-endian machine; Check for ASCII GDF file
if (mgc ne MAGIC) and (not doswap) then beginpoint_lun,lun,0str ="fmt = '(A'+strtrim (strlen(HEADER),2)+')'readf,lun,format=fmt,strif str eq HEADER then $
ascii = 1 $else begin
message,filespec+' is not a GDF file',/infgoto,doneendelse
endifndim = OL
; Get number of data dimensionsif ascii then readf,lun,ndim else readu,lun,ndimif doswap then ndim = swap_endian(ndim)sz = lonarr(ndim+2,/nozero)
; Get data type descriptionif ascii then readf,lun,sz else readu,lun,szif doswap then sz = swap endian(sz)sz = [ndim,sz]
d = make_array(size=sz,/nozero)if ascii then readf,lun,d else readu,lun,dif doswap then d(*) = swap_endian(d(*))
done:close,lunfree_lun,lun
110
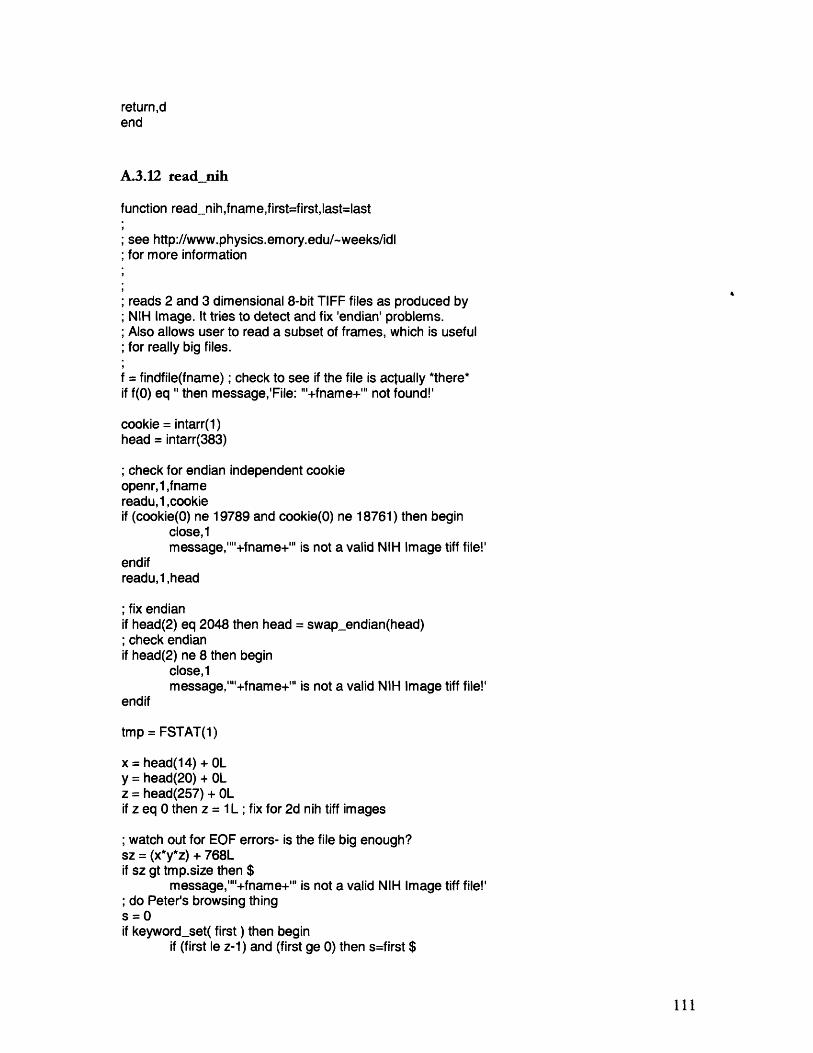
return,dend
A.3.12 read_ nih
function read_-.nih,fname,first=first,last=last
; see http://www.physics.emory.edu/-weeks/idl; for more information
; reads 2 and 3 dimensional 8-bit TIFF files as produced by; NIH Image. It tries to detect and fix 'endian' problems.; Also allows user to read a subset of frames, which is useful; for really big files.
f = findfile(fname) ; check to see if the file is actually *there*if f(0) eq " then message,'File: "'+fname+'" not found!'
cookie = intarr(1)head = intarr(383)
; check for endian independent cookieopenr, l,fnamereadu,1 ,cookieif (cookie(0) ne 19789 and cookie(0) ne 18761) then begin
close,1message,'"'+fname+"' is not a valid NIH Image tiff file!'
endifreadu,l,head
; fix endianif head(2) eq 2048 then head = swap_endian(head); check endianif head(2) ne 8 then begin
close,1message,""+fname+'" is not a valid NIH Image tiff file!'
endif
tmp = FSTAT(1)
x = head(14) + OLy = head(20) + OLz = head(257) + OLif z eq 0 then z = 1L ; fix for 2d nih tiff images
; watch out for EOF errors- is the file big enough?sz = (x*y*z) + 768Lif sz gt tmp.size then $
message,""+fname+'" is not a valid NIH Image tiff file!'; do Peter's browsing things=0if keyword_set( first ) then begin
if (first le z-1) and (first ge 0) then s=first $
111
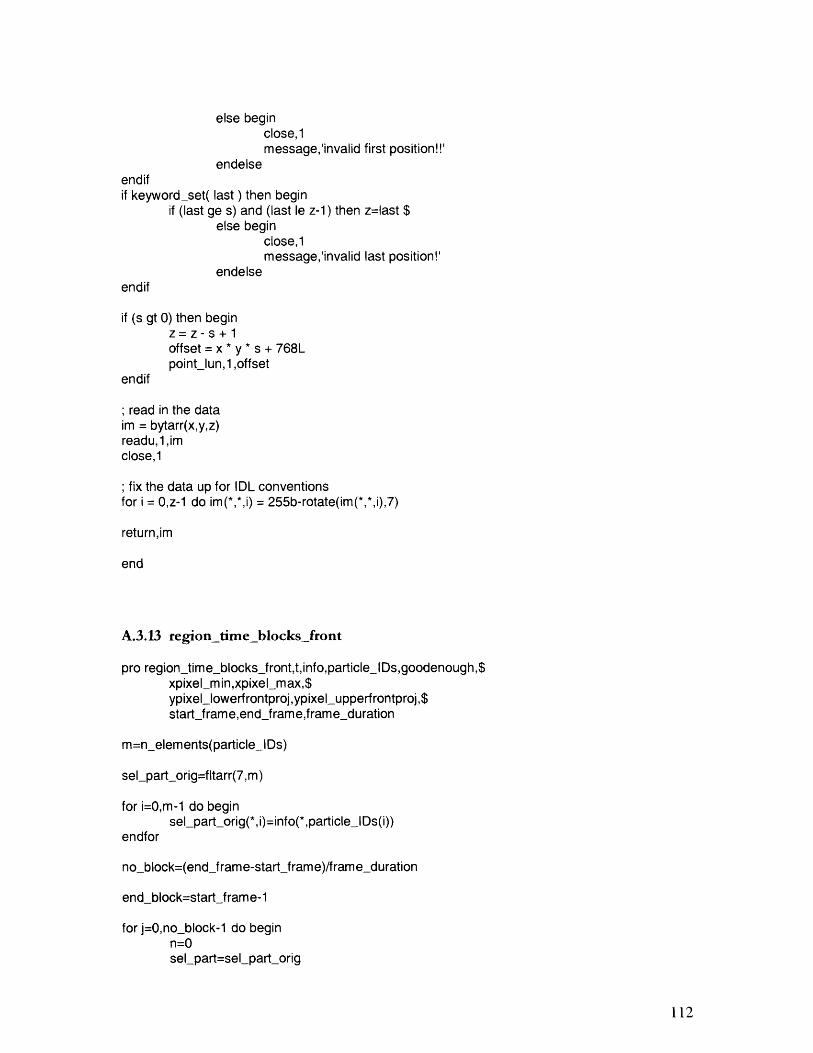
else beginclose,1message,'invalid first position!!'
endelseendifif keyword_set( last ) then begin
if (last ge s) and (last le z-1) then z=last $else begin
close, 1message,'invalid last position!'
endelseendif
if (s gt 0) then beginz= z-s+1offset = x * y * s + 768Lpoint_lun,1 ,offset
endif
; read in the dataim = bytarr(x,y,z)readu,l,imclose,1
; fix the data up for IDL conventionsfor i = O,z-1 do im(*,*,i) = 255b-rotate(im(*,*,i),7)
return,im
end
A.3.13 region_time_blocks_front
pro region_time_blocks_front,t,info,particleIDs,goodenough,$xpixelmin,xpixel_max,$ypixel_lowerfrontproj,ypixel_upperfrontproj,$start_frame,end_frame,frame_duration
m=n_elements(particle_lDs)
sel_part_orig=fltarr(7,m)
for i=0,m-1 do beginsel_part_orig(*, i)=info(*,particle_lDs(i))
endfor
no_block=(end_frame-start_frame)/frame_duration
endblock=start frame-1
for j=0,no_block-1 do beginn=0sel_part=sel_part_orig
112

I=string(j+l)r=strcompress(I,/remove_all)
start_block=end block+1end_block=start_block+frame_duration-1
for k=O,m-1 do beginif (sel_part(O,k) ge xpixel_min) and (sel_part(O,k) le xpixel_max) $and (sel_part(1,k) ge ypixel_lowerfrontproj) and(sel_part(1 ,k)leypixel_upperfrontproj) $then beginif sel_part(4,k) It end_block then begin
if sel_part(4,k) It start_block then beginsel_part(4,k)=start_block
endif
if sel_part(5,k) gt start_block then beginif sel_part(5,k) gt end_block then begin
sel_part(5,k)=end_blockendifendif
if (sel_part(5,k)-sel_part(4,k)) ge goodenough then beginn=n+lendif
endifendif
endfor
sel_part=sel_part_origpt_info=fltarr(7,n)n=O
for k=O,m-1 do beginif (sel_part(O,k) ge xpixel_min) and (sel_part(O,k) le xpixel_max) $and (sel_part(1,k) ge ypixel_lowerfrontproj) and (sel_part(1,k) le ypixel_upperfrontproj) $then beginif sel_part(4,k) It end_block then begin
if sel_part(4,k) It start_block then beginsel_part(4,k)=start_blockendif
if sel_part(5,k) gt start_block then beginif sel_part(5,k) gt end_block then begin
sel_part(5,k)=end_blockendif
endif
if (sel_part(5,k)-sel_part(4,k)) ge goodenough then beginpt_info(*,n)=sel_part(*,k)write_gdf, pt_info, 'pt_info 3 quarter front projection block'+r+'.result'
write_textmod,ptinfo,'ptinfo 3 quarter front projection block'+r+'.txt'n=n+lendif
endif
113

endifendfor
h=MSD_header_modl (t,pt_info)write_textmod,h,'particle track header 3 quarter front projection block'+r+'.txt'p=msd_mod3(t,pt_info)write_textmod,p,'particle track 3 quarter front projection block'+r+'.txt'average=ave_timelag(p)write_textmod,average,'average particle track 3 quarter front projection block'+r+'.txt'
endforend
A.3.14 write_gdfpro writegdf, data, file, ascii=ascii; see http://www.physics.emory.edu/-weeks/idl; for more information;+;NAME:;writegdf;PURPOSE:; Writes IDL-style data to disk in a format which can be; easily read back in.;CATEGORY:; General Purpose Utility;CALLING SEQUENCE:;write_gdf,data,file;INPUTS:; data: Data structure to be written to disk.; file: Complete pathname of the file to be written.;KEYWORD:; ascii: Produce an ASCII file rather than the default; binary file.;SIDE EFFECTS:; Creates a file.;RESTRICTIONS:; Current version does not support structures or arrays of; structures.;PROCEDURE:; Writes a header consisting of a long MAGIC number followed; by the long array produced by SIZE(DATA), followed by the; data itself.; If the file is ASCII, the header tag is an identifying; statement, followed by all of the same information in; ASCII format.;MODIFICATION HISTORY:;Written by David G. Grier, AT&T Bell Laboratories, 9/91
onerror,2 ; return to caller on errorMAGIC = 082991LHEADER = 'GDF v. 1.0'openw, lun, file, /getjlunsz = size(data)if keyword_set(ascii) then begin
114

printf,lun,HEADERprintf,lun,sz(0)printf,lun,sz(1 :*)printf,lun,dataendif $
else beginwriteu,lun,MAGICwriteu,lun,szwriteu,lun,dataendelse
close,lunfree_lun, lunend
A.3.15 write_textmod; Written by John C. Crocker
; Saves the data in an array as a tab delimited text file; which can be easily read in by a spread sheet program.; default delimiter is the tab
pro write_textmod,data,filename,comma=comma
sz = size(data)if sz(O) ne 2 then message,'Array argument must be 2 dimensional'
if keyword_set( comma) then num_delter = ',' else num_delter = string( 9B) ; tab is ASCII 9
close,1openw,1 ,filename
for i=0.0,sz(2)-1 do beginastring = "for j=0.0,sz(1)-2 do begin
astring = astring + strcompress( string( data(j,i) ), /remove_all) + num_delterendforastring = astring + strcompress( string( data(sz(1)-1 ,i) ), /remove_all )printf,1 ,astring
endfor
close,1
end
115
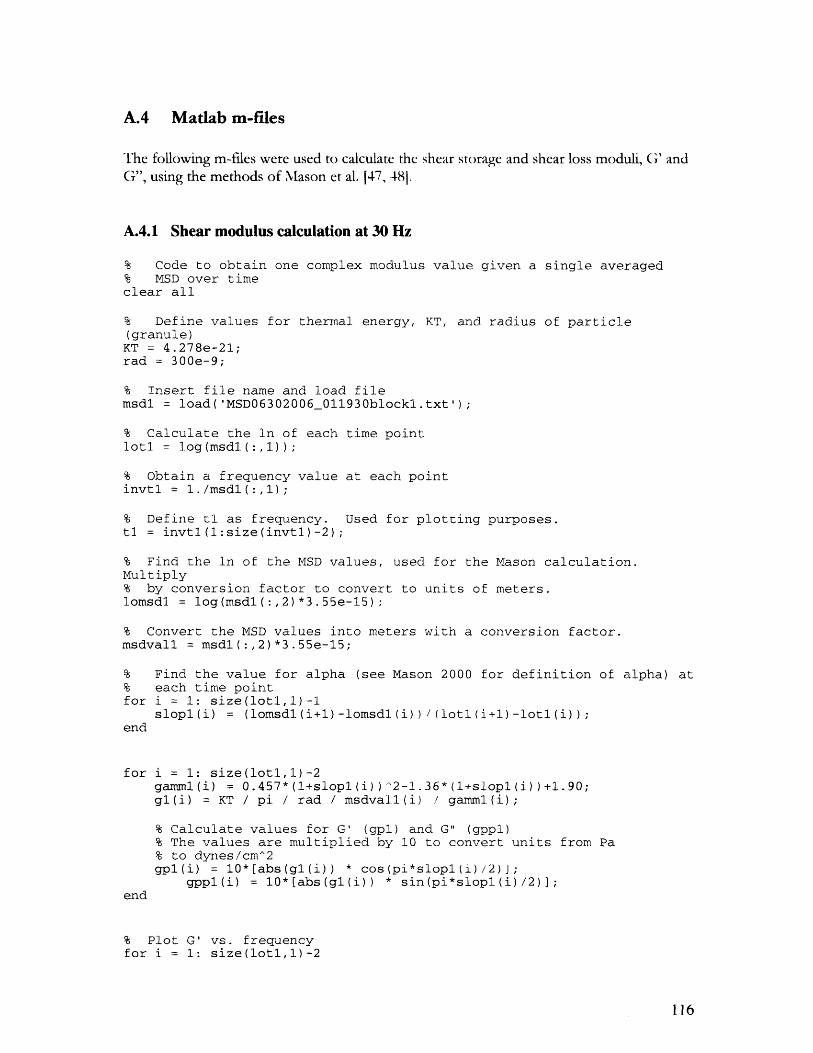
A.4 Matlab m-files
The following m-files were used to calculate the shear storage and shear loss moduli, G' andG", using the methods of Mason et al. [47, 481.
A.4.1 Shear modulus calculation at 30 Hz
% Code to obtain one complex modulus value given a single averaged% MSD over timeclear all
% Define values for thermal energy, KT, and radius of particle(granule)KT = 4.278e-21;rad = 300e-9;
% Insert file name and load filemsdl = load('MSD06302006_011930blockl.txt');
% Calculate the in of each time pointlotl = log(msdl(:,l));
% Obtain a frequency value at each pointinvtl = l./msdl(:,l);
% Define tl as frequency. Used for plotting purposes.tl = invtl(1:size(invtl)-2);
% Find the In of the MSD values, used for the Mason calculation.Multiply% by conversion factor to convert to units of meters.lomsdl = log(msdl(:,2)*3.55e-15);
% Convert the MSD values into meters with a conversion factor.msdvall = msdl(:,2)*3.55e-15;
% Find the value for alpha (see Mason 2000 for definition of alpha) at% each time pointfor i = 1: size(lotl,l)-l
slopl(i) = (lomsdl(i+l)-lomsdl(i))/(lotl(i+l)-lotl(i));end
for i = 1: size(lotl,l)-2gamml(i) = 0.457*(l+slopl(i))"2-1.36*(l+slopl(i))+1.90;gl(i) = KT / pi / rad / msdvall(i) / gamml(i);
% Calculate values for G' (gpl) and G" (gppl)% The values are multiplied by 10 to convert units from Pa% to dynes/cm^2gpl(i) = 10*[abs(gl(i)) * cos(pi*slopl(i)/2)J;
gppl(i) = 10*[abs(gl(i)) * sin(pi*slopl(i)/2)] ;end
% Plot G' vs. frequencyfor i = 1: size(lotl,l)-2
116
Loglog(invtl (i), gpl (i) ,'x' )hold ongrid off
endxlabel ( 'Frequency (1/s) ' )ylabel('Storage Modulus, G* (dyn/cm^2) ')title('Storage Modulus (G*) versus frequency')
%; Plot G" vs. frequencyfigure (2)for i = 1: size(lotl,l)-2
ioglog(invtl (i),gppl(i),'o');hold ongrid off
endxlabei('Frequency (l/s) ')ylabel('Loss Modulus, G** (dyn/cm^2) ')title('Loss Modulus (G**) versus frequency')
legend *' 'G **', 'Location', 'SouthEast')
C~utput the values for G' and G" at 30 Hzstormod = lgpl(l)]lossmod = [gppl(1) 1
117

A.5 Pseudopod Projection Times in 6 pm-wide Channel
118
Tine to Pseudopod Formation v. Deformation RateUntreated, Channel 6-1, l4unm H20
R' = 9.261l
100
10
0.1 1 10
Deformation Rate (Iis)
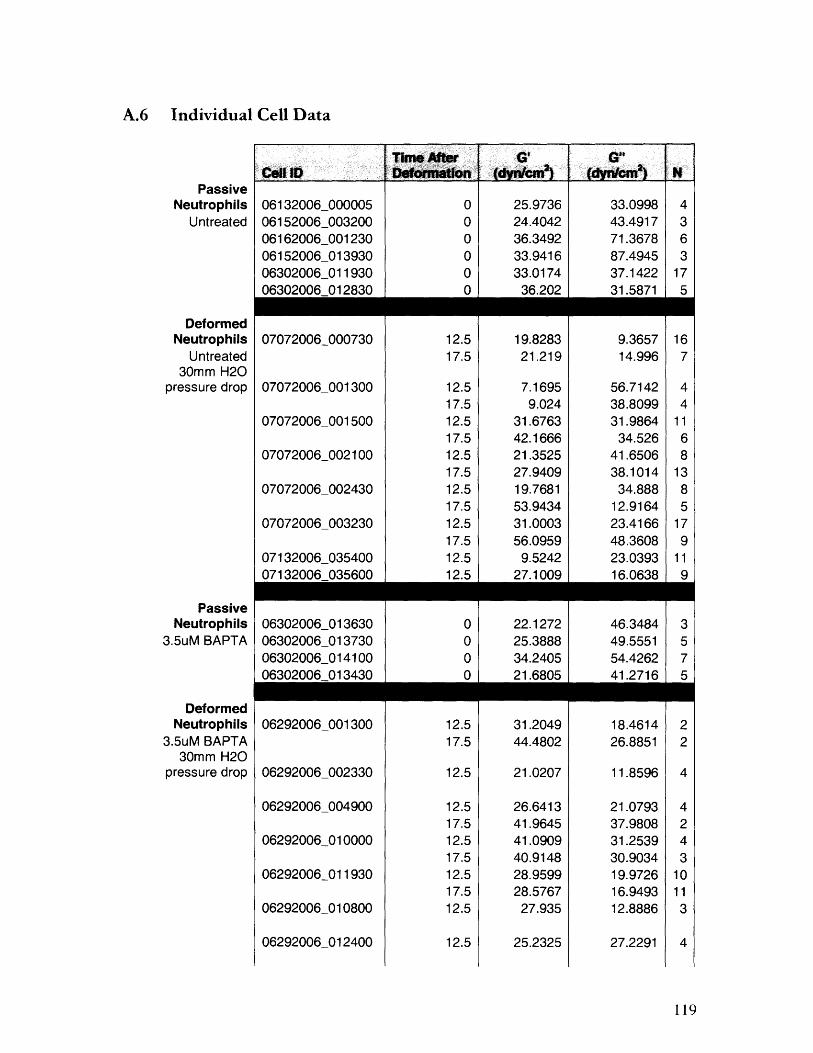
A.6 Individual Cell Data
PassiveNeutrophils
Untreated
DeformedNeutrophils
Untreated30mm H20
pressure drop
PassiveNeutrophils
3.5uM BAPTA
DeformedNeutrophils
3.5uM BAPTA30mm H20
pressure drop
Cell ID
06132006_00000506152006_00320006162006_00123006152006 01393006302006 01193006302006 012830
07072006_000730
07072006_001300
07072006 001500
07072006 002100
07072006 002430
07072006 003230
07132006 03540007132006 035600
06302006_01363006302006 01373006302006 01410006302006 013430
06292006_001300
06292006_002330
06292006 004900
06292006 010000
06292006 011930
06292006 010800
06292006 012400
Time AfterDeformation
000000
12.517.5
12.517.512.517.512.517.512.517.512.517.512.512.5
0000
12.517.5
12.5
12.517.512.517.512.517.512.5
12.5
G'
25.973624.404236.349233.941633.017436.202
19.828321.219
7.16959.024
31.676342.166621.352527.940919.768153.943431.000356.09599.5242
27.1009
22.127225.388834.240521.6805
31.204944.4802
21.0207
26.641341.964541.090940.914828.959928.576727.935
25.2325
G"
33.099843.491771.367887.494537.142231.5871
9.365714.996
56.714238.809931.986434.526
41.650638.101434.888
12.916423.416648.360823.039316.0638
46.348449.555154.426241.2716
18.461426.8851
11.8596
21.079337.980831.253930.903419.972616.949312.8886
27.2291
N
4363
175
167
44
1168
1385
179
119
M3575
M22
4
4243
10113
4
119

PassiveNeutrophils
0.035% DMSO
DeformedNeutrophils
0.035% DMSO30mm H20
pressure drop
06292006 003030
07192006 000130
07192006 000800
07192006 001100
06302006_01080006302006 01113006302006 010730
06302006 011130
07072006_015800
07072006_020800
07072006 02313007072006 023130
12.517.512.517.512.517.512.5
0000
12.517.5
12.517.512.512.5
26.841620.392954.140137.777627.198728.144427.0393
34.46213.282929.927513.2829
13.30218.6557
33.497638.943418.760516.3881
9.587224.293526.089415.283251.068811.814837.6413
73.686535.873835.414835.8738
34.967625.896
35.893642.0646
21.99528.0538
M33
11
3
102
564
10
120
-------

A.7 Flow Cytometry Histograms
525 nmIialua* FLI Lo -ADC
Untreated Cells
Fluo-3 + FuraRed
BAPTA +Fluo-3 + FuraRed
Fluo-3 + FuraRedImmediately afterstimulation withFMLP
4*0 .t I 12 1 7.
RFLes
l LI LQss
525 nm
paIgeIGFLlLog-ADC
I
PAl I FL Log - ADC
··
RI LOG
R3Log
paeMql FL3 Leg- ADC
r T"
FL3L
610 nm
p"0a4 FU Lo ADC
FL ' Log
R3L L
121
610 nm
nghell FLS Lo - ADC
I i
I1 I
-u, IL . . s
i
" "
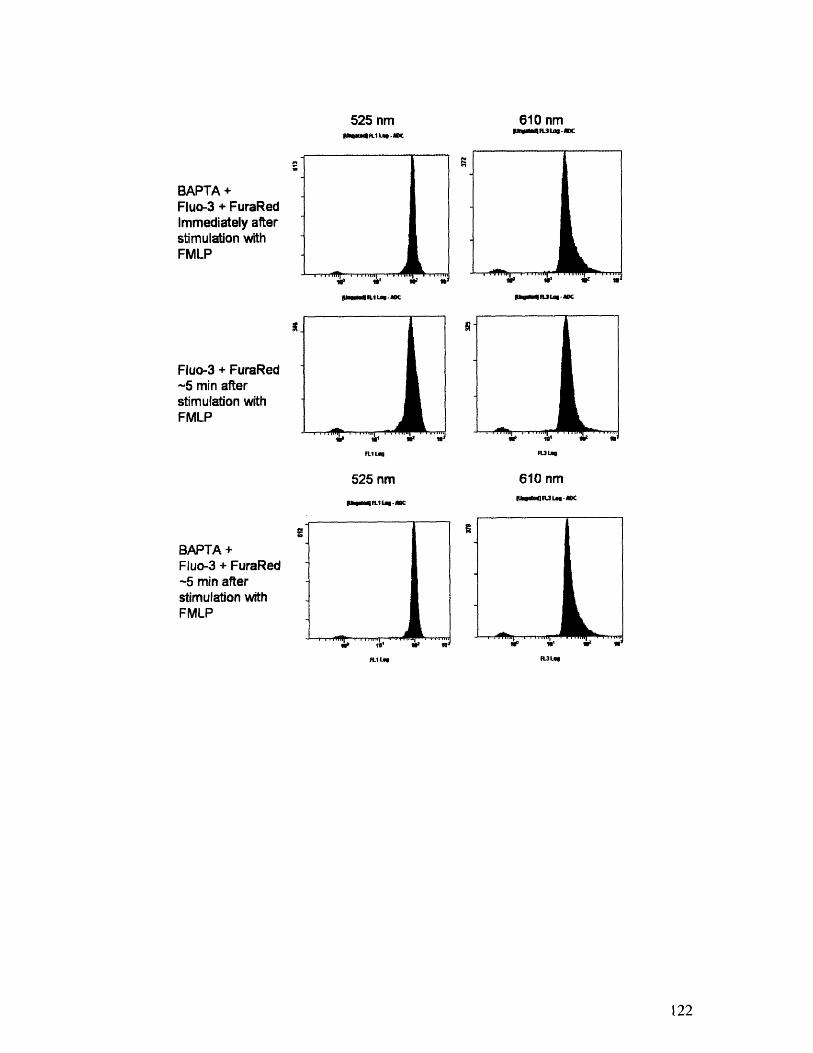
525 nmplAUfI Lu -wD
BAPTA +Fluo-3 + FuraRedImmediately afterstimulation withFMLP
1.' U' O
pm4IUI~RLu- MCf
Fluo-3 + FuraRed-5 min afterstimulation withFMLP
Rit L"
525 nm
PbgieqH.L-AMC
BAPTA +Fluo-3 + FuraRed-5 min afterstimulation withFMLP
•t•"W
610 nmlPI*U3LnU-MX
FUL
610 nmJU6RI-I
ID
FLuL
IKI J
122
. . ... i . . ... i_ - j
m