investigating the impact of hvdc schemes in the irish
TRANSCRIPT

EirGrid plc Investigating the Impact of HVdc Schemes in the Irish Transmission Network
Final Report
R1116.03.04 Oct-18, 2009
© TransGrid Solutions Inc, 2009
Engineering Support Services for:
Investigating the Impact of HVdc Schemes in the
Irish Transmission Network EirGrid plc
The Oval, 160 Shelbourne Road Dublin 4
Ireland
Attention: Mark Norton
Report R1116.03.04
Final Report
Prepared by: TransGrid Solutions Inc.
200 – 137 Innovation Dr. Winnipeg, MB R3T 6B6
CANADA
www.transgridsolutions.com
Oct-18, 2009
PDF created with pdfFactory Pro trial version www.pdffactory.com

EirGrid plc Investigating the Impact of HVdc Schemes in the Irish Transmission Network
Final Report
R1116.03.04, Page 1 Oct-18, 2009
© TransGrid Solutions Inc, 2009
Disclaimer This report was prepared by TransGrid Solutions Inc. (“TGS”), whose responsibility is limited to the scope of work as shown herein. TGS disclaims responsibility for the work of others incorporated or referenced herein. This report has been prepared exclusively for EirGrid plc and the project identified herein and must not be modified without the prior written authorization of TGS.
PDF created with pdfFactory Pro trial version www.pdffactory.com

EirGrid plc Investigating the Impact of HVdc Schemes in the Irish Transmission Network
Final Report
R1116.03.04, Page 2 Oct-18, 2009
© TransGrid Solutions Inc, 2009
Revisions
Project Name: Investigating the Impact of HVdc Schemes in the Irish Transmission Network
Document Title: Final Report
Document Type: Report
Document No.: R1116.03.04
Last Action Date:
Oct-18, 2009
Rev. No.
Status Prepared By Checked By Date Comments
00 IFC R. Brandt, P.Eng,
M. Szechtman
M. Mohaddes, M. Szechtman
May-31, 09 Initial release of draft report.
01 IFC R. Brandt, P.Eng,
M. Szechtman
M. Mohaddes, M. Szechtman
Jun-25, 09 Second release of draft report after receiving comments via email and conference calls.
02 IFA R. Brandt, P.Eng,
M. Szechtman
M. Mohaddes, M. Szechtman
Jul-08, 09 Third release of draft report after discussions during June 29-30 meetings in Dublin.
03 IFA R. Brandt, P.Eng,
M. Szechtman
S Temtem Aug-15,09 Fourth release of draft report, checked all HV stations.
04 ABC R. Brandt, P.Eng,
M. Szechtman
M. Mohaddes, M. Szechtman
Oct-18, 09 Release of final report.
Legend of Document Status:
Approved by Client ABC Draft for Comments DFC Issued for Comments IFC Issued for Approval IFA Issued for Information IFI Returned for Correction RFC Approval not Required ANR
PDF created with pdfFactory Pro trial version www.pdffactory.com

EirGrid plc Investigating the Impact of HVdc Schemes in the Irish Transmission Network
Final Report
R1116.03.04, Page 3 Oct-18, 2009
© TransGrid Solutions Inc, 2009
Table of Contents Disclaimer...........................................................................................................................................................1 Revisions ............................................................................................................................................................2 Table of Contents ..............................................................................................................................................3 Executive Summary ..........................................................................................................................................7
General Considerations of the HVdc Applications........................................................................................8 Scenario 1 – North-West Wind.....................................................................................................................10 Scenario 2/3 – North-South Interconnector.................................................................................................10 Scenario 4 – Drawing Power out of the Area near Cork ............................................................................13 Scenario 5 – Multi-Terminal VSC in Northern Ireland ................................................................................14
1. Introduction..............................................................................................................................................15 1.1. Background .......................................................................................................................................15 1.2. Terms of Reference..........................................................................................................................15
2. General HVdc Information.....................................................................................................................17 2.1. Why DC, why AC ..............................................................................................................................17 2.2. Recent History on HVdc...................................................................................................................21 2.3. Comparison Summary of the LCC and VSC Technologies...........................................................22
2.3.1. AC Faults – LCC HVdc ............................................................................................................23 2.3.2. AC Faults – VSC HVdc ............................................................................................................25 2.3.3. DC Faults – LCC HVdc ............................................................................................................25 2.3.4. DC Faults – VSC HVdc............................................................................................................26
2.4. Environmental Considerations.........................................................................................................27 2.4.1. DC Saturation of Transformers................................................................................................29 2.4.2. Electrical and Magnetic Fields and Corrosion........................................................................29 2.4.3. Magnetic Fields.........................................................................................................................29
2.5. Market Considerations......................................................................................................................29 2.6. HVdc Power Dispatching..................................................................................................................30 2.7. Operational Considerations..............................................................................................................32
2.7.1. Converter Start Up and Shut Down.........................................................................................32 2.7.2. HVdc with Wind Penetration....................................................................................................33
3. AC and DC Performance Statistics Highlights ..................................................................................35 3.1. AC System Statistics ........................................................................................................................35 3.2. HVdc Statistics - CIGRE Protocol....................................................................................................36
3.2.1. Outage Statistics ......................................................................................................................38 3.2.2. Overall DC Availability Indices.................................................................................................39
3.3. An Attempt to Compare AC with DC Substations Availability........................................................39 4. Study Assumptions ................................................................................................................................42 5. Study Tools and Models ........................................................................................................................43
5.1. PSSE .................................................................................................................................................43 5.1.1. Republic of Ireland and Northern Ireland Transmission Networks .......................................43
5.1.1.1. Power Flow Models..............................................................................................................43 5.1.1.2. Dynamic Models...................................................................................................................44
5.1.2. LCC HVdc .................................................................................................................................44 5.1.2.1. Power Flow Models..............................................................................................................44 5.1.2.2. Dynamic Models...................................................................................................................44
5.1.3. VSC HVdc [3]............................................................................................................................45 5.1.3.1. Power Flow Models..............................................................................................................45 5.1.3.2. Dynamic Models...................................................................................................................46
5.2. PSCAD ..............................................................................................................................................46 6. Study Criteria...........................................................................................................................................47
6.1. General System Performance Criteria ............................................................................................47 6.1.1. Steady State .............................................................................................................................47 6.1.2. Dynamic ....................................................................................................................................47
6.2. Criteria for Comparison of AC and HVdc Options..........................................................................48 7. Study Methodology.................................................................................................................................50
7.1. Procedure: PSSE Analysis...............................................................................................................50
PDF created with pdfFactory Pro trial version www.pdffactory.com

EirGrid plc Investigating the Impact of HVdc Schemes in the Irish Transmission Network
Final Report
R1116.03.04, Page 4 Oct-18, 2009
© TransGrid Solutions Inc, 2009
7.1.1. Power Flow Setup ....................................................................................................................50 7.1.2. Steady State Contingency Analysis ........................................................................................50 7.1.3. Short Circuit Analysis ...............................................................................................................51 7.1.4. Procedure: PSSE Transient Stability Analysis .......................................................................52
7.2. Procedure: PSCAD Analysis............................................................................................................52 7.3. Procedure: SSR Hand Calculation ..................................................................................................52 7.4. Procedure: Comparison of HVdc Schemes and AC Alternatives..................................................53
8. Scenario One: Wind in North-West Mayo Region .............................................................................54 8.1. Transmission Options.......................................................................................................................54
8.1.1. AC Alternative...........................................................................................................................55 8.1.2. HVdc Alternative.......................................................................................................................55 8.1.3. Reactive Power Exchange with AC System...........................................................................56
8.2. Contingencies ...................................................................................................................................58 8.2.1. Steady State Analysis ..............................................................................................................58 8.2.2. Transient Stability Analysis......................................................................................................58
8.3. Power Flows Cases and Losses......................................................................................................59 8.4. Steady State Contingency Analysis.................................................................................................59
8.4.1. Overload Impacts .....................................................................................................................59 8.4.2. Voltage Violation Impacts ........................................................................................................59
8.5. Short Circuit Analysis .......................................................................................................................59 8.6. Transient Stability Analysis ..............................................................................................................60
8.6.1. Faults on the New Bellacorick-Flagford Connection..............................................................60 8.6.2. Post-Contingency Overvoltages..............................................................................................61 8.6.3. Transient Overvoltages and Undervoltages...........................................................................62 8.6.4. Frequency Performance ..........................................................................................................64
8.6.4.1. Transient Frequency ............................................................................................................64 8.6.4.2. Long Term Frequency..........................................................................................................64
8.6.5. Rate of Change of Frequency Performance...........................................................................66 8.6.6. VSC – Ramping Power Output of Wind Farms......................................................................67
8.7. System Frequency Scans ................................................................................................................68 8.8. SSR Screening..................................................................................................................................70 8.9. Summary of Overall Study Results for Scenario 1.........................................................................71 8.10. Overall Comparison of HVdc Solutions with Equivalent AC Solution .......................................72
8.10.1. AC Advantages over HVdc......................................................................................................72 8.10.2. HVdc Advantages over AC......................................................................................................72
8.11. Recommendations........................................................................................................................73 9. Scenario Two and Three: New North-South Interconnector ...........................................................74
9.1. Transmission Options.......................................................................................................................75 9.1.1. AC Alternative...........................................................................................................................75 9.1.2. HVdc Alternatives .....................................................................................................................75
9.1.2.1. HVdc Option 1 – LCC ..........................................................................................................75 9.1.2.2. HVdc Option 2 – VSC ..........................................................................................................77
9.1.3. Reactive Power Exchange with AC System...........................................................................78 9.1.4. AC System Strength at HVdc Terminals.................................................................................80
9.2. Contingencies ...................................................................................................................................81 9.2.1. Steady State Analysis ..............................................................................................................81 9.2.2. Transient Stability Analysis......................................................................................................81
9.3. Power Flows Cases and Losses......................................................................................................82 9.4. Steady State Contingency Analysis.................................................................................................82
9.4.1. Overload Impacts .....................................................................................................................83 9.4.2. Voltage Violation Impacts ........................................................................................................84
9.5. Short Circuit Analysis .......................................................................................................................87 9.6. Transient Stability Analysis ..............................................................................................................89
9.6.1. Overvoltages and Undervoltages............................................................................................89 9.6.2. Wind Generator Tripping..........................................................................................................92 9.6.3. Power Oscillation Damping......................................................................................................92 9.6.4. Frequency Performance ..........................................................................................................92
PDF created with pdfFactory Pro trial version www.pdffactory.com

EirGrid plc Investigating the Impact of HVdc Schemes in the Irish Transmission Network
Final Report
R1116.03.04, Page 5 Oct-18, 2009
© TransGrid Solutions Inc, 2009
9.6.5. Rate of Change of Frequency Performance...........................................................................96 9.6.6. Double Circuit Loss of 275 kV Louth-Tandragee Lines.........................................................99 9.6.7. HVdc Line Faults and Pole Blocking.....................................................................................108 9.6.8. Commutation Failures of East-West HVdc Interconnector..................................................108 9.6.9. Commutation Failures of North-South HVdc System – LCC option ...................................109
9.7. System Frequency Scans ..............................................................................................................110 9.8. SSR Screening................................................................................................................................116 9.9. Summary of Overall Study Results for Scenario 2.......................................................................117 9.10. Overall Comparison of HVdc Solutions with Equivalent AC Solution .....................................120
9.10.1. AC Advantages over HVdc....................................................................................................120 9.10.2. HVdc Advantages over AC....................................................................................................120 9.10.3. Comparison of LCC and VSC HVdc .....................................................................................120
9.11. Recommendations......................................................................................................................121 10. Scenario Four: Drawing Power Out of the Cork Area.....................................................................124
10.1. Transmission Options.................................................................................................................125 10.1.1. AC Alternative.........................................................................................................................125 10.1.2. HVdc Alternatives ...................................................................................................................125
10.1.2.1. VSC Option 1..................................................................................................................125 10.1.2.2. VSC Option 2..................................................................................................................126 10.1.2.3. VSC in Reality ................................................................................................................128
10.1.3. Reactive Power Exchange with AC System.........................................................................128 10.2. Contingencies .............................................................................................................................130
10.2.1. Steady State Analysis ............................................................................................................130 10.2.2. Transient Stability Analysis....................................................................................................130
10.3. Power Flows Cases and Losses ...............................................................................................131 10.3.1. Steady State Contingency Analysis ......................................................................................131 10.3.2. Overload Impacts ...................................................................................................................132
10.3.2.1. Re-dispatch VSC to Reduce Congestion .....................................................................133 10.3.3. Voltage Violation Impacts ......................................................................................................135
10.4. Short Circuit Analysis .................................................................................................................135 10.5. Transient Stability Analysis ........................................................................................................136
10.5.1. Overvoltages and Undervoltages..........................................................................................136 10.5.2. Wind Generator Tripping........................................................................................................139 10.5.3. Power Oscillation Damping....................................................................................................140 10.5.4. Frequency Performance ........................................................................................................140
10.5.4.1. Transient Frequency......................................................................................................141 10.5.4.2. Long Term Frequency ...................................................................................................141
10.5.5. Rate of Change of Frequency ...............................................................................................144 10.5.6. HVdc Line Faults and Pole Blocking.....................................................................................145 10.5.7. Mitigation Measures ...............................................................................................................146
10.6. System Frequency Scans..........................................................................................................147 10.7. SSR Screening ...........................................................................................................................149 10.8. Summary of Overall Study Results for Scenario 4...................................................................150 10.9. Overall Comparison of HVdc Solutions with Equivalent AC Solution .....................................152
10.9.1. AC Advantages over HVdc....................................................................................................152 10.9.2. HVdc Advantages over AC....................................................................................................153
10.10. Recommendations......................................................................................................................153 11. Scenario Five: Expansion of Northern Ireland System..................................................................155
11.1. Transmission Options.................................................................................................................156 11.1.1. HVdc Scheme – Five-Terminal VSC.....................................................................................156 11.1.2. Reactive Power Exchange with AC System.........................................................................156
11.2. Contingencies .............................................................................................................................157 11.2.1. Steady State Analysis ............................................................................................................157 11.2.2. Transient Stability Analysis....................................................................................................157
11.3. Power Flows Cases and Losses ...............................................................................................158 11.3.1. Steady State Contingency Analysis ......................................................................................159 11.3.2. Thermal Overloads.................................................................................................................159
PDF created with pdfFactory Pro trial version www.pdffactory.com

EirGrid plc Investigating the Impact of HVdc Schemes in the Irish Transmission Network
Final Report
R1116.03.04, Page 6 Oct-18, 2009
© TransGrid Solutions Inc, 2009
11.4. Transient Stability Analysis ........................................................................................................160 11.5. Summary of Overall Study Results for Scenario 5...................................................................160 11.6. Recommendations......................................................................................................................160
12. References .............................................................................................................................................162 Appendix A-1 – Scenario 1: Select Plots for Transient Stability Analysis..........................................164 Appendix A-2 – Scenario 1: Steady State Contingency Analysis – Thermal Overloads ..................165 Appendix A-3 – Scenario 1: Steady State Contingency Analysis – Voltage Violations....................166 Appendix A-4 – Scenario 1: Short Circuit Analysis Results..................................................................167 Appendix A-5 – Scenario 1: Frequency Scans.........................................................................................168 Appendix A-6 – Scenario 1: Detailed Generator Dispatch.....................................................................169 Appendix B-1a – Scenario 2: Select Plots for Transient Stability Analysis 2.1 .................................171 Appendix B-1b – Scenario 2: Select Plots for Transient Stability Analysis 2.2 .................................172 Appendix B-1c – Scenario 2: Select Plots for Transient Stability Analysis 2.3 .................................173 Appendix B-1d – Scenario 2: Select Plots for Transient Stability Analysis 2.4 .................................174 Appendix B-2 – Scenario 2: Steady State Contingency Analysis – Thermal Overloads ..................175 Appendix B-3 – Scenario 2: Steady State Contingency Analysis – Voltage Violations....................176 Appendix B-4 – Scenario 2: Short Circuit Analysis Results..................................................................177 Appendix B-5 – Scenario 2: Frequency Scans.........................................................................................178 Appendix B-6 – Scenario 2: Detailed Generator Dispatch.....................................................................179 Appendix C-1 – Scenario 4: Select Plots for Transient Stability Analysis..........................................181 Appendix C-2 – Scenario 4: Steady State Contingency Analysis – Thermal Overloads ..................182 Appendix C-3 – Scenario 4: Steady State Contingency Analysis – Voltage Violations....................183 Appendix C-4 – Scenario 4: Short Circuit Analysis Results..................................................................184 Appendix C-5 – Scenario 4: Frequency Scans.........................................................................................185 Appendix C-6 – Scenario 4: Detailed Generator Dispatch.....................................................................186 Appendix D-1 – Scenario 5: Select Plots for Transient Stability Analysis..........................................188 Appendix D-2 – Scenario 5: Detailed Generator Dispatch.....................................................................189
PDF created with pdfFactory Pro trial version www.pdffactory.com

EirGrid plc Investigating the Impact of HVdc Schemes in the Irish Transmission Network
Final Report
R1116.03.04, Page 7 Oct-18, 2009
© TransGrid Solutions Inc, 2009
Executive Summary EirGrid/NIE/SONI are currently faced with the challenge of expanding and modifying the meshed Irish AC network in order to accommodate increasing demand for electricity, connection of large amounts of renewable generation, and facilitating greater cross-border power transfers between Northern Ireland and the Republic of Ireland while still maintaining security of supply. As part of a solution to the challenge, EirGrid/NIE/SONI are investigating the feasibility or otherwise of using HVdc schemes to develop the transmission system of the Republic of Ireland and Northern Ireland. The purpose of this study is to investigate the impact of HVdc schemes in the Irish Network and to compare these HVdc schemes to equivalent AC solutions for various scenarios. Four scenarios were investigated to compare various AC and HVdc schemes, including:
1) Scenario 1 – North-West Wind This scenario investigated the connection of 460 MW of wind in the north-west Mayo region via transmission from Bellacorick to Flagford. The study compared a 220 kV AC line to a voltage source converter (VSC) HVdc system.
2) Scenario 2/3 – North-South Interconnector This scenario compared a 400 kV AC line, a three-terminal line-commutated converter (LCC) HVdc system and a three-terminal voltage source converter (VSC) HVdc system, to connect Northern Ireland to the Republic of Ireland with terminals at Turleenan, mid Cavan and Woodland. This line is referred to as the North-South Interconnector.
3) Scenario 4 – Drawing Power out of the Cork Region This scenario compared 400 kV AC transmission to two voltage source converter (VSC) HVdc schemes in order to draw power out of the congested area near Cork.
4) Scenario 5 – System Expansion in Northern Ireland This scenario performed a very high level stability investigation into the potential feasibility to connect a five-terminal voltage source converter (VSC) HVdc system in Northern Ireland. The equivalent AC solution would be a five-terminal double circuit 275 kV AC line; however this scenario did not directly compare the AC option to the HVdc option.
The study aims at providing technical comparisons between HVdc and AC solutions. Simulation cases considered year 2020 base cases prepared by the EirGrid/NIE/SONI team. Steady state contingency analysis, short circuit analysis, transient stability analysis, harmonic frequency scans and subsynchronous resonance (SSR) screening were performed to derive a basis for comparison of the technical performance of the AC and HVdc transmission solutions. Please note that for clarity of explanation throughout this report, an HVdc bipole is referred to as an HVdc system that can continue to operate with one of the two poles being out of service, a monopole cannot. A bipolar HVdc system can continue to transmit power (up to the rating of the remaining pole) with one pole out of service. This report does not necessarily mean that bipole refers to two conductors and monopole to one conductor, which is a widely-used definition. Specifically confusion can arise as to the definition of a monopolar VSC system; despite the fact that it requires two conductors it cannot operate with one of those conductors out-of-service, unless it has been designed to operate as a bipole. During the loss of one HVdc pole, the possibility of allowing a current flow through ground (or sea ground) is not always considered due to environmental constraints. Therefore, more often considered is the possibility of using the so-called metallic return, which is the use of the other HVdc conductor as a return path for the current in case of a loss of one valve group at a substation, thus, allowing half or even more than half of rated power, under that condition. A third conductor to be used as a spare is less often found due to economic reasons but could also be implemented. All of these possibilities are normally considered in the feasibility phase of the project studies and the technical, economic and environmental results are combined towards the adoption of the final configuration of the project.
PDF created with pdfFactory Pro trial version www.pdffactory.com

EirGrid plc Investigating the Impact of HVdc Schemes in the Irish Transmission Network
Final Report
R1116.03.04, Page 8 Oct-18, 2009
© TransGrid Solutions Inc, 2009
General Considerations of the HVdc Applications
Typical applications of HVdc systems include: • Transmission with overhead line distances above 1000 km, where the need of various intermediate
tapings is not present; • Interconnecting systems with different frequencies (50 Hz to 60 Hz); • Undersea or underground cables with lengths around 50 km and above; • Need for asynchronous operation (even at the same frequency base), like interconnection of different
markets. • Need for absolute power scheduling Aside from Scenario 1 which studies VSC transmission to connect isolated wind generation to the grid, the only typical application that really applies to the other scenarios being studied in this report is the use of HVdc cables. VSC HVdc is a relatively new technology that is growing fast. However, aside from Scenario 1 (isolated wind generation connection), a multi-terminal VSC HVdc scheme as studied in Scenarios 2/3, 4 and 5, with ratings up to 1500 MVA, has never been built. Table E-1 below provides a summary of currently installed VSC HVdc systems. Table E-1. Existing Major VSC-HVdc links.
Name Converter Station 1
Converter Station 2
Cable (km)
Overhead line
(km) Voltage
(kV) Power (MW)
Year Remarks
Trans Bay Cable / San Francisco Bay
US - East Bay - Oakland
US - San Francisco 88 200 400 2010 multi-module
technology
NordE.ON 1 Germany - Diele
Germany - Borkum 2 platform
203 150 400 2009 Offshore wind farm
Estlink Estonia - Harku
Finland - Espoo 105 150 350 2006
Land + submarine cable, connecting asynchronous systems
Cross Sound Cable
US - New Haven, CT
US - Shoreham, Long Island
40 150 330 2002 buried underwater cable
Caprivi Link Namibia - Gerus
Namibia - Zambezi 970 350 300 2010
overhead line; bipolar design, one pole will be constructed in the future
Directlink Australia - Mullumbimby
Australia - Bungalora 59 80 180 2000 land cable
HVDC Troll Norway - Kollsnes
Norway - Offshore platform Troll A
70 60 80 2004 power supply for offshore gas compressor.
HVDC Valhall Norway - Lista
Norway - Valhall, Offshore platform
292 150 78 2009 submarine cable, supplying offshore platform
PDF created with pdfFactory Pro trial version www.pdffactory.com

EirGrid plc Investigating the Impact of HVdc Schemes in the Irish Transmission Network
Final Report
R1116.03.04, Page 9 Oct-18, 2009
© TransGrid Solutions Inc, 2009
Name Converter Station 1
Converter Station 2
Cable (km)
Overhead line
(km) Voltage
(kV) Power (MW)
Year Remarks
Eagle Pass, Texas B2B
US - Eagle Pass, TX
US - Eagle Pass, TX 15.9 36 2000
Hellsjön-Grängesberg
Sweden - Hellsjoen
Sweden - Graengesberg
10 180 3 1997 experimental HVDC
Tjæreborg Denmark - Tjæreborg
Denmark - Tjæreborg 4.3 9 7 2000
interconnection to wind power generating stations
Gotland Sweden-Nas Sweden-Backs 2x70 80 50 1999 Land cable, wind
power
MurrayLink Australia-Berri
Australia-Red Cliffs 2x180 150 200 2002
Land cable, controlled connection for trading
Troll A Norway, Lollsnes
Troll A platform 4x68 60 2x40 2005
Submarine cable, supplying gas platform
Typical applications of HVdc can provide benefits such as power oscillation damping and frequency control. An HVdc power order can be quickly changed by an external signal (that should indicate a change in the network is taking place) as an additional signal in the power order scheduling. Power oscillation damping was not observed to be an issue in this study. Use of HVdc controls to achieve steady state or longer term frequency control is not expected to be applicable in the Irish network because the HVdc is being integrated into a meshed AC network; however frequency control was not modeled in this study and would therefore require further investigation to make any definite conclusions. It is not a case of being able to transfer excess generation from one area to another area that is deficient in generation as could typically be the case with an HVdc link connecting two isolated systems. A meshed AC network with embedded HVdc circuits can impose an added complexity to future network planning and expansion. For instance when planning the system it is difficult and expensive to tap into an existing HVdc circuit whereas an AC circuit can be easily tapped to serve new load or build a new AC station and lines. AC lines do not produce harmonics. HVdc, both VSC and LCC, do inherently generate harmonics, however filters are designed and installed with HVdc applications in order to filter out these harmonics, especially if there are any resonances of concern with the AC system. In this study, frequency scans determined the following: • There are a number of shunt and series resonances that may be a concern for either the LCC or VSC
options, due to the harmonics generated by either option. • As only a minimal number cases where studied, and details of the actual filter configurations of the
Moyle and East-West interconnectors were not available, these frequency scans should only be considered as cursory.
In some cases, when an overhead AC transmission line cannot be considered, an HVdc solution may be a viable technical solution since it can utilise underground cables. However, the fact that the selection of an HVdc option would make underground cable a more attractive option is not of itself sufficient justification for selecting an HVdc option over the HVAC option. To make such a decision it is necessary to compare the two technologies across the full range of relevant criteria, including environmental, technical and economical. This study merely comprises a technical comparison of the two technologies. An environmental and economic comparison is beyond its scope.
PDF created with pdfFactory Pro trial version www.pdffactory.com

EirGrid plc Investigating the Impact of HVdc Schemes in the Irish Transmission Network
Final Report
R1116.03.04, Page 10 Oct-18, 2009
© TransGrid Solutions Inc, 2009
Scenario 1 – North-West Wind
VSC HVdc technology is currently being used for connecting isolated wind farms to the grid particularly for the offshore farms. For onshore applications if the transmission distance is too long (over 50-100km) then the overhead lines are preferred. Long AC cables are not practical due to the large amount of line charging associated with a long AC cable. Of course it is possible to use multiple sections of AC cable with shunt reactive compensation in between, but in most cases this option is not economically viable. The VSC solution can be used with both overhead line and underground cable. VSC technology can be applied to very weak systems and is capable of following the power output of an isolated wind farm so as to control the frequency. It also has a varying range of dynamic reactive power support. For more information regarding wind farms connected to VSC HVdc, please refer to [9]. The studies show that both the AC and VSC HVdc options are technically feasible to connect the 460 MW of wind via transmission from Bellacorick to Flagford. Specifically, this scenario considered the HVdc option as a two-terminal monopolar VSC scheme and compared it to a single 220 kV AC line. Based solely on the technical comparison between the 220 kV AC line option and the VSC HVdc option it appears that there are no significant technical benefits to the VSC HVdc or the AC transmission over the other. VSC HVdc links have the benefit of inherent reactive power support and can utilize underground cables. The subsynchronous resonance (SSR) screening calculations did not flag any concerns. However there is little information readily available on the possibility of SSR between a wind farm and a VSC HVdc system. Because of this, the possibility cannot be excluded and it cannot be said for certain that the possibility of SSR does not exist in this situation. The UIF calculation used in this study to screen for potential SSR issues is only intended for use with LCC HVdc and thermal generators. There is no such empirical formula for screening for potential SSR between a wind farm and VSC HVdc system. Should this VSC option be futher pursued it would be recommended to perform further studies to verify the possibility of SSR with the Bellacorick wind farm along with appropriate mitigation if deemed necessary. In terms of study results, there were no significant technical differences noted between the AC and VSC HVdc options in terms of the following aspects:
• Steady state voltage violations. • Thermal overloads. • Rate of change of frequency during and following faults. • Long term frequency decay due to loss of generation – the system settles to the same steady
state underfrequency for the AC and VSC options. The AC option has the following technical advantages compared to the VSC option:
• Higher short circuit levels, resulting in a stronger local AC system. The VSC option has the following technical advantages compared to the AC option:
• The VSC inherently provides reactive power support. • Slightly lower losses (by 2-3 MW).
A detailed summary of results for Scenario 1 can be found in Section 8.
Scenario 2/3 – North-South Interconnector
This scenario compares AC and HVdc transmission options within a meshed AC network in order to connect Northern Ireland to the Republic of Ireland with terminals at Turleenan, mid Cavan and Woodland. Specifically, the HVdc options considered were a three-terminal bipolar LCC scheme and a three-terminal bipolar VSC scheme, which were both compared to a single 400 kV AC line connecting the same terminals.
PDF created with pdfFactory Pro trial version www.pdffactory.com

EirGrid plc Investigating the Impact of HVdc Schemes in the Irish Transmission Network
Final Report
R1116.03.04, Page 11 Oct-18, 2009
© TransGrid Solutions Inc, 2009
At present, a 1500 MW multi-terminal VSC scheme has not been installed. Monopolar VSC cable schemes are currently limited to around 1200 MW. In order to compare and contrast an equivalent single 400 kV AC overhead line, a 1500 MW VSC cable system is anticipated to be available by 2020 as a bipolar scheme. A bipolar HVdc scheme can operate with one pole out of service and continue to transmit power up to the rating of the in-service pole, and thus a bipolar VSC or LCC scheme would provide the same level of reliability as a double circuit AC connection. If required, the double-circuit nature of the bipolar HVdc scheme presents an inherent advantage over the single AC line option. The studies show that the AC and HVdc options are all technically feasible and each option could be integrated into the network provided that the relevant protection, control and telecommunication systems for these HVdc technologies and their interactions are sufficiently robust to maintain the safety, reliability and security of the Irish network. The same requirements would be true for the installation of any new transmission scheme. However, it should be noted that there has not yet been an application in service of a multi-terminal DC link (DC network) embedded in a meshed AC network, either using LCC or VSC technology. Based on the selected power flow cases and contingencies that were studied, there are no significant technical advantages identified for the use of HVdc transmission instead of AC transmission for the North-South Interconnector. VSC HVdc links have the benefit of inherent reactive power support. Both LCC and VSC HVdc links can utitlize underground cables, and if built as a bipole provide extra reliability. In addition, the subsynchronous resonance (SSR) screening calculations did not flag any concerns. The AC option showed significantly lower losses, fewer overloads in the Louth/Tandragee/Turleenan area and a stronger system at Moyle than both HVdc options. The HVdc options were shown to require a special protection system in the event of the loss of the double circuit Louth-Tandragee 275 kV lines, whereas the AC option did not require such a special protection system. The AC option has the following technical advantages compared to the HVdc options: • Lower line losses • No overloads of the Woodland 380-220 kV transformer, the Louth-Tandragee 275 kV lines or the
Tandragee-Turleenan 275 kV lines • Higher short circuit levels at the Moyle converter bus • When compared to the LCC option, can still provide reduced power transfer at reduced AC voltages
whereas the LCC option can fail commutation during nearby and remote AC faults, causing temporary disruption in power transmission on the HVdc system.
• Does not require a special protection system for the loss of the double circuit 275 kV lines between Louth and Tandragee.
The HVdc options have the following technical advantages compared to the AC option: • Reduced fault levels in nearby areas which may potentially result in fewer breaker replacements, if
that is a concern. • The VSC option has improved dynamic voltage performance compared to both the AC and LCC
options as it inherently provides a range of dynamic reactive power support.
Between the two HVdc options, the following general comparisons can be made between the LCC and VSC options: • A VSC does not fail commutation and therefore can still provide reduced power transfer at reduced
AC voltages, whereas the LCC option may fail commutation during nearby and remote AC faults, causing temporary disruption in power transmission on the LCC HVdc system.
• A VSC provides steady state and dynamic AC voltage control with a large range of reactive power support, however this reactive power support does depend on the real power transmission and the MVA rating of the VSC (please refer to Section 8.1.3 for further explanation). An LCC consumes 50-60% reactive power based on real power loading, but self-compensates through the use of filters
PDF created with pdfFactory Pro trial version www.pdffactory.com

EirGrid plc Investigating the Impact of HVdc Schemes in the Irish Transmission Network
Final Report
R1116.03.04, Page 12 Oct-18, 2009
© TransGrid Solutions Inc, 2009
banks and shunt capacitors. Therefore the VSC is superior in terms of voltage control.
• A disadvantage of a VSC is that for DC pole faults it will draw short circuit current from the AC system and look to the AC system like a remote AC fault plus a pole block, whereas the LCC DC line fault looks to the AC system only like a pole block. However in a cable system, as was studied for the LCC and VSC options, DC pole faults are very rare.
• The number of cables required for a VSC bipole would depend on the type of cable being used. Either XLPE or Mass Impregnated cable can be used, depending on the voltage and MW rating required. XLPE cable is cheaper but can only go up to approximately 320 kV DC. Mass Impregnated cable is more expensive but can go up to higher DC voltages. It becomes an economic study to determine how many XLPE cables would be required compared to mass impregnated cables, and which option would be less expensive. If multiple XLPE cables would be required, it could be assumed for this scenario that as a worst case cost, the VSC bipole would require the same number of Mass Impregnated cables as the LCC bipole, therefore not providing any cost benefit for the VSC in terms of cables. The VSC bipole would however save approximately 40% of the station foot print compared to the LCC bipole of the same rating.
A special protection system should be implemented for both HVdc options to increase the HVdc power order to take over 70-80% of the pre-contingency Louth-Tandragee flow in the event of the loss of the double circuit Louth-Tandragee 275 kV lines. The 70-80% power transfer level was tested for the four power flow cases studied, which in general represent various year 2020 network topologies from summer minimum to winter maximum loading with varying dispatches of conventional and wind generation. Whether or not the 70-80% value would need to change based on other system topologies not studied in the scenario would require further testing. However, unless another tie line between Northern Ireland and the Republic of Ireland were added, it is not expected that this value would need to change. Such a special protection scheme could consist of something similar to the following, which is what was tested in this study:
• Monitor the power flow in the double circuit Louth-Tandragee lines. • Monitor breaker status of these lines, and if the breakers open to trip the lines, send a signal to
the HVdc controls to increase the power order by the required percentage of pre-contingency Louth-Tandragee double circuit power transfer. Such communication delays would be expected to be in the range of 10 to 15 ms, however 20 ms was modeled to provide some margin of error.
• The HVdc controls can respond within less than one cycle to increase the power order. The actual power will reach the new power order within a few cycles.
Similar special protection systems exist in other HVdc schemes to quickly reduce or increase HVdc power to maintain system stability depending on major transmission lines tripping. For example, in the Nelson River HVDC scheme in Manitoba, a special protection scheme known as “HVDC reduction” is used to quickly reduce the HVdc power order to two LCC HVdc bipoles in the event of loss of various critical transmission lines in the AC system, including tie lines between Manitoba and the United States. The “HVDC reduction” scheme operates under certain pre-determined power flow conditions and adjusts the HVdc power orders according to the pre-contignency power flow that was measured in the particular transmission line that tripped. Because the AC option does not require the special protection scheme it is simpler than the HVdc option. The special protection scheme relies on remote signals and therefore it is prone to error and mis-operation. There may also be some difficulty in fully testing the scheme as it may require critical outages such as taking the double circuit out of service. However, these issues are not unique to this scheme and are common among protection systems that rely on remote signals. In addition, both HVdc options could be designed with a controller to monitor the phase angle difference between the two systems when the double circuit Louth-Tandragee lines are out of service in order to further adjust the HVdc power transfer to minimize the angle difference between the North and South. AC line reclosing should be delayed until the phase angle difference is minimized. Please note this study did not consider or model such a controller.
PDF created with pdfFactory Pro trial version www.pdffactory.com
EirGrid plc Investigating the Impact of HVdc Schemes in the Irish Transmission Network
Final Report
R1116.03.04, Page 13 Oct-18, 2009
© TransGrid Solutions Inc, 2009
A detailed summary of results for Scenario 2/3 can be found in Section 9.10.
Scenario 4 – Drawing Power out of the Area near Cork
This scenario compares AC and HVdc transmission options within a meshed AC network in order to draw power out of the congested area near Cork. Terminals for the new transmission are located at Glanagow, Cahir, Kilkenny and Loughteeog. The AC option consists of three single 400 kV AC lines. One of the VSC options consists of three two-terminal bipolar VSC links. The other VSC option consists of two three-terminal monopolar VSC links. The VSC options were selected as described due to limitations in modeling at the time of the studies, however in reality if a VSC link in this scenario were to be built it is expected that the most economic option would be to build it as a four-terminal bipolar VSC scheme, as it would require the least number of cables and VSC converters compared to the two VSC options studied in this scenario. In addition, if extra reliability is needed, a bipolar HVdc scheme has an inherent advantage over a single AC line as a bipolar HVdc scheme can operate with one pole out of service and continue to transmit power up to the rating of the in-service pole. The studies show that the AC and VSC HVdc options are all technically feasible and each option could be integrated into the network. However, without consideration for economics or environmental impacts, based solely on the technical comparison between the AC and VSC HVdc options there were no significant technical advantages identified for the use of HVdc transmission instead of AC transmission between Glanagow-Cahir-Kilkenny-Loughteeog. VSC HVdc links have the benefit of inherent reactive power support and can utitlize underground cables. The VSC terminals at Aghada and Laois flagged the need for detailed studies to identify and mitigate potential subsynchronous resonance (SSR) issues with the Glanagow and Irishtown thermal generators, respectively. The AC option showed significantly lower losses, fewer overloads in the local area and a stronger local AC system. The study results show no significant difference between the AC and VSC HVdc options in terms of the following aspects:
• Steady state voltage violations once mitigation of reactive power support at Thurles and Portlaoise is added.
• Rate of change of frequency during and following faults. • Long term frequency decay due to loss of generation – the system settles to the same steady
state underfrequency following the loss of generation. The VSC options are not able to improve the frequency because the VSC is not able to transfer power from an area with excess power since the VSC transmission is located within a meshed AC network and is not connected to an isolated system with excess power.
The AC option has the following technical advantages compared to the VSC options:
• Lower line losses • Lower overloads in several 400 kV and 110 kV lines in the south-west area • Higher short circuit levels resulting in a stronger local AC system • The VSC terminals at Aghada (near the WhiteGen CCGT generator) and at Laois (near the
Irishtown generator) both flagged the need for detailed SSR studies as the SSR screening procedure identified Unit Interaction Factors greater than 0.1 with the Glanagow and Irishtown generators, respectively. SSR is not a concern for the AC option.
The VSC options have the following technical advantages compared to the AC option:
• Improved voltage performance as the VSC can inherently reactive power support.
PDF created with pdfFactory Pro trial version www.pdffactory.com
EirGrid plc Investigating the Impact of HVdc Schemes in the Irish Transmission Network
Final Report
R1116.03.04, Page 14 Oct-18, 2009
© TransGrid Solutions Inc, 2009
One of the important aspects of this scenario is the transmission congestion in the area of study. A purpose of the studying this scenario was to investigate whether or not it may be possible to use the power scheduling flexibility of the VSC links to relieve congestion rather than constraining generation and/or uprating lines in the area. However, because the VSC links are integrated within a meshed AC network, the power scheduling becomes complex, especially with four HVdc terminals that all have the ability to be adjusted. For example, if it is known that more power needs to be drawn from one of the four terminals, which of the other three terminals should this power be sent to so as to not create any new overloads? It is not necessarily an easy question to answer. It was found that the following complications exist with attempting to rely on the VSC link to be re-dispatched to eliminate all n-1 violations:
• There are many overloaded lines and many contingencies causing these overloads so the VSC could not be pre-programmed to respond to every contingency that causes an overload.
• A re-dispatch of the VSC to eliminate the overload would need to be carefully calculated to properly share the re-dispatch among the four terminals so as not to create new overloads.
• The re-dispatch would be very dependent upon the network topology and load and generation dispatch.
• It would be complicated for an operator to determine an optimal strategy to compensate overloads, but certainly more detailed studies can be carried out to specifically investigate the most effective action to be undertaken by the HVdc links.
A detailed summary of results for Scenario 4 can be found in Section 10.8.
Scenario 5 – Multi-Terminal VSC in Northern Ireland
This scenario performs a preliminary stability investigation into the potential feasibility of connecting a five-terminal voltage source converter (VSC) HVdc system within a meshed AC network in Northern Ireland. The equivalent AC solution would be a five-terminal double circuit 275 kV AC line, however this scenario does not directly compare the AC option to the HVdc option. This study highlights if any major stability issues may arise. The studies show that the five-terminal VSC HVdc scheme connecting Turleenan to Omagh, Omagh to Coolkeeragh, Coolkeeragh to Coleraine, and Coleraine to Kells could be technically feasible, based on the limited analysis that was performed. Losses are quite high however, up to 59.6 MW, due to the fixed losses associated with the five VSC converters. The limited transient stability analysis that was performed showed stable system response to the faults that were studied. Based on the selected power flow cases and contingencies that were studied, there was nothing noted to suggest that the five-terminal VSC option would not be technically feasible. The transmission scheme as studied was entirely HVdc transmission; however it would also be possible to integrate it as only partly HVdc, but this was not specifically studied. It should be cautioned that no such system has ever been built, and the application of being embedded in a meshed AC network is not typical. A detailed summary of results for Scenario 5 can be found in Section 11.5. If HVdc transmission is being considered for any part of the expansion plans of the Northern Ireland system, then a more detailed study would need to be undertaken at a point in time when the study scenarios are more developed. Future studies could include more generation and load scenarios, more faults (including DC faults), short circuit analysis, sub-synchronous resonance studies and frequency scans. These studies should compare AC solutions with other viable transmission alternatives that include some or all parts being HVdc transmission.
PDF created with pdfFactory Pro trial version www.pdffactory.com

EirGrid plc Investigating the Impact of HVdc Schemes in the Irish Transmission Network
Final Report
R1116.03.04, Page 15 Oct-18, 2009
© TransGrid Solutions Inc, 2009
1. Introduction EirGrid plc contracted TransGrid Solutions Inc (TGS) (TGS, having Dual as a main sub-contractor) to perform an investigation into various HVdc schemes and the impact they would have on the operation, performance and security of the transmission system of the Republic of Ireland. The goal of the project is to investigate the integration of HVdc schemes into the AC system, how they might be applied and how these schemes perform in comparison with each other and with equivalent AC schemes. To fulfill the first task for the project a Methodology Workshop was held. The objective of the Methodology Workshop was to design a set of studies, the results of which would enable EirGrid/NIE/SONI to qualitatively compare different HVdc schemes and equivalent AC schemes in terms of their impact on the Republic of Ireland and Northern Ireland transmission systems. Several scenarios were defined in which an AC solution and alternative HVdc solution(s) were proposed. From this workshop a Methodology Report [1] was prepared for the project to define the various study scenarios, the study scope, study assumptions, procedures, criteria and data requirements.
1.1. Background
As taken directly from the Request for Proposals document: “Increasing demand for electricity, technology advances, renewable energy targets, environmental awareness, increasing public opposition to overhead lines and the development of common electricity markets are among the issues providing opportunities and posing challenges to those that plan the transmission networks of tomorrow. Particular challenges of concern to those that plan the Irish transmission system include:
• Facilitating greater cross-border power transfers between the Republic of Ireland and Northern Ireland in the context of the new all-island single electricity market;
• Accommodating upwards of 8,000 MW of renewable generation whose connection applications are currently being processed;
• Maintaining security of supply as the existing capacity of the network becomes increasingly stretched.
It is in this context that EirGrid wishes to investigate the feasibility or otherwise of using HVdc schemes to develop the transmission system of the Republic of Ireland.”
1.2. Terms of Reference
This study undertakes an investigation into the impact that various HVdc schemes would have on the operation, performance and security of the transmission system of the Republic of Ireland. The aim of investigating the integration of HVdc schemes into the currently exclusively AC Irish transmission system is to identify the nature of the available schemes, how they impact upon AC systems, how and under what circumstances might they be applied to the Irish transmission system and how these schemes perform in comparison with each other and with equivalent AC schemes. The investigation qualitatively compares Voltage Source Converter (VSC) HVdc, Line-Commutated Converter (LCC) HVdc and equivalent AC solutions for a number of transmission development scenarios. Schemes are compared exclusively in terms of their relative impact on transmission system performance, security and flexibility rather than on aspects such as cost or the environment. The scope of work for the comparative analysis is as follows: For each HVdc scheme, perform the following analysis: PSSE STEADY STATE Contingency analysis.
PDF created with pdfFactory Pro trial version www.pdffactory.com

EirGrid plc Investigating the Impact of HVdc Schemes in the Irish Transmission Network
Final Report
R1116.03.04, Page 16 Oct-18, 2009
© TransGrid Solutions Inc, 2009
PSSE SHORT CIRCUIT Standard PSS/E calculation of fault levels at each node on the system for AC/HVdc scheme comparison purposes. PSSE DYNAMIC Standard PSS/E transient stability analysis of normal clearing three-phase and slow clearing single-phase faults as well as HVdc contingencies such as pole blocking. Note that three-phase faults are more severe than single-phase faults. For this reason it is suggested to use the back-up or breaker failure protection clearing time for single-phase faults. PSCAD studies are not required for simulation of single-phase faults as resultant harmonic distortions in unbalanced situation would be mitigated at the detailed design stage of an HVdc scheme (these phenomena would not be captured in a PSS/E study). PSCAD FREQUENCY SCAN High level study. Impedance traces to be calculated as a function of frequency in order to flag potential harmonic issues. HAND CALCULATION – SUBSYNCHRONOUS RESONANCE (SSR) SSR prediction to be carried out using Kundur`s Unit Interaction Factor (UIF) method [2]. Based on the results of the analyses, perform a comparison of the HVdc schemes and the equivalent AC alternatives.
PDF created with pdfFactory Pro trial version www.pdffactory.com

EirGrid plc Investigating the Impact of HVdc Schemes in the Irish Transmission Network
Final Report
R1116.03.04, Page 17 Oct-18, 2009
© TransGrid Solutions Inc, 2009
2. General HVdc Information In this chapter, general information on key technological issues involving HVdc transmission either by the so-called classic technology – using power thyristors, and referred to as Line Commutated Converters (LCC), or through a more recent technology – using self commutated power electronic switches (IGBT – Insulate Gate Bipolar Transistors) and referred to as Voltage Source Converters (VSC) will be described and compared, with the objective of providing an overview of the two technologies which potentially could be used in this study application. Considerations of environmental and HVdc market aspects are also included in this chapter.
2.1. Why DC, why AC
There are applications in which HVdc transmission is either the unique or the most economical alternative for power transmission. Examples include:
• Transmission with overhead line distances above 1000 km, where the need of various intermediate tappings is not present (e.g. Itaipu and Nelson River projects);
• Interconnecting systems with different frequencies (50 Hz to 60 Hz) (e.g. Argentina-Brazil Garabi back-to-back project);
• Undersea or underground cables with lengths around 50 km or more (e.g. the Moyle project – 55 km sea cable, Directlink Australia – 59 km underground cable);
• Need for asynchronous operation (even at the same frequency base), like interconnection of different markets (e.g. Hydro Quebec-New England HVdc project);
• Need for absolute power scheduling (e.g. Basslink project) In other applications, the selection of AC or DC would normally be achieved through a technical and economic evaluation of a particular scheme. The HVdc technology represents a transmission with only two conductors instead of three (in AC), at zero Hz, i.e., it decouples the AC systems at each terminal, producing the asynchronous effect. Also, HVdc being a technology that employs solid state switching devices, its speed of power control is within a sub-cycle mode, which means a very fast control of the power being transmitted. For LCC HVdc applications, the effects of: (ii) very fast action towards reducing the voltage to zero and limiting the transmitted current when a fault occurs – an inherent circuit breaker effect - are also available. Figure 2.1 depicts a schematic of the typical arrangements of AC and DC alternatives. It also shows a comparison of AC and DC line tower configurations.
PDF created with pdfFactory Pro trial version www.pdffactory.com

EirGrid plc Investigating the Impact of HVdc Schemes in the Irish Transmission Network
Final Report
R1116.03.04, Page 18 Oct-18, 2009
© TransGrid Solutions Inc, 2009
Figure 2.1. Schematic Arrangements and Line Tower Configurations with AC and DC Furthermore, because of its nature of:
• not being coupled to AC networks • not participating in the impedance share of power in a meshed network • not presenting any transmission limit due to displacement angle between terminals • being able to transmit exactly the power level desired, irrespective to the rest of the system,
HVdc also has unique advantages to play an important role in congested networks or in situations where system stability is an issue. This ability to transmit according to a desired power level “order” allows for the possibility to incorporate an additional power level (signal) in its power order to assist the AC systems to become more stable. Examples:
o when a situation of frequency decay occurs in the receiving system (due to a sudden lack of generation, the HVdc is able to increase its power to compensate for this, in a very fast manner (less than a cycle);
o when the system frequency or machine angles are oscillating, the HVdc is able to provide more or less power to stabilize the network, providing both synchronizing and damping torques.
Figures 2.2 and 2.3 summarize typical HVdc installations, in terms of its main components and inherent characteristics.
PDF created with pdfFactory Pro trial version www.pdffactory.com

EirGrid plc Investigating the Impact of HVdc Schemes in the Irish Transmission Network
Final Report
R1116.03.04, Page 19 Oct-18, 2009
© TransGrid Solutions Inc, 2009
Figure 2.2. Typical HVdc Components (LCC and VSC based)
Figure 2.3. HVdc Technology Basis - LCC In terms of configurations, Figure 2.4 describes the most common arrangements found in HVdc applications. Some options rely on the possibility of allowing a current to flow through ground (or sea ground) during a loss of one pole. This is not always possible due to environmental constraints, therefore some arrangements consider the possibility of using the so-called metallic return, which is the use of the other conductor as a return path for the current in case of a loss of one valve group at a substation, thereby allowing half or even more than half of rated power. All of these possibilities are normally considered in the feasibility phase of the project studies and the technical, economic and environmental results are combined towards the adoption of the project’s final configuration.
PDF created with pdfFactory Pro trial version www.pdffactory.com
EirGrid plc Investigating the Impact of HVdc Schemes in the Irish Transmission Network
Final Report
R1116.03.04, Page 20 Oct-18, 2009
© TransGrid Solutions Inc, 2009
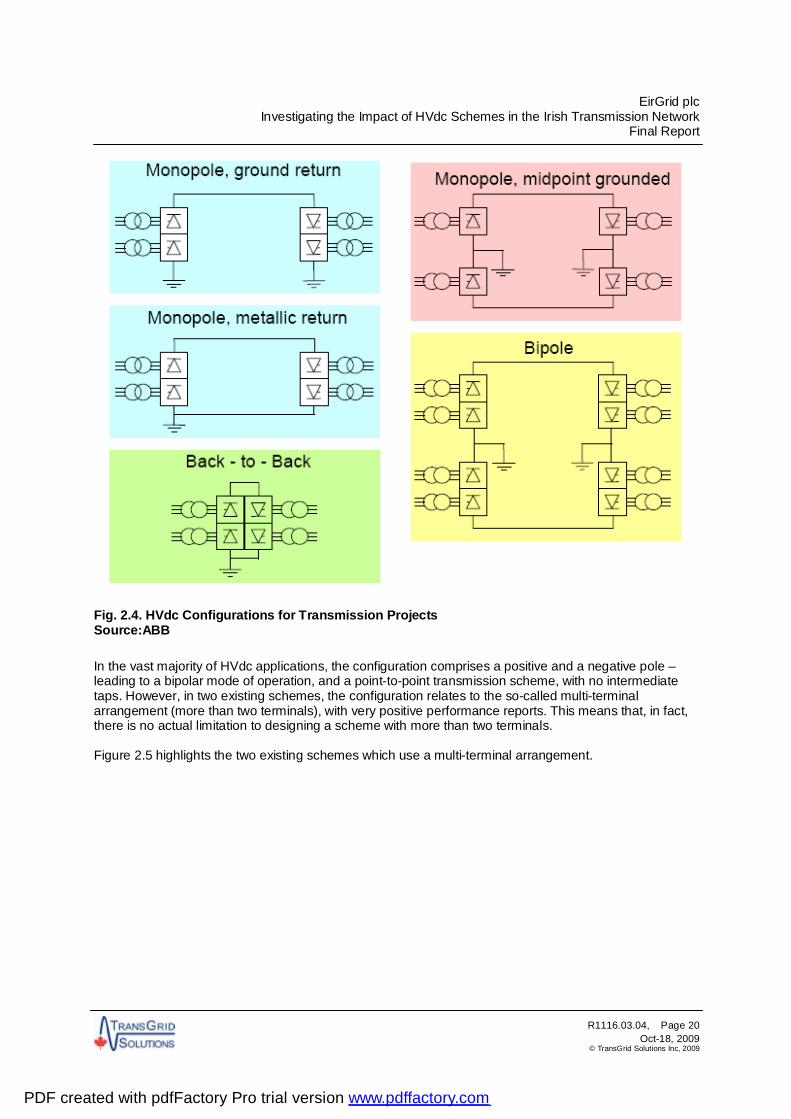
Fig. 2.4. HVdc Configurations for Transmission Projects Source:ABB In the vast majority of HVdc applications, the configuration comprises a positive and a negative pole – leading to a bipolar mode of operation, and a point-to-point transmission scheme, with no intermediate taps. However, in two existing schemes, the configuration relates to the so-called multi-terminal arrangement (more than two terminals), with very positive performance reports. This means that, in fact, there is no actual limitation to designing a scheme with more than two terminals. Figure 2.5 highlights the two existing schemes which use a multi-terminal arrangement.
PDF created with pdfFactory Pro trial version www.pdffactory.com

EirGrid plc Investigating the Impact of HVdc Schemes in the Irish Transmission Network
Final Report
R1116.03.04, Page 21 Oct-18, 2009
© TransGrid Solutions Inc, 2009
Figure 2.5. Existing Multiterminal HVdc Schemes, on the left the Hydro Québec original 5-terminals (today only with Radisson-Nicolet and Sandy Pond as Comerford and Des Cantons have been shut down) and on the right the Terna – Italy scheme.
2.2. Recent History on HVdc
Power thyristors were first used in an HVdc scheme, back in 1972 (still using air cooled valves, and from 1975, using water cooled valves), at the Eel River and Nelson River schemes, in Canada, respectively. Therefore, it is a development that was implemented almost 40 years ago. In this period, its design has been continuously optimized, in terms of compactness, reliability, quality of production, and mainly, in its voltage – current capabilities: its power range. Presently, this type of device can be used in any HVdc application ranging from few tens of kV (for back-to-back applications) to huge ± 800 kV / 4,5 kA trunk systems, as seen in recent developments in China and India. The VSC type of arrangement began to be used in power system transmission applications much more recently, in 1998. Till recently, say 2005, a clear market share between LCC and VSC applications has been established, with the latter being employed in small to medium size schemes, such as up to 300 MW and ±150 kV, leaving the applications of larger scales to the LCC technology. Also, it should be noted that VSCs till 2005 were used in underground or submarine cable schemes due to a technological limitation on its ability to handle dc line faults due to an existing permanent path for the current through the anti-parallel diodes at the valves; however this issue has been resolved by employing both ac and dc circuit breakers in a coordinated form and the Caprivi link in Namibia will employ a VSC overhead line application. Therefore, from 2006 and on, this market share between both technologies has been changed, for few main reasons and facts: (i) an overhead long distance scheme in Namibia – the Caprivi Link, has “cleared” the technological barrier of reducing the fault current to zero at the DC line to enable a successful restart; (ii) the voltage and current capabilities of modern IGBTs has been improved quite substantially , so manufacturers are now offering the possibility of applications at ± 500 kV and above
PDF created with pdfFactory Pro trial version www.pdffactory.com

EirGrid plc Investigating the Impact of HVdc Schemes in the Irish Transmission Network
Final Report
R1116.03.04, Page 22 Oct-18, 2009
© TransGrid Solutions Inc, 2009
1,000 MW; (iii) IGBT losses have being reduced so as to be become economically more and more comparable with thyristor based applications. As a conclusion, one can say the potential market share of the VSC technology can be predicted to enter into the LCC portion and to really compete with, up to the level of 1,000 MW to 1,500 MW power based schemes. As this study contemplated the year 2020 as its base scenario, this assumption is perfectly reachable. Also, with reference to multi-terminal applications, when employing VSC technology, power can be reversed at an intermediate tap independently of the main power flow direction without switching to reverse voltage polarity.
2.3. Comparison Summary of the LCC and VSC Technologies
There are a large number of published papers dealing with comparative analysis of both approaches. In this section, a summarized comparison will be presented. Also one can mention various papers of potential application of say mid-size schemes, where for some the LCC approach was selected, while in others, the VSC was preferred. In the latter case, an interesting application of a 340 MW link with 200 km of submarine cable, in the Mexican system was presented at CIGRÉ, in the 2008 Session. In this reference, by adopting losses at 1.8% with VSC, and employing SVCs at both terminals of the LCC alternative, the VSC solution became around 30% more economical as compared with the LCC. In summary the main characteristics of the LCC technology can be summarized as follows:
• Utilize thyristor technology • Commutation among voltage phases (switching) requires an external voltage source and is done
at fundamental frequency • Converters at both ends absorb reactive power • Difficult to be used in black start networks • Requires a minimum ratio between the DC power and the receiving end short circuit power of
approximately 2 – 2.5 • It can be used for multi-terminal applications, however, if the converters are of very different
power magnitude, it could be a problem, since the outage of a smaller converter may impose a temporary outage of the whole HVdc system
• It is well proven technology, with low losses (in the range of 0.6% to 0.75% per station, or 1.5% for both) and the series association of thyristors to reach voltages above 500 kV represents a known practice
• The LCC technique is referred to as current source converters • For power flow reversal, the current is kept (unidirectional) and the voltage changes polarity
On the other hand, the new VSC transmission technology presents the following characteristics:
• Can be used for purely passive networks, since does not require a voltage source at each end, due to its dc capacitor function (black start capability)
• It is a technology under a high derivative of technological development not so well proven as the LCC
• Its losses are still higher as compared to a LCC; typical values are 2.7% to 3.3% considering both stations
• It has some limitations in terms of overload capabilities • For power flow reversal, the voltage is kept and the current is reversed • Much more suitable for a multi-terminal application • Can be used for both cables and overhead applications • Can absorb or provide reactive power to the AC systems and can control AC voltage
PDF created with pdfFactory Pro trial version www.pdffactory.com
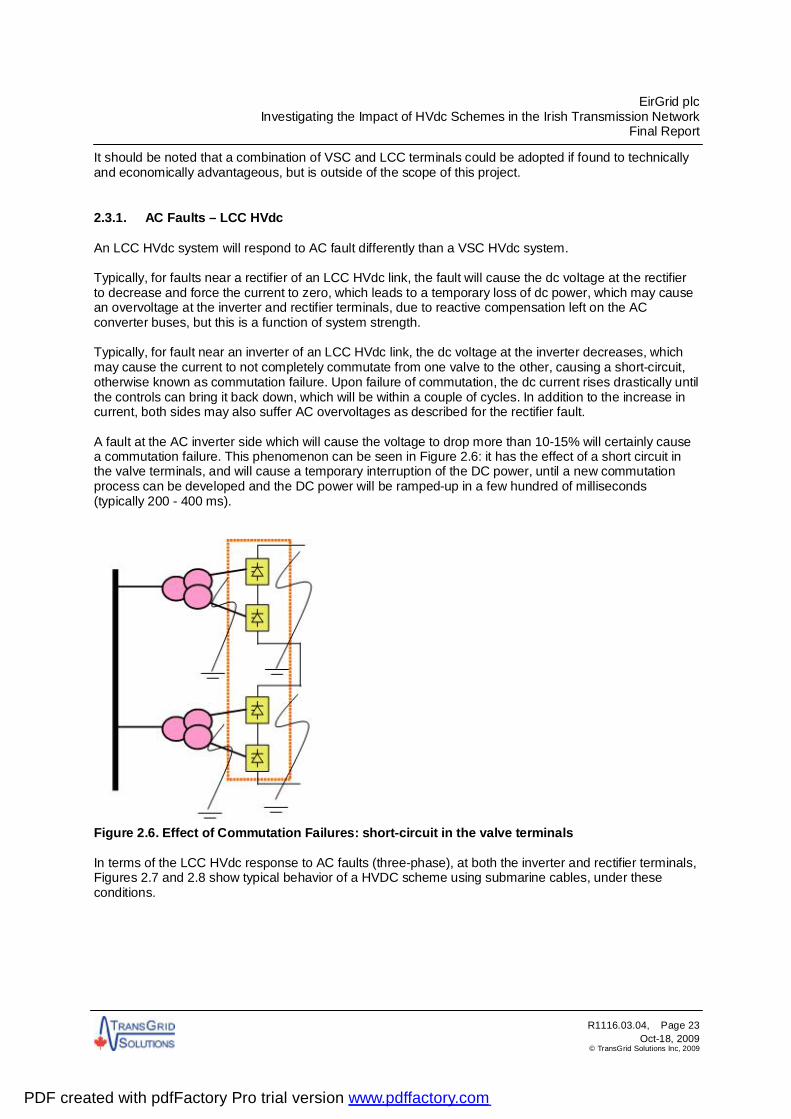
EirGrid plc Investigating the Impact of HVdc Schemes in the Irish Transmission Network
Final Report
R1116.03.04, Page 23 Oct-18, 2009
© TransGrid Solutions Inc, 2009
It should be noted that a combination of VSC and LCC terminals could be adopted if found to technically and economically advantageous, but is outside of the scope of this project.
2.3.1. AC Faults – LCC HVdc
An LCC HVdc system will respond to AC fault differently than a VSC HVdc system. Typically, for faults near a rectifier of an LCC HVdc link, the fault will cause the dc voltage at the rectifier to decrease and force the current to zero, which leads to a temporary loss of dc power, which may cause an overvoltage at the inverter and rectifier terminals, due to reactive compensation left on the AC converter buses, but this is a function of system strength. Typically, for fault near an inverter of an LCC HVdc link, the dc voltage at the inverter decreases, which may cause the current to not completely commutate from one valve to the other, causing a short-circuit, otherwise known as commutation failure. Upon failure of commutation, the dc current rises drastically until the controls can bring it back down, which will be within a couple of cycles. In addition to the increase in current, both sides may also suffer AC overvoltages as described for the rectifier fault. A fault at the AC inverter side which will cause the voltage to drop more than 10-15% will certainly cause a commutation failure. This phenomenon can be seen in Figure 2.6: it has the effect of a short circuit in the valve terminals, and will cause a temporary interruption of the DC power, until a new commutation process can be developed and the DC power will be ramped-up in a few hundred of milliseconds (typically 200 - 400 ms).
Figure 2.6. Effect of Commutation Failures: short-circuit in the valve terminals In terms of the LCC HVdc response to AC faults (three-phase), at both the inverter and rectifier terminals, Figures 2.7 and 2.8 show typical behavior of a HVDC scheme using submarine cables, under these conditions.
PDF created with pdfFactory Pro trial version www.pdffactory.com

EirGrid plc Investigating the Impact of HVdc Schemes in the Irish Transmission Network
Final Report
R1116.03.04, Page 24 Oct-18, 2009
© TransGrid Solutions Inc, 2009
Figure 2.7 Typical Behavior of an LCC HVdc scheme under an inverter 3Ø AC Fault Source: Siemens
Figure 2.8 Typical Behavior of an LCC HVdc scheme under a rectifier 3Ø AC Fault Source: Siemens During the fault period, the HVdc link is not able to transfer any power, However, it can be seen that the DC current order (or reference) has been kept at a reduced level (but not zero) in order to speed up and minimize the recovery period till reestablishing full power again.
PDF created with pdfFactory Pro trial version www.pdffactory.com

EirGrid plc Investigating the Impact of HVdc Schemes in the Irish Transmission Network
Final Report
R1116.03.04, Page 25 Oct-18, 2009
© TransGrid Solutions Inc, 2009
2.3.2. AC Faults – VSC HVdc
Unlike an LCC converter, a VSC converter does not fail commutation during an AC fault. Unless a three-phase AC fault is directly on the terminals of the VSC (either end), even at reduced terminal voltage during a three-phase fault elsewhere in the system, the VSC will still be able to feed a reduced amount of power to the AC system during the fault depending on the voltage reduction seen at the VSC AC terminals. In addition, the VSC will likely be able to recover faster than the LCC once the AC fault is cleared. Figure 2.9 shows simulation results for a 3-phase fault at the receiving end of a VSC based HVdc link.
Figure 2.9. Typical behavior of a VSC based HVdc scheme under a 3-ph AC fault (from Cigre 2006, paper B4-105).
2.3.3. DC Faults – LCC HVdc
An LCC HVdc system will also respond to a DC fault differently than a VSC HVdc system. A DC line fault in an LCC HVdc system will not draw any fault current from the AC system, as the fault current will extinguish quickly due to the uni-directional aspects of the thyristor valves. A dc line fault has a very similar impact on the AC systems as a rectifier fault. Typically in an overhead LCC HVdc link, following a DC fault, fast control actions reduce DC current within milliseconds after its initial increase. Then by pushing all converters to operate as inverters energy is removed from fault and the arc is extinguished. Normal operation can be resumed after waiting for a short ‘de-ionization’ period. In a cable HVDC system, faults usually cause damage to the cable and the system will trip after a DC fault. Figure 2.10 shows the behavior of the CIGRE Benchmark test system for a mid-point DC line fault.
PDF created with pdfFactory Pro trial version www.pdffactory.com

EirGrid plc Investigating the Impact of HVdc Schemes in the Irish Transmission Network
Final Report
R1116.03.04, Page 26 Oct-18, 2009
© TransGrid Solutions Inc, 2009
Figure 2.10. Typical Behavior of a HVdc scheme under a DC line fault. It can be seen that, from the receiving end standpoint (inverter terminal), a DC line fault and a sending end AC line fault show similar behaviors. Obviously, as in the case of AC faults, the DC line fault has to be cleared, before re-energization.
2.3.4. DC Faults – VSC HVdc
An inherent weakness of a VSC bipolar overhead line is a dc line fault. During the time it takes to clear a dc line fault, it is fed from all of the AC systems connected to the dc line through the VSC diodes. As a result, large fault currents will be drawn from the AC systems, however the effect will be less than a normal AC fault as the converter transformer, phase reactors, dc smoothing reactors (if present) and any line impedance between the location of the fault and the VSC introduce an impedance which limits the current drawn from the AC side as well as limiting the rate of growth of the fault current. However, for the length of time it takes to clear the dc line fault (around 60 ms as described in the next paragraph), the AC voltage in all connected systems will be reduced. The severity of the AC voltage reduction will depend on the strength of the AC system and location of the dc fault. Power infeed from the VSC is also significantly reduced while the fault is present as the power transfer in the faulty pole is stopped and power transfer in the healthy pole is reduced due to the drop in AC voltage. Based on information provided by one of the VSC suppliers, the dc line fault clearing sequence for converters connected pole-neutral operates as follows (timings are sequential and cumulative, but approximate), for a total time of 490 ms: • dc line fault detection +10 ms (to be conservative)
• open AC and dc breakers at all stations connected to the faulted pole +50 ms after fault detection. The AC breaker clearing time of +50 ms removes the fault current source, the dc breaker clearing breaks the dc line current transient to begin the deionization time
• dc line fault deionization time + 250 ms
• close AC breakers with damping circuit to re-energize converters +100 ms
• close dc breakers to re-energize dc line pole + 50 ms
• deblock converters to restart the power flow + 30 ms
PDF created with pdfFactory Pro trial version www.pdffactory.com

EirGrid plc Investigating the Impact of HVdc Schemes in the Irish Transmission Network
Final Report
R1116.03.04, Page 27 Oct-18, 2009
© TransGrid Solutions Inc, 2009
The same is true for a VSC cable application in that a pole to ground fault will draw current from the AC systems, however a cable fault is very rare compared to an overhead line fault and is considered permanent, so if it occurs the converters will not restart.
2.4. Environmental Considerations
As for the present study, the alternatives for transmission expansion consider the application of underground cables. It is interesting to visualize possible dimensions of both AC and DC substations and for the latter, considering both LCC and VSC solutions, for the sake of environmental impacts of each of the alternatives. CIGRÉ WG B4-44, was specially created to deal with HVdc environmental issues and is an excellent source of references on the subject. As a direct comparison of AC and DC projects, an interesting example is the Brazilian/Paraguayan Itaipu generation plant where 50% of the generation is at 50 Hz (most of it transmitted to Brazil via two bipoles of ±600 kV HVdc) and 50% at 60 Hz, which connects to three AC circuits of 765 kV. These lines run in a parallel geographic arrangement. Figure 2.10 shows the sending end AC and DC terminals, which are located adjacent in Foz do Iguacu. One can see that the foot print dedicated to the DC alternative is approximately twice the one used for the AC solution. Although the power levels for this scheme are beyond the ones considered in the present study, this comparison provide a good basis for analysis at reduced power levels. In this comparison, one relevant point is that most of the difference between both alternatives relies on the presence of AC and DC filters and the valve hall in the HVdc alternative. Please note that in Figure 2.11 only the DC link yard arrangement is detailed, not the AC system yard, however the figure does correspond to the actual footprints.
Fig, 2.11. Itaipu AC and DC Stations at Foz do Iguacu (sending end terminal). A second interesting comparison can be made within the HVdc alternative when comparing LCC and VSC solutions. For this comparison, equipment suppliers usually provide relevant information. Figure 2.11 shows a comparison of foot print requirements of 400 MW LCC and VSC solutions, based on Siemens approach.
PDF created with pdfFactory Pro trial version www.pdffactory.com

EirGrid plc Investigating the Impact of HVdc Schemes in the Irish Transmission Network
Final Report
R1116.03.04, Page 28 Oct-18, 2009
© TransGrid Solutions Inc, 2009
Fig. 2.12. Comparison of HVdc LCC and VSC stations. Source: Siemens. As per the comparison above, one can state that the VSC solution provides a 40% reduction in the foot print requirements compared to LCC. Again, in this case, the non-presence of AC and DC filters in the VSC solution is the key factor for obtaining the space reduction, since for the same level of MW and kV, there is no reduction possible in the other components and in electrical distances. Please note that this 40% reduction in the foot print is based on a direct comparison of LCC and VSC, i.e. both alternatives being bipoles or both alternatives being monopoles. This analysis has been based on air insulated technology, not considering gas insulated arrangements. In conclusion, one can say that for the power levels being considered in the present study, a similar station foot print requirement for a future project, employing air insulated technology could be found by either an AC or a HVdc – VSC solution; and a twice the amount of space would be required if the comparison is made between AC and HVdc LCC alternatives. In terms of operating HVdc schemes, many of its environmental issues are related to the electrodes and ground currents derived from unbalanced operation, such as in monopolar mode in which ground current flows. Experience to date, with HVdc schemes, shows there is strong correlation between good environmental understanding during project planning and implementation of new HVdc projects. One of the main challenges is to respond adequately to public concerns with sound information in an understandable form. One of the most critical issues is the subject of electrodes and operation of the HVdc links using electrodes. The concerns related to electrodes are:
- Interference with electrical systems (i.e. dc saturation of transformers) - Corrosion due to electric fields from electrodes (on third party property, pipelines etc) - Chlorine emission from sea anodes and impact on marine life
In case of ground electrodes are not allowed for any reason, a separate low voltage conductor need to be installed to provide a path for the current under unbalanced operating conditions.
PDF created with pdfFactory Pro trial version www.pdffactory.com

EirGrid plc Investigating the Impact of HVdc Schemes in the Irish Transmission Network
Final Report
R1116.03.04, Page 29 Oct-18, 2009
© TransGrid Solutions Inc, 2009
2.4.1. DC Saturation of Transformers
Transformer saturation is a well-known and well understood problem in east-west power transmission in Northern and Southern latitudes. This is caused by the natural latitudinal ground potential differences caused during auroral storms. Transformer saturation may occur due to electric fields around electrodes. Current entering the grounded star point of a transformer will lead to constant magnetizing of the core, which, superpose the symmetrical AC magnetizing. Saturation is not a serious problem for the huge number of small grid transformers (< 200 MVA), because they are normally three-phase, three-limbed. Attention should be drawn to large single phase units and to large three-phase units. These transformers are often five-limbs to reduce transportation heights. Reactors with magnetic cores, for compensation purposes, are not exposed to dc saturation, because the gaps in the magnetic circuit prevent the reactor from achieving any significant constant flux. The problem of saturation can be reduced or solved by introducing resistances or blocking devices in the neutrals. Anyhow, the most effective protection for transformer saturation is to locate the electrode station sufficiently distant from any large substation, including the converter station.
2.4.2. Electrical and Magnetic Fields and Corrosion
When current flows through sea and earth, an electric field will be set up between the two electrodes. The magnitude and distribution will depend on the resistivity of the earth layers and sea in the area. The movement of the ocean currents through the earth’s magnetic field induces a natural electric field in seawater. The field varies according to water velocity and geomagnetic variability. At an easily calculated distance from each electrode this background field will exceed the electric field set up by the HVdc electrode current. Increased corrosion impact on metallic installations can be a consequence of the electrical field set up by an electrode. Stray currents can flow in long metallic installations, like pipelines, or smaller installations close to the electrode. Increased corrosion can occur where the stray current leaves the metal, when the stray current value exceeds known values. Experience from existing and planned HVdc links shows that the corrosion problem can be avoided or mitigated cost-effectively. On submarine pipelines adding more material to the existing sacrificial anodes or new anodes on the pipelines can provide mitigation.
2.4.3. Magnetic Fields
Magnetic fields are related to installations with sea electrodes, which might not be the case of the foreseen applications of this study. Compass deviation is one concern related to this but only for very shallow sea crossings and harbour areas. The magnitude of the magnetic field at sea level will depend on the depth of sea. The natural earths magnetic field 12 m from a cable with a current of 1000 A is of the same magnitude as the cables magnetic field. Compass deviation appears to be of concern in some countries rather than a worldwide issue. The naval authorities may put restrictions in entrances to harbours to limit compass error. A possible way to handle compass deviation in coastal areas or shallow waters is to locate a sea electrode off the coast so the electrode cable follows the HVdc cable through the critical area. Another concern is magneto-sensitive fish and marine life.
2.5. Market Considerations
HVdc is an evolving and very successful technology, present on all five continents, with very different challenges to be reached. More recently, with the plans for building two new HVdc schemes per year, in
PDF created with pdfFactory Pro trial version www.pdffactory.com

EirGrid plc Investigating the Impact of HVdc Schemes in the Irish Transmission Network
Final Report
R1116.03.04, Page 30 Oct-18, 2009
© TransGrid Solutions Inc, 2009
China, it can be expected that the existing worldwide 90,000 MW of commercial projects (in construction or in operation) will double the capacity in 20 years time. Figure 2.13 describes a market diagram of the existing HVdc schemes on a worldwide basis, taken in 2003, when the total installed capacity was in the range of 70,000 MW.
HVDC in the World
Figure 2.13. HVdc transmission schemes worldwide.
2.6. HVdc Power Dispatching
Additional information that is relevant to this study is the ability and current practices of HVdc dispatches during a day or on a yearly basis. Several examples of commercial schemes dispatch profiles have been obtained and herein reported. Figures 2.14 and 2.15 show typical daily dispatches of two schemes: (i) The Brazilian Itaipu ±600 kV Bipoles 1 and 2 scheme; (ii) the Norway to Denmark Skagerrak HVdc Bipoles 1 to 3 scheme.
PDF created with pdfFactory Pro trial version www.pdffactory.com

EirGrid plc Investigating the Impact of HVdc Schemes in the Irish Transmission Network
Final Report
R1116.03.04, Page 31 Oct-18, 2009
© TransGrid Solutions Inc, 2009
Fig. 2.14. Example Itaipu Daily Dispatch Profile
Fig. 2.15. Example Skagerrak Daily Dispatch Profile
In the Itaipu scheme, one bipole operates close its full capacity (3,150 MW) where the second bipole matched the power level required. In the Skagerrak dispatch diagram, the negative power represents import flow from Denmark to Norway, where the opposite stays for export from Norway to Denmark. In theory, the power order Porder of a HVdc link may vary as needed to match the desired flow level. The speed of the Porder MW/sec variation will depend on the strength of the AC network to withstand these variations, on a safe mode, without triggering a disturbance effect, such as voltage/power oscillation or collapse. The Porder should be changed at both terminals and this requires a coordination of signals between both terminals, through telecom infrastructure. However, this is not an issue, and all HVdc schemes do have this capability with redundancy, so as to ensure a safe coordination at any circumstance. In LCC HVdc schemes, one should also look at the converter transformer tap changer operation cycle, as changes occur in the system. At the rectifier side, the tap changer controls the alpha angle in order to keep it at the set point (usually 15 degrees). At the inverter, the tap changer controls the desired dc voltage level. Also, in large variations of Porder, one should keep in mind switching operations with AC filters to match the reactive/active power balance at each terminal. It is also important to visualize the HVdc power dispatching on an annual basis. A good example can be found from the New Zealand HVdc scheme which interconnects both Islands (South and North). Figure 2.16 shows the recollection of 5 years of operation, from January 2003 to September 2008, recording the weekly maximum values of power dispatch at each direction.
PDF created with pdfFactory Pro trial version www.pdffactory.com

EirGrid plc Investigating the Impact of HVdc Schemes in the Irish Transmission Network
Final Report
R1116.03.04, Page 32 Oct-18, 2009
© TransGrid Solutions Inc, 2009
HVDC TRANSFER (Weekly Average) JAN 2003 - SEP 2008
415
416 45
745
739
136
934
033
5 364
346
339 37
637
727
925
019
613
511
712
114
014
6 178
183 24
323
117
124
823
118
119
016
815
413
712
920
218
819
118
328
0 302
288 31
833
427
8 341
323 35
6 390
358
346
265 33
3
-37
-40 -26 -14
-24
-29
-37
-28
-25
-35
-34
-35
-28
-41
-69
-59
-74
-68
-85
-83
-75
-96
-93
-109
-132 -110
-101
-110 -8
4-8
2-8
4-8
8-1
10-1
07-1
21 -87
-81 -5
2-4
7 -16
-12
-11
-44
-40 -1
0-4
0-3
3-2
9-7
1-6
0 -44
-44
-600
-400
-200
0
200
400
600
800
1000
1 2 3 4 5 6 7 8 9 10 11 12 13 14 15 16 17 18 19 20 21 22 23 24 25 26 27 28 29 30 31 32 33 34 35 36 37 38 39 40 41 42 43 44 45 46 47 48 49 50 51 52
Jan Feb Mar Apr May Jun Jul Aug Sep Oct Nov Dec
WEEK NO.
MW
DCN DCS DCN Max Weekly Ave DCN Min Weekly Ave DCS Max Weekly Ave DCS Min Weekly Ave
Figure. 2.16. New Zealand HVdc scheme annual dispatch profile (2003 – 2008) on a weekly basis. Courtesy: Transpower, NZ. Figure 2.16 Legend: DCN - HVDC power transfer from the south island to the north island. DCS - HVDC power transfer from the north island to the south island. Upper red line: average weekly maximum northwards HVDC power transfer. Lower red line: average weekly minimum northwards HVDC power transfer. Upper blue line: average weekly minimum southwards HVDC power transfer. Lower blue line: average weekly maximum southwards HVDC power transfer. The bars: MW weekly average transfer in both directions.
2.7. Operational Considerations
An LCC HVdc link is normally designed to operate between 10% and 100% of its rated power, without being disconnected, unless necessary or suitable for system operation. Its ability to provide quick response to system needs leads to establishing the link as available most of the time. In case a re-synchronization should be done after a shut down, this quick response ability is lost.
2.7.1. Converter Start Up and Shut Down
There are two steps involved in the start up of a DC link, whether it is an LCC or a VSC link. For LCC systems, it should be highlighted that normally a minimum DC current level of 10% of the rated power is imposed, so as to enable a suitable and stable thyristor operation with no discontinuities.
1) AC Energization In this step, the AC breakers are closed to energize the converter transformer. Typical pre-conditions here include the cooling system of the valves being in operation and the ground switches being in the open position. This step is performed independently at each station.
PDF created with pdfFactory Pro trial version www.pdffactory.com

EirGrid plc Investigating the Impact of HVdc Schemes in the Irish Transmission Network
Final Report
R1116.03.04, Page 33 Oct-18, 2009
© TransGrid Solutions Inc, 2009
Once the transformer is energized, the tap changer controls are activated and drive the tap changer to a pre-determined tap position.
2) Converter Start Up (Deblock) In this step, the converters are put into operation. The term “deblocked” refers to the release of the pulses from the valve controls to the converters. In this step both ends must be available for the deblock. Typically, the deblock is performed at minimum power to minimize the impact on the ac system. There are two types of shutdown.
1) The first is manual or planned shutdown, which is referred to as blocking. In this case HVdc link power is ramped down to the minimum power and then a command is simply sent to block the pulses to the converters at both stations. The stations can remain AC energized and can be put back into operation any time.
2) The second type is a shutdown due to a fault which would involve the tripping of the AC breaker
at the faulted station. In these situations the DC can be re-energized and deblocked within minutes (need to allow time for the filters to discharge before re-energization). However, it is always prudent to investigate the cause of the fault.
2.7.2. HVdc with Wind Penetration
HVdc plays an important role with regards to increasing wind energy penetration scenarios. One reason is related to a suitable asynchronous connection type between generators and the network, which might help the stability conditions of the wind generators. Another reason is due to the fact that many new wind farm projects will be located off-shore, and the need for relatively long (above 50 km) submarine cables would lead to the employment of the DC technology. In this case, VSC appears to be the most attractive alternative, as it provides among other advantages, the network black-start possibility (pure passive grid), a more flexible reactive power exchange pattern between converters and the AC system, more adequate power and voltage levels etc. Another advantage of the VSC DC alternative is related to the fact that there is no voltage polarity reversal, as there is in the case of LCC. LCC cables should be purchased and designed having in mind whether or not there would be polarity reversal and under what frequency conditions. In the VSC case, the voltage is not reversed when the flow should change its direction, as it is the current which reverts. The XLPE cable is used with VSC DC and is not used with LCC DC, and therefore has no issues with power reversal because the voltage polarity is not affected, only the current direction is changed. Therefore it is not a cable issue, it is a converter function. In the case of the MI cable, the current is in the same direction but the voltage is reversed and certainly the cable can be more vulnerable. However, it has not been an issue for any of the cable systems. In both the LCC and the VSC, there are no limitations on the frequency of power reversal, assuming that power is not reversing every few minutes. The frequency of power reversal should be stated in any specifications. The difference between power reversal in LCC and VSC is explained above. Obviously reversal in the LCC means voltage polarity reversal, which adds some stresses to some equipment such as the cable and converter transformers. However, the power reversal on demand is performed usually over a ramp to protect the ac system. The dielectric in a cable becomes polarized with a time constant that is essentially proportional to the resistivity times the dielectric constant. So, when the voltage is reversed, the stresses inside the cable are significantly increased. Immediately following the reversal, the internal stress on the dielectric system is the DC field distribution immediately before the reversal plus the AC (dielectric) field distribution after the reversal. If the reversal is short lived, then the effect should be limited because partial discharges activity should be limited to a very short time. If the voltage is maintained at the full DC voltage with the new polarity after the reversal, the stresses will be redistributed with the time constant as given above.
PDF created with pdfFactory Pro trial version www.pdffactory.com

EirGrid plc Investigating the Impact of HVdc Schemes in the Irish Transmission Network
Final Report
R1116.03.04, Page 34 Oct-18, 2009
© TransGrid Solutions Inc, 2009
In addition, there are no restrictions on how often an HVdc link is started up or shut down. It does not apply extra stresses on the equipment.
PDF created with pdfFactory Pro trial version www.pdffactory.com

EirGrid plc Investigating the Impact of HVdc Schemes in the Irish Transmission Network
Final Report
R1116.03.04, Page 35 Oct-18, 2009
© TransGrid Solutions Inc, 2009
3. AC and DC Performance Statistics Highlights As statistics for AC systems performance are not commonly found in literature, the main source of information used herein has relied on the Brazilian Transmission Interconnected System, under the responsibility of the Brazilian TSO, called ONS. The ONS statistics are made available by type of equipment (called transmission function) and do not produce general and consolidated figures for the AC system performance as a whole. Therefore the following statistics can be found:
- Transformers - Reactors - Capacitors - Transmission lines - Busbars - Generators
Failure Statistics on the Brazilian Interconnected System, prepared by ONS, have been collected based on data from 2002 to 2006, covering the national grid from 220 kV up to 750 kV systems. As for EirGrid/NIE/SONI, the likelihood of constructing new overhead transmission lines is low. For the sake of comparing AC with DC, failures rate on transformers, reactors and capacitors have been taken as being representative of AC systems performance. A special emphasis has been given to comparing AC transformer and converter transformer for HVdc applications in terms of performance and outage statistics, for reasons explained below. HVdc systems are known for producing relevant statistics related to its performance since 1972, through CIGRE. Therefore, in this section, a comparison analysis between the Brazilian TSO (ONS) and the CIGRE Group B4-04 on HVdc Performance has been combined to attempt to provide a general view how those two solutions can be compared in terms of their reliability and availability, having in mind that comparing two different sources of data ought to be done with caution; however, there is no common platform where this analysis can be found and TGS is offering this analysis for enhancing the information requested by EirGrid/NIE/SONI. AC systems performance data are normally produced in terms of number of failures per year – frequency of failures. For HVdc systems, as they directly influence the active power (or energy) being transmitted, CIGRE performance figures are generally produced in terms of equivalent energy availability (in % of time), which also takes duration time into account.
3.1. AC System Statistics
All results are based on data from ONS reports for 5 years of operation – 2002 to 2006. AC transformers
• Forced Outages Considering 9959 as the total sampling figure and a total of 3214 transformers with outages, the figure of 0.32 transformer/year is calculated, which means each transformer fails 3.2 times during every 10 year period. It should also be considered that these are outage figures not failure rate figures. When one looks more deeply at the ONS data, it can be verified that approximately 20% of the number of outages are due to transformer internal faults.
• All Outages A similar figure can be prepared considering all types of outages, due to faults: internal and external, permanent and temporary, forced and scheduled. The total figure reached approximately 0.59 transformer/year, or alternatively 1.69 years/failure. Duration time to repair failed transformers was on an average 24 hours.
PDF created with pdfFactory Pro trial version www.pdffactory.com

EirGrid plc Investigating the Impact of HVdc Schemes in the Irish Transmission Network
Final Report
R1116.03.04, Page 36 Oct-18, 2009
© TransGrid Solutions Inc, 2009
AC Reactors • Forced Outages
Considering the same criterion, the ratio of 0.14 reactor/year is calculated, which means each reactor fails 1.4 times during every 10 year period.
• All Outages A similar figure can be prepared considering all types of outages, due to faults: internal and external, permanent and temporary, forced and scheduled. The total figure reached approximately 0.18 reactor/year, or alternatively 5.55 years/failure. AC Capacitors
• Forced Outages Considering the same criterion the ratio of 0.43 capacitor/year is calculated, which means each capacitor fails 4.3 times during every 10 year period.
• All Outages A similar figure can be prepared considering all types of outages, due to faults: internal and external, permanent and temporary, forced and scheduled. The total figure reached approximately 2.2 capacitor/year, or alternatively 0.45 years/failure. Overall AC Availability Indices Based on the same source (Brazilian ONS), it can be verified that an overall availability ratio between 99% and 99.5% is achievable, considering the whole set of installations of the Interconnected Transmission System (220 kV and above network), depending on the year and particular conditions that might occur, such as particular major failures. This illustrative figure may be obtained considering an average or consolidated index of the general performance of each transmission function (transmission lines, transformers, reactive compensation equipment, capacitors, protection equipment etc.), weighted and compound by individual line lengths or MVA equipment rating, not meaning that the electricity service has been shut down for 0.5% or 1% of the time. This overall index was meant to provide a possible comparison with availability indices of HVdc schemes and should be read as performance indices of each transmission function in general. Again, it should be noted that there is no place where AC and DC statistics are equally treated.
3.2. HVdc Statistics - CIGRE Protocol
CIGRE advisory group B4.04 collects data annually on the reliability and performance of HVdc systems in operation throughout the world. The Energy Availability is a measure of the amount of energy that could have been transmitted over the HVdc systems, except as limited by the forced and scheduled outages of the converter station equipment and dc transmission lines or cables. The energy utilization is a measure of the energy actually transmitted. Both parameters are expressed in percentage based on the maximum continuous capacity of the HVdc systems. Forced Energy Unavailability (FEU) is the amount of energy that could not been transmitted over the dc system due to forced outages. B4.04 Protocol only considers converter station equipment outages and not the dc line or cables. Scheduled Energy Unavailability (SEU) is the amount of energy that could not have been transmitted over the DC system due to scheduled outages. It is clear that scheduled outages have less impact because such outages can be taken during light load conditions. Main definitions used in the Protocol are:
PDF created with pdfFactory Pro trial version www.pdffactory.com

EirGrid plc Investigating the Impact of HVdc Schemes in the Irish Transmission Network
Final Report
R1116.03.04, Page 37 Oct-18, 2009
© TransGrid Solutions Inc, 2009
• Pm is the maximum continuous capacity excluding any added capacity available through means of redundant equipment.
• PO is the outage capacity and is defined as the capacity reduction which the outage would have
caused if the system is operating at its maximum continuous capacity Pm. • The Outage Duration Factor ODF is ODF= PO/Pm • Actual outage duration AOD, is the time elapsed in decimal hours between the start and the end
of the outage. • The Equivalent Outage Duration EOD is EOD=AOD x ODF This is to take into account the
partial loss of capacity. Each EOD can be classified in terms of the type of outage i.e. for forced outages it is EFOD and for scheduled outages it is ESOD.
• PH is the number of calendar hours in the reporting period (8760 or 8784 in leap years). If the
equipment is commissioned part way through a year, PH will be proportionately adjusted. • AOH is the actual outage hours and is defined as AOH= ∑AOD. For forced outages it can be
termed as AFOH and for scheduled outages it is ASOH. • EOH is the equivalent outage hours and is defined as EOH= ∑EOD. For forced outages it can be
termed EFOH and for scheduled outages it is ESOH.
• The energy unavailability in % EU = (EOH / PH) x 100
• The forced energy unavailability in % FEU = (EFOH/ PH) x 100
• The scheduled energy unavailability in % SEU = (ESOH / PH ) x 100
• The energy utilization factor in % U = [(total energy transmitted)/(Pm x PH)]x100 In the Protocol there are also definitions regarding the collection of data for commutation failures and DC line faults. In addition the converter station equipment is classified into major categories for the purpose of reporting the cause of capacity outage or reduction.
• AC and auxiliary equipment which includes: 1. AC filters and shunt banks 2. AC switch yard control and protection 3. Converter transformers 4. Synchronous compensators 5. Auxiliary equipment & auxiliary power 6. AC circuit breakers, measuring equipment in the ac yard, and any other ac yard
equipment.
• Thyristor valves 1. All valve electrical problems. 2. Valve cooling and any part of the valve at high potential related to cooling.
• DC control and protection
• Primary dc equipment
1. DC filters 2. DC smoothing reactor
PDF created with pdfFactory Pro trial version www.pdffactory.com

EirGrid plc Investigating the Impact of HVdc Schemes in the Irish Transmission Network
Final Report
R1116.03.04, Page 38 Oct-18, 2009
© TransGrid Solutions Inc, 2009
3. MRTB 4. DC switching equipment 5. DC switch yard and other valve hall equipment, such as dc bushings, arrestors, and
measuring equipment. 6. DC ground electrode line 7. DC ground electrode
• DC transmission lines • DC cables
3.2.1. Outage Statistics
Figure 3.1 identifies very important information. It categorizes the main source of failure on an HVdc installation. It can be seen that the AC equipment is the dominant element of failure.
Figure 3.1 Breakdown of the average FEU by equipment Category of all reporting HVDC thyristor systems (1983-2004) Another CIGRE statistic shows that converter transformers are responsible for 81% of the AC equipment failure, which means that this is the component with major impact upon DC system availability, therefore being the main concern in terms of spare parts and units when designing a new HVdc scheme. Figure 3.2 shows, categorizes the causes of failures within converter transformers.
AC-E 66.4% V 7%
C&P 9.1 %
DC E 16.6%
O 1% LEGEND:
AC and Auxiliary Equipment (AC-E) (AC yard plus transformers)
DC Equipment (DC-E) (From the secondary of transformers to the DC yard, except valves)
Valves (V)
Other (O)
Control and Protection (C&P)
PDF created with pdfFactory Pro trial version www.pdffactory.com

EirGrid plc Investigating the Impact of HVdc Schemes in the Irish Transmission Network
Final Report
R1116.03.04, Page 39 Oct-18, 2009
© TransGrid Solutions Inc, 2009
Figure 3.2 Converter transformer failures by category.
3.2.2. Overall DC Availability Indices
Based on CIGRE statistics, it can be verified that an overall availability ratio between 97% and 98%, or (FEU + SEU) between 2% and 3%, is achievable, considering the whole set of installations that report to CIGRE on an annual basis, depending on the year and particular conditions. This is mainly with regards to the existence or not of spare parts, since when one converter transformer fails and there is no spare unit, the MW to be transmitted through this pole is reduced to zero.
3.3. An Attempt to Compare AC with DC Substations Availability
Table 3.1 attempts to categorize in one table the statistics gathered from both mentioned sources, focusing on transformer failures, both AC and converter DC. For AC, the ratio of 20% between internal failures and outages has been used, as explained earlier. Table 3.1. Comparison of AC and Converter Transformers Failures
No. of Tfr. No. of Failures Average Failure Rates Years btwn
Report Period Tfrs. Years Actual Prevent Actual Prevent Total Failure CIGRE B4.04 Conv. Transf. 1991 -- 2002 405 4350 53 25 0.0122 0.0057 0.0179 55.8
CIGRE B4.04 Conv. Transf. 1972 -- 2002 445 6252 86 113 0.0138 0.0181 0.0318 31.4
Brazil - ONS AC Transformers 2002 - 2006 2056 9959 642 NA 0.0542 NA 0.0542 18.4
55% Valve Winding
12% AC Winding
12% Bushings
17% Tap Changer
2% Static Shields
2% Internal Connections
PDF created with pdfFactory Pro trial version www.pdffactory.com

EirGrid plc Investigating the Impact of HVdc Schemes in the Irish Transmission Network
Final Report
R1116.03.04, Page 40 Oct-18, 2009
© TransGrid Solutions Inc, 2009
Table 3.1 shows that, in principle, AC transformers are failing much more than converter DC transformers. However, its effect on the availability ratio is lower than for DC systems due to the fact that converter transformers have a direct impact upon Energy Availability and AC transformers might or might not have a direct impact, depending on their location in the network. Table 3.2 replicates one of the summarized tables of performance of the CIGRE Protocol, which demonstrates the major impact that failures cause upon Energy Unavailability for systems that have no spare parts, or due to repetitive failures affecting spare parts.
Table 3.2. Average Actual Outage Duration for Converter Station Forced Outages.
2005 2006 System
No. of Outages
Average Duration
Hours
No. of Outages
Average Duration
Hours Skagerrak 1 & 2 3 40.2 3 0.6 Skagerrak 3 4 916.0 7 1057.3 Vancouver Island Pole 2 2 10.9 7 9.5 Square Butte 10 7.2 5 3.2 Shin-Shinano 1 1 0.6 0 0.0 Shin-Shinano 2 0 0.0 0 0.0 Nelson River BP1 32 14.1 36 6.2 Nelson River BP2 31 4.3 40 5.1 Hokkaido-Honshu 0 0.0 1 288.3 CU 7 1.7 4 4.3 Gotland 2 & 3 3 2.0 2 0.2 Itaipu BP1 15 4.1 7 14.8 Itaipu BP2 7 3.0 7 4.6 Highgate 1 1.0 1 4.0 Virginia Smith 13 2.3 8 2.3 Vindhyachal 5 7.7 8 4.2 McNeill 2 6.7 7 3.8 Fennoskan 0 0.0 3 74.5 Rihand-Dadri 4 2.0 12 368.5 SACOI 11 1.6 13 3.0 New Zealand Pole 2 3 1.5 3 1.0 Sakuma 0 0.0 2 27.3 Baltic Cable 5 10.7 11 12.1 Kontek 2 1.2 1 2.5 Chandrapur 8 40.0 10 42.5 SwePol 11 35.8 4 0.4 Vizag I East-South 3 150.1 0 0.0 Vizag II East-South 5 1.3 0 0.0 Kii Channel 3 47.1 2 178.4 Malaysia-Thailand 8 2.3 6 2.2 Grita 4 8.0 3 1.5 Rivera 5 354.5 8 5.0 Talcher-Kolar 28 5.7 17 6.7 Sasaram 6 0.5 17 2.2
There has been a frequent discussion, within the technical community such as CIGRÉ, on spare parts, redundancy, technology updating issues, so as to ensure the maximum energy availability from the HVdc links. The so called conventional equipment, as transformers, reactors etc., usually have a life cycle in the range of 35 years, which means, in the same range of the project overall life cycle. The electronic parts of control and protection (C & P), however, although not showing a direct lifetime reduction from a continuous use, may have to replaced, updated or enhanced during the life span of the project, and then a difficulty may arise: the digital electronic technology changes at a very fast speed and old versions from electronic cards may not be available at the time when required.
PDF created with pdfFactory Pro trial version www.pdffactory.com

EirGrid plc Investigating the Impact of HVdc Schemes in the Irish Transmission Network
Final Report
R1116.03.04, Page 41 Oct-18, 2009
© TransGrid Solutions Inc, 2009
An interesting discussion on these aspects of C & P updating took place at CIGRE SC B4 Session, in 2008. A recommendation to have enough spare parts of C & P by the time the project is developed might be a good solution to ensure a continuous operation of all functions, with the same technology as per the initial period of the project. Nevertheless, if there is a need for partial replacements of C & P functions it may well be implemented in a coordinated way with the remaining ones.
PDF created with pdfFactory Pro trial version www.pdffactory.com

EirGrid plc Investigating the Impact of HVdc Schemes in the Irish Transmission Network
Final Report
R1116.03.04, Page 42 Oct-18, 2009
© TransGrid Solutions Inc, 2009
4. Study Assumptions The following assumptions were made throughout the study:
• The Ireland – Great Britain HVdc link (East-West Interconnector) will be in-service for all scenarios and will be modeled as an LCC based link in order to simulate the most onerous scenario**. The East West Interconnector consists of two submarine cables of 150 millimeters in diameter, and has a total capacity of 500 MW. The link will be monopolar at 450 kV dc voltage. A detailed two-time step model was developed for the East-West Interconnector based on a typical HVdc link. The Welsh end is modeled as a bus with a generator connected to it (as per Moyle/Scotland).
• Synchronous condenser at Coolkeeragh will be dispatched in all scenarios.
• 75 MW of static reserve will be kept available on the Moyle HVdc interconnector.
• Sufficient reserve to cover loss of the largest infeed (excepting interruptible load) will be incorporated into each dispatch scenario.
• TGS expects that EirGrid/NIE/SONI will ensure the network models that are provided are N-1/N-G planning criteria compliant in the region of the network relevant to the study scenario. In case of any violations occurring in the base case (AC option) the HVdc options will only be compared in terms of the impact to these base case violations and mitigation measures will not be found to fix these base case violations as they are unrelated to the HVdc solutions.
• New SVCs were included in the various power flow cases at the following buses in order to provide necessary reactive power support:
o 74520 Castlereagh
o 75010 Coleraine
o 81010 Hannahstown
o 81510 Kells
o 82020 Kilroot
o 87510 Omagh
o 87520 Omagh
o 90020 Tandragee
o 70520 Ballylumford
**Since the completion of the study work, the contract for the East-West HVdc link has been awarded and the link will be built using VSC technology, not LCC technology as was assumed in this study. This is expected to have a positive impact to all AC and HVdc option results presented in this report as the VSC link will be capable of supplying/absorbing a large amount of dynamic and steady state reactive power, thereby providing superior voltage control in comparison to the LCC HVdc link that was modeled for the East-West link. A major difference to the system however would be the impact of an East-West DC line fault, as short circuit current will be drawn from the AC system into the DC line fault if the link is using VSC technology thereby appearing to the AC system as a remote fault, whereas the LCC link would not draw any short circuit current from the AC system. It would be recommended to perform this particular fault to determine the exact impacts to the various AC and HVdc options.
PDF created with pdfFactory Pro trial version www.pdffactory.com

EirGrid plc Investigating the Impact of HVdc Schemes in the Irish Transmission Network
Final Report
R1116.03.04, Page 43 Oct-18, 2009
© TransGrid Solutions Inc, 2009
5. Study Tools and Models
5.1. PSSE
The primary study tool for this project is the PSSE loadflow and stability software package which is an industry standard worldwide. PSSE was used to perform the steady state, short circuit and transient stability analysis as described in upcoming Section 6 on Study Methodology.
5.1.1. Republic of Ireland and Northern Ireland Transmission Networks
5.1.1.1. Power Flow Models Wind power generation is growing rapidly both in the Republic of Ireland (RoI) and Northern Ireland (NI). RoI’s target is to reach 40% of Ireland’s gross electricity from renewable resources by 2020. Conventional generation is also growing to meet the growing demand. For the purposes of this study it was decided to use the year 2020 base cases to ensure adequacy of the proposed transmission solutions at the high wind generation conditions. During the course of this study, the East-West HVdc Interconnector was at the tender evaluation stage. It was not known at that time whether the link would use LCC or VSC technology. To consider the more difficult scenario this link was modeled as a conventional LCC based HVdc link. The contract has since been awarded and the East-West HVdc interconnector will use VSC technology1. Table 5.1 shows the list of power flow cases that were studied for each scenario. Detailed generator dispatches for each power flow can be found in Appendices A-6, B-6, C-6 and D-2. Table 5.1. PSS/E Power flow cases: Year 2020 Case Description Scenario 1 1.1 • Summer Peak
• Max wind conditions • 500 MW export to Wales on East-West interconnect • 425 MW export to Scotland (75 MW of static reserve maintained) on Moyle
interconnect • Turlough Hill pumping at full capacity • Thermal generation dispatched according to merit order and security of supply/power
quality requirements Scenario 2/3 2.1 • Summer Minimum Case: NI load ~ 600 MW, RoI load ~ 2500 MW.
• 1360 MW transfer to Republic of Ireland from Northern Ireland. • 360 MW import into Moyle from Scotland. • 500 MW export from Woodland to Wales. • Ballylumford at 100 MW • Synchronous compensator at Coolkeeragh dispatched. • Turlough Hill pumping at full capacity. • 1700 MW of wind in the North • RoI dispatched as appropriate.
2.2 • Summer Peak Case: NI load ~ 1800 MW, RoI load ~ 5700 MW • 1500 MW transfer to Northern Ireland from Republic of Ireland • 500 MW export from Moyle to Scotland • 500 MW import into Woodland from Wales • Ballylumford at 100 MW
1 See Section 3 for further discussion.
PDF created with pdfFactory Pro trial version www.pdffactory.com
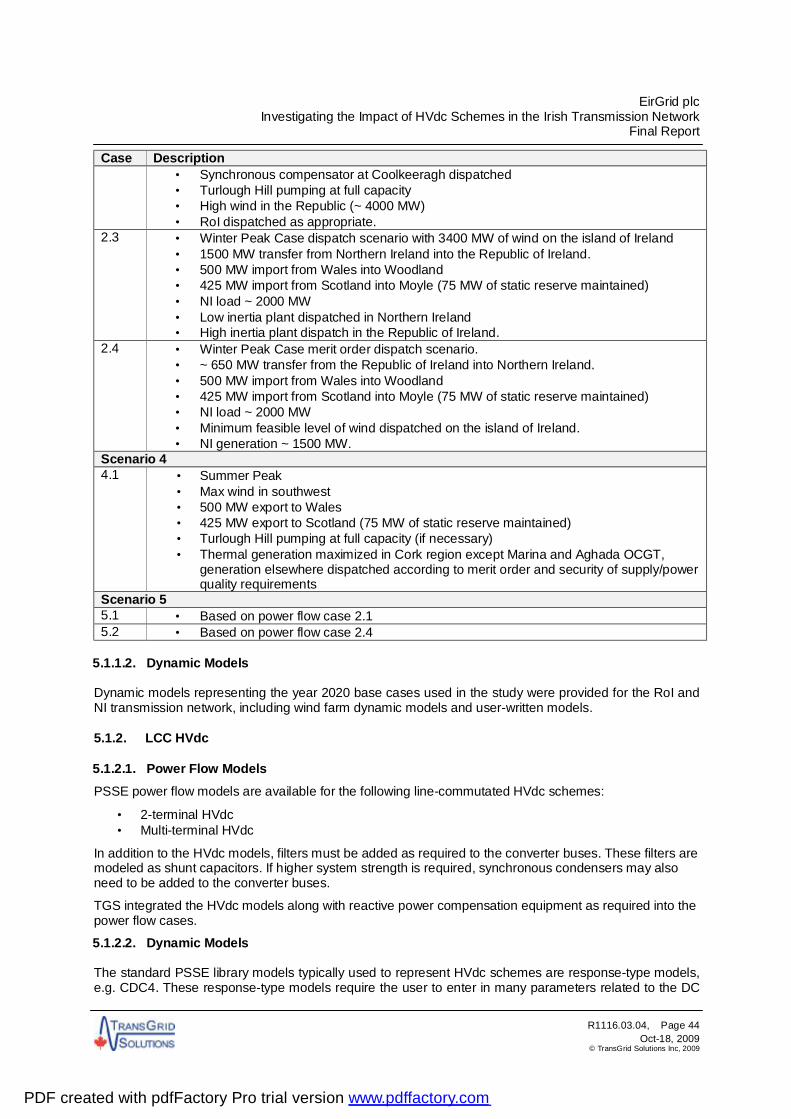
EirGrid plc Investigating the Impact of HVdc Schemes in the Irish Transmission Network
Final Report
R1116.03.04, Page 44 Oct-18, 2009
© TransGrid Solutions Inc, 2009
Case Description • Synchronous compensator at Coolkeeragh dispatched • Turlough Hill pumping at full capacity • High wind in the Republic (~ 4000 MW) • RoI dispatched as appropriate.
2.3 • Winter Peak Case dispatch scenario with 3400 MW of wind on the island of Ireland • 1500 MW transfer from Northern Ireland into the Republic of Ireland. • 500 MW import from Wales into Woodland • 425 MW import from Scotland into Moyle (75 MW of static reserve maintained) • NI load ~ 2000 MW • Low inertia plant dispatched in Northern Ireland • High inertia plant dispatch in the Republic of Ireland.
2.4 • Winter Peak Case merit order dispatch scenario. • ~ 650 MW transfer from the Republic of Ireland into Northern Ireland. • 500 MW import from Wales into Woodland • 425 MW import from Scotland into Moyle (75 MW of static reserve maintained) • NI load ~ 2000 MW • Minimum feasible level of wind dispatched on the island of Ireland. • NI generation ~ 1500 MW.
Scenario 4 4.1 • Summer Peak
• Max wind in southwest • 500 MW export to Wales • 425 MW export to Scotland (75 MW of static reserve maintained) • Turlough Hill pumping at full capacity (if necessary) • Thermal generation maximized in Cork region except Marina and Aghada OCGT,
generation elsewhere dispatched according to merit order and security of supply/power quality requirements
Scenario 5 5.1 • Based on power flow case 2.1 5.2 • Based on power flow case 2.4
5.1.1.2. Dynamic Models Dynamic models representing the year 2020 base cases used in the study were provided for the RoI and NI transmission network, including wind farm dynamic models and user-written models.
5.1.2. LCC HVdc
5.1.2.1. Power Flow Models PSSE power flow models are available for the following line-commutated HVdc schemes:
• 2-terminal HVdc • Multi-terminal HVdc
In addition to the HVdc models, filters must be added as required to the converter buses. These filters are modeled as shunt capacitors. If higher system strength is required, synchronous condensers may also need to be added to the converter buses.
TGS integrated the HVdc models along with reactive power compensation equipment as required into the power flow cases.
5.1.2.2. Dynamic Models The standard PSSE library models typically used to represent HVdc schemes are response-type models, e.g. CDC4. These response-type models require the user to enter in many parameters related to the DC
PDF created with pdfFactory Pro trial version www.pdffactory.com

EirGrid plc Investigating the Impact of HVdc Schemes in the Irish Transmission Network
Final Report
R1116.03.04, Page 45 Oct-18, 2009
© TransGrid Solutions Inc, 2009
voltage and current recovery following disturbances. Essentially these models are pre-programmed to operate/recover in a pre-set manner and do not provide any indication of the commutation performance of the HVdc or how the DC controls will actually respond to the AC disturbance. This is a drawback to this type of model – it gives no indication of real DC controller response. Instead of running the simulation to see how the HVdc will respond, the user specifies how it will respond. Of particular benefit to this project, TGS has developed a user written LCC HVdc model for PSS/E which allows the representation of the closed-loop HVdc controls as well as the HVdc line L/R dynamics. This custom developed model uses a two time-step approach in which the HVdc model is run at a smaller time-step than the rest of the PSS/E solution, thereby allowing the dynamics of the fast HVdc controls and of the HVdc line/cable to be modeled. This model has been shown to provide far superior results when compared to the standard library HVdc models available in PSS/E and other transient stability software packages. Two papers were written, one for IEEE and one for CIGRE. These papers describe this two time-step model developed at TGS and compare it to the standard library response-type models and validate the model against PSCAD [4,5]. This two time step model was developed in-house by TGS and has been commercially used on a number of recent HVdc installations. Since the representation of the HVdc link(s) is key to this project, TGS made use of this model for these studies. It has been developed for both two-terminal and three-terminal line commutated converter HVdc links. All LCC HVdc schemes being evaluated in this study are modeled using the two timestep model, including the East-West Interconnector and the LCC HVdc option for the Scenario 2 North-South Interconnector.
5.1.3. VSC HVdc [3]
PSSE power flow models are available to represent two-terminal VSC HVdc schemes, however there is no provision for multi-terminal VSC HVdc schemes. For dynamics, a standard PSSE library model (VSCDCT) is available to model a two-terminal VSC HVdc link, however after attempting to use the model it seemed to experience numerical stability issues under certain conditions. For both of these reasons, a vendor-supplied PSSE model was obtained for use in this project. This model is capable of representing multi-terminal VSC HVdc links as well as VSC HVdc links connecting wind farms to the main grid, both applications which will be studied throughout the various scenarios of this project. Please note this model is only available in monopolar configuration. This model has been validated by the vendor against a PSCAD model and was shown to provide excellent results [3]. The model is easy to use and is setup according to currently available VSC ratings. The VSC model is setup to use ratings from a selected set of ratings available for commercial use. Because the VSC models are provided for use with selected ratings, when setting up the VSC models for the various scenarios, the VSC model with the rating closest available to the desired rating was selected. Therefore the exact desired VSC rating was not necessarily modeled if it was not available in the set of vendor-supplied model ratings. 5.1.3.1. Power Flow Models In power flow, the VSC HVdc link is modeled in PSSE using an equivalent generator representing the P, Q injection at each terminal. The power injections take the VSC converter and DC line losses into account. Negative power at a generator indicates rectifier operation, positive power indicates inverter operation. These generators are connected to the grid through a converter transformer. AC filters are present on the VSC converter side of the converter transformer.
PDF created with pdfFactory Pro trial version www.pdffactory.com

EirGrid plc Investigating the Impact of HVdc Schemes in the Irish Transmission Network
Final Report
R1116.03.04, Page 46 Oct-18, 2009
© TransGrid Solutions Inc, 2009
Please note in the power flow model that the AC voltage of 416 kV as seen on the VSC converter side of the transformer is representing the AC voltage, and not the DC voltage. The DC voltage of +/-320 kV is not seen is the power flow model; it is only used as a parameter in the dynamic model which can be seen in the PSSE dynamic data file (DYR). Operating points are set to be within the P-Q capability curve shown in [3].
Please refer to the vendor-supplied PSSE model manuals [3] for further detailed information.
5.1.3.2. Dynamic Models The VSC dynamic model represents the converter control and includes the following:
• AC voltage control or reactive power control • Active power control or DC voltage control • Current output limitation • Internal converter voltage limitations
In dynamics, the VSC converters are setup to control ac voltage. One of the converters uses DC voltage control while the other(s) control the active power. The dynamics model also represents a cable model connecting all VSC terminals, which allows the following actions by the user:
• Power ramping via the power order • Converter blocking • Modulation by an external control
The model also includes representation of fixed and linear load losses.
Please refer to the vendor-supplied PSSE model manuals [3] for further detailed information.
5.2. PSCAD
A secondary study tool for this project is the PSCAD V4 electromagnetic transients’ software package. This software package is used for any of the studies that PSSE is not capable of performing because PSSE is a positive sequence solution, such as harmonics studies or frequency scans for example. In this study, PSCAD is used to perform the frequency scans.
PDF created with pdfFactory Pro trial version www.pdffactory.com

EirGrid plc Investigating the Impact of HVdc Schemes in the Irish Transmission Network
Final Report
R1116.03.04, Page 47 Oct-18, 2009
© TransGrid Solutions Inc, 2009
6. Study Criteria
6.1. General System Performance Criteria
6.1.1. Steady State
Steady State Voltages: Nominal Voltage Base Case limits
(meshed network) Post Contingency Limits (all buses)
400 kV 370 – 410 kV 350 – 410 kV 275 kV 261 – 289 kV 248 – 289 kV 220 kV 210 – 240 kV 200 – 240 kV 110 kV (EirGrid) 105 – 120 kV 99 – 120 kV 110 kV (NIE)2 *- 113 kV 99 – 113 kV
*no value specified in planning standards Maximum Voltage Step: Base Case (system intact)
Post Contingency (n-1)
< 3.0% < 10.0% Thermal Limits: Equipment Emergency Rating Minutes Overhead line 110% Normal Rating 30 Cable and Transformer within half hour limit
within two hour limit 30 120
Short Circuit Levels: Voltage Level Short Circuit Level 400 kV 45 kA 220 kV 36 kA 110 kV in Dublin and Northern Ireland 23.4 kA 110 kV outside Dublin2 22.5 kA 110 kV at designated locations2 28.3 kA
6.1.2. Dynamic
Dynamic Testing: The strength of the system shall be such as to maintain stability following a three-phase zero impedance line-end fault. It shall be assumed that the fault is correctly cleared by primary protection and that line reclosing is in operation where appropriate. This test may be relaxed and instead apply a single phase fault test where the situation is a stage of ongoing development and has a short duration. Pole slipping, even for a short time, is unacceptable. Voltage Collapse: A safe margin should be provided between the transmission loading in an area and the voltage collapse point determined by parametric studies as the transmission loading is increased.
2 Please note that these specific criteria were provided after completion of the study. All 110 kV criteria used to assess study results was based on the EirGrid steady state voltage limits and on the 23.4 kA short circuit limit.
PDF created with pdfFactory Pro trial version www.pdffactory.com

EirGrid plc Investigating the Impact of HVdc Schemes in the Irish Transmission Network
Final Report
R1116.03.04, Page 48 Oct-18, 2009
© TransGrid Solutions Inc, 2009
Frequency Variations: Underfrequency Overfrequency Duration Grid Code Reference 49.8-50.0 Hz 50.0-50.2 Hz Normal OC4.3.4.5 and
OC4.3.4.6 > 49.5 Hz < 50.5 Hz Continuous CC.7.3.1.1 (a) > 47.5 Hz < 52 Hz Exceptional Transmission
System Disturbances (60 minutes)
CC.7.3.1.1 (b) CC.8.2.1
• Max rate of change of frequency: 0.5Hz/sec
• 75 MW of static reserve from Moyle interconnector at 49.6 Hz (not modeled in PSSE)
• 45 MW of industrial load shed at 49.3 Hz (not modeled in PSSE)
Power oscillation damping:
Power oscillations should be sufficiently damped.
Maximum short-term AC overvoltage3:
Voltage Cycles 1.3 pu 200 ms 1.15-1.3 pu 2 sec
Minimum short-term AC undervoltage following a disturbance2: Voltage Cycles 0.7 pu 500 ms 0.7-0.9 pu 2 seconds
6.2. Criteria for Comparison of AC and HVdc Options
A qualitative comparison between the various HVdc options and their corresponding equivalent AC solutions is performed. Table 6.1 below lists various assessment descriptions that will be used to perform the qualitative comparison. This table is intended to be a generic overview of various typical projects and is not necessarily connected to this particular study.
3 Based on a combination of criteria typically used in North America, specifically based on data used form Manitoba Hydro in the MAPP Members Reliability Criteria and Study Procedures Manual, Version 1.3, February 2009.
PDF created with pdfFactory Pro trial version www.pdffactory.com

EirGrid plc Investigating the Impact of HVdc Schemes in the Irish Transmission Network
Final Report
R1116.03.04, Page 49 Oct-18, 2009
© TransGrid Solutions Inc, 2009
Table 6.1. Qualitative Comparison between HVdc options and Equivalent AC solutions. Type Assessment HVdc AC
Enhanced system stability margins + + or 0 Better transmission corridors utilization (with no congestion) + - Improved voltage performance (more stable) + + or 0 Provide means for optimal generation expansion + +
Technical Improvements to Grid
Flexibility of power interchanges (seasonal, peak and off-peak periods)
+ + or 0
Overall improvement on system performance + + or 0 Whether the system meets a N-1 security standard criteria in accordance to the planning/operational standards of the Republic of Ireland and Northern Ireland.
+ +
The complexity of operating the transmission system considering issues such as continuous scheduling of flows and developing responses to potential system disturbances.
- + or 0
System Security
Whether the system after N-1 can re-dispatch and control critical flow paths to avoid cascading failures
+ -
Expected overall availability of AC and DC solutions. 0 + Cables versus overhead lines: frequency and duration of maintenance and forced outages.
NOT PART OF PRESENT STUDY
Asset’s Lifespan & Availability
Typical lifespan of assets. Issue of continued availability of spare parts for the lifespan of the asset, i.e. in the longer term
0 +
Economic The net present value of the cost of the alternatives including all estimated capital costs
NOT PART OF PRESENT STUDY
Environmental The environmental and social impact of the proposed alternatives→ this is not part of present study
NOT PART OF PRESENT STUDY
Timing/Schedule The ability of the proposed development to be technically delivered in a short time.
- +
The ability of the proposed alternative to be staged up or upgraded, as the system requirements increase, either by adding new circuits (AC) or by reinforcing the equipment ratings (DC since in this case tapping is not usual – the ability to upgrade power is through series or parallel converter additions, not through tapping).
+ + Expandability
Tap or Loop-into an existing circuit - + Power Flow Control under steady state and emergencies
The ability of controlling an exact power level, even in a meshed network configuration, to avoid congestion, or system instability due to large angle displacements.
+ -
PDF created with pdfFactory Pro trial version www.pdffactory.com

EirGrid plc Investigating the Impact of HVdc Schemes in the Irish Transmission Network
Final Report
R1116.03.04, Page 50 Oct-18, 2009
© TransGrid Solutions Inc, 2009
7. Study Methodology The study methodology as described in this section will be applied to each of the scenarios being studied. The following types of studies will be performed for the various scenarios and HVdc schemes:
PSSE STEADY STATE Contingency analysis.
PSSE SHORT CIRCUIT Standard PSS/E calculation of fault levels at each node on the system for AC/HVdc scheme comparison purposes.
PSSE DYNAMIC Standard PSS/E transient stability analysis of normal clearing three-phase and slow clearing single-phase faults as well as HVdc contingencies such as pole blocking. Note that three-phase faults are more severe than single-phase faults. For this reason it is suggested to use the back-up or breaker failure protection clearing time for single-line faults. PSCAD studies are not required for simulation of single-phase faults as resultant harmonic distortions in unbalanced situation would be mitigated at the detailed design stage of an HVdc scheme (these phenomena would not be captured in a PSS/E study).
PSCAD FREQUENCY SCAN High level study. Impedance traces to be calculated as a function of frequency in order to flag potential harmonic issues.
HAND CALCULATION – SUBSYNCHRONOUS RESONANCE (SSR) SSR prediction to be carried out using Kundur`s Unit Interaction Factor (UIF) method [2].
7.1. Procedure: PSSE Analysis
The following steps are taken to perform the steady state analysis:
7.1.1. Power Flow Setup
• Integrate the HVdc model(s) into the power flow cases.
• Calculate typical HVdc parameters/data based on required rating.
• Populate the HVdc two-terminal and/or multi-terminal LCC DC line models and the two-terminal and/or multi-terminal VSC DC line models.
• Add filters (shunt capacitors) to the LCC converter buses to compensate for HVdc reactive power consumption.
• For LCC, calculate the Effective Short Circuit Ratio (ESCR) at the converter buses. If less than 2.5, synchronous condenser(s) may be required to increase the ESCR, however the need for synchronous condensers will be verified during the transient stability analysis. ESCR is typically used as a guideline.
7.1.2. Steady State Contingency Analysis
Use the PSSE activity ACCC to perform the steady state contingency analysis.
• Setup contingency (*.con), monitoring (*.mon) and subsystem (*.sub) files.
• Run the ACCC contingency analysis for all contingencies as identified in Sections 8.2, 9.2, 10.2 and 11.2 for each of the four scenarios respectively.
• Analyze the output – record all thermal overloads and steady state voltage violations.
PDF created with pdfFactory Pro trial version www.pdffactory.com

EirGrid plc Investigating the Impact of HVdc Schemes in the Irish Transmission Network
Final Report
R1116.03.04, Page 51 Oct-18, 2009
© TransGrid Solutions Inc, 2009
• Examine and discuss mitigation measures for the steady state overload and voltage violations. Compare these mitigation measures to those required for the equivalent AC solution.
7.1.3. Short Circuit Analysis
Use the PSSE activity ASCC to perform the short circuit analysis.
• Read in the provided sequence data into the power flow cases.
• Run fault analysis (PSSE activity ASCC) to determine single-line-to-ground and three-phase faults at all 110 kV buses and higher.
• Analyze the output – record all single-line-to-ground and three-phase short circuit levels, compare with fault level criteria to flag any stations whose ratings may be exceeded and to determine the impact of the HVdc options on the AC option.
PSSE activity ASCC is meant to perform a scanning short circuit analysis of a large number of buses for single line to ground and three phase faults, rather than detailed and specific fault cases [6]. It calculates the RMS symmetrical fault currents at each bus and uses the sequence data in the model to perform the network fault calculations. Please note that PSSE activity ASCC is not a detailed fault analysis tool, and does not calculate other fault currents such as the peak short circuit current, DC component of asymmetrical breaking current or the RMS asymmetrical short circuit current, all of which are defined in IEC 60909. These fault currents can be calculated if a detailed breaker replacement study would be required, however this is not performed in this study.
Fault analysis using activity ASCC can be performed using classical flat conditions [7], in which:
• Voltages are set to 1.0 pu at zero phase angle.
• Constant power, current and admittance loads are set to zero.
• Generator outputs are set to zero.
• FACTS devices and DC lines are removed.
• Transformer phase shift angles are set to zero, impedances are set to nominal.
• Optionally, all transformer turns ratios are set to unity.
• Optionally, line charging is set to zero.
• Optionally, fixed and switched bus shunts are set to zero.
Classical flat conditions simplify details of the fault calculation (as listed above) in order to derive a more generic result that is not dependent on the system voltage or load profile. However since in this study various power flow cases are available, all of which contain sequence data, classical flat conditions are not invoked in the fault analysis; rather a detailed case-dependent fault calculation is performed for each power flow by using the specific system conditions set up in each case.
The way the generators are modeled for fault analysis, i.e. using the subtransient reactance Xd’’ or the transient reactance Xd’, will affect the results. It depends on the requirements of the fault analysis. The subtransient reactance represents the moment in time immediately after the fault, whereas the transient reactance represents the moment in time approximately 3 to 5 cycles later [8]. Representing the generators with the subtransient reactance will result in higher short circuit currents than using the transient reactance. Therefore the results of the fault analysis should be considered only as accurate as the data modeling the system, or specifically for the time frame used to represent the fault contributions from generators at a specific moment in time.
More detailed analysis than what is being performed in this study would be required to determine if any specific breakers would require replacement or if the system protections would require any modification.
The sequence data provided by EirGrid/NIE/SONI for the studies modeled the subtransient reactance Xd’’ for the generators in Northern Ireland and the saturated transient reactance Xd’ for the generators in the
PDF created with pdfFactory Pro trial version www.pdffactory.com

EirGrid plc Investigating the Impact of HVdc Schemes in the Irish Transmission Network
Final Report
R1116.03.04, Page 52 Oct-18, 2009
© TransGrid Solutions Inc, 2009
Republic of Ireland. Please refer to IEC 60909 for further details and explanation of generator modeling and fault currents.
7.1.4. Procedure: PSSE Transient Stability Analysis
The following steps are taken to complete the transient stability analysis:
Use the PSSE dynamics program to perform the transient stability analysis.
• Create the required HVdc dynamics model(s), utilizing the two timestep model if possible.
• Read in the dynamics data related to the HVdc schemes being studied.
• Run the system disturbances for the particular scenarios as identified in Sections 8.2, 9.2, 10.2 and 11.2 for each of the four scenarios respectively.
• Analyze the results – record system performance for each disturbance based on criteria defined in Section 6.
• If system performance criteria is not met, determine mitigation measures required to fix the issues such that the system responses to all disturbances is acceptable. Mitigation measures could include things such as adding dynamic voltage support such as an SVC, adding inertia such as a synchronous condenser, modifying/optimizing HVdc control settings, adding an HVdc modulation control to damp a power system oscillation or to control frequency, implementing a special protection system, etc.
7.2. Procedure: PSCAD Analysis
PSCAD is used to perform analysis that cannot be performed in PSSE, including:
System Frequency Scans:
Create a PSCAD model of the HVdc link and surrounding AC system for the particular scenario:
• Perform a high level study: Impedance traces as a function of frequency to be calculated in order to flag potential harmonics issues.
• The HVdc link and associated filters are assumed to be out of service for this study. The HVdc link acts as a harmonic source. To evaluate the effect of these harmonics when injected into the AC system, the system impedance (as a function of frequency) as seen from HVdc terminals needs to be calculated. For this reason the HVdc link was kept out of service in this calculation. The impedance scans are performed using the PSCAD Harmonic Impedance component. The interface to the harmonic impedance solution generates the system impedance matrix for any electric network in the phase domain. This matrix is then collapsed into an equivalent matrix as seen from the interface point. This is repeated for each frequency as specified. In cases where transmission line and cable models are present, the harmonic impedance solution uses RLC data directly, avoiding integration and/or curve fitting errors. The equations are solved at each specified frequency in the phase domain without using sequence networks, thus giving accurate representations for unbalanced transmission lines, Wye-Delta transformers, etc.
7.3. Procedure: SSR Hand Calculation
Unit Interaction Factor is defined as (Power System Stability and Control by Prabha Kundur [2], page 1049):
PDF created with pdfFactory Pro trial version www.pdffactory.com

EirGrid plc Investigating the Impact of HVdc Schemes in the Irish Transmission Network
Final Report
R1116.03.04, Page 53 Oct-18, 2009
© TransGrid Solutions Inc, 2009
2
1
−=
t
g
g
dc
SCSC
MVAMVA
UIF
Where:
=dcMVA MVA rating of the dc system
=gMVA MVA rating of the generator
=gt SCSC , short-circuit capacity at the dc commutating bus (excluding ac filters) with and without the generator, respectively. This is a Sub Synchronous Resonance screening index. The index is the product of two indicators of SSR; namely (a) the relative rating of the generator and (b) the electrical distance between the LCC HVdc converter terminal and the generating unit. The term within parentheses calculated in terms of system short circuit level is a measure of the electrical distance. The AC filters are removed from the network for the above calculations. It is recommended that further detailed studies be performed if the UIF is greater than 0.1. The index UIF is only an empirical formula for screening of SSR risk. PSSE is used to calculate the UIF at each HVdc terminal for each thermal generator in the vicinity.
7.4. Procedure: Comparison of HVdc Schemes and AC Alternatives
Based on the results of the technical studies, compare the corresponding HVdc scheme(s) and equivalent AC solution according to the comparison criteria as defined in Section 6.
PDF created with pdfFactory Pro trial version www.pdffactory.com

EirGrid plc Investigating the Impact of HVdc Schemes in the Irish Transmission Network
Final Report
R1116.03.04, Page 54 Oct-18, 2009
© TransGrid Solutions Inc, 2009
8. Scenario One: Wind in North-West Mayo Region Scenario 1 addresses the connection of 460 MW of new wind generation in the north-west Mayo region near Bellacorick. The new wind generation is connected to the system at Bellacorick via transmission to Flagford. The dashed line in Figure 8.1 shows the approximate route for this scenario.
Figure 8.1. Assumed route for Scenario 1. (Please note that this route assumption was used only to obtain an approximate transmission line length for the study and is subject to change in future stages of the project.) The following points describe the scenario in further detail:
• The 460 MW of wind generation is connected in the north-west Mayo region (around Bellacorick 110 kV station) as per Gate 2 and Gate 3 connection offer processes.
• The scenario is studied using a year 2020 summer peak base case.
• The length of the new circuit is approximately 123 km = (direct distance from Bellacorick to Castlebar + direct distance from Castlebar to Flagford) * margin of uncertainty (1.25)
• The wind farms are lumped according to turbine type with the provision that Oweninney 5, the
single largest wind farm, is modeled separately. EirGrid supplied all relevant models for the wind farms. Lumped wind farms are modeled at a number of 110 kV nodes connected to a 110 kV collection point via various lengths of underground cable.
• All non-Bellacorick region wind generation is modeled generically with the dynamic data provided.
• Bellacorick 110 kV bus 1411 refers to a new 110 kV station for the connection of the wind cluster
in Bellacorick. This new station is separated from the existing Bellacorick 110 kV transmission station at bus 1401.
8.1. Transmission Options
Two transmission alternatives are considered for this scenario; one AC option and one HVdc option.
PDF created with pdfFactory Pro trial version www.pdffactory.com
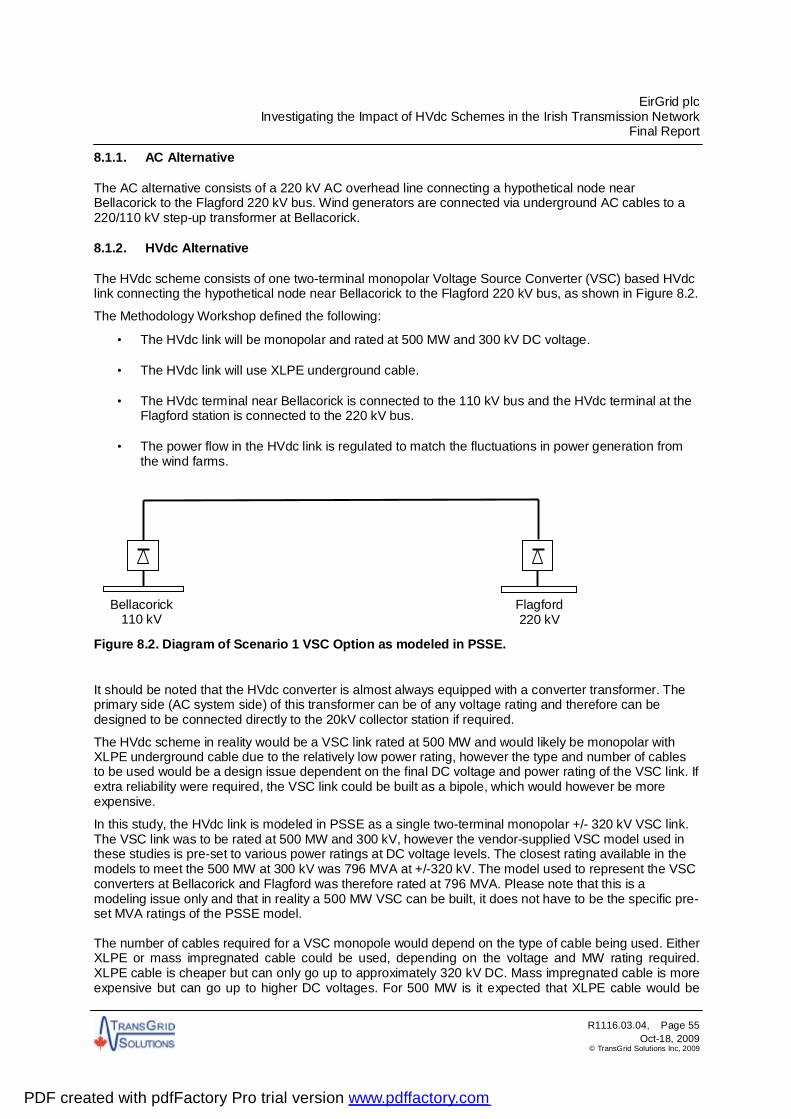
EirGrid plc Investigating the Impact of HVdc Schemes in the Irish Transmission Network
Final Report
R1116.03.04, Page 55 Oct-18, 2009
© TransGrid Solutions Inc, 2009
8.1.1. AC Alternative
The AC alternative consists of a 220 kV AC overhead line connecting a hypothetical node near Bellacorick to the Flagford 220 kV bus. Wind generators are connected via underground AC cables to a 220/110 kV step-up transformer at Bellacorick.
8.1.2. HVdc Alternative
The HVdc scheme consists of one two-terminal monopolar Voltage Source Converter (VSC) based HVdc link connecting the hypothetical node near Bellacorick to the Flagford 220 kV bus, as shown in Figure 8.2.
The Methodology Workshop defined the following:
• The HVdc link will be monopolar and rated at 500 MW and 300 kV DC voltage.
• The HVdc link will use XLPE underground cable.
• The HVdc terminal near Bellacorick is connected to the 110 kV bus and the HVdc terminal at the Flagford station is connected to the 220 kV bus.
• The power flow in the HVdc link is regulated to match the fluctuations in power generation from
the wind farms.
Figure 8.2. Diagram of Scenario 1 VSC Option as modeled in PSSE.
It should be noted that the HVdc converter is almost always equipped with a converter transformer. The primary side (AC system side) of this transformer can be of any voltage rating and therefore can be designed to be connected directly to the 20kV collector station if required.
The HVdc scheme in reality would be a VSC link rated at 500 MW and would likely be monopolar with XLPE underground cable due to the relatively low power rating, however the type and number of cables to be used would be a design issue dependent on the final DC voltage and power rating of the VSC link. If extra reliability were required, the VSC link could be built as a bipole, which would however be more expensive.
In this study, the HVdc link is modeled in PSSE as a single two-terminal monopolar +/- 320 kV VSC link. The VSC link was to be rated at 500 MW and 300 kV, however the vendor-supplied VSC model used in these studies is pre-set to various power ratings at DC voltage levels. The closest rating available in the models to meet the 500 MW at 300 kV was 796 MVA at +/-320 kV. The model used to represent the VSC converters at Bellacorick and Flagford was therefore rated at 796 MVA. Please note that this is a modeling issue only and that in reality a 500 MW VSC can be built, it does not have to be the specific pre-set MVA ratings of the PSSE model.
The number of cables required for a VSC monopole would depend on the type of cable being used. Either XLPE or mass impregnated cable could be used, depending on the voltage and MW rating required. XLPE cable is cheaper but can only go up to approximately 320 kV DC. Mass impregnated cable is more expensive but can go up to higher DC voltages. For 500 MW is it expected that XLPE cable would be
Bellacorick 110 kV
Flagford 220 kV
PDF created with pdfFactory Pro trial version www.pdffactory.com

EirGrid plc Investigating the Impact of HVdc Schemes in the Irish Transmission Network
Final Report
R1116.03.04, Page 56 Oct-18, 2009
© TransGrid Solutions Inc, 2009
used, however it becomes an economic study to determine how many XLPE cables would be required compared to mass impregnated cables, and which option would be less expensive. At a minimum each monopole would require two cables. The PSSE loadflow and dynamics models connect the single VSC pole to the AC system via a single transformer, with AC filters on the VSC side of the transformer. The VSC converter is represented by a generator model in loadflow and by a current injection and controls model in dynamics. The valves themselves are not included in a PSSE type model as such a simulation tool is not capable of modeling the actual three-phase switching. Two DC cables are represented in the vendor-supplied monopolar model, however this does not necessarily reflect reality as discussed in the previous paragraph. More information on the specific vendor-supplied PSSE models can be found in [3]. No conventional Line Commutated Converter (LCC) based HVdc alternative is considered for this scenario as the VSC based alternative has clear advantages over LCC in this application. These advantages include the lower cost of cable and the possibility of connecting VSC to a weak network without the need for extra equipment. VSC HVdc technology is currently being used for connecting isolated wind farms to the grid particularly if the wind farm is offshore. For onshore applications if the transmission distance is long (over 50-100km) then the overhead lines are preferred. Long AC cables are not practical due to the large amount of line charging associated with a long AC cable. Of course it is possible to use multiple sections of AC cable with shunt reactive compensation in between, but in most cases this option is not economically viable. The VSC solution can be used with both overhead line and underground cable. VSC technology can be applied to very weak systems and is capable of following the power output of an isolated wind farm so as to control the frequency. For more information regarding wind farms connected to VSC HVdc, please refer to [9].
8.1.3. Reactive Power Exchange with AC System
Voltage source converters have a large range of dynamic reactive supply and absorption capability, however the reactive power capability depends on the real power transmission. The vendor-supplied model used in this study has a typical per unit P-Q operating diagram shown in Figure 8.2 (figure taken from [3]). This diagram demonstrates that when operating at a real power level near the MVA rating of the VSC, the reactive power capability is significantly less than if operating at a lower power level, in fact the reactive power capability shown in Figure 8.2 is near 0 MVAR at 1 pu real power. The reactive power can be controlled independently at each station. Please note that this P-Q diagram is typical and vendor-specific and does not necessarily reflect the P-Q operating curve of VSCs supplied by other vendors. Also note that the P-Q diagram refers to the converter only. There are filters located on the AC bus on the VSC side of the transformer which are not accounted for in the P-Q diagram. The rating of the filters depends on the rating of the converter, switching technology (Pulse Width Modulation or not), phase reactor etc. The 796 MVA VSC link as modeled in this scenario has 119.4 MVAR of filters (capacitance).
PDF created with pdfFactory Pro trial version www.pdffactory.com

EirGrid plc Investigating the Impact of HVdc Schemes in the Irish Transmission Network
Final Report
R1116.03.04, Page 57 Oct-18, 2009
© TransGrid Solutions Inc, 2009
Figure 8.2. VSC P-Q diagram (converter only). Source: ABB. An AC line loaded to its surge impedance loading will neither consume nor supply reactive power to the AC system. Operating below surge impedance loading, an AC line will supply reactive power; operating above surge impedance loading an AC line will absorb reactive power. Figure 8.3 below shows the P-Q diagram for the AC option. The surge impedance loading of the AC line is around 120 MW.
Figure 8.3. AC Line P-Q diagram.
PDF created with pdfFactory Pro trial version www.pdffactory.com

EirGrid plc Investigating the Impact of HVdc Schemes in the Irish Transmission Network
Final Report
R1116.03.04, Page 58 Oct-18, 2009
© TransGrid Solutions Inc, 2009
8.2. Contingencies
8.2.1. Steady State Analysis
All n-1 contingencies for 110 kV and above and some key double circuit outage conditions were studied.
8.2.2. Transient Stability Analysis
Table 8.1 describes the system disturbances that are applied to perform the transient stability analysis.
Table 8.1. Scenario 1 Contingencies. Fault Location Conting
ency Bus No. & Name
kV 3ph/1ph
Fault Duration
(sec) Branch Tripped
Reclosing Type and Time (s)
Comments
1_0_S 372 Bellacorick 416 3ph 0.08
1_0_R 382 Flagford 416 3ph 0.08
VSC link Bellacorick - Flagford No reclose Block of HVDC pole
2_1_S 1411 Bellacorick 110 1ph 0.30
AC Option 1402-1411-14021 – Bellacorick 220-110kV transformer 402-1411-14022 VSC Option 1411- 370 ckt 1 VSC transformer at Bellacorick
No reclose
2_3_S 1411 Bellacorick 110 3ph 0.08
[AC Option 1402-1411-14021 – Bellacorick 220-110kV transformer 402-1411-14022 VSC Option 1411- 370 ckt 1 VSC transformer at Bellacorick
No reclose
2_1_R1 2522 Flagford 220 1ph 0.30
2522-2524-25223, Flagford 220-380kV transformer 2522-2521-25222, Flagford 220-110kV transformer 2522-3772 Flagford-Cavan 220kV
No reclose
2_1_R2 2522 Flagford 220 1ph 0.30
2522-2521-25221 Flagford 220-110kV transformer 2522-1642 Flagford-Cashla 220kV 2522-5042 Flagford-Srananagh 220kV
No reclose
2_3_R1 2522 Flagford 220 3ph 0.08 2522-2524-25223
Flagford 220-380kV transformer No reclose
3-phase and 1-phase faults at each of two terminals
3_1_R1 2522 Flagford 220 1ph 0.30 2522-5042 Flagford-Srananagh 220kV
2522-1642 Flagford-Cashla 220kV No reclose
3_1_R2 2522 Flagford 220 1ph 0.30 2522-1642 Flagford-Cashla 220kV
2522-3772 Flagford-Cavan 220kV No reclose
3_1_R3 2522 Flagford 220 1ph 0.30 2522-5042 Flagford-Srananagh 220kV
2522-3772 Flagford-Cavan 220kV No reclose
3_3_R1 2522 Flagford 220 3ph 0.08 2522-5042 Flagford-Srananagh 220kV 3ph ,0.68
3_3_R2 2522 Flagford 220 3ph 0.08 2522-1642 Flagford-Cashla 220kV 3ph ,0.68
3_3_R3 2522 Flagford 220 3ph 0.08 2522-3772 Flagford-Cavan 220kV 3ph ,0.68
3-phase and 1-phase faults on each of HV lines leaving Flagford 220 kV station
4_3_X 274 Oweninney 20 3ph 0.15 274-280 Oweninney 198 MW wind No reclose
Loss of largest wind farm at sending end
5_3_X 5172 Tynagh 220 3ph 0.08
Tynagh transformer & generation 5172-51771-51772 And generator at 51771 CT And ST at 51772 and HL at 51771
No reclose Loss of Tynagh CCGT (Combine cycle gas turbine)
6_3_X Capture fluctuation of wind at sending end across full range of output. Worst case ramp rate to be used: Pmax/30 seconds.
PDF created with pdfFactory Pro trial version www.pdffactory.com

EirGrid plc Investigating the Impact of HVdc Schemes in the Irish Transmission Network
Final Report
R1116.03.04, Page 59 Oct-18, 2009
© TransGrid Solutions Inc, 2009
8.3. Power Flows Cases and Losses
The power flow case for the VSC option was created by using the case described in Section 8.1.1. The hypothetical 220 kV AC circuit between Bellacorick and Flagford was removed and replaced with the VSC HVdc link. Losses resulting directly from the current flowing in the 220 kV AC line were calculated and compared with the losses in the VSC HVdc system. According to the VSC manuals [3], each VSC converter has losses of 1.65% at nominal (rated) MVA loading, with 30% fixed losses and 70% variable plus the losses in the DC line. Table 8.3 summarizes the losses in the 220 kV AC line and in the VSC HVdc system. Care should be taken in interpreting these results however, as load profiles and economics have not been considered in this study and would require further investigation. The results in Table 8.3 are for one specific operating point only, namely the power flow case used for studying Scenario 1 in which approximately 460 MW of wind generation is being produced in the Bellacorick region and being transferred to the grid via the AC and VSC transmission options considered for Scenario 1. Table 8.3. Comparison of Losses for the AC and VSC Options.
Single AC Line (MW) VSC (MW)
23.4 20.5 The losses are quite similar when comparing the 220 kV AC line to the VSC option, although the VSC option has slightly lower losses by approximately 2-3 MW.
8.4. Steady State Contingency Analysis
Steady state contingency analysis was performed on the one power flow case described in Table 5.1.
8.4.1. Overload Impacts
There were several overloads observed in the steady state contingency analysis, however there were no significant differences in the thermal overloads when comparing the results of the AC and VSC options. This makes intuitive sense because from an AC system point of view, it is simply a power injection of approximately 460 MW (minus losses) at the Flagford 220 kV bus, whether it is connected via AC or VSC transmission. The complete results of the thermal overloads can be found in Appendix A-2.
8.4.2. Voltage Violation Impacts
There were a few minor voltage range and deviation violations observed in the steady state contingency analysis, however there were no significant differences seen in these violations when comparing the results of the AC and VSC options. The complete results of the voltage violations can be found in Appendix A-3.
8.5. Short Circuit Analysis
Short circuit analysis was performed to compare the difference in short circuit levels between the AC option and the VSC option.
PDF created with pdfFactory Pro trial version www.pdffactory.com

EirGrid plc Investigating the Impact of HVdc Schemes in the Irish Transmission Network
Final Report
R1116.03.04, Page 60 Oct-18, 2009
© TransGrid Solutions Inc, 2009
In comparison to the AC option, the VSC option reduces short circuit levels particularly in the area near the VSC link. This is because the VSC link only contributes minimal short circuit current, up to 1.0 pu rated current depending on the AC bus voltage, with this short circuit contribution decreasing as the AC bus voltage decreases. According to the VSC model manuals [3], it is recommended to turn off the VSCs in the power flow prior to performing the short circuit analysis. However, as mentioned, the VSC option can contribute up to 1.0 pu rated current, with this current contribution decreasing as bus voltages decrease. An alternative method suggested in the VSC manual is to assume a 0.5 pu current contribution at nearby buses [3]. Therefore, the VSC fault contribution of 0.5 pu current (2.09 kA at Bellacorick and 1.04 kA at Flagford) was assumed. Table 8.4 compares the short circuit levels of the AC option to the VSC option at the two terminals of the new transmission at Bellacorick 110 kV and at Flagford 220 kV buses. The VSC option assumes 0.5 pu rated current contribution. The VSC option results in lower short circuit levels than the AC option. Table 8.4. Short Circuit Levels at the Scenario 1 Transmission Terminals.
Short Circuit Level (MVA) Short Circuit Level (kA) Terminal
AC VSC AC VSC
Bellacorick 110 kV 1609 1264 8.5 6.6
Flagford 220 kV 4390 4284 11.5 11.3
Appendix A-4 contains the full listing of the short circuit analysis results. All short circuit levels exceeding the fault level criteria were flagged in red in Appendix A-4 for the AC option and the VSC option. Levels were exceeded at a few 220 kV stations, but mostly at 110 kV stations. In all cases the VSC option either had no impact on the short circuit level violations present in the AC option, or the VSC option slightly reduced the violations. It is recommended to perform detailed breaker replacement studies at these stations.
Generally speaking the benefit of a decrease in short circuit levels is to possibly reduce the number of breakers whose current interrupting ratings are exceeded. The drawback is a decrease in system strength.
8.6. Transient Stability Analysis
The results of the transient stability simulations were analyzed and the AC option was compared to the VSC option in terms of the following criteria:
• Post-contingency overvoltages • Transient overvoltages/undervoltages • Frequency deviations and rate of change of frequency • System damping • Generator tripping
The ramping of power from the wind farms near Bellacorick is a special case which is discussed separately for the VSC option to demonstrate the capability of the VSC to follow the varying power output of the wind farms.
In addition to the analysis of the AC system faults and criteria, specific faults associated only with the VSC HVdc system, namely pole blocking and dc line faults, were also analysed to ensure acceptable system performance.
Appendix A-1 contains the plots of transient stability analysis.
8.6.1. Faults on the New Bellacorick-Flagford Connection
Before discussing the transient stability comparisons between the AC and VSC options, it is worth discussing a normal-clearing fault on the new hypothetical connection between Bellacorick and Flagford. As described in Table 8.1 contingency 2_3_S, a fault on the new connection at the Bellacorick is listed as
PDF created with pdfFactory Pro trial version www.pdffactory.com

EirGrid plc Investigating the Impact of HVdc Schemes in the Irish Transmission Network
Final Report
R1116.03.04, Page 61 Oct-18, 2009
© TransGrid Solutions Inc, 2009
“no reclose”. Normally on a 220 kV AC line, a normal-clearing fault would result in line reclosing 600 ms after clearing the fault. Reclosing was not used here because:
• The PSSE dynamics program crashes if the Bellacorick wind generators become isolated from the rest of the system once the single connection to the rest of the AC system is tripped. In order for PSSE not to crash, these isolated Bellacorick wind generators have to be tripped when the Bellacorick line or transformer is tripped to clear the fault.
• In reality, it is not certain (in fact, not expected) that the wind generators could actually run
isolated from the grid for almost 700 ms and then be reclosed. Without frequency or voltage control of the isolated wind farm, and nowhere for the wind power to go, it is expected the wind farm would trip by voltage or frequency protection anyways. This would be a question to verify with the specific wind generator manufacturers.
If reclosing is a requirement for this equipment in order to not lose the potential 460 MW for longer than 680 ms, then it is likely the case that two independent connections to the grid, i.e. two transformers and two AC lines, or a VSC bipole would be required. Otherwise it is not expected that reclosing can be performed after such a fault with only a single connection to the grid. This should however be verified with the wind generator manufacturers. In terms of comparison of a single AC or HVdc connection to the grid, loss of either type of connection would result in wind farm isolation. Therefore, in upcoming Section 8.6.3.2, these contingencies were discussed as loss of generation cases because reclosing was not simulated and therefore loss of the grid connection was assumed to result in a permanent loss of the isolated wind generation as well.
8.6.2. Post-Contingency Overvoltages
The post-contingency voltage at the 220 kV Srananagh bus (bus 5042) settled to a value greater than 1.2 pu for all of the AC and VSC options when the Flagford - Srananagh line was tripped. This violates the system overvoltage criteria as well as triggers the overvoltage protection relays of nearby wind generators. The overvoltage was worst at Srananagh 220 kV bus due to a 120 MVAR switched capacitor located at this bus. In order to mitigate this overvoltage, the switched capacitor was replaced with an SVC to provide dynamic reactive power support. Figure 8.7 shows the voltage profile at the Srananagh 220 kV bus with the switched capacitor, and Figure 8.8 shows the voltage profile at the same bus after the switched capacitor was replaced with an SVC rated at 120 MVAR. With the SVC, the post-contingency voltage at the Srananagh 220 kV bus settles to its voltage set point of 1.075 pu after an initial voltage spike. Consequently, this 120 MVAR switched capacitor was replaced with a 120 MVAR SVC for all of the dynamic simulations of the AC and VSC options.
PDF created with pdfFactory Pro trial version www.pdffactory.com

EirGrid plc Investigating the Impact of HVdc Schemes in the Irish Transmission Network
Final Report
R1116.03.04, Page 62 Oct-18, 2009
© TransGrid Solutions Inc, 2009
Bus Voltage
time (s) 0.0 1.0 2.0 3.0 4.0 5.0 ... ... ...
0.70
0.80
0.90
1.00
1.10
1.20
1.30
V (p
u)
AC case VSC case
Figure 8.7. Voltage profile at Srananagh 220 kV bus for loss of the Flagford - Srananagh line with a 120 MVAR switched capacitor.
Bus Voltage
time (s) 0.0 1.0 2.0 3.0 4.0 5.0 ... ... ...
0.70
0.80
0.90
1.00
1.10
1.20
1.30
V (p
u)
AC case VSC case
Figure 8.8. Voltage profile at Srananagh 220 kV bus for loss of the Flagford - Srananagh line with a 120 MVAR SVC.
8.6.3. Transient Overvoltages and Undervoltages
AC system voltages were monitored at buses rated 110 kV and above. The AC option and the VSC option demonstrated good voltage performance except at the instant of fault clearance. Table 8.5 lists the buses that experience a voltage spike greater than 1.3 pu for the AC and VSC options at the instance of fault clearance. These voltage spikes can be observed whenever a fault at the Flagford 220 kV bus is cleared. The voltage spikes have a duration of approximately 5 ms to 15 ms. Table 8.5: Buses exceeded transient voltage of 1.3 pu. Bus Number
Bus Name AC Option VSC Option 380 VSC filter bus, Flagford - yes 1402 Bellacorick 220 kV bus yes -
AC option VSC option
AC option VSC option
PDF created with pdfFactory Pro trial version www.pdffactory.com

EirGrid plc Investigating the Impact of HVdc Schemes in the Irish Transmission Network
Final Report
R1116.03.04, Page 63 Oct-18, 2009
© TransGrid Solutions Inc, 2009
Bus Number
Bus Name AC Option VSC Option 1411 Bellacorick 110 kV bus yes no 2522 Flagford 220 kV bus yes yes 5042 Srananagh 220 kV bus yes yes
Figures 8.9 through 8.10 show the bus voltage at the Bellacorick 110 kV bus, the Flagford 220 kV bus and the Srananagh 220 kV bus, respectively, showing these voltage spikes that occur upon clearing a fault at Flagford.
Bus voltages
Time(s) 0.00 0.10 0.20 0.30 0.40 0.50 0.60 0.70 0.80 0.90 1.00 ... ... ...
0.60
0.80
1.00
1.20
1.40
1.60
1.80
2.00
pu
VOLT 1411 [BELLACORR_B 110.00] VOLT 1411 [BELLACORR_B 110.00]
Figure 8.9: Voltage profile at Bellacorick 110 kV bus for contingency 2_1_R1.
Bus voltages
Time(s) 0.00 0.10 0.20 0.30 0.40 0.50 0.60 0.70 0.80 0.90 1.00 ... ... ...
0.60
0.80
1.00
1.20
1.40
1.60
1.80
2.00
pu
VOLT 2522 [FLAGFORD 220.00] VOLT 2522 [FLAGFORD 220.00]
Figure 8.10. Voltage profile at Flagford 220 kV bus for contingency 2_1_R1.
AC option VSC option
AC option VSC option
PDF created with pdfFactory Pro trial version www.pdffactory.com

EirGrid plc Investigating the Impact of HVdc Schemes in the Irish Transmission Network
Final Report
R1116.03.04, Page 64 Oct-18, 2009
© TransGrid Solutions Inc, 2009
Bus voltages
Time(s) 0.00 0.10 0.20 0.30 0.40 0.50 0.60 0.70 0.80 0.90 1.00 ... ... ...
0.60
0.80
1.00
1.20
1.40
1.60
1.80
2.00
pu
VOLT 5042 [SRANANAG 220.00] VOLT 5042 [SRANANAG 220.00]
Figure 8.11. Voltage profile at Srananagh 220 kV bus for contingency 2_1_R1. The voltage spikes do not appear at the Bellacorick bus in the VSC option because the VSC isolates the Bellacorick bus from issues happening on the other side of the VSC. In addition, the voltage spikes occurring near Flagford are slightly lower with the VSC option when compared to the AC options. As is evident in Figures 8.9 through 8.11, the system model seems to have some numerical issues associated with the AC network voltage solution. Immediately after clearing faults at Flagford, voltages in the area spike to very high values, up to 2.0 pu in the worst cases for a one or two time steps. It is not believed that these spikes are necessarily real overvoltages but rather are related to the PSSE solution, due to current injections from one or more of the wind generator models. The unreasonably high voltage spikes were verified to be numerical; reducing the simulation timestep reduced the width of the voltage spike. Similar spikes are seen throughout the Scenario 1 analysis for both the AC and VSC options.
8.6.4. Frequency Performance
In transient stability programs such as PSS/E, the transmission system frequency is obtained from the derivative of the bus voltage angle. If there is a sharp change in the bus angle, the frequency might change infinitely. Therefore, there are filters associated with the frequency measurements. However, sometimes these filters are not enough to completely rid the frequency calculations of these spikes, particularly if a fault has been applied in the area near to the frequency calculation. For this reason, generator speed quantities were mostly used to analyse frequency deviations as generator speeds are state variables which cannot change instantaneously and therefore should not give erroneous results. 8.6.4.1. Transient Frequency For the one power flow case that was studied, the AC and VSC transmission options did not show any transient underfrequency or overfrequency violations for any of the contingencies that were studied that did not involve generator tripping. All transient frequency deviations as measured by generator speeds were within criteria. 8.6.4.2. Long Term Frequency Also of interest to the system frequency performance are the dynamic contingencies that simulate loss of generation. These contingencies involve tripping of generators in the Bellacorick wind farm as well as thermal generators in the Tynagh area. These contingencies, along with the amount of generation tripped, are listed in Table 8.6. Table 8.6. Loss of generation.
AC option VSC option
PDF created with pdfFactory Pro trial version www.pdffactory.com

EirGrid plc Investigating the Impact of HVdc Schemes in the Irish Transmission Network
Final Report
R1116.03.04, Page 65 Oct-18, 2009
© TransGrid Solutions Inc, 2009
Contingency Amount of generation tripped (MW) 2_1_S/2_3_S 451.4 (Wind generation) 4_3_X 322.9 (Wind generation) 5_3_X 265.5 (Thermal generation)
Following the loss of generation, the frequency of the entire system gradually decreases. This causes the pump load at Turlough Hill (buses 52071 to 52074 (TURLG1-G4)) to trip for both the AC and VSC transmission options within approximately 15 seconds of simulation. On the first run-through of these contingencies it was noticed that wind generators in the area near Cork began tripping one at a time, starting with Thurles, Lisheen, Cureeny, Ikerrin and so on until a significant amount of wind generation had tripped by 30 seconds into the simulation, which further exacerbated the frequency decay. It was discovered (as is also pointed out in the discussions on Scenario 4) that the 110 kV area around Thurles does not appear to have sufficient dynamic voltage control. The area has many switched capacitors that are required to support voltage in the steady state, however in dynamics it seems that some of this capacitance should rather be dynamic reactive power support such as an SVC. What was happening in the loss of generation cases is that as the pump loads at Turlough Hill began to trip, the power flow in the area around Thurles began to change. As the power flow changed, the voltage began to increase due to the large amount of capacitance in the area, which caused the wind generators to begin tripping on overvoltage. If some of this capacitance was replaced by an SVC, there was no cascade tripping of wind generators for these contingencies and the frequency settles to a stable value, although the steady state frequency it settles to is still below the nominal 50 Hz. A +100/-50 MVAR SVC at Thurles was found to be sufficient for the particular cases being studied, however it is recommended to perform a more thorough reactive power study to determine the appropriate proportion of fixed and dynamic reactive power requirements. This SVC at Thurles was only tested for the contingencies involving loss of generation, and was not included in the system model for the other contingencies. The frequency decay for the largest generation loss of 451 MW (contingency 2_3_S) is illustrated in Figure 8.13 for the AC and VSC transmission options.
Speed deviations
Time(s) 0.0 5.0 10.0 15.0 20.0 25.0 30.0 ... ... ...
-2.50
-2.00
-1.50
-1.00
-0.50
0.00
0.50
Hz
SPD BUS 31271 MACH '1 ' SPD BUS 31271 MACH '1 '
-2.50
-2.00
-1.50
-1.00
-0.50
0.00
0.50
Hz
SPD BUS 70516 MACH '10' SPD BUS 70516 MACH '10'
Figure 8.13. Decay in generator speeds (Dublin Bay bus 31271, Ballylumford bus 70516) for loss of 451 MW (contingency 2_3_S).
AC option VSC option
PDF created with pdfFactory Pro trial version www.pdffactory.com

EirGrid plc Investigating the Impact of HVdc Schemes in the Irish Transmission Network
Final Report
R1116.03.04, Page 66 Oct-18, 2009
© TransGrid Solutions Inc, 2009
After 30 seconds of simulation there is a slight difference in the system frequency when comparing the AC option to the VSC option, however it is not very significant. Table 8.7 lists the system frequency at 30 seconds of simulation. Table 8.7. System Frequency after Loss of Generation. Contingency System Frequency (Hz) 2_3_S 47.8 4_3_X 48.2 5_3_X 48.4
The response of higher-speed control (such as machine governors) to short term frequency excursions is modeled in PSSE. Short-term system frequency criteria must be met by the calculated PSS/E frequency responses. In the event of extreme transient under-frequency, there is the risk of load shed and also the risk of the loss of generation through generation protection (typically installed to prevent damage resonances at off-nominal frequency operation). Steady state frequency control in the Irish transmission system is achieved by manual operator control. It is valid to assume that through corrective action, i.e. manual operator action, the system frequency will be restored to nominal in a timeframe beyond that of the transient stability study. It should be noted that the frequency the system settles to is above the emergency frequency criteria of 47.5 Hz, however is well below the allowable continuous criteria of 49.5 Hz. Note that load shedding as well as the frequency control function of the Moyle HVdc Interconnector were not modelled in this study.
8.6.5. Rate of Change of Frequency Performance
Rate of change of frequency can be a concern for systems with a high penetration of wind generation. This is because wind generators are often equipped with rate-of-change-of-frequency (ROCOF) relays to trip the wind generator if the rate of change of frequency is too high. The EirGrid Grid Code currently states that the maximum rate of change of frequency in the Irish transmission system is 0.5 Hz/sec. Large amounts of wind generation are planned to be connected to the Irish transmission system and this wind generation will displace conventional generation. Because wind generators do not provide as much inertia as conventional generators, the rate of change of system frequency will naturally increase, causing further concern regarding the ROCOF relays. One contingency, a three-phase fault at Flagford (contingency 2_3_R1), was used to compare the rate of change of speed of nearby generators at Tynagh and Omagh. Figure 8.14 shows the comparison. Both the AC and VSC options show rate of change of speeds greater than 0.5 Hz/sec during the fault and just after fault clearing. There does not appear to be a significant difference in these rates of change of speeds when comparing the AC option to the VSC option.
PDF created with pdfFactory Pro trial version www.pdffactory.com
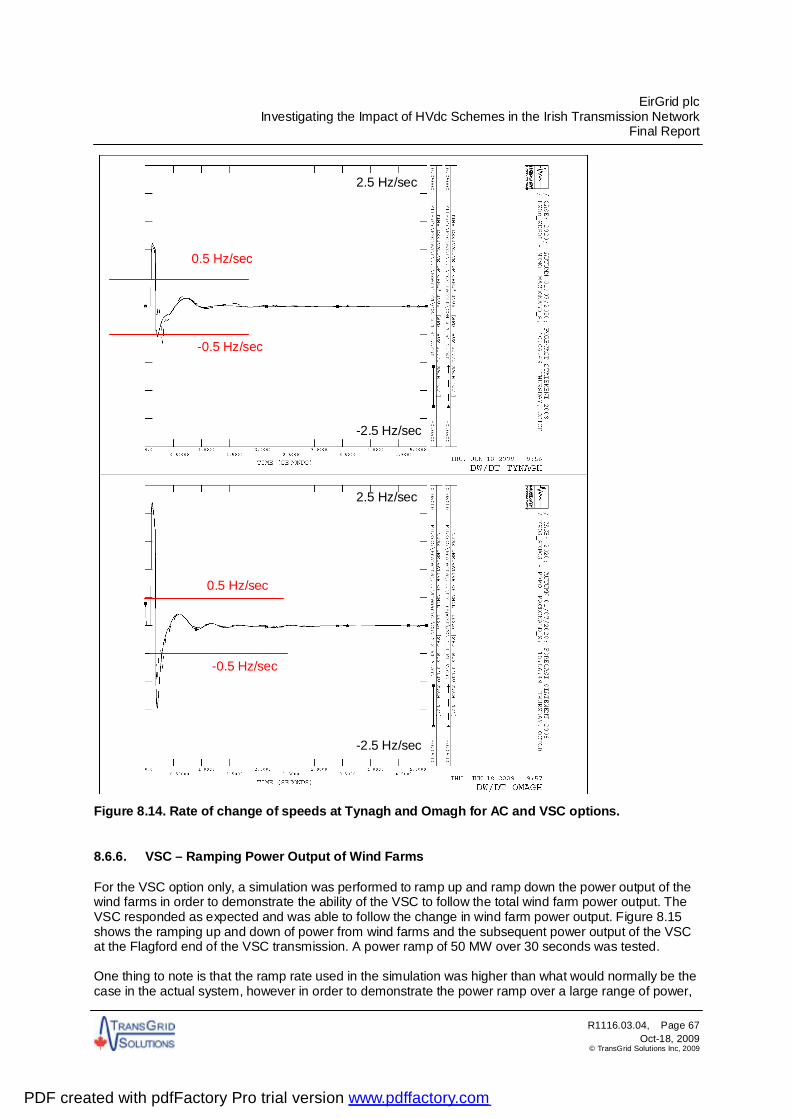
EirGrid plc Investigating the Impact of HVdc Schemes in the Irish Transmission Network
Final Report
R1116.03.04, Page 67 Oct-18, 2009
© TransGrid Solutions Inc, 2009
Figure 8.14. Rate of change of speeds at Tynagh and Omagh for AC and VSC options.
8.6.6. VSC – Ramping Power Output of Wind Farms
For the VSC option only, a simulation was performed to ramp up and ramp down the power output of the wind farms in order to demonstrate the ability of the VSC to follow the total wind farm power output. The VSC responded as expected and was able to follow the change in wind farm power output. Figure 8.15 shows the ramping up and down of power from wind farms and the subsequent power output of the VSC at the Flagford end of the VSC transmission. A power ramp of 50 MW over 30 seconds was tested. One thing to note is that the ramp rate used in the simulation was higher than what would normally be the case in the actual system, however in order to demonstrate the power ramp over a large range of power,
2.5 Hz/sec
-2.5 Hz/sec
-2.5 Hz/sec
2.5 Hz/sec
0.5 Hz/sec
-0.5 Hz/sec
0.5 Hz/sec
-0.5 Hz/sec
PDF created with pdfFactory Pro trial version www.pdffactory.com

EirGrid plc Investigating the Impact of HVdc Schemes in the Irish Transmission Network
Final Report
R1116.03.04, Page 68 Oct-18, 2009
© TransGrid Solutions Inc, 2009
the ramp rate was increased in order to reduce the simulation time. The VSC is expected to be able to follow a slower ramp as successfully as it follows the faster ramp rate tested in this study. In wind farm applications, there is no droop in the frequency control; the converters act in the same way an isochronous generator would, i.e. taking in whatever power the wind farm has to provide. The time constants for the frequency control represented in the VSC model are the same as in the real controls, therefore the control systems in the model closely follow those in the real control system. The VSC controls are fast in comparison to the ramp rate used in the wind ramp simulation, thus the output of the VSC essentially follows the change of power output of the wind farm exactly.
Figure 8.15. Ramping up and down the power of the Bellacorick wind farms.
8.7. System Frequency Scans
Impedance scans were performed in PSCAD to generate the positive sequence driving point impedance versus frequency (from 0Hz to 2500Hz in 2Hz increments) at the Flagford 220kV bus (2522). Two sets of scans were performed with and without the hypothetical 220kV AC line connection between Flagford and Bellacorick. In all cases the existing HVdc systems (Moyle and East-West Interconnectors) were left in service. To improve the accuracy of the frequency scans the Flagford-Bellacorick line was modeled as frequency dependant using the geometry data provided by EirGrid. All other transmission lines were modeled as Bergeron using the R,L,C data from PSS/E base cases. The Bergeron model is based on a distributed LC parameter travelling wave line model, with lumped resistance. It represents the L and C elements of a PI Section in a distributed manner (i.e. it does not use lumped parameters). It is roughly equivalent to using an infinite number of PI Sections, except that the resistance is lumped (1/2 in the middle of the line, 1/4 at each end). Like PI Sections, the Bergeron Model accurately represents the fundamental frequency only. It also represents impedances at other frequencies, except that the losses do not change. This model is suitable for studies where the fundamental frequency load flow is most important (i.e. relay studies, load flow, etc.). It should be noted that when developing the PSCAD model for the impedance scans, no information is given on the existing HVdc filters on the Moyle and Wales HVdc links and so they are inserted as simple capacitors. This will have an impact on the results, but without the details of the filters, this is an acceptable approximation. If an HVdc transmission option is selected a more detailed frequency scan study must be performed to consider all various system configurations in the foreseeable future. Results of this study will define a range of system impedances that may be seen from the converter terminals. The HVdc link manufacturer must design the link such that the injected harmonic currents and the resultant harmonic currents always remain below the set limits for all specified system impedances and HVdc link operating points. If during the lifetime of the HVdc link the system topology changes significantly in a way not predicted before, the original design may not be sufficient and modifications to
Change in Power Output of Wind Farms
Per-unitized, VSC exactly follows wind power output and plots line up on top of each other
VSC Power Input at Bellacorick
0 MW
50 MW 446 MW
496 MW
PDF created with pdfFactory Pro trial version www.pdffactory.com

EirGrid plc Investigating the Impact of HVdc Schemes in the Irish Transmission Network
Final Report
R1116.03.04, Page 69 Oct-18, 2009
© TransGrid Solutions Inc, 2009
the filters or other components may be required, such as occurred in the Itaipu HVdc inverter terminal, where two additional filter banks have been recently added to the original arrangement . Appendix A-5 contains the full set of results for the system frequency scans. The results are summarized in Table 8.8. Table 8.8 Frequency scan results for scenario 1 with and without the Flagford-Bellacorick AC line
Scenario Bus Frequency Harmonic Resonance Type Scenario Bus Frequency Harmonic Resonance Type 580 11.6 parallel 476 9.52 parallel 624 12.48 series 602 12.04 series 650 13 parallel 1042 20.84 parallel 658 13.16 series 1314 26.28 series
1010 20.2 parallel 1324 26.48 parallel 1298 25.96 series 1482 29.64 series 1326 26.52 parallel 1500 30 parallel 1482 29.64 series 1608 32.16 series 1502 30.04 parallel 1654 33.08 parallel 1608 32.16 series 1686 33.72 series 1656 33.12 parallel 1780 35.6 parallel 1686 33.72 series 1808 36.16 series 2344 46.88 parallel 2348 46.96 parallel 2372 47.44 series 2372 47.44 series 2450 49 parallel 2448 48.96 parallel
1 without AC line
2522
1 with AC line
2522
2470 49.4 series
Frequency scans show no resonances below the ninth harmonic with or without the AC line. When the Flagford-Bellacorick AC line is considered in the analysis resonance frequencies change and new ones are found. This is because with the new transmission line there are additional reactance and capacitances seen from Flagford. There are a number of series and parallel resonances in the 1 to 2k Hz region. A VSC converter using Pulse Width Modulation (PWM) technique generate a small amount of harmonics at the multiples of PWM switching frequency (in the 1 to 2k Hz range) and its sideband frequencies, i.e. n( fPWM +/- kf0 ) where fPWM is the PWM switching frequency and f0 is the network frequency (50Hz)..In other words harmonic voltages appear as clusters centered around the multiples of the PWM switching frequency. The magnitude of these harmonics reduces quickly for higher frequencies, therefore normally only the first cluster need to be considered. Figure 8.16 below shows the frequency spectrum of a typical VSC converter line to ground voltage before filtering. This converter uses PWM switching frequency of 21 f0. As can be seen, the largest cluster of harmonics appears at the 21st harmonic and sidebands around it. In addition to the coupling transformer, there is usually a reactor in series with each phase of the VSC that presents a large impedance to these high frequency harmonics and therefore only a small amount of harmonic currents flow towards the network. If necessary a small shunt filter is added between the phase reactor and the coupling transformer to further reduce the harmonic currents injected into the system. If there is series resonance at the VSC switching or sideband frequencies, these harmonic currents may propagate into the system. As the switching frequency of a VSC can be selected (note that switching losses are higher for higher switching frequencies), the harmonics of concern can usually be moved away from the resonance point, but care must be taken for harmonic resonances in the range of 20 to 40. The VSC manufacturer should consider the system impedance for all plausible system configurations and evaluate the level of harmonics injected to the system for compliance with the Irish network requirements. In conclusion, if a VSC based HVdc link with PWM modulation is used in this scenario, proper filtering must be provided to avoid harmonic current injection into the system under the worst case resonance conditions.
PDF created with pdfFactory Pro trial version www.pdffactory.com

EirGrid plc Investigating the Impact of HVdc Schemes in the Irish Transmission Network
Final Report
R1116.03.04, Page 70 Oct-18, 2009
© TransGrid Solutions Inc, 2009
Figure 8.15. Frequency spectrum of a VSC converter line to ground voltage with PWM modulation at switching frequency of 21 f0.
8.8. SSR Screening
The UIF calculation described in the Study Procedures section is intended to screen for potential interaction between a conventional LCC HVdc system and generator shaft oscillation modes, known as subsynchronous resonance (SSR). With LCC HVdc, any resonance frequency (f) on the DC side gets converted to f0+f and f0-f frequencies on the AC side. Because VSC is a relatively new technology compared to LCC, there is less information available on the possibility of SSR with a VSC HVdc system. A simple test case was setup in PSCAD to test whether the same phenomenon occurred with VSC and results indicate that VSC may have the same potential as LCC to excite SSR. There is also little information readily available on the possibility of SSR between a wind farm and a VSC HVdc system. Because of this, the possibility cannot be excluded and it cannot be said for certain that the possibility does not exist. The UIF calculation is intended for use with LCC HVdc and thermal generators. There is no such empirical formula for screening for potential SSR between a wind farm and VSC HVdc system. Should this VSC option be futher pursued it would be recommended to perform further studies to verify the possibility of SSR with the Bellacorick wind farm along with appropriate mitigation if deemed necessary. Although the UIF screening calculations are intended to be used for LCC HVdc, the UIF was calculated for the VSC option as well in order to provide an indication of the potential need for detailed SSR studies. Table 8.8 summarizes the results. All UIF calculations were well below the threshold of 0.1, therefore no concerns are flagged.
PDF created with pdfFactory Pro trial version www.pdffactory.com

EirGrid plc Investigating the Impact of HVdc Schemes in the Irish Transmission Network
Final Report
R1116.03.04, Page 71 Oct-18, 2009
© TransGrid Solutions Inc, 2009
Table 8.8. SSR Screening for VSC at Flagford 220 kV Bus. Short Circuit Level (MVA)
Generator Bus Number
Generator Rating (MVA)
VSC Rating (MW)
System Intact
Generator out-of-service UIF
Edenderry (19471) 153 500 3583 3569 0.0000 Dublin Bay (31271) 500 500 3583 3521 0.0003 Lough Ree Power (35074) 121.1 500 3583 3532 0.0008 Long Point Aghada (35771) 500 500 3583 3566 0.0000 Moneypoint (39471) 359 500 3583 3557 0.0001 Moneypoint (39472) 359 500 3583 3562 0.0000 Moneypoint (39473) 359 500 3583 3557 0.0001 West Offaly Power (49474) 181.7 500 3583 3555 0.0002 Sealrock (50573) 96 500 3583 3580 0.0000 Sealrock (50574) 96 500 3583 3580 0.0000 Tynagh (51771) 327 500 3583 3512 0.0006 Tynagh (51772) 163.7 500 3583 3543 0.0004
8.9. Summary of Overall Study Results for Scenario 1
The results of the analysis are summarized as follows:
• The VSC showed comparable losses with the single AC line option, with the VSC having 2-3 MW lower losses.
• There were no significant impacts observed in terms of steady state voltage violations or thermal overloads.
• The VSC option resulted in lower short circuit levels in the area near the VSC terminals in
comparison to the AC option.
• If reclosing is a requirement for the new transmission connection between Bellacorick and Flagford in order to not lose the potential 460 MW for longer than 680 ms, then it is likely the case that two independent connections to the grid, i.e. two transformers and two AC lines, or a VSC bipole would be required. Otherwise it is not expected that reclosing can be performed after such a fault with only a single connection to the grid because the Bellacorick wind farms would be isolated from the system for nearly 700 ms before reclosing would occur, and it is not expected that they would be able to remain connected without being tripped by either voltage or frequency protection during this time. This should be verified with the wind generator manufacturers if it is a concern.
• In both the AC and VSC options, post-contingency overvoltages near 1.2 pu were observed at the
Srananagh 220 kV bus due to the modeling of a 120 MVAR capacitor at Srananagh following the loss of the Flagford-Srananagh line. The capacitor is needed for steady state reactive power support. The capacitor was replaced with an SVC to eliminate the post-contingency overvoltage.
• Transient undervoltages were not found to be a concern in any of the options.
• The transient frequency performance was within criteria for both the AC and VSC options.
PDF created with pdfFactory Pro trial version www.pdffactory.com

EirGrid plc Investigating the Impact of HVdc Schemes in the Irish Transmission Network
Final Report
R1116.03.04, Page 72 Oct-18, 2009
© TransGrid Solutions Inc, 2009
• Loss of generation in the AC and VSC options both showed the need for some of the switched capacitors in the area near Thurles to be replaced with dynamic reactive power support such as an SVC in order to avoid cascade wind generator tripping due to poor voltage control in the area. Please note that Thurles is far from the study area and this issue is not related to whether or not the Bellacorick wind farms were connected to the grid via AC or VSC HVdc transmission.
• The largest loss of generation in the AC and VSC options both showed the system settling out to
a steady state frequency of 47.8 Hz due to loss of the 460 MW of wind generation at Bellacorick. This frequency is above the emergency frequency criteria, but below the continuous frequency criteria of 49.5 Hz.
• No significant difference in rate of change of frequency was observed between the AC and VSC
options. Both options showed rate of change of frequency greater than 0.5 Hz/sec during and immediately following the application of a three-phase fault at Flagford.
• For the VSC option, a simulation was performed to ramp the power output of the largest wind
farm in order to demonstrate the ability of the VSC to follow the wind farm power output. The VSC responded as expected and was able to follow the change in wind farm power output.
• There were no concerns flagged by the subsynchronous resonance (SSR) screening study that
was performed at the Flagford bus. All UIF calculations were well below the threshold of 0.1. However there is little information readily available on the possibility of SSR between a wind farm and a VSC HVdc system. Because of this, the possibility cannot be excluded and it cannot be said for certain that the possibility of SSR does not exist in this situation. The UIF calculation used in this study to screen for potential SSR issues is only intended for use with LCC HVdc and thermal generators. There is no such empirical formula for screening for potential SSR between a wind farm and VSC HVdc system. Should this VSC option be futher pursued it would be recommended to perform further studies to verify the possibility of SSR with the Bellacorick wind farm along with appropriate mitigation if deemed necessary.
8.10. Overall Comparison of HVdc Solutions with Equivalent AC Solution
The studies showed no significant difference between the AC and VSC HVdc options in terms of the following aspects:
• Steady state voltage violations once mitigation of capacitance at Thurles and Portlaoise was added.
• Thermal overloads. • Rate of change of frequency during and following faults. • Long term frequency decay due to loss of generation – the system settles to the same steady
state underfrequency for the AC and VSC options.
8.10.1. AC Advantages over HVdc
Based on the study results, the AC option had the following technical advantages compared to the VSC options:
• Higher short circuit levels resulting in stronger local AC system
8.10.2. HVdc Advantages over AC
Based on the study results, the VSC option had the following technical advantages compared to the AC option:
• The VSC provides inherent dynamic reactive power support. • Slightly lower losses (by 2-3 MW) compared to a single 220 kV AC line.
The VSC option can utilize underground cables.
PDF created with pdfFactory Pro trial version www.pdffactory.com

EirGrid plc Investigating the Impact of HVdc Schemes in the Irish Transmission Network
Final Report
R1116.03.04, Page 73 Oct-18, 2009
© TransGrid Solutions Inc, 2009
8.11. Recommendations
The studies have shown that the both the 220 kV AC line option and the VSC HVdc option are technically feasible. Without consideration for economics or environmental impacts, based solely on the technical comparison between the AC option and the VSC HVdc option it appears that there are no significant reasons to select HVdc over AC transmission or vice versa. VSC HVdc links have the benefit of inherent reactive power support and can utitlize underground cables. Typical applications of HVdc systems include: • Transmission with overhead line distances above 1 000 km, where the need of various intermediate
tapings is not present; • Interconnecting systems with different frequencies (50 Hz to 60 Hz); • Undersea or underground cables with lengths around 50 km or more; • Need for asynchronous operation (even at the same frequency base), like interconnection of different
markets. • Need for absolute power scheduling VSC HVdc technology is currently being used for connecting isolated wind farms to the grid particularly for the offshore farms. For onshore applications if the transmission distance is too long (over 50-100km) then the overhead lines are preferred. Long AC cables are not practical due to the large amount of line charging associated with a long AC cable. Of course it is possible to use multiple sections of AC cable with shunt reactive compensation in between, but in most cases this option is not economically viable. The VSC solution can be used with both overhead line and underground cable. VSC technology can be applied to very weak systems and is capable of following the power output of an isolated wind farm so as to control the frequency. The frequency can be kept constant or varied to allow for optimal operation of the wind farm. It It also has a varying range of dynamic reactive power support.
PDF created with pdfFactory Pro trial version www.pdffactory.com

EirGrid plc Investigating the Impact of HVdc Schemes in the Irish Transmission Network
Final Report
R1116.03.04, Page 74 Oct-18, 2009
© TransGrid Solutions Inc, 2009
9. Scenario Two and Three: New North-South Interconnector The original RFP for this project defined Scenario 2 as ‘Provision of additional transmission capacity in a strongly meshed area of the transmission network’ and Scenario 3 as ‘Provision of additional transmission capacity in a weakly meshed area of the transmission network, such as an additional connection between the Republic of Ireland and Northern Ireland’. Scenario 2 was to consider an HVdc line from Woodland to mid Cavan while Scenario 3 was to consider an HVdc link between mid Cavan and Turleenan. Figure 9.1 shows the proposed route and terminating nodes for the two scenarios.
During the discussions at the Methodology Workshop it became clear that there are advantages to building a single three-terminal HVdc link between Woodland, mid Cavan and Turleenan instead of building two separate links as originally suggested. These advantages include large savings in converter costs and extra equipment required for strengthening the system at mid Cavan; particularly if the LCC based HVdc links are used. As a result of these discussions it was decided that Scenarios 2 and 3 will be combined and a single three-terminal HVdc link connecting Woodland, mid Cavan and Turleenan will be studied, further referred to simply as Scenario 2.
Figure 9.1. Proposed substations at Woodland, mid Cavan and Turleenan for Scenario 2 and 3.
PDF created with pdfFactory Pro trial version www.pdffactory.com

EirGrid plc Investigating the Impact of HVdc Schemes in the Irish Transmission Network
Final Report
R1116.03.04, Page 75 Oct-18, 2009
© TransGrid Solutions Inc, 2009
The following points describe Scenario 2 in more detail:
• 1500 MW bi-directional multi-terminal HVdc schemes with a 500 MW terminal at mid Cavan are studied.
• The HVdc terminal locations are at the Turleenan 275 kV bus, mid Cavan 220 kV bus and Woodland 400 kV bus. The Woodland 220 kV terminal bus was compared to the 400 kV bus in terms of system strength and the 400 kV bus was found to be slightly stronger than the 220 kV bus. Therefore the HVdc terminal was located at the 400 kV bus. There are two 500 MVA transformers connecting the 400 kV to the 220 kV bus with the understanding that a third transformer is planned.
• Power flows as in the equivalent AC solution are used at each of the terminals in the HVdc
solutions.
• HVdc solutions are assumed to use an underground cable. In case of the VSC based HVdc link, the cable is assumed to be of XLPE technology while in the case of the LCC based HVdc link mass impregnated cable is assumed.
• The Phase Shifting Transformer (PST) at Strabane is bypassed and circuits are added between
Coolkeeragh-Trillick and Letterkenny-Strabane as per the North-West ‘Wind’ solution.
• The base case model used for this scenario is the year 2020 base case.
9.1. Transmission Options
For Scenario 2, three alternative solutions are studied and compared:
9.1.1. AC Alternative
The AC option consists of a 400 kV overhead AC transmission line from Turleenan to Woodland with a connection to the 220 kV mid Cavan bus.
9.1.2. HVdc Alternatives
9.1.2.1. HVdc Option 1 – LCC The first HVdc scheme consists of a single three-terminal bipolar Line Commutated Converter (LCC) based HVdc link connecting the terminals at Woodland, mid Cavan and Turleenan, as shown in Figure 9.2.
The Methodology Workshop defined the following:
• A single bipolar three-terminal LCC based HVdc link with terminals at Woodland, mid Cavan and Turleenan.
• Terminals at Woodland and Turleenan are rated at 1500 MW while the mid Cavan terminal is rated at 500 MW.
• The rated DC voltage is 500 kV.
• The initial power flow at each HVdc terminal is set to be equal to the power flow through the
equivalent alternative AC transmission line in the corresponding power flow case.
PDF created with pdfFactory Pro trial version www.pdffactory.com

EirGrid plc Investigating the Impact of HVdc Schemes in the Irish Transmission Network
Final Report
R1116.03.04, Page 76 Oct-18, 2009
© TransGrid Solutions Inc, 2009
Figure 9.2. Diagram of LCC option as modeled in PSSE.
An HVDC bipole refers to an HVDC system that can continue to operate with one of the two poles being out of service. The advantage of a bipolar HVdc scheme in comparison to a monopolar HVdc scheme is that the bipolar scheme can continue to transmit power (up to the rating of the remaining pole, that is 50% of total capacity without considering overload) with one pole out of service whereas the monopolar scheme would be entirely out of service. This is somewhat comparable, in the case of HVAC schemes, to the reliability advantage that a double circuit AC (overhead line or underground cable) would have over a single circuit AC. The LCC HVdc scheme in reality would be as described; a three-terminal bipolar LCC link and would use mass-impregnated underground cable due to the higher DC voltage rating, however the number of cables to be used would be a design issue dependent on the final DC voltage and power rating of the LCC link. In this study, the HVdc link is modeled in PSSE as two single three-terminal monopoles, each rated at 500 kV dc voltage with power ratings of 750 MW at Turleenan and Woodland and 250 MW at mid Cavan, therefore the two poles totaling +/-500 kV at the required ratings of 1500 MW at Turleenan and Woodland and 500 MW at mid Cavan. Each pole is modeled by one cable, therefore two cables in total for the bipole. With the LCC technology, mass impregnated cable would be used, and a minimum of two cables would be required for the bipole, not including any spares. The exact number and rating of the required cables is a design issue that would depend on the dc voltage and MW rating. In an LCC HVdc system, filters are located at the three stations in order to filter out harmonics and to provide reactive power compensation. An LCC converter will typically consume reactive power in the range of 50-60% of the real power being transmitted. A minimum number of filters need to be in-service to ensure acceptable harmonic performance. The exact amount of MVAR would depend on the actual filter design. For purposes of this study, a minimum of two filters were assumed to be in-service at all times.
500 MW
Turleenan 275 kV bus
Filters: Blocks of 100 MVAr
Woodland 380 kV bus
Filters Blocks of 100 MVAr
mid Cavan 220 kV bus
Filters: Blocks of 25 MVAr
1500 MW 1500 MW
PDF created with pdfFactory Pro trial version www.pdffactory.com

EirGrid plc Investigating the Impact of HVdc Schemes in the Irish Transmission Network
Final Report
R1116.03.04, Page 77 Oct-18, 2009
© TransGrid Solutions Inc, 2009
Blocks of 100 MVAR filters (shunt capacitors) were modeled at the 1500 MW stations and 25 MVAR filters (shunt capacitors) were modeled at the 500 MW station. The converters are connected via DC cable, at lengths of 82 km between Turleenan and mid Cavan and 58 km between mid Cavan and Woodland. In an LCC HVdc system, current normal industry practice is to supply a single twelve pulse valve group per pole at each station for HVdc transmission systems with power ratings similar to that being considered. Each twelve pulse valve group, at this power rating, is connected to the AC system either through two three phases, two windings, converter transformers or three, single phase, three winding converter transformers to provide the necessary wye:wye and wye:delta connections. As far as the PSSE model is concerned, it was mentioned that the bipole is modeled as two monopoles, however when operating in bipolar mode this has no impact on the simulation results. The loadflow and dynamics models assume each pole to be a twelve pulse valve group, with two converter transformers, as shown above in Figure 9.2. However, the converter transformers are located directly within the PSSE DC line models and are not explicitly modeled. The valves themselves are not included in a PSSE type model as such a simulation tool is not capable of modeling the actual three-phase switching, and therefore the DC current injection into the AC system is rather calculated using the steady state DC equations. One DC cable per pole was modeled. More information on HVDC representation in PSSE can be found in the PSSE Operational and Application Guides. HVdc Option 1 (LCC) was represented in dynamics using the two timestep model described in Section 5.1.2. 9.1.2.2. HVdc Option 2 – VSC The second HVdc scheme consists of a single three-terminal bipolar Voltage Source Converter (VSC) based HVdc link connecting the terminals at Woodland, mid Cavan and Turleenan, as shown in Figure 9.3.
The Methodology Workshop defined the following:
• Two parallel three-terminal VSC based HVdc links will be used in this alternative.
• The HVdc link will be rated at 750 MW at Turleenan and Woodland, with a smaller tap at mid Cavan.
• The rated DC voltage will be 320 kV.
Figure 9.3. Diagram of VSC option as modeled in PSSE. An HVDC bipole refers to an HVDC system that can continue to operate with one of the two poles being out of service. The advantage of a bipolar HVdc scheme in comparison to a monopolar HVdc scheme is that the bipole scheme can continue to transmit power (up to the rating of the remaining pole, that is 50% of total capacity without considering overload) with one pole out of service whereas the monopole scheme would be entirely out of service. This is somewhat comparable, in the case of HVAC schemes, to
Turleenan 275 kV
mid Cavan 220 kV
Woodland 380 kV
PDF created with pdfFactory Pro trial version www.pdffactory.com

EirGrid plc Investigating the Impact of HVdc Schemes in the Irish Transmission Network
Final Report
R1116.03.04, Page 78 Oct-18, 2009
© TransGrid Solutions Inc, 2009
the reliability advantage that a double circuit AC (overhead line or underground cable) would have over a single circuit AC. The VSC HVdc scheme in reality is expected to be as described; a three-terminal bipolar VSC link. As of today, a bipolar VSC cable scheme is limited to 1200 MW rating, however in the timeframe of the implementation of this project, a rating of 1500 MW in bipolar VSC cable systems are anticipated. The type and number of cables to be used in such a scheme would be design dependent based on the rated dc voltage and power levels. In this study, however due to modeling limitations, the HVdc VSC link is modeled as two parallel three-terminal monopolar +/- 320 kV VSC links with converter ratings of 796 MVA at Turleenan and Woodland and 405 MVA at mid Cavan. The required ratings for the stations were to be 1500 MW at Turleenan and Woodland, and 500 MW at mid Cavan, however the vendor-supplied VSC model used in these studies is pre-set to various power ratings at DC voltage levels. The closest rating available to meet the total of 1500 MW were those rated at 796 MVA, two monopoles in parallel providing a total of 1592 MVA. This power rating is only available at the +/- 320 kV dc voltage level, therefore the mid Cavan terminal converter may be rated less but must still operate at the same dc voltage level. The smallest available VSC converter model at +/- 320 kV dc voltage level is pre-set to 405 MVA, therefore by default this rating was selected for the two parallel monopolar VSC converters at mid Cavan for a total rating of 810 MVA. Please note that this is a modeling issue only and that in reality 1500 MW and 500 MW ratings can be achieved in the future, it does not have to be the specific pre-set MVA ratings of the PSSE model. The converters are connected via DC cable, at lengths of 82 km between Turleenan and mid Cavan and 58 km between mid Cavan and Woodland. The VSC converters have a large reactive power support range. The P-Q operating range is dependent on the real power operating point as discussed in [3]. The number of cables required for a VSC bipole would depend on the type of cable being used. Either XLPE or mass impregnated cable can be used, depending on the voltage and MW rating required. XLPE cable is cheaper but can only go up to approximately 320 kV DC. Mass impregnated cable is more expensive but can go up to higher DC voltages. It becomes an economic study to determine how many XLPE cables would be required compared to mass impregnated cables, and which option would be less expensive. If multiple XLPE cables would be required, it is assumed for this scenario that as a worst case cost, the VSC bipole would require the same number of mass-impregnated cables as the LCC bipole, therefore not providing any cost benefit for the VSC. The VSC bipole would however save approximately 40% of the station foot print. As far as the PSSE model is concerned, the VSC system is modeled as two separate monopoles due to modeling limitations (i.e. no bipolar model is available), however when operating in bipolar mode this has no impact on the simulation results. The loadflow and dynamics models represent each pole connected to the AC system via a single transformer, with AC filters on the VSC side of the transformer. The VSC converter is represented by a generator model in loadflow and by a current injection model in dynamics. The valves themselves are not included in a PSSE type model as such a simulation tool is not capable of modeling the actual three-phase switching. In this case, because the VSC system is modeled with two independent monopoles, two DC cables per pole are represented in the vendor-supplied monopolar model, however this does not necessarily reflect reality as discussed in the previous paragraph. More information on the specific vendor-supplied PSSE models can be found in [3].
9.1.3. Reactive Power Exchange with AC System
Line-commutated converters typically consume reactive power in the range of 50-60% of transmitted real power. LCC HVdc links are supplied with filters and capacitor banks, both for harmonic performance and for reactive power compensation. The LCC HVdc system is designed such that a certain minimum to maximum band of reactive power is exchanged with the AC system (which can be seen in the +/-Q band in Figure 9.2). Filters are switched on/off in order to maintain the reactive power exchange within the desired band, typically +/- 50 to100 MVAR depending on the filter bank size of a specific HVdc system, and depending on the reactive power consumption of the converter. An example P-Q diagram of an LCC HVdc system is shown in Figure 9.2.
PDF created with pdfFactory Pro trial version www.pdffactory.com

EirGrid plc Investigating the Impact of HVdc Schemes in the Irish Transmission Network
Final Report
R1116.03.04, Page 79 Oct-18, 2009
© TransGrid Solutions Inc, 2009
Figure 9.2. Typical LCC P-Q diagram including converter and filters. Green curve is reactive power exchanged with AC System. Red curve is the reactive power absorbed by the converter. Voltage source converters have a large range of fast reactive supply and absorption capability. The reactive power capability depends on the real power transmission. The vendor-supplied model used in this study has the typical per unit P-Q operating diagram shown in Figure 9.3 (figure taken from [3]). This diagram demonstrates that when operating at a real power level near the MVA rating of the VSC, the reactive power capability is significantly less than if operating at a lower power level, in fact the reactive power capability shown in Figure 9.3 is near 0 MVAR at 1 pu real power. The reactive power can be controlled independently at each station. Please note that this P-Q diagram is typical and vendor-specific and does not necessarily reflect the P-Q operating curve of VSCs supplied by other vendors. Also note that the P-Q diagram refers to the converter only. There are filters located on the AC bus on the VSC side of the transformer which are not accounted for in the P-Q diagram. The rating of the filters depends on the rating of the converter (please see suggestions raised for previous scenario). Each 796 MVA VSC link as modeled in this scenario has 119.4 MVAR of filters (capacitance).
Figure 9.3. VSC P-Q diagram (converter only). Source: ABB.
PDF created with pdfFactory Pro trial version www.pdffactory.com
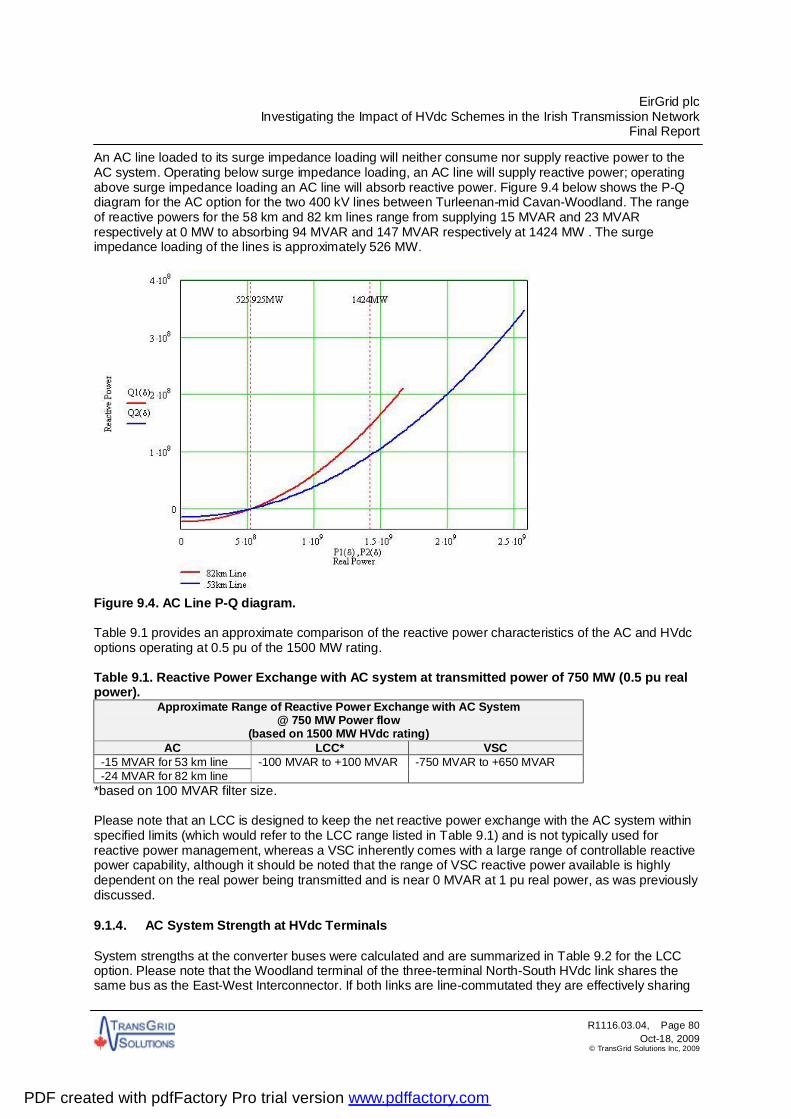
EirGrid plc Investigating the Impact of HVdc Schemes in the Irish Transmission Network
Final Report
R1116.03.04, Page 80 Oct-18, 2009
© TransGrid Solutions Inc, 2009
An AC line loaded to its surge impedance loading will neither consume nor supply reactive power to the AC system. Operating below surge impedance loading, an AC line will supply reactive power; operating above surge impedance loading an AC line will absorb reactive power. Figure 9.4 below shows the P-Q diagram for the AC option for the two 400 kV lines between Turleenan-mid Cavan-Woodland. The range of reactive powers for the 58 km and 82 km lines range from supplying 15 MVAR and 23 MVAR respectively at 0 MW to absorbing 94 MVAR and 147 MVAR respectively at 1424 MW . The surge impedance loading of the lines is approximately 526 MW.
Figure 9.4. AC Line P-Q diagram.
Table 9.1 provides an approximate comparison of the reactive power characteristics of the AC and HVdc options operating at 0.5 pu of the 1500 MW rating. Table 9.1. Reactive Power Exchange with AC system at transmitted power of 750 MW (0.5 pu real power).
Approximate Range of Reactive Power Exchange with AC System @ 750 MW Power flow
(based on 1500 MW HVdc rating) AC LCC* VSC
-15 MVAR for 53 km line -100 MVAR to +100 MVAR -750 MVAR to +650 MVAR -24 MVAR for 82 km line
*based on 100 MVAR filter size. Please note that an LCC is designed to keep the net reactive power exchange with the AC system within specified limits (which would refer to the LCC range listed in Table 9.1) and is not typically used for reactive power management, whereas a VSC inherently comes with a large range of controllable reactive power capability, although it should be noted that the range of VSC reactive power available is highly dependent on the real power being transmitted and is near 0 MVAR at 1 pu real power, as was previously discussed.
9.1.4. AC System Strength at HVdc Terminals
System strengths at the converter buses were calculated and are summarized in Table 9.2 for the LCC option. Please note that the Woodland terminal of the three-terminal North-South HVdc link shares the same bus as the East-West Interconnector. If both links are line-commutated they are effectively sharing
PDF created with pdfFactory Pro trial version www.pdffactory.com

EirGrid plc Investigating the Impact of HVdc Schemes in the Irish Transmission Network
Final Report
R1116.03.04, Page 81 Oct-18, 2009
© TransGrid Solutions Inc, 2009
the short circuit strength at the bus which could result in the need for increased system strength in the area, however the studies will determine this4. In addition, it should be noted that any AC fault that causes one inverter to fail commutation will likely cause the other to simultaneously fail commutation. Also, although somewhat further removed, the inverter bus of the Moyle LCC Interconnector is also not that far from the Turleenan inverter bus, therefore a similar comment could be made for these two stations but to a lesser degree. Table 9.2. Short Circuit Levels at the LCC HVdc Terminals.
LCC HVdc (MVA)
Scenario
Turleenan mid Cavan Woodland 2.1 3360 2751 4259 2.2 3825 2819 5268 2.3 7239 3549 6178 2.4 5592 3578 7228
System strength is not as important for a VSC converter.
9.2. Contingencies
9.2.1. Steady State Analysis
All n-1 contingencies for 110 kV and above as well as several key double circuit outage conditions were studied.
9.2.2. Transient Stability Analysis
Table 9.3 describes the system disturbances that are applied to perform the transient stability analysis. Table 9.3. Dynamic Contingencies.
Fault At Fault cleared by tripping Fault
Bus kV Type Fault
duration Reclose
time 3ph/1ph Reclose
Reopening of Recloser (permanent
fault) 1_0_X Permanent single pole block of HVdc/VSC
2_1_A 90120 (Turleenan) 275 1ph 0.3s 90120, 90320, "1"-Turleenan-Tamnamore 275kV No reclose for breaker failure
2_3_A 90120 (Turleenan) 275 3ph 0.12s 90120, 90320, "1"-Turleenan-Tamnanore 275kV 0.72s 3ph No
2_1_B 3772 (Cavan) 220 1ph 0.3s 3522, 3772, "1"-Louth-Cavan 220 kV No reclose for breaker failure
2_3_B 3772 (Cavan) 220 3ph 0.08s 3522, 3772, "1"- Louth-Cavan 220 kV 0.68s 3ph No
2_1_C 5464 (Woodland) 400 1ph 0.3s 3854, 5464,"1" -Maynooth-Woodland 380 kV 5464, 5462,54621,"1" - Woodland T2101 No recloser for breaker failure
2_3_C 5464 (Woodland) 400 3ph 0.08s 3854, 5464, "1"-Maynooth-Woodland 380 kV 0.58s 1ph No
3_3_X 70520 (Ballylumford) 275 3ph 0.12s 70520, 81020, "2"-Ballylumford-Hanahstown
275kV 0.72s 3ph No
4_3_X 90020 (Tandragee) 275 3ph 0.12s 90020, 35231, "1"-Louth-Tandragee 275kV 1 90020, 35232, "2"-Louth-Tandragee 275kV 2 0.72s 3ph No
6_3_X 75520 (Coolkeeragh) 275 3ph 0.12s
75520, 73522, "1"-Coolkeeragh-Magherafelt first section 275kV 75520, 73521, "1"- Coolkeeragh- Magherafelt first section 275kV
0.72s 3ph No
7_X_X Loss of largest dispatched unit in Northern Ireland - including wind generators
7C_X_X Loss of largest dispatched unit in Northern Ireland - excluding wind generators
8_3_X 35231 (Louth) 275 3ph 0.12s 35231, 90020, "1" –Louth-Tandragee 275kV 0.72s 3ph No
4 Not as great a concern since East-West Interconnector will now be a VSC link.
PDF created with pdfFactory Pro trial version www.pdffactory.com

EirGrid plc Investigating the Impact of HVdc Schemes in the Irish Transmission Network
Final Report
R1116.03.04, Page 82 Oct-18, 2009
© TransGrid Solutions Inc, 2009
Fault At Fault cleared by tripping
9_1_X 3522 (Louth) 220 1ph 0.3s
3522, 3772, "1" - Louth-Cavan 220 kV 3522,2842,"1" - Louth-Gorman 220 kV 3522,3521,35224 ckt 4 -Louth T2104 3522,3521,35222 ckt 2 - Louth T2102 3522,35231,35236 ckt 1 - AT1 3522,35231,35238 ckt 3 -AT3
No reclose for breaker failure
9_3_X 3522 (Louth) 220 3ph 0.08s 3522, 3772, "1"- Louth-Cavan 220 kV 0.68s 3ph No
9R_3_X 3522 (Louth) 220 3ph 0.08s 3522, 3772, "1"- Louth-Cavan 220 kV 0.68s 3ph Yes –at 0.73s
10_1_X 2842 (Gorman) 220 1ph 0.3s 2842, 3842, "1" -Gorman Maynooth 220 kV 2842,2841,28421,"1" - Gorman T2101 No reclose for breaker failure
10_3_X 2842 (Gorman) 220 3ph 0.08s 2842, 3842, "1"- Gorman Maynooth 220 kV 0.68s 3ph No
11_1_X 3521 (Louth) 110 1ph 0.3s
2181, 3521, "1" -Drybridge-Louth 110 kV 3521,4781, "1" - Louth-Ratrussan 110 kV 3521, 4061, "1"- Louth-Mullagharlin 110 kV 3522,35231,35236 “1”- Louth T2101 3522,35231,35238 “3”- Louth T2103
No recloser for breaker failure
11_3_X 3521 (Louth) 110 3ph 0.15s 2181, 3521, "1"- Drybridge-Louth 110 kV 0.75s 3ph No
12_X_X 3122 (Irishtown) 220 3ph 0.06s 3122, 31271 , "1"Generator Transformer & Generator at 31271 – Irishtown Generation No reclose
9.3. Power Flows Cases and Losses
The powerflows for the HVdc options were created by removing the 400 kV AC line between Turleenan-mid Cavan-Woodland from service and replacing it with the LCC and VSC options operating at the same power transfers as the AC line was transferring for each of the four power flow cases. Losses in the AC line, the LCC HVdc system and the VSC HVdc system were calculated and compared for each option. Because the transmission distance is relatively short, the AC option has the lowest losses, followed by the LCC option and then the VSC option. Losses in an LCC HVdc system are typically calculated as 0.75% per converter station at 1.0 pu loading, with 40% fixed losses and 60% variable plus the losses in the DC line. According to the VSC manuals [3], each VSC converter has losses of 1.65% at nominal (rated) MVA loading, with 30% fixed losses and 70% variable plus the losses in the DC line. Table 9.3 summarizes the losses flowing in the AC line and in the two HVdc systems. Care should be taken in interpreting these results however, as load profiles and economics have not been considered in this study and would require further investigation. The results in Table 9.3 are for specific operating points only. Table 9.3. Comparison of Losses for the Three Options.
Scenario AC Line (MW)
DC line + LCC Converters (MW)
DC line + VSC Converters (MW)
2.1 11.4 14.5 37.0 2.2 8.4 13.4 35.4 2.3 7.8 13.1 33.2 2.4 5.0 12.5 31.6
9.4. Steady State Contingency Analysis
Steady state contingency analysis was performed on the four power flow cases described in Table 5.1.
PDF created with pdfFactory Pro trial version www.pdffactory.com

EirGrid plc Investigating the Impact of HVdc Schemes in the Irish Transmission Network
Final Report
R1116.03.04, Page 83 Oct-18, 2009
© TransGrid Solutions Inc, 2009
9.4.1. Overload Impacts
There were many overloads observed throughout and common to all three options, namely the AC, LCC and VSC options, some overloads being the same for all three options, some slightly impacted by a few percent when comparing the AC and HVdc options. However, the overloads of interest to this study are those that are significantly impacted by the HVdc options when compared to the AC option. Table 9.4 summarizes the overloads impacted by the HVdc options when compared to the AC option. Appendix B-2 contains the full listing of contingency analysis results. Table 9.4. Overload Impacts.
Worst Overloads (%)
LINE NAME Rating MVA CONTINGENCY AC LCC VSC Scenario
380 KV
5464 WOODLAND 380.00* 2 3WNDTR WOODLAND WND 1 550 Double circuit
Louth-Tandragee <100 123.3 124 2.3
5464*WOODLAND 380.00 3WNDTR WOODLAND WND 1 1 500 Woodland 3-wdg
transformer <100 <100 101 2.2 275 KV
35231*LOUTH 275.00 90020 TANDRAGE 275.00 1 710 400 kV Turleenan-
Cavan 100 n/a n/a 2.3
35231*LOUTH 275.00 90020 TANDRAGE 275.00 1 710 275 kV Louth-
Tandragee <100 117.4 115.6 2.3
35232*LOUTH 275.00 90020 TANDRAGE 275.00 2 710 400 kV Turleenan-
Cavan 100.1 n/a n/a 2.3
35232*LOUTH 275.00 90020 TANDRAGE 275.00 2 710 275 kV Louth-
Tandragee <100 117.2 115.3 2.3
90020*TANDRAGE 275.00 90120 TURL 275.00 1 710 275 kV Tandragee-
Turleenan 100.4 103.9 103.4 2.3
90020*TANDRAGE 275.00 90120 TURL 275.00 2 710 275 kV Tandragee-
Turleenan 100.4 103.9 103.4 2.3 220 KV
5462 WOODLAND 220.00 2 54622 WOODLAND 220.00* 593 Double circuit
Louth-Tandragee <100 108.2 107.6 2.3
3522*LOUTH 220.00 3WNDTR LOUTH_AT WND 1 1 300 400 kV Turleenan-
Cavan 101.6 n/a n/a 2.1
3522*LOUTH 220.00 3WNDTR LOUTH_AT WND 1 1 300 Louth 3-wdg transformer <100 110.4 110 2.1
3522*LOUTH 220.00 3WNDTR LOUTH_AT WND 1 1 300 400 kV Turleenan-
Cavan 109.1 n/a n/a 2.3
3522*LOUTH 220.00 3WNDTR LOUTH_AT WND 1 1 300 Louth 3-wdg transformer 107.1 128.4 128.1 2.3
3522*LOUTH 220.00 3WNDTR LOUTH_AT WND 1 2 600 400 kV Turleenan-
Cavan 101.2 n/a n/a 2.1
3522*LOUTH 220.00 3WNDTR LOUTH_AT WND 1 2 600 275 kV Louth-
Tandragee <100 109.6 109.3 2.1
3522*LOUTH 220.00 3WNDTR LOUTH_AT WND 1 2 600 275 kV Louth-
Tandragee 106.4 127.3 127 2.3
3522*LOUTH 220.00 3WNDTR LOUTH_AT WND 1 2 600 400 kV Turleenan-
Cavan 108.7 n/a n/a 2.3
3522*LOUTH 220.00 3WNDTR LOUTH_AT WND 1 3 300 400 kV Turleenan-
Cavan 100.6 n/a n/a 2.1
3522*LOUTH 220.00 3WNDTR LOUTH_AT WND 1 3 300 Louth 3-wdg transformer <100 109.3 108.9 2.1
3522*LOUTH 220.00 3WNDTR LOUTH_AT WND 1 3 300 400 kV Turleenan-
Cavan 108 n/a n/a 2.3
3522*LOUTH 220.00 3WNDTR LOUTH_AT WND 1 3 300 Louth 3-wdg transformer 106.1 127.2 126.8 2.3
5462*WOODLAND 220.00 54622 WOODLAND 220.00 1 593 Woodland-Maynooth <100 103.2 102.4 2.3
In terms of power flow there is not much difference between the LCC and VSC option, both show very similar overload impacts compared to the AC option. The impacted overloads shown in Table 9.4 were
PDF created with pdfFactory Pro trial version www.pdffactory.com

EirGrid plc Investigating the Impact of HVdc Schemes in the Irish Transmission Network
Final Report
R1116.03.04, Page 84 Oct-18, 2009
© TransGrid Solutions Inc, 2009
observed in power flow cases 2.1 (summer minimum, 1360 MW NI-RoI) and 2.3 (winter peak, 1500 MW NI-RoI), both cases when Northern Ireland is transferring approximately 1500 MW to the Republic of Ireland. Power flow cases 2.2 (summer peak, 1500 MW RoI-NI) and 2.4 (winter peak, 650 MW RoI-NI) when Republic of Ireland is transferring power to Northern Ireland showed no significant impacts. The Woodland 380-220kV three-winding transformers become overloaded for the double circuit outage of the Louth-Tandragee 275 kV lines. The scenario listed in Table 9.4 assumes 100% of the pre-contingency power flow on the double-circuit 275 kV lines is transferred to the HVdc line (LCC or VSC) post-contingency. The AC option inherently transfers approximately 70-80% of the double circuit AC lines and therefore results in no overload on the Woodland transformer. In the power flow analysis, 100% of pre-contingency Louth-Tandragee power was assumed to be transferred to the HVdc options for this particular contingency. This results in higher power flow in the Woodland area, which results in the 124% overload. Transient stability analysis as discussed in Section 9.6.6 revealed that no significant benefit is actually gained by transferring more than 70-80% of the Louth-Tandragee power, similar to what the AC option inherently transfers. Therefore this overload is likely not a concern at the lower power transfer levels. The Louth-Tandragee 275 kV line becomes overloaded to approximately 117% in power flow case 2.3 (winter peak, 1500 MW NI-RoI) for both HVdc cases following the loss of the parallel Louth-Tandragee 275 kV line. The AC option shows a worst case overload of 100.1% for loss of the mid Cavan-Turleenan 380 kV line. The Tandragee-Turleenan 275 kV lines are also impacted by the HVdc options. The lines become overloaded to near 104% for loss of the parallel line. The AC option for the same contingency results in an overload of 100.4%. The Louth 275-220 kV 300 MVA three-winding transformers become overloaded for loss of the parallel Louth 275-220 kV 600 MVA three-winding transformer, up to 110% in power flow case 2.1 (summer minimum, 1360 MW NI-RoI) and up to 127% in power flow case 2.3 (winter peak, 1500 MW NI-RoI) for the HVdc options. The AC option shows worst case overloads of 102 % in power flow case 2.1 (summer minimum, 1360 MW NI-RoI) and 109% in power flow case 2.3 (winter peak, 1500 MW NI-RoI) for loss of the 400 kV circuit between Turleenan and mid Cavan. The Louth 275-220 kV 600 MVA three-wind transformer becomes overloaded for loss of the 275 kV Louth-Tandragee line, up to 109% for power flow case 2.1 (summer minimum, 1360 MW NI-RoI) and up to 127% for power flow case 2.3 (winter peak, 1500 MW NI-RoI) for the HVdc options. The AC option shows worst case overloads of 101 % in power flow case 2.1 (summer minimum, 1360 MW NI-RoI) and 109% in power flow case 2.3 (winter peak, 1500 MW NI-RoI) due to loss of the 400 kV circuit between Turleenan and mid Cavan. The HVdc options are causing or worsening some of the overloads in comparison to the AC option because the HVdc link remains at the same power flow post-contingency as it was at pre-contingency unless it is told to do otherwise, whereas the AC line power flow is automatically re-adjusted based on the post-contingency network topology. The listed overloads could be mitigated by re-dispatching the HVdc to a similar level as the post-contingency AC line option power flow in order to not impact the AC overloads, or perhaps to an even better level so as to eliminate the overloads. This would require more detailed investigation though to ensure that no new overloads would be created by re-dispatching the HVdc to a level other than the post-contingency AC line option.
9.4.2. Voltage Violation Impacts
There were many slight voltage violations observed throughout the AC and HVdc options, many of which were the same for the AC and HVdc options. However, as with the overloads, the voltage violations of interest to this study are only those that are significantly impacted by the HVdc options when compared to the AC option. Table 9.5a summarizes only the worst case voltage violations impacted by the HVdc options when compared to the AC option. Appendix B-3 contains the full listing of contingency analysis results.
PDF created with pdfFactory Pro trial version www.pdffactory.com
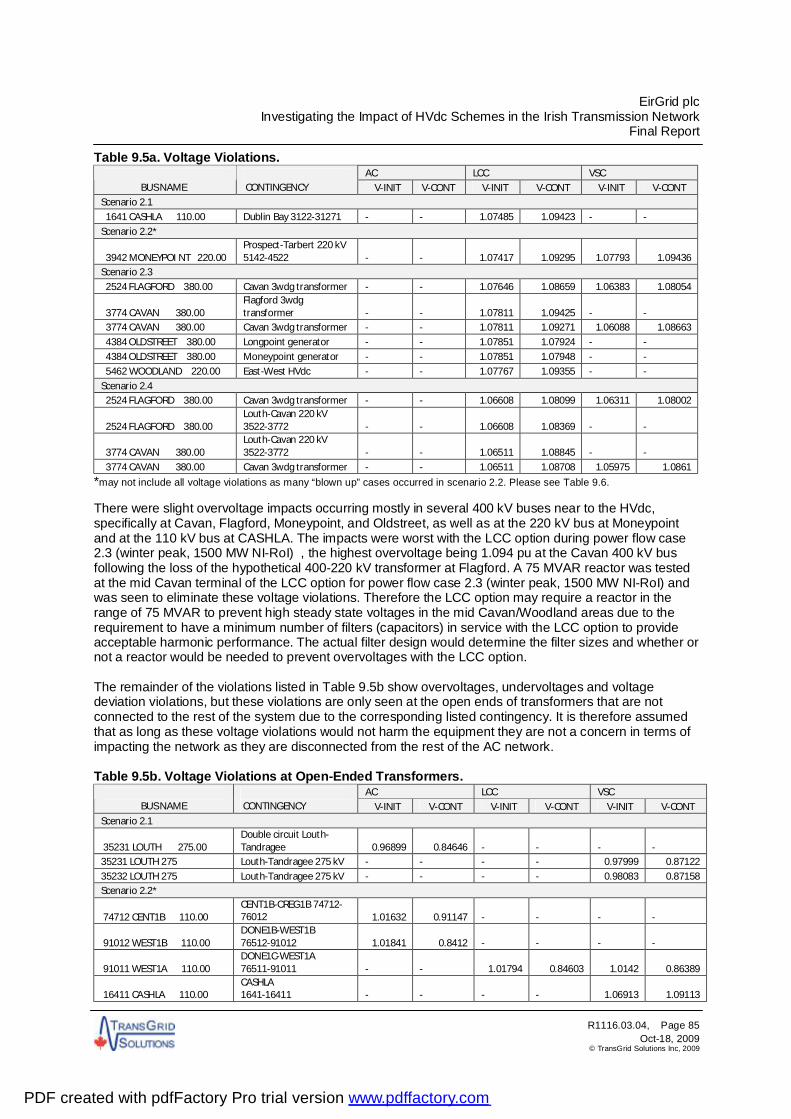
EirGrid plc Investigating the Impact of HVdc Schemes in the Irish Transmission Network
Final Report
R1116.03.04, Page 85 Oct-18, 2009
© TransGrid Solutions Inc, 2009
Table 9.5a. Voltage Violations. AC LCC VSC
BUS NAME CONTINGENCY V-INIT V-CONT V-INIT V-CONT V-INIT V-CONT
Scenario 2.1
1641 CASHLA 110.00 Dublin Bay 3122-31271 - - 1.07485 1.09423 - -
Scenario 2.2*
3942 MONEYPOI NT 220.00 Prospect-Tarbert 220 kV 5142-4522 - - 1.07417 1.09295 1.07793 1.09436
Scenario 2.3
2524 FLAGFORD 380.00 Cavan 3wdg transformer - - 1.07646 1.08659 1.06383 1.08054
3774 CAVAN 380.00 Flagford 3wdg transformer - - 1.07811 1.09425 - -
3774 CAVAN 380.00 Cavan 3wdg transformer - - 1.07811 1.09271 1.06088 1.08663
4384 OLDSTREET 380.00 Longpoint generator - - 1.07851 1.07924 - -
4384 OLDSTREET 380.00 Moneypoint generator - - 1.07851 1.07948 - -
5462 WOODLAND 220.00 East-West HVdc - - 1.07767 1.09355 - -
Scenario 2.4 2524 FLAGFORD 380.00 Cavan 3wdg transformer - - 1.06608 1.08099 1.06311 1.08002
2524 FLAGFORD 380.00 Louth-Cavan 220 kV 3522-3772 - - 1.06608 1.08369 - -
3774 CAVAN 380.00 Louth-Cavan 220 kV 3522-3772 - - 1.06511 1.08845 - -
3774 CAVAN 380.00 Cavan 3wdg transformer - - 1.06511 1.08708 1.05975 1.0861
*may not include all voltage violations as many “blown up” cases occurred in scenario 2.2. Please see Table 9.6. There were slight overvoltage impacts occurring mostly in several 400 kV buses near to the HVdc, specifically at Cavan, Flagford, Moneypoint, and Oldstreet, as well as at the 220 kV bus at Moneypoint and at the 110 kV bus at CASHLA. The impacts were worst with the LCC option during power flow case 2.3 (winter peak, 1500 MW NI-RoI) , the highest overvoltage being 1.094 pu at the Cavan 400 kV bus following the loss of the hypothetical 400-220 kV transformer at Flagford. A 75 MVAR reactor was tested at the mid Cavan terminal of the LCC option for power flow case 2.3 (winter peak, 1500 MW NI-RoI) and was seen to eliminate these voltage violations. Therefore the LCC option may require a reactor in the range of 75 MVAR to prevent high steady state voltages in the mid Cavan/Woodland areas due to the requirement to have a minimum number of filters (capacitors) in service with the LCC option to provide acceptable harmonic performance. The actual filter design would determine the filter sizes and whether or not a reactor would be needed to prevent overvoltages with the LCC option. The remainder of the violations listed in Table 9.5b show overvoltages, undervoltages and voltage deviation violations, but these violations are only seen at the open ends of transformers that are not connected to the rest of the system due to the corresponding listed contingency. It is therefore assumed that as long as these voltage violations would not harm the equipment they are not a concern in terms of impacting the network as they are disconnected from the rest of the AC network. Table 9.5b. Voltage Violations at Open-Ended Transformers.
AC LCC VSC BUS NAME
CONTINGENCY V-INIT V-CONT V-INIT V-CONT V-INIT V-CONT
Scenario 2.1
35231 LOUTH 275.00 Double circuit Louth-Tandragee 0.96899 0.84646 - - - -
35231 LOUTH 275 Louth-Tandragee 275 kV - - - - 0.97999 0.87122
35232 LOUTH 275 Louth-Tandragee 275 kV - - - - 0.98083 0.87158 Scenario 2.2*
74712 CENT1B 110.00 CENT1B-CREG1B 74712-76012 1.01632 0.91147 - - - -
91012 WEST1B 110.00 DONE1B-WEST1B 76512-91012 1.01841 0.8412 - - - -
91011 WEST1A 110.00 DONE1C-WEST1A 76511-91011 - - 1.01794 0.84603 1.0142 0.86389
16411 CASHLA 110.00 CASHLA 1641-16411 - - - - 1.06913 1.09113
PDF created with pdfFactory Pro trial version www.pdffactory.com

EirGrid plc Investigating the Impact of HVdc Schemes in the Irish Transmission Network
Final Report
R1116.03.04, Page 86 Oct-18, 2009
© TransGrid Solutions Inc, 2009
AC LCC VSC BUS NAME
CONTINGENCY V-INIT V-CONT V-INIT V-CONT V-INIT V-CONT
1124 ARKLOW 380.00 ARKLOW 3wdg transformer - - - - 1.04574 1.08093
Scenario 2.3
74711 CENT1A 110.00 CENT1A-CREG1A 74711-76011 - - - - 1.01733 0.89891
74712 CENT1B 110.00 CENT1B-CREG1B 74712-76012 - - - - 1.01733 0.89891
2524 FLAGFORD 380.00 Flagford 3wdg transformer - - 1.07646 1.10041 - -
Scenario 2.4 35232 LOUTH 275.00 Louth-Tandragee 275 kV 1.02457 0.90391 - - - -
35231 LOUTH 275.00 Double circuit Louth-Tandragee - - 1.02033 0.91395 1.01826 1.14255
35232 LOUTH 275.00 Double circuit Louth-Tandragee - - 1.02004 0.91395 1.01796 1.23708
2524 FLAGFORD 380.00 S580 - - 1.06608 1.08268 - -
74711 CENT1A 110.00 CENT11-CREG11 74711-76011 - - - - 1.02264 0.91972
74712 CENT1B 110.00 CENT1B-CREG1B 74712-76012 - - - - 1.02264 0.91972
91012 WEST1B 110.00 DONE1B-WEST1B 76512-91012 - - - - 1.00608 0.83841
*may not include all voltage violations as many “blown up” cases occurred in scenario 2.2. Please see Table 9.6. **Please note that a “-“ in the table indicates that the voltage is within the limits defined in the study criteria in Section 6. One thing to note about the contingency analysis is that power flow case 2.2 (summer peak, 1500 MW RoI-NI) in particular had many diverged powerflow cases especially in the AC option loadflow as shown in Table 9.6. The LCC option had fewer diverged cases than the AC option, and the VSC had by far the fewest of all. After investigation into the particular contingencies that had difficulty converging, it is thought that power flow case 2.2 may have a lack of reactive power support and hence many “blown up” solutions in the contingency analysis. “Blown up” refers to diverged power flow solutions. For this reason it is difficult to assess exactly what is happening in the blown up solutions and whether or not real voltage violations/collapse exist, or whether it is simply a solution convergence problem. Because this problem is occurring mainly in the AC option of power flow case 2.2, mitigation options were not specifically investigated because it is a base case issue. However it should be noted that the HVdc options, particularly the VSC option show improvement in solution convergence, possibly because the VSC option provides AC voltage control with a significant range of reactive power support. Several of these contingencies were tested in dynamics and were found to be stable. Table 9.6. Diverged Power Flow Cases.
CONTINGENCY AC Option LCC Option VSC Option Scenario 2.1 none Scenario 2.2 DUBLINBP Blown up Blown up - IKERRIN_T Blown up Blown up Blown up AGHADA-CAHIR 380 Blown up - - DUNSTOWN-LAOIS 380 Blown up Blown up - FLAGFORD-CAVAN 380 Blown up Blown up - LAOIS-WMD_400 380 Blown up Blown up - CAVAN-WOODLAND 380 Blown up - - MONEYPOINT-OLDSTREET 380 Blown up Blown up - MONEYPOINT-WMD_400 380 Blown up Blown up - WOODLAND-OLDSTREET 380 Blown up Blown up - BALLYCRONAN 275 Iteration limit exceeded Blown up - CASHLA-FLAGFORD 220 Iteration limit exceeded - - CASHLA-PROSPECT 220 Iteration limit exceeded - -
PDF created with pdfFactory Pro trial version www.pdffactory.com

EirGrid plc Investigating the Impact of HVdc Schemes in the Irish Transmission Network
Final Report
R1116.03.04, Page 87 Oct-18, 2009
© TransGrid Solutions Inc, 2009
CONTINGENCY AC Option LCC Option VSC Option CARRICKM-CHARLESLAND 220 Blown up Blown up - DUNSTOWN-TURLOUGH 220 Blown up - - CAVAN-FLAGFORD 220 Blown up - - FLAGFORD-SRANANAGH 220 Blown up - - FINNSTOW-MAYNOOTH 220 Blown up - - INCHICOR-POOLBEG 220 Blown up - - MAYNOOTH-KINNEGAD 220 Blown up - - PROSPECT-TARBERT 220 Iteration limit exceeded - - SHANNONB-WMD 220 Blown up - - CAHIR-KILL HILL 110 Blown up Blown up Blown up KILL HILL-THURLES 110 Blown up Blown up Blown up CUNGHILL-OUNAGH 110 Iteration limit exceeded - - CUNGHILL-SLIGO 110 Iteration limit exceeded - - LANESBOR-MULLINGA 110 Blown up - - LOUTH-RATRUSSA 110 Iteration limit exceeded - - LOUTH CAP 110 Iteration limit exceeded - - NAVAN CAP 110 Iteration limit exceeded - - RATHKEAL-TARBERT 110 Iteration limit exceeded - - THORNSBE-MOUNT LUCAS 110 Iteration limit exceeded Blown up - FLAGFORD 3WDG TRANSFORMER Blown up - - TURLEENAN-MID CAVAN 380 Blown up - - CHARLESLAND 3WDG TRANSFORMER Blown up Blown up - CHARLESLAND 3WDG TRANSFORMER Blown up Blown up - FINGLAS 3WGD TRANSFORMER Iteration limit exceeded - - FINGLAS 3WGD TRANSFORMER Blown up - - IRISHTOWN-DUBLIN BAY 220 Blown up Blown up - ATHLONE TRANSFORMER 110 Iteration limit exceeded - - ATHLONE TRANSFORMER 110 Iteration limit exceeded - - SALTHILL TRANSFORMER 110 Iteration limit exceeded - - TULLABRA TRANSFORMER 110 Iteration limit exceeded - - MAGH_TAMN Iteration limit exceeded - - LOUTH-CAVAN 220 - Iteration limit exceeded - Scenario 2.3 LOUTH-RATRUSSA 110 - - Iteration limit exceeded Scenario 2.4 BELLACORICK-CASTLEBE 110 Iteration limit exceeded Iteration limit exceeded -
(*) Note that a “-“ in the table indicates a converged power flow solution for the particular contingency.
9.5. Short Circuit Analysis
In comparison to the AC option, both HVdc options reduce short circuit levels particularly in the areas near to the HVdc link. This is because the LCC HVdc link does not contribute any short circuit current. The VSC can contribute a relatively small amount of short circuit current. According to the VSC model manuals [3], it is recommended to turn off the VSCs in the power flow prior to performing the short circuit analysis, and this was done for the analysis. However, the VSC option can contribute up to 1.0 pu rated current, with this current contribution decreasing as bus voltages decrease. An alternative method suggested in the VSC manual is to assume a 0.5 pu current contribution at nearby buses [3]. Therefore, the VSC fault contribution of 0.5 pu current (1.65 kA at Turleenan, 1.05 kA at mid Cavan and 1.2 kA at Woodland)5 was manually added to each of the VSC terminal buses. The short circuit levels were found to be very similar to or slightly lower than the AC option short circuit levels at the terminal buses. The AC line option does contribute to short circuit current. As a result, the HVdc cases generally have lower short circuit levels than the AC option especially in the area near the HVdc terminals. 5 Calculated as 0.5∙(MVA rating) / (√3∙V). E.g. at Woodland 380 kV bus: (0.5∙1592 MVA)/( √3∙380)=1.2 kA.
PDF created with pdfFactory Pro trial version www.pdffactory.com
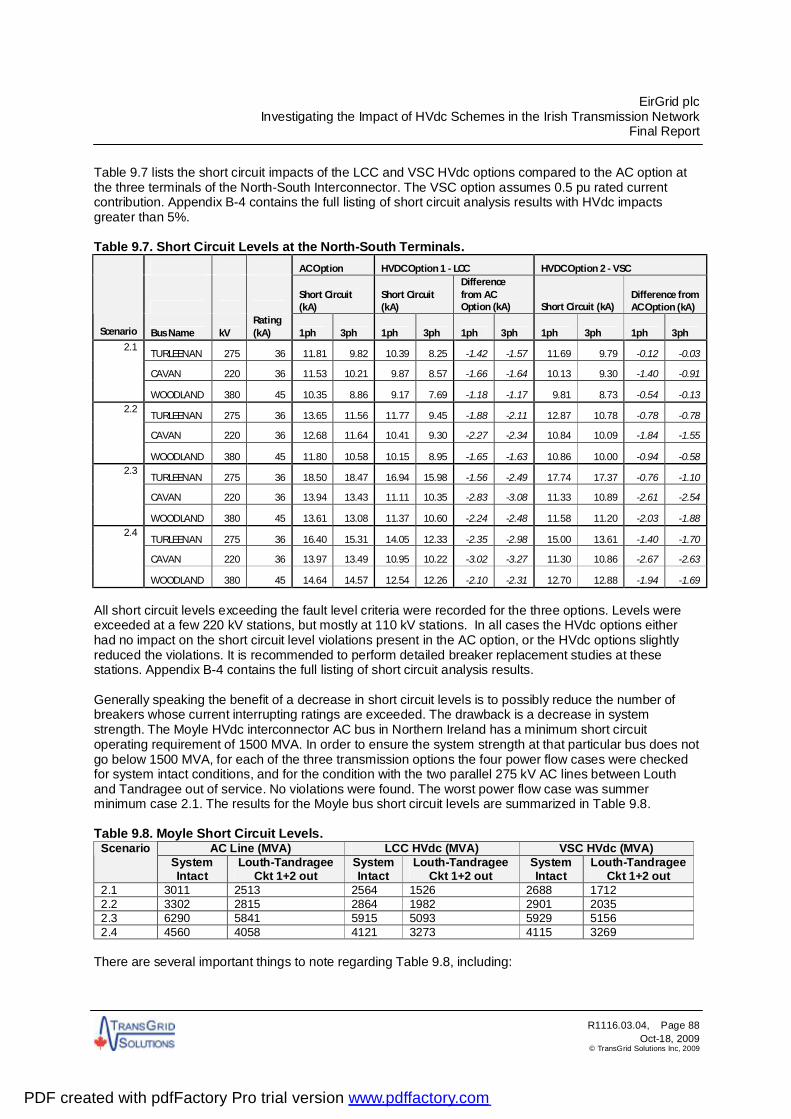
EirGrid plc Investigating the Impact of HVdc Schemes in the Irish Transmission Network
Final Report
R1116.03.04, Page 88 Oct-18, 2009
© TransGrid Solutions Inc, 2009
Table 9.7 lists the short circuit impacts of the LCC and VSC HVdc options compared to the AC option at the three terminals of the North-South Interconnector. The VSC option assumes 0.5 pu rated current contribution. Appendix B-4 contains the full listing of short circuit analysis results with HVdc impacts greater than 5%. Table 9.7. Short Circuit Levels at the North-South Terminals.
AC Option HVDC Option 1 - LCC HVDC Option 2 - VSC
Short Circuit (kA)
Short Circuit (kA)
Difference from AC Option (kA) Short Circuit (kA)
Difference from AC Option (kA)
Scenario Bus Name kV Rating (kA) 1ph 3ph 1ph 3ph 1ph 3ph 1ph 3ph 1ph 3ph
TURLEENAN 275 36 11.81 9.82 10.39 8.25 -1.42 -1.57 11.69 9.79 -0.12 -0.03
CAVAN 220 36 11.53 10.21 9.87 8.57 -1.66 -1.64 10.13 9.30 -1.40 -0.91
2.1
WOODLAND 380 45 10.35 8.86 9.17 7.69 -1.18 -1.17 9.81 8.73 -0.54 -0.13
TURLEENAN 275 36 13.65 11.56 11.77 9.45 -1.88 -2.11 12.87 10.78 -0.78 -0.78
CAVAN 220 36 12.68 11.64 10.41 9.30 -2.27 -2.34 10.84 10.09 -1.84 -1.55
2.2
WOODLAND 380 45 11.80 10.58 10.15 8.95 -1.65 -1.63 10.86 10.00 -0.94 -0.58
TURLEENAN 275 36 18.50 18.47 16.94 15.98 -1.56 -2.49 17.74 17.37 -0.76 -1.10
CAVAN 220 36 13.94 13.43 11.11 10.35 -2.83 -3.08 11.33 10.89 -2.61 -2.54
2.3
WOODLAND 380 45 13.61 13.08 11.37 10.60 -2.24 -2.48 11.58 11.20 -2.03 -1.88
TURLEENAN 275 36 16.40 15.31 14.05 12.33 -2.35 -2.98 15.00 13.61 -1.40 -1.70
CAVAN 220 36 13.97 13.49 10.95 10.22 -3.02 -3.27 11.30 10.86 -2.67 -2.63
2.4
WOODLAND 380 45 14.64 14.57 12.54 12.26 -2.10 -2.31 12.70 12.88 -1.94 -1.69
All short circuit levels exceeding the fault level criteria were recorded for the three options. Levels were exceeded at a few 220 kV stations, but mostly at 110 kV stations. In all cases the HVdc options either had no impact on the short circuit level violations present in the AC option, or the HVdc options slightly reduced the violations. It is recommended to perform detailed breaker replacement studies at these stations. Appendix B-4 contains the full listing of short circuit analysis results. Generally speaking the benefit of a decrease in short circuit levels is to possibly reduce the number of breakers whose current interrupting ratings are exceeded. The drawback is a decrease in system strength. The Moyle HVdc interconnector AC bus in Northern Ireland has a minimum short circuit operating requirement of 1500 MVA. In order to ensure the system strength at that particular bus does not go below 1500 MVA, for each of the three transmission options the four power flow cases were checked for system intact conditions, and for the condition with the two parallel 275 kV AC lines between Louth and Tandragee out of service. No violations were found. The worst power flow case was summer minimum case 2.1. The results for the Moyle bus short circuit levels are summarized in Table 9.8. Table 9.8. Moyle Short Circuit Levels.
AC Line (MVA) LCC HVdc (MVA) VSC HVdc (MVA) Scenario System Intact
Louth-Tandragee Ckt 1+2 out
System Intact
Louth-Tandragee Ckt 1+2 out
System Intact
Louth-Tandragee Ckt 1+2 out
2.1 3011 2513 2564 1526 2688 1712 2.2 3302 2815 2864 1982 2901 2035 2.3 6290 5841 5915 5093 5929 5156 2.4 4560 4058 4121 3273 4115 3269
There are several important things to note regarding Table 9.8, including:
PDF created with pdfFactory Pro trial version www.pdffactory.com

EirGrid plc Investigating the Impact of HVdc Schemes in the Irish Transmission Network
Final Report
R1116.03.04, Page 89 Oct-18, 2009
© TransGrid Solutions Inc, 2009
• The HVdc options have a negative impact on the short circuit level at Moyle and reduce it by approximately 400 MVA during system intact conditions and by 800 MVA during the N-2 condition.
• Although no violations of the minimum 1500 MVA were found at Moyle, power flow case 2.1 (summer minimum) which models high wind and low conventional generation in Northern Ireland, is coming very close to violating this level for the HVdc options. It should be noted here that power flow case 2.1 had the generator at Ballylumford in service. Coolkeeragh generation was out of service. Since the Ballylumford generation is right next to the Moyle converter bus the short circuit results at Moyle would be even more onerous (lower) if Ballylumford generator were redispatched to Coolkeeragh.
• It is interesting to note the difference in short circuit levels between the high wind and low wind power flow cases. Power flow cases 2.1 (summer minimum) and 2.2 (summer peak) represent high wind conditions which results in lower short circuit levels, whereas power flow cases 2.3 and 2.4 (both winter peak) represent low wind conditions which results in higher short circuit levels. Again it is important to note how the impedance of the wind generators are modeled as discussed in Section 6.1.3; for purposes of fault analysis performed in this study the reactance of the wind generators were set to 1.0 pu. Wind generators typically provide much lower short circuit current than conventional generators.
Another general drawback to note with decreased short circuit levels is that if the system short circuit levels were decreased significantly enough, the minimum fault current coordination and detection for the protection systems could be impacted. This would require further detailed study. If reduced short circuit levels would require mitigation in order to be increased to desired levels, synchronous condensers could be added to the system. Synchronous condensers have been installed with various LCC HVdc systems in instances where the local area short circuit strength is not sufficient. The number and rating of synchronous condensers needed, along with the best location at which to install them, would require further study.
9.6. Transient Stability Analysis
The results of the transient stability simulations were analyzed and the three options were compared in terms of the following criteria, which were described in more detail in Section 6:
• Transient overvoltages/undervoltages • Frequency deviations and df/dt • System damping • Generator tripping
The double circuit loss of the 275 kV Louth-Tandragee AC lines is a special case which is discussed separately in more detail in order to compare the performance of the three transmission options. In addition to the analysis of the AC system faults and criteria, specific faults associated only with the HVdc systems, namely pole blocking and dc line faults, as well as the line-commutated issue of commutation failure, were also analysed to ensure acceptable system performance. Comparison of the LCC and VSC performance is also noted. Appendix B1 contains the plots of the transient stability analysis results.
9.6.1. Overvoltages and Undervoltages
AC system voltages were observed during the post fault period at buses rated 110 kV and above. Out of the three transmission technologies, in most situations the VSC option showed superior voltage performances following a disturbance while the LCC option showed the worst voltage performances at buses close to the proposed transmission system. The AC option showed moderate voltage
PDF created with pdfFactory Pro trial version www.pdffactory.com

EirGrid plc Investigating the Impact of HVdc Schemes in the Irish Transmission Network
Final Report
R1116.03.04, Page 90 Oct-18, 2009
© TransGrid Solutions Inc, 2009
performances. The VSC option is inherently equipped with a large capacitive and inductive range of voltage control so it is not surprising that it shows better performance. The VSC and AC options did not violate the transient voltage criteria. The LCC option had two occasions where the overvoltage limit of 1.3 pu was violated for approximately 10 ms to 15 ms at a number of buses in the Ballycronan area, the highest violation was observed at the Ballycronan 275 kV bus. The Ballycronan 275 kV bus is the Moyle HVdc converter bus in Northern Ireland. Overvoltages are likely worst at this bus due to the AC filters associated with the Moyle HVdc converter station. Both of these overvoltage violations occurred just after clearing three phase faults at mid Cavan (2_3_B) and Gorman (10_3_X) 220 kV buses for power flow case 2.1 (summer minimum). Figures 9.4 and 9.5 show the voltage at the Ballycronan 275 kV bus during the faults at Cavan 220 kV bus and Gorman 220 kV bus respectively.
Ballycro 275 kV bus voltage for 3 phase fault at Cavan 220 kV bus
Time (s) 0.00 0.10 0.20 0.30 0.40 0.50 0.60 0.70 0.80 0.90 1.00 ... ... ...
0.00
0.10
0.20
0.30
0.40
0.50
0.60
0.70
0.80
0.90
1.00
1.10
1.20
1.30
1.40
V(pu
)
VOLT 86221 [BALLYCRO 275.00]
Figure 9.4. Ballycronan 275 kV bus voltage during the Cavan 220 kV bus fault.
PDF created with pdfFactory Pro trial version www.pdffactory.com

EirGrid plc Investigating the Impact of HVdc Schemes in the Irish Transmission Network
Final Report
R1116.03.04, Page 91 Oct-18, 2009
© TransGrid Solutions Inc, 2009
Ballycro 275 kV bus voltage for 3 phase fault at Gorman 220 kV bus
Time (s) 0.00 0.10 0.20 0.30 0.40 0.50 0.60 0.70 0.80 0.90 1.00 ... ... ...
0.00
0.10
0.20
0.30
0.40
0.50
0.60
0.70
0.80
0.90
1.00
1.10
1.20
1.30
1.40
V(pu
)
VOLT 86221 [BALLYCRO 275.00]
Moyle HVDC Power
Time (s) 0.00 0.10 0.20 0.30 0.40 0.50 0.60 0.70 0.80 0.90 1.00 ... ... ...
0.00
0.50
1.00
1.50
2.00
2.50
3.00
3.50
4.00
pu (o
n 10
0 M
VA b
ase)
PG_86222
Figure 9.5. Ballycronan 275 kV bus voltage during the Gorman 220 kV bus fault (top) and Moyle Interconnector HVDC Power (bottom), In each occasion, the Moyle converter and North-South LCC converter suffered commutation failures during the fault. Consequently, the voltage of the 275 kV network in the vicinity of the Ballycronan area exceeded the overvoltage limit of 1.3 pu, up to a maximum of approximately 1.4 pu. Table 9.9 tabulates the buses which experienced overvoltage violations. Bus numbers marked with bold text were observed to have overvoltage violations for both Cavan and Gorman three phase faults and the rest of buses have overvoltage violations only for the Gorman three phase fault. All of these buses belong to the 275 kV network. Table 9.9. Buses exceeding transient voltage of 1.3 pu.
Bus Number Name 70520 Ballylumford 73521 Caco2A 73522 Caco2B 74520 Castlereagh 75520 Coolkeeragh 81020 Hannahstown 81520 Kells 82020 Kilroot 85020 Magherafelt
PDF created with pdfFactory Pro trial version www.pdffactory.com

EirGrid plc Investigating the Impact of HVdc Schemes in the Irish Transmission Network
Final Report
R1116.03.04, Page 92 Oct-18, 2009
© TransGrid Solutions Inc, 2009
Bus Number Name 86220 Ballycronan 86221 Ballycronan 86231 Moyle 89520 Strabane 90020 Tandragee
9.6.2. Wind Generator Tripping
Fault case 11_3_X applies a 150 ms three-phase fault at the 110 kV Louth bus. The Louth bus is located near the Dundalk 110 kV bus, to which two wind generators (at PSSE buses 153 and 203) are connected. The undervoltage ride-through settings of these wind generators are set to 0.15 pu voltage for 140 ms. Therefore these two wind generators trip in all AC and HVdc options for all four power flow cases because the voltage at the generator buses drops below 0.15 pu for 150 ms which invokes the wind farm undervoltage relays to trip the generators. Table 9.10 lists the wind generators and wind power levels that are tripped during this fault. Table 9.10. Wind Generators Tripped by Undervoltage Relays
Gen. Power (MW) Bus Name Gen. ID 2.1 2.2 2.3 2.4 153 Dundalk DX 3.0 12.0 3.6 3.6 203 Dundalk DV 1.6 6.4 1.9 1.9
9.6.3. Power Oscillation Damping
In general, plots of power oscillations inspected for various contingencies and powerflow study cases revealed that all three transmission options result in a satisfactory level of damping for power oscillations. Inspection of power oscillations also indicate that there is no clear evidence to substantiate which option has better system damping. Small signal stability analysis based on eigenvalues would be recommended for future studies to better quantify the system damping performance.
9.6.4. Frequency Performance
In transient stability programs such as PSS/E, the transmission system frequency is obtained from the derivative of the bus voltage angle. If there is a sharp change in the bus angle, the frequency might change infinitely. Therefore, there are filters associated with the frequency measurements. However sometimes these filters are not enough to completely rid the frequency calculations of these spikes, particularly if a fault has been applied in the area near to the frequency calculation. For this reason, generator speed quantities were mostly used to analyse frequency deviations as generator speeds are state variables which cannot change instantaneously and therefore should not give erroneous results. For the four power flows cases that were studied, the three transmission options did not show any transient underfrequency or overfrequency violations for any of the contingencies that were studied that did not involve generator tripping. All transient frequency deviations were within criteria. Of particular interest however are three of the dynamic contingencies (7_X_X, 7C_X_X, 12_X_X) that simulate the loss of generation, two of which study loss of the largest generator in Northern Ireland, one which considers loss of wind generators, the other does not. Contingency 12_X_X studies loss of generation at Dublin Bay in the Republic of Ireland. Table 9.12 shows the amount of generation tripped for each of the four power flow cases for the three contingencies.
PDF created with pdfFactory Pro trial version www.pdffactory.com

EirGrid plc Investigating the Impact of HVdc Schemes in the Irish Transmission Network
Final Report
R1116.03.04, Page 93 Oct-18, 2009
© TransGrid Solutions Inc, 2009
Table 9.12. Loss of Largest Generator in the Northern area of Ireland and at Dublin Bay. 7_X_X (including wind) 7C_X_X (excluding
wind) 12_X_X Power
Flow Generator Bus MW
Tripped Generator
Bus MW
Tripped Generator Bus MW
Tripped 2.1 Omagh 262 “TY” 448.8 70516 “10” 100.0 Dublin Bay 31271 “1” 163.0 2.2 Bellacrorick 136 “TX” 310.2 70516 “10” 97.0 Dublin Bay 31271 “1” 200.0 2.3 Omagh 262 “TY” 448.8 82002 “2” 227.0 Dublin Bay 31271 “1” 395.0 2.4 Coolkeeragh 75515 “GT” 260.0 75515 “GT” 260.0 Dublin Bay 31271 “1” 409.0
The cases studying loss of generation observed that the system is transiently stable but settles out to a frequency less than 50 Hz. Table 9.13 tabulates the frequency to which the system settles for each of the AC and HVdc options for each of these contingencies after 20 seconds of simulation. The underfrequencies are within the transient criteria, but in some cases are slightly below the continuous frequency criteria of 49.5 Hz. It is expected that AGC or manual frequency control would operate to bring these frequencies back to acceptable levels. It should also be noted that the 75 MW Moyle reserve which operates at 49.6 Hz was not modelled, and neither was the 45 MW of industrial load shed at 49.3 Hz. Table 9.13. Frequency Deviations after 20 seconds.
System Underfrequency (Hz) Power Flow 7_X_X 7C_X_X 12_X_X
2.1 49.26 49.45 49.40 2.2 48.60* None None 2.3 49.20 49.40 49.35 2.4 49.65 49.65 49.53
The AC and HVdc options all settle out to the same system frequencies which makes sense because the same amount of generation is lost in each case, therefore there is little to compare for these cases. Following each contingency, the frequency of the entire system gradually decreases. This causes the pump load at Bus 52074 (TURLG4) to trip due to underfrequency in power flow cases 2.1 and 2.2 for all three transmission options within 10 seconds of simulation. This frequency decay is illustrated in Figure 9.6 for selected generator speeds for one of the worst case contingencies 7_X_X during power flow 2.3 for the three transmission options (at 20 seconds). In this case 448 MW of wind generation in Northern Ireland is lost. It can be seen that the AC and HVdc options respond in a similar manner. Because there is no excess generation to bring from one area of the island to another and because the entire system frequency has decayed, the HVdc options would not be useful here to improve the system frequency.
PDF created with pdfFactory Pro trial version www.pdffactory.com

EirGrid plc Investigating the Impact of HVdc Schemes in the Irish Transmission Network
Final Report
R1116.03.04, Page 94 Oct-18, 2009
© TransGrid Solutions Inc, 2009
Figure 9.6: Frequency decay of the system when largest generator in Northern Ireland is tripped. The response of higher-speed control (such as machine governors) to short term frequency excursions is modeled in PSSE. Short-term system frequency criteria must be met by the calculated PSS/E frequency responses. In the event of extreme transient under-frequency, there is the risk of load shed and also the risk of the loss of generation through generation protection (typically installed to prevent damage resonances at off-nominal frequency operation). Steady state frequency control in the Irish transmission system is achieved by manual operator control. It is valid to assume that through corrective action, i.e. manual operator action, the system frequency will be restored to nominal in a timeframe beyond that of the transient stability study. It should be noted that the frequency the system settles to is above the emergency frequency criteria of 47.5 Hz, however is well below the allowable continuous criteria of 49.5 Hz. Note that load shedding as well as the frequency control function of the Moyle HVdc Interconnector were not modelled in this study. It should be noted that contingency 7_X_X in power flow case 2.2, which simulates loss of 310 MW in Northern Island, appears to be frequency unstable for wind generators in Northern Ireland (PSSE buses 260-264) if the simulation is run out to 40 seconds (it had still not reached a steady value at 20 seconds). The issue is happening in the AC option as well as the HVdc options and therefore is a base case issue that was not further investigated in this study as it has no bearing on the comparison of the AC and HVdc options. Note that power flow case 2.2 is also the case that had trouble with solution convergence during the steady state contingency analysis as was discussed in Section 9.4.2. Figure 9.7 illustrates this case for the AC option.
49.2 Hz
Ballylumford Generator Speed
Coolkeeragh Generator Speed
Dublin Bay Generator Speed
Longpoint Generator Speed
49.2 Hz
49.2 Hz
PDF created with pdfFactory Pro trial version www.pdffactory.com

EirGrid plc Investigating the Impact of HVdc Schemes in the Irish Transmission Network
Final Report
R1116.03.04, Page 95 Oct-18, 2009
© TransGrid Solutions Inc, 2009
Figure 9.7: Frequency decay of the system when largest generator in Northern Ireland is tripped (7_X_X) – Power flow case 2.2 for AC option.
Speed – Northern Ireland generators
Speed – Republic of Ireland generators
Speed – Wind generators in Northern Ireland (Bus 260-264)
48.6 Hz
48.6 Hz
PDF created with pdfFactory Pro trial version www.pdffactory.com
EirGrid plc Investigating the Impact of HVdc Schemes in the Irish Transmission Network
Final Report
R1116.03.04, Page 96 Oct-18, 2009
© TransGrid Solutions Inc, 2009
9.6.5. Rate of Change of Frequency Performance
Rate of change of frequency can be a concern for systems with a high penetration of wind generation. This is because wind generators are often equipped with rate-of-change-of-frequency (ROCOF) relays to trip the wind generator if the rate of change of frequency is too high. The EirGrid Grid Code currently states that the maximum rate of change of frequency in the Irish transmission system is 0.5 Hz/sec. Large amounts of wind generation are planned to be connected to the Irish transmission system and this wind generation will displace conventional generation. Because wind generators do not provide as much inertia as conventional generators, the rate of change of system frequency will naturally increase, causing further concern regarding the ROCOF relays. Many cases were found in which the rate of change of frequency violated 0.5 Hz/sec. Rate of change of system frequency was found to be worst for power flow case 2.1, which represents a summer minimum loading case with low conventional generation and high wind generation. The highest rate of change of frequency was found to occur in Northern Ireland near to the areas of high wind generation, for dynamic contingencies representing three phase faults in Northern Ireland. In particular, a three phase fault at Turleenan on one of the 275 kV lines to TAMN (fault 2_3_A) was found to show the highest rate of change of frequency. As mentioned in Section 9.6.4, in transient stability programs such as PSS/E, the transmission system frequency is obtained from the derivative of the bus voltage angle. If there is a sharp change in the bus angle, the frequency might change infinitely. Therefore, there are filters associated with the frequency measurements. However sometimes these filters are not enough to completely rid the frequency calculations of these spikes, particularly if a fault has been applied in the area near to the frequency calculation. These spikes become even more apparent if studying the rate of change of frequency. For this reason, generator speed quantities were mostly used to analyse rate of change of frequency as generator speeds are state variables which cannot change instantaneously and therefore should not give erroneous results. In order to compare the rate of change of frequency performance between the AC and HVdc options, the rate of change of frequency was compared for power flow case 2.1 for fault 2_3_A (three-phase fault at Turleenan). This was measured by comparing the rate of change of speed and frequency at Ballylumford generator in Northern Ireland, at Dublin Bay generator in the Republic of Ireland and for wind farms near Bellacorick and Omagh. The results are shown in Figures 9.8 and 9.9 below.
PDF created with pdfFactory Pro trial version www.pdffactory.com

EirGrid plc Investigating the Impact of HVdc Schemes in the Irish Transmission Network
Final Report
R1116.03.04, Page 97 Oct-18, 2009
© TransGrid Solutions Inc, 2009
Figure 9.8. Rate of change of speed (w) and frequency (f) in Northern Ireland for a three-phase fault at Turleenan.
5 Hz/sec
-5 Hz/sec
2.5 Hz/sec
-2.5 Hz/sec
5 Hz/sec
-5 Hz/sec
2.5 Hz/sec
-2.5 Hz/sec
0.5 Hz/sec
0.5 Hz/sec
0.5 Hz/sec
0.5 Hz/sec
dw/dt Omagh wind
df/dt Omagh wind
dw/dt Ballylumford
df/dt Ballylumford
PDF created with pdfFactory Pro trial version www.pdffactory.com

EirGrid plc Investigating the Impact of HVdc Schemes in the Irish Transmission Network
Final Report
R1116.03.04, Page 98 Oct-18, 2009
© TransGrid Solutions Inc, 2009
Figure 9.9. Rate of change of speed (w) and frequency (f) in Republic of Ireland for a three-phase fault at Turleenan. As can be seen in Figure 9.8, the rate of change of generator speed in Northern Ireland is the worst case, up to near 4.5 Hz/sec at Ballylumford and greater than 5 Hz/sec at Omagh wind generation. The rate of change of speed for Dublin Bay and Bellacorick wind generation in the Republic of Ireland is less but still slightly violate 0.5 Hz/sec. The rates of change of frequency at the same buses were also plotted for comparison’s sake. If the initial numerical spikes are ignored during the fault and immediately following fault clearing, it appears that the rate of change of frequency is actually less severe than the rate of change of generator speed, with only one bus from the four plotted showing df/dt violations at Ballylumford. In all cases there is no significant difference in rate of change of frequency when comparing the AC and HVdc options, although the VSC does show a slightly higher rate of change of speed at Ballylumford immediately after fault clearing. All options violate the 0.5 Hz/sec criteria. Further study would be recommended to gather more information regarding the ROCOF relays in terms of how they operate, how they measure frequency, how high a rate of change of frequency they allow and what lengths of timers are associated with the relay. It would be a concern for the Irish network to lose large amounts of embedded generation due to rate of change of frequency. If mitigation were necessary, inertia could be added to the system in the form of high inertia synchronous condensers to aid in reducing the rate of change of frequency. Further study would be required to determine the best location and the required ratings of these synchronous condensers.
5 Hz/sec
-5 Hz/sec
2.5 Hz/sec
-2.5 Hz/sec
5 Hz/sec
-5 Hz/sec
2.5 Hz/sec
-2.5 Hz/sec
0.5 Hz/sec
0.5 Hz/sec
0.5 Hz/sec
0.5 Hz/sec
dw/dt Bellacorick wind
df/dt Bellacorick wind
dw/dt Dublin Bay
df/dt Dublin Bay
PDF created with pdfFactory Pro trial version www.pdffactory.com

EirGrid plc Investigating the Impact of HVdc Schemes in the Irish Transmission Network
Final Report
R1116.03.04, Page 99 Oct-18, 2009
© TransGrid Solutions Inc, 2009
9.6.6. Double Circuit Loss of 275 kV Louth-Tandragee Lines
The double circuit 275 kV AC lines between Louth and Tandragee essentially run in parallel with the North-South transmission options that are being studied in this scenario. These AC lines are a major tie line between Northern Ireland and the Republic of Ireland. Fault 4_3_X studies the loss of this double circuit due to a three-phase fault, followed by line reclosing 600 ms after fault clearing. When this double circuit line is out-of-service, it is up to the North-South Interconnector to take over a large portion of the pre-contingency power that was flowing on these lines in order to maintain system stability. The AC option has no trouble with this disturbance as it inherently takes over a large portion of the power from the double circuit loss. In addition, the AC option keeps the Northern Ireland and Republic of Ireland systems synchronized during the time when the lines are out. Because of this, when the AC lines are reclosed the impact to the AC system is minimal and the double circuit line then inherently takes back some of the power flow from the North-South AC line. For the HVdc options, if HVdc control action is not taken to increase the power order for the LCC and VSC HVdc options when the double circuit line trips, the system is unstable for power flow cases 2.1 and 2.3, which represent 1500 MW power transfer from Northern Ireland to the Republic of Ireland. Power flow cases 2.2 and 2.4 are stable without HVdc control action, however large step changes in voltage are observed upon AC line reclosing which violate the 10% voltage deviation criteria in power flow case 2.2. The HVdc options for Scenario 2 were purposely rated higher than would normally be required for system intact conditions in order to leave room and account for the possibility of a double circuit loss of the Louth-Tandragee 275 kV lines. Special HVdc controls are required to quickly increase the power transfer on the HVdc lines upon detection of the double circuit AC loss (taking into account small communication time delays). Such a special protection scheme could consist of the following:
• Monitor the power flow in the double circuit Louth-Tandragee lines. • Monitor breaker status of these lines, and if the breakers open to trip the lines, send a signal to
the HVdc controls to increase the power order by the required percentage of pre-contingency Louth-Tandragee double circuit power transfer. Such communication delays would be expected to be in the range of 20 ms.
• The HVdc controls can respond within less than one cycle to increase the power order. The actual power will reach the new power order within a few cycles.
• The amount of “extra” power to be transmitted by the HVdc link (DC power modulation) will depend on its long term and short term overload capabilities, which should be defined at the specification stage, since there are important costs implications on these limits. Currently VSC schemes are designed to run up to their rated power, with no overload capability. This should evolve in future projects.
Special protection schemes, similar to that described above, exist in other HVdc schemes to quickly reduce or increase HVdc power to maintain system stability depending on major transmission lines tripping. For example, in the Nelson River HVDC scheme in Manitoba, a special protection scheme known as “HVDC reduction” is used to quickly reduce the HVdc power order to two LCC HVdc bipoles in the event of loss of various critical transmission lines in the AC system, including tie lines between Manitoba and the United States. The “HVDC reduction” operates under certain pre-determined power flow conditions and adjusts the HVdc power orders according to the pre-contignency power flow that was measured in the particular transmission line that tripped. The VSC and LCC options were both able to quickly increase power when the double circuit line is tripped, the VSC operating somewhat better than the LCC because the LCC option is also recovering from a commutation failure while increasing power transfer and the LCC option reaches the higher power slower than the VSC option. But regardless, both HVdc options recover to the higher power as ordered. During this time when the existing double circuit AC lines are open, the Northern Ireland and Republic of Ireland systems are ‘weakly’ coupled when compared to the AC option. This results in the Northern
PDF created with pdfFactory Pro trial version www.pdffactory.com

EirGrid plc Investigating the Impact of HVdc Schemes in the Irish Transmission Network
Final Report
R1116.03.04, Page 100 Oct-18, 2009
© TransGrid Solutions Inc, 2009
Ireland and Republic of Ireland AC systems drifting further apart during the double circuit line outage. The systems are still synchronized, however the larger angle difference between the systems can result in a large disturbance when reclosing the parallel lines. As a first assumption the HVdc options were assumed to take over 100% of the pre-contingency power flow from the double circuit Louth-Tandragee lines. As can be seen in Figure 9.10, reclosing the AC lines in the LCC case can cause a fairly significant disturbance resulting in transient undervoltages near 0.5 pu, which also results in a power reduction at the Moyle HVdc inverter. The VSC option is equipped with inherent AC voltage control and does not fail commutation, whereas the LCC option has no AC voltage control and fails commutation when the lines are reclosed, which only serves to worsen the impact of the LCC option. Figure 9.10 below compares the terminal AC voltages for the AC, LCC and VSC options during the entire fault sequence. Figure 9.11 compares the LCC and VSC active and reactive power flows at Turleenan during the disturbance. Note the very large dip in AC voltage for the LCC option when the AC lines are reclosed. Also note that the LCC option is absorbing reactive power during the time when the double circuit AC line is out of service, whereas the VSC option is supplying reactive power. The VSC option performs better than the LCC option due to its large reactive power control capability and the ability to reach its power order slightly faster than the LCC option. The ability of VSC to inject fast dynamic reactive power helps to maintain system AC voltages and also to maintain power transfers. Increased active power transfer before reclosing will help to reduce the phase angle difference across the breakers, which in turn reduces the power surge and voltage dip in the close by area.
PDF created with pdfFactory Pro trial version www.pdffactory.com

EirGrid plc Investigating the Impact of HVdc Schemes in the Irish Transmission Network
Final Report
R1116.03.04, Page 101 Oct-18, 2009
© TransGrid Solutions Inc, 2009
Time (s) 0.0 1.0 2.0 3.0 4.0 5.0 ... ... ...
0.00 0.10 0.20 0.30 0.40 0.50 0.60 0.70 0.80 0.90 1.00 1.10 1.20 1.30 1.40
V (p
u)
VOLT 90120 [TURL 275.00] VOLT 90120 [TURL 275.00] VOLT 90120 [TURL 275.00]
0.00 0.10 0.20 0.30 0.40 0.50 0.60 0.70 0.80 0.90 1.00 1.10 1.20 1.30
V (p
u)
VOLT 3772 [CAVAN 220.00] VOLT 3772 [CAVAN 220.00] VOLT 3772 [CAVAN 220.00]
0.00 0.10 0.20 0.30 0.40 0.50 0.60 0.70 0.80 0.90 1.00 1.10 1.20 1.30
V (p
u)
VOLT 5464 [WOODLAND 380.00] VOLT 5464 [WOODLAND 380.00] VOLT 5464 [WOODLAND 380.00]
Figure 9.10. Fault at Tandragee followed by double circuit loss of Louth-Tandragee AC line and reclosing of lines 600 ms later. Comparison of terminal AC voltages in the AC, LCC and VSC options. (Blue – AC, Green-LCC, Red-VSC).
AC Voltage Turleenan 275 kV
AC Voltage mid Cavan 225 kV
AC Voltage Woodland 400 kV
PDF created with pdfFactory Pro trial version www.pdffactory.com

EirGrid plc Investigating the Impact of HVdc Schemes in the Irish Transmission Network
Final Report
R1116.03.04, Page 102 Oct-18, 2009
© TransGrid Solutions Inc, 2009
x 0.0 1.0 2.0 3.0 4.0 5.0 ... ... ...
-1.0k
-0.8k
-0.6k
-0.4k
-0.2k
0.0
0.2k
0.4k
0.6k
P (M
W)
P_LCC P_VSC
-500
-400
-300
-200
-100
0
100
200
300
400
500
Q (M
VAr
)
Q_LCC Q_VSC
Figure 9.11. Fault at Tandragee followed by double circuit loss of Louth-Tandragee AC line and reclosing of lines 600 ms later. Comparison of HVdc P and Q for the LCC and VSC options. (Blue – LCC, Green-VSC). The further apart the AC system angles during the time the AC lines are out of service, the more of a disturbance that occurs upon reclosing the AC lines. It was found that there is a minimum required power transfer on the HVdc lines during the outage that is dependent on the AC system configuration and power flow. A special HVdc controller could be designed to monitor the angles of the two systems and adjust HVdc power transfer to minimize these angles and therefore minimize disturbance upon reclose as is done on the Cahora Bassa link in Africa. Such a controller was not modeled during this study however the power orders were manually changed in an attempt to minimize the impact upon AC line reclosing. Further testing was performed with the LCC option. Figures 9.12 and 9.13 below show the AC voltage response and the angles of the two systems, respectively. As can be seen in Figure 9.13 the optimal time for reclosing the lines would be at a point in time when the phase angles of the two systems are intersecting, for example near 1.8 seconds.
Time (s) 0.0 1.0 2.0 3.0 4.0 5.0 ... ... ...
0.00 0.10 0.20 0.30 0.40 0.50 0.60 0.70 0.80 0.90 1.00 1.10 1.20 1.30 1.40
V(p
u)
VOLT 90120 [TURL 275.00] VOLT 3772 [CAVAN 220.00] VOLT 5464 [WOODLAND 380.00]
Figure 9.12. Fault at Tandragee followed by double circuit loss of Louth-Tandragee AC line, no reclosing of the lines. Terminal AC voltages for the LCC option. (Blue – AC, Green-LCC, Red-VSC).
P – HVDC options at Turleenan
Q – HVDC options at Turleenan
LCC – AC Voltages at North-South Terminals
PDF created with pdfFactory Pro trial version www.pdffactory.com

EirGrid plc Investigating the Impact of HVdc Schemes in the Irish Transmission Network
Final Report
R1116.03.04, Page 103 Oct-18, 2009
© TransGrid Solutions Inc, 2009
Time (s) 0.0 1.0 2.0 3.0 4.0 5.0 ... ... ...
-50
0
50
100
150
200
250
Ang
(deg
)
ANGL 90020 [TANDRAGE 275.00] ANGL 35231 [LOUTH 275.00] ANGL 35232 [LOUTH 275.00] ANGL 35232 [LOUTH 275.00]
Figure 9.13. Fault at Tandragee followed by double circuit loss of Louth-Tandragee AC line, no reclosing of the lines. Phase angles at Louth and Tandragee for the LCC option. The LCC option was tested with delayed reclosing until such a time as the angles of the two systems are close together, around 1.8 seconds as shown in Figure 9.13 above. This was shown to greatly reduce the impact to the AC system when reclosing the AC lines and provide acceptable system response as shown below in Figures 9.14 and 9.15.
Time (s) 0.0 1.0 2.0 3.0 4.0 5.0 ... ... ...
0.00
0.20
0.40
0.60
0.80
1.00
1.20
V (
pu)
VOLT 90020 [TANDRAGE 275.00] VOLT 3772 [CAVAN 220.00] VOLT 5464 [WOODLAND 380.00]
Figure 9.14. Fault at Tandragee followed by double circuit loss of Louth-Tandragee AC line, reclosing of the lines at 1.8 sec when the phase angle difference is minimal. Terminal AC voltages for the LCC option.
Time (s) 0.0 1.0 2.0 3.0 4.0 5.0 ... ... ...
-20
0
20
40
60
80
100
120
140
Ang
(deg
)
ANGL 90020 [TANDRAGE 275.00] ANGL 35231 [LOUTH 275.00] ANGL 35232 [LOUTH 275.00]
Figure 9.15. Fault at Tandragee followed by double circuit loss of Louth-Tandragee AC line, reclosing of the lines at 1.8 sec when the phase angle difference is minimal. Phase angles at Louth and Tandragee for the LCC option. In order to get an idea of how much the power transfer on the North-South HVdc Interconnector would need to be increased during the double circuit Louth-Tandragee line outage, various amounts of HVdc power order increases were tested for worst case power flows 2.1 and 2.3 and the results are summarized in Tables 9.14 and 9.15 below. The test cases were performed using the VSC option. The pre-contingency power flow on the Louth-Tandragee lines is 722 MW for case 2.1 and 833 MW for case
Angles are close together at 1.8 seconds
Reclosing when angles are close together minimizes impact compared to Figure 8.4.
Angle – Louth and Tandragee
Angle – Louth and Tandragee
LCC – AC Voltages at North-South Terminals
PDF created with pdfFactory Pro trial version www.pdffactory.com

EirGrid plc Investigating the Impact of HVdc Schemes in the Irish Transmission Network
Final Report
R1116.03.04, Page 104 Oct-18, 2009
© TransGrid Solutions Inc, 2009
2.3. The precontingency power orders of the HVDC terminals in case 2.1 are 606 MW at Turleenan, 102 MW at mid Cavan and 672 MW at Woodland; and in case 2.3 are 578 MW at Turleenan, 70 MW at mid Cavan and 470 MW at Woodland. Table 9.14. HVdc Power Transfer during 4_3_X for Power Flow Case 2.1.
Total HVDC Power During Louth-Tandragee Outage (MW)
Increment in HVDC power transfer as % of Louth-Tandragee
flow
Turleenan (606 MW pre-cont)
Cavan (102 MW pre-cont)
Woodland (672 MW pre-cont)
Minimum angle
difference (deg.)
Reclosing time at min angle* (s)
Wind tripping
V-step at reclosing (%)
50 962 102 1044 56 2.3 2.4 MW 14
60 1032 102 1114 44 2.3 1.07 MW 9
70 1104 102 1186 34 2.3 0.323 MW 6
80 1176 102 1258 22 1.0 none 4
90 1248 102 1330 9 1.0 none none
100 1320 102 1402 1 1.2 0.323 MW none
110 1392 102 1474 4 1.2 0.323 MW none *fault occurs at 0.1 s and cleared at 0.22s Table 9.15. HVdc Power Transfer during 4_3_X for Power Flow Case 2.3.
Total HVDC Power During Louth-Tandragee Outage (MW)
Increment in HVDC power transfer as % of Louth-Tandragee
flow
Turleenan (578 MW pre-cont)
Cavan (70 MW pre-
cont)
Woodland (470 MW pre-cont)
Minimum angle
difference (deg.)
Reclosing time at min angle* (s)
Wind tripping
V-step at reclosing (%)
50 994 70 886 45 2.7 18.7 MW 7
60 1078 70 970 33 2.4 4.0 MW 4
70 1160 70 1054 20 2.0 1.3 MW none
80 1244 70 1136 6 2.0 1.3 MW none
90 1328 70 1220 0 1.7 0.97s, 1.3 MW
none
100 1410 70 1304 0 1.5 1.3 MW none
110 1494 70 1386 0 1.8 1.3 MW none
120 1578 70 1470 1 2.0 4.0 MW none
*fault occurs at 0.1 s and cleared at 0.22s Acceptable dynamic performance is obtained if approximately 70% of the pre-contingency Louth-Tandragee power is transferred to the North-South HVdc Interconnector. In both power flow cases 2.1 and 2.3 the voltage step upon reclosing is well below the 10% voltage deviation criteria. This 70% pre-contingency power flow translates into an extra 583 MW to be transferred on the HVdc bipole for these particular cases during the double circuit line outage, resulting in a total maximum HVdc bipolar power flow near 1270 MW at Woodland. The required HVdc rating would need to be studied with other power flow cases in more detail to determine the maximum amount of steady state system intact power flow required to be on the North-South Interconnector simultaneous to the maximum power flow on the Louth-Tandragee lines in order to determine an absolute HVdc rating. Increasing HVdc power transfer up to approximately 80-90% of the pre-contingency power flow shows to improve the system performance by causing less wind generation to trip, by allowing the angles of the North and South systems to come even closer together, and by causing a smaller voltage disturbance when the lines are reclosed. Increasing the power transfer beyond this amount up to 100% or more does
PDF created with pdfFactory Pro trial version www.pdffactory.com

EirGrid plc Investigating the Impact of HVdc Schemes in the Irish Transmission Network
Final Report
R1116.03.04, Page 105 Oct-18, 2009
© TransGrid Solutions Inc, 2009
not appear to have any dynamic performance benefit, and in fact worsens the steady state situation by resulting in several steady state overloads in the AC system near Woodland, as discussed in Section 9.4.1. The 70-80% power transfer level was tested for the four power flow cases studied, the details of these cases are further described in Table 5.1, but in general represent various year 2020 network topologies from summer minimum to winter maximum loading with varying dispatches of conventional and wind generation. Whether or not the 70-80% value would need to change based on other system topologies not studied in the scenario would require further testing, however unless another tie line between Northern Ireland and the Republic of Ireland were added it is not expected that this value would need to change. In steady state, if the Louth-Tandragee lines were not reclosed and remained open with power transferred onto the North-South HVdc option, the 110 kV circuits connecting Northern Ireland to the Republic of Ireland were monitored for overloads. For power flow case 2.1, as long as 50% of the pre-contingency Louth-Tandragee power flow is transferred to the HVdc the 110 kV circuits are not overloaded. In power flow case 2.3, if only 50% is transferred to the HVdc, the 110 kV lines are overloaded as follows:
• Enniskillen – Coraclassy 1981 – 79016 CCT1 : 137.3% overload (steady state) • Letterhkenny – Strabanne 3581 – 89510 CCT1 : 116.9% overload (steady state) • Letterhkenny – Strabanne 3581 – 89510 CCT2 : 116.9% overload (steady state)
The 110 kV circuits are not overloaded as long as 60% of the pre-contingency Louth-Tandragee power is transferred to the North-South Interconnector in power flow case 2.3. In dynamics, immediately following the loss of the Louth-Tandragee lines and subsequent increase of HVdc power order, the 110 kV circuits become transiently overloaded, the worst case is power flow 2.3. The 110 kV circuits between Letterkenny-Strabane are rated for 185.3 MVA but are transiently loaded to a maximum of 200 MW. The Trillick-Coolkeeragh 110 kV circuit is rated for 185.3 MVA and is only transiently loaded to a maximum of 140 MW. The Corraclassy-Enniskillen 110 kV circuit is rated for 107 MVA and is transiently loaded to a maximum of 210 MW. The transient loading on these circuits is shown in Figure 9.16. Enniskillen – Coraclassy 1981 – 79016 CCT1 Letterkenny – Strabane 3581 – 89510 CCT1 Letterkenny – Strabane 3581 – 89510 CCT2 Trillick – Coolkeeragh 5361 – 75510 CCT1 Line protection is not included in the PSSE dynamic model of the system, however it should be verified whether or not the existing protection settings would cause these 110 kV lines to trip during this disturbance. If it were found that protection would trip the transiently overloaded 110 kV lines, it would be recommended to adjust protection settings to avoid the potential tripping of these 110 kV lines.
PDF created with pdfFactory Pro trial version www.pdffactory.com

EirGrid plc Investigating the Impact of HVdc Schemes in the Irish Transmission Network
Final Report
R1116.03.04, Page 106 Oct-18, 2009
© TransGrid Solutions Inc, 2009
Figure 9.16. Top: Power transfer on 110 kV NI-RoI circuits. Bottom: HVDC power order and response. (Power flow 2.3, Contingency 4_3_X for HVdc Option 2 (VSC). 70% Louth-Tandragee power transferred to the HVdc VSC, reclose at 2 seconds.) Figure 9.17 compares the North-South terminal voltages for the AC option and the HVdc options for loss of the double circuit Louth-Tandragee lines, with the HVdc options transferring 70% of Louth-Tandragee power, followed by double circuit AC line reclosing at minimum angles.
PDF created with pdfFactory Pro trial version www.pdffactory.com

EirGrid plc Investigating the Impact of HVdc Schemes in the Irish Transmission Network
Final Report
R1116.03.04, Page 107 Oct-18, 2009
© TransGrid Solutions Inc, 2009
Figure 9.17. Scenario 2.1. Fault 4_3_X. 70% Louth-Tandragee power transferred to HVdc options. (Blue – AC, Green – LCC, Red – VSC). In comparison with the dynamic performance of the AC system, there does not seem to be any obvious technical benefit to the HVdc options over the AC option, even if more power is transferred to the HVdc during the double circuit line outage. Assuming that reclosing takes place, the AC option (blue) has the advantage of not delaying reclosing and in fact the system frequency is less oscillatory in comparison to the HVdc options. It is possible however that a frequency controller could be designed with the HVdc link to help dampen the oscillations in frequency. If reclosing does not take place, then the VSC option has the advantage of supplying reactive power to the system which improves the system voltage profile when the double circuit Louth-Tandragee line is out as can be seen the red voltage curves shown in Figure 9.16 prior to reclosing. A STATCOM or SVC could however be installed with the AC option to provide similar dynamic reactive support if deemed necessary. In summary:
• For this particular disturbance the AC option as is shown has acceptable performance.
• The HVdc options both require proper controls to adjust dc power and appropriate reclosing times to minimize adverse system impacts, such as instability and voltage deviations. They also require appropriate rating to be able to take over at least 70% of pre-contingency power flow on the Louth-Tandragee double circuit line. The VSC option shows the best voltage performance due to its inherent reactive power capability.
• With proper HVdc controls, all three options can provide acceptable performance however there
does not appear to be any significant advantage to the HVdc options other than the dynamic
AC Voltage Turleenan 275 kV
AC Voltage mid Cavan 220 kV
AC Voltage Woodland 400 kV
Speed Ballylumford Generator
Speed Dublin Bay Generator
PDF created with pdfFactory Pro trial version www.pdffactory.com

EirGrid plc Investigating the Impact of HVdc Schemes in the Irish Transmission Network
Final Report
R1116.03.04, Page 108 Oct-18, 2009
© TransGrid Solutions Inc, 2009
reactive power capability of the VSC. It should also be noted that the HVdc performance for both the LCC and VSC options could very likely be improved beyond what is shown in this study by optimizing controls, which is beyond the scope of this study.
9.6.7. HVdc Line Faults and Pole Blocking
The system performed well within criteria for the loss of an HVdc pole for both the LCC and VSC options. Since the HVdc links are operating at relatively low powers, the AC system is able to transfer the power previously flowing in the blocked pole. Alternatively, since the HVdc links are operating at low powers, the controls could be designed to increase the power order of the healthy pole to cover for loss of the other pole, which would further reduce the impact to the AC system. In an LCC HVdc link, a dc line fault would look very similar to the AC system as a temporary pole block, therefore this fault should perform better than the permanent pole block discussed in the previous paragraph. In a VSC HVdc link, a dc line fault is more severe as it draws short circuit current from the AC system and therefore to the AC system looks like a remote AC fault. This concept of this fault was discussed in more detail in Section 2. The simulation of this disturbance in the VSC option showed that although a DC pole fault in a VSC link has more impact to the AC system than in the LCC option, the system performance is still well within criteria.
9.6.8. Commutation Failures of East-West HVdc Interconnector
At the time of performing this study it was not yet known whether the East-West Interconnector would be a line-commutated converter or a voltage source converter. In order to model the worst case scenario, the East-West Interconnector was assumed to be an LCC HVdc link. For all faults that were studied, the East-West Interconnector performance was observed by noting whether or not it failed commutation during or after the disturbance.
Since the completion of the study work, the contract for the East-West HVdc link has been awarded and the link will be built using VSC technology, not LCC technology as was assumed in this study. This is expected to have a positive impact to all AC and HVdc option results presented in this report as the VSC link will be capable of supplying/absorbing a large amount of dynamic and steady state reactive power, thereby providing superior voltage control in comparison to the LCC HVdc link that was modeled for the East-West link. A major difference to the system however would be the impact of an East-West DC line fault, as short circuit current will be drawn from the AC system into the DC line fault if the link is using VSC technology thereby appearing to the AC system as a remote fault, whereas the LCC link would not draw any short circuit current from the AC system. It would be recommended to perform this particular fault to determine the exact impacts to the various AC and HVdc options. The issue of commutation failures of the East-West Interconnector as presented in this section can be ignored.
In power flow case 2.1, the converter connected to the EirGrid system at Woodland is operating as a rectifier. The East-West Interconnection does not fail commutation in power flow 2.1 for the faults applied in the EirGrid system. In the remaining power flow cases 2.2, 2.3 and 2.4, the converter connected to the EirGrid system is operating as an inverter. Commutation failures of the East-West Interconnector occur for most of the contingencies applied in EirGrid system for these power flows. Table 9.16 summarizes these results. Table 9.16: Commutation failures of the East-West Interconnector during system faults.
Power Flow 2.2 Power Flow 2.3 Power Flow 2.4 Contingency AC-
option LCC-
option VSC-
option AC-
option LCC-
option VSC-
option AC-
option LCC-
option VSC-
option 1_0_X N/A NO NO N/A NO NO N/A NO NO 2_1_A YES YES NO NO NO NO NO YES NO 2_1_B YES NO NO NO NO NO NO YES NO 2_1_C YES YES YES YES YES YES YES YES YES 2_3_A YES YES YES YES YES YES YES YES NO
PDF created with pdfFactory Pro trial version www.pdffactory.com

EirGrid plc Investigating the Impact of HVdc Schemes in the Irish Transmission Network
Final Report
R1116.03.04, Page 109 Oct-18, 2009
© TransGrid Solutions Inc, 2009
Power Flow 2.2 Power Flow 2.3 Power Flow 2.4 Contingency AC-
option LCC-
option VSC-
option AC-
option LCC-
option VSC-
option AC-
option LCC-
option VSC-
option 2_3_B YES YES YES YES YES YES YES YES NO 2_3_C YES YES YES YES YES YES YES YES YES 3_3_X YES YES NO YES YES NO YES YES NO 4_3_X YES YES YES YES YES** YES YES YES NO 6_3_X YES YES NO YES YES NO YES YES NO 7_X_X NO NO NO NO NO NO NO NO NO
7C_X_X NO NO NO NO NO NO NO NO NO 8_3_X YES YES YES YES YES YES YES YES NO 9_1_X YES YES NO YES YES NO YES YES NO 9_3_X YES YES YES YES YES YES YES YES YES
9R_3_X* YES YES YES YES YES YES YES YES YES 10_1_X YES YES NO NO NO NO NO YES NO 10_3_X YES YES YES YES YES YES YES YES YES 11_1_X YES NO NO NO NO NO NO YES NO 11_3_X YES YES YES YES YES YES YES YES NO 12_X_X YES YES YES YES YES YES YES YES YES
* Commutation fails during the initial fault period as well as at the reclosing effort due to the permanent fault. ** Commutation fails during the fault as well as at the moment of reclose. The VSC option results in the fewest commutation failures of the East-West Interconnector. “Light gray cells” in Table 9.16 show the contingencies in which the East-West Interconnector fails commutation for the AC and LCC options but not the VSC option. A significant number of contingencies show this advantage of the VSC option. In power flow case 2.2, the East-West Interconnector fails commutation in the AC option for two breaker-failures scenarios: 2_1_B and 11_1_X. The LCC and VSC options avoid the commutation failure. “Dark gray cells” in Table 9.16 show these contingencies. In power flow case 2.3 for contingency 4_3_X, the East-West Interconnector fails commutation twice in the LCC option during the fault as well as at the moment of reclose. In power flow 2.4, the East-West Interconnector fails commutation in the LCC option during four breaker-failure scenarios: 2_1_A, 2_1_B, 10_1_X and 11_1_X. The AC and VSC options avoid the commutation failure. “Dotted cells” in Table 9.16 show these contingencies. In summary, when considering commutation failures of the East-West Interconnector, the VSC option is the best in comparison to the LCC and AC options as it results in the fewest instances of commutation failures of the East-West Interconnector, which is also an indicator of better AC system voltage performance. In power flow case 2.2, the LCC option is better than the AC option, but in power flow case 2.4, the AC option is better than the LCC option. It should be noted however that in all three options, the HVdc and AC systems quickly return to normal operation after commutation failures.
9.6.9. Commutation Failures of North-South HVdc System – LCC option
The LCC option for the North-South HVdc link fails commutation for a significant number of the contingencies being studied. Because the LCC HVdc link is situated within a fairly meshed AC network, any faults which cause a drop in AC voltage of approximately 10% could easily result in a commutation failure, and hence a temporary loss of power transmission on the HVdc link during the commutation failure. This situation is not true for the VSC option as it does not fail commutation and can continue to provide reduced power transmission during reduced AC voltage. And obviously the same is true for the AC
PDF created with pdfFactory Pro trial version www.pdffactory.com

EirGrid plc Investigating the Impact of HVdc Schemes in the Irish Transmission Network
Final Report
R1116.03.04, Page 110 Oct-18, 2009
© TransGrid Solutions Inc, 2009
option, i.e. that it can also provide reduced transmission during reduced AC voltage. This would be an inherent disadvantage to the LCC option when comparing LCC to VSC or AC solutions. The commutation failures of the North-South LCC option are tabulated in Table 9.17. Table 9.17: Commutation failures of three terminal HVdc system during the fault.
Contingency Power Flow 2.1 Power Flow 2.2 Power Flow 2.3 Power Flow 2.4 1_0_X NO NO NO NO 2_1_A NO YES NO YES 2_1_B NO NO YES YES 2_1_C YES NO YES NO 2_3_A NO YES YES YES 2_3_B NO YES YES YES 2_3_C YES YES YES YES 3_3_X NO YES YES YES 4_3_X NO YES YES** YES 6_3_X NO YES YES YES 7_X_X NO NO NO NO
7C_X_X NO NO NO NO 8_3_X NO YES YES YES 9_1_X NO YES YES YES 9_3_X YES YES YES YES
9R_3_X* YES YES YES YES 10_1_X NO NO YES YES 10_3_X YES YES YES YES 11_1_X NO NO YES YES 11_3_X YES YES YES YES 12_X_X YES YES YES YES
* Commutation fails during the initial fault period as well as at the moment of reclosing effort due to the permanent fault. ** Commutation fails during the fault as well as at the moment of reclose.
9.7. System Frequency Scans
Impedance scans were performed in PSCAD to generate the positive sequence driving point impedance versus frequency (from 0Hz to 2500Hz in 2Hz increments) at the Turleenan (90120), mid Cavan (3772), and Woodland (5464) buses for the following four power flow cases being studied. Each case was performed with the proposed interconnections and associated reactive support out of service. Any existing HVdc systems were left in service. To improve the accuracy of the frequency scans the main transmission lines connected to Turleenan, mid Cavan and Woodland buses were modeled as frequency dependant using the geometry data provided by EirGrid. A complete list of transmission lines modeled as frequency dependant is given in Appendix H. All other transmission lines are modeled as Bergeron using the R, L,C data from PSS/E base cases. It should be noted that when developing the PSCAD model for the impedance scans, no information is given on the existing HVdc filters on the Moyle and Wales HVdc link and are inserted as simple capacitors. This will have an impact on the results, but without the details of the filters, this is an acceptable approximation. If an HVdc transmission option is selected a more detailed frequency scan study must be performed to consider all various system configurations in the foreseeable future. Results of this study will define a range of system impedances that may be seen from the converter terminals. The HVdc link manufacturer must design the link such that the injected harmonic currents and the resultant harmonic currents always remain below the set limits for all specified system impedances and HVdc link operating points. If during the lifetime of the HVdc link the system topology changes significantly in a way not predicted before, the original design may not be sufficient and modifications to the filters or other components may be required (please see remark for previous scenario). Detailed impedance scans obtained for each system configuration are shown in Appendix B-5. The results are summarized in Tables 9.18 to 9.21. The system impedance as seen from Turleenan does not
PDF created with pdfFactory Pro trial version www.pdffactory.com

EirGrid plc Investigating the Impact of HVdc Schemes in the Irish Transmission Network
Final Report
R1116.03.04, Page 111 Oct-18, 2009
© TransGrid Solutions Inc, 2009
change much with and without the 400kV transmission line to MidCavan. It appears that this is mostly because the system impedance at Turleenan is dominated by other components and therefore the impact of the new 400kV line on the total impedance is small. The study shows all three solutions have some issues with harmonic resonances and none of them has a clear advantage over the others in term of these resonances. Table 9.18. Power flow cases 2.1 and 2.2 – Frequency Scans without the AC line.
Scenario Bus Frequency Harmonic Resonance Type Scenario Bus Frequency Harmonic Resonance Type 125 2.5 parallel 124 2.48 parallel 185 3.7 series 173 3.46 series 217 4.34 parallel 229 4.58 parallel 219 4.38 series 237 4.74 series 233 4.66 parallel 904 18.08 parallel 265 5.3 series 1226 24.52 series 397 7.94 parallel 1232 24.64 parallel 427 8.54 series 1265 25.3 series 463 9.26 parallel 1289 25.78 parallel 536 10.72 series 1327 26.54 series 897 17.94 parallel 1515 30.3 parallel 944 10.88 series 1590 31.8 series
1330 26.6 parallel 1655 33.1 parallel 1446 28.92 series 1711 34.22 series 1536 30.72 parallel 2247 44.94 parallel
90120
1650 33 series 2291 45.82 series 353 7.06 parallel
90120
2464 49.28 parallel 469 9.38 series 430 8.6 parallel
1173 23.46 parallel 510 10.2 series 1678 33.56 series 1165 23.3 parallel
3772
2485 49.7 parallel 1227 24.54 series 165 3.3 parallel 1420 28.4 parallel 183 3.66 series 1513 30.26 series 214 4.28 parallel 1549 30.98 parallel 265 5.3 series 1665 33.3 series 299 5.98 parallel 2268 45.36 parallel
2.1
5464
701 14.02 series
3772
2309 46.18 series 237 4.74 parallel 711 14.22 series
2.2
5464
727 14.54 parallel
PDF created with pdfFactory Pro trial version www.pdffactory.com

EirGrid plc Investigating the Impact of HVdc Schemes in the Irish Transmission Network
Final Report
R1116.03.04, Page 112 Oct-18, 2009
© TransGrid Solutions Inc, 2009
Table 9.19. Power flow cases 2.3 and 2.4 – Frequency Scans without the AC line.
Scenario Bus Frequency Harmonic Resonance Type Scenario Bus Frequency Harmonic
Resonance Type
162 3.24 parallel 151 3.02 parallel
175 3.5 series 173 3.46 series
237 4.74 parallel 239 4.78 parallel
255 5.1 series 251 5.02 series
369 7.38 parallel 577 11.54 parallel
446 8.92 series 621 12.42 series
482 9.64 parallel 717 14.34 parallel
505 10.1 series 967 19.34 series
1098 21.96 parallel 985 19.7 parallel
1162 23.24 series 1035 20.7 series
1193 23.86 parallel 1267 25.34 parallel
1273 25.46 series 1309 26.18 series
1399 33.18 parallel 1627 32.54 parallel
1438 28.76 series 1813 36.26 series
1485 29.7 parallel 1971 39.42 parallel
1590 31.8 series 2029 40.58 series
1629 32.58 parallel 2127 42.54 parallel
1711 34.22 series
90120
2405 48.1 series
2348 46.96 parallel 3772 365 7.3 parallel
2412 48.24 series 375 7.5 series
90120
2438 48.76 parallel 481 9.62 parallel
353 7.06 parallel 531 10.62 series
381 7.62 series 1163 23.26 parallel
485 9.7 parallel 1235 24.7 series
531 10.62 series 1447 28.94 parallel
1103 22.06 parallel 1467 29.34 series
1125 22.5 series 1475 29.5 parallel
1199 23.98 parallel 1667 33.34 series
1235 24.7 series 2273 45.46 parallel
1399 27.98 parallel 2319 46.38 series
1529 30.58 series 215 4.3 parallel
1561 31.22 parallel 304 6.08 series
1667 33.34 series 314 6.28 parallel
2261 45.22 parallel 713 14.26 series
3772
2319 46.38 series
5464
731 14.62 parallel
215 4.3 parallel 712 14.24 series
2.3
5464
727 14.54 parallel
2.4
All scans have shown that there are frequencies that are of concern for any type of interconnection. Potential resonances below the 8th order are a concern for LCC, VSC and AC interconnections. These harmonics are introduced into the system by various loads (arc furnaces, server farms) and may cause power quality issues regardless of the interconnection. Further to this, a classic 12-pulse LCC produces characteristic harmonics at the 11th,13th,23rd,25th, …, 12n+/-1. The magnitude of these harmonics decreases as n increases, and is not as much of a concern at the higher orders. Harmonics identified around these values must be taken into consideration when designing the HVdc link. The 12-pulse converter is made up of two 6-pulse converters, which each produce the following harmonics; 5th, 7th, 11th,13th, 17th,19th,….,6n+/-1. Ideally, due to the delta-wye phase shift in the one transformer connecting a 6-pulse converter, much of the harmonics are cancelled out leaving only the harmonics of order 12n+/-1.
PDF created with pdfFactory Pro trial version www.pdffactory.com

EirGrid plc Investigating the Impact of HVdc Schemes in the Irish Transmission Network
Final Report
R1116.03.04, Page 113 Oct-18, 2009
© TransGrid Solutions Inc, 2009
Table 9.20. Power flow cases 2.1 and 2.2 – Frequency Scans with the AC line. Scenario Bus Frequency Harmonic Resonance
Type Scenario Bus Frequency Harmonic Resonance
Type 2.1 90120 125 2.5 P 2.2 90120 123 2.46 P
187 3.74 S 171 3.42 S 217 4.34 P 229 4.58 P 219 4.38 S 237 4.74 S 235 4.7 P 905 18.1 P 265 5.3 S 1227 24.54 S 395 7.9 P 1235 24.7 P 425 8.5 S 1275 25.5 S 463 9.26 P 1289 25.78 P 537 10.74 S 1329 26.58 S 897 17.94 P 1517 30.34 P 945 18.9 S 1591 31.82 S 1343 26.86 P 1657 33.14 P 1459 29.18 S 1713 34.26 S 1535 30.7 P 2259 45.18 P 1657 33.14 S 2289 45.78 S 2467 49.34 P
3772 1507 30.14 P 3772 521 10.42 P 1633 32.66 S 547 10.94 S 1167 23.34 P 1239 24.78 S 1439 28.78 P 5464 219 4.38 P 1511 30.22 S 265 5.3 S 1555 31.1 P 297 5.94 P 1665 33.3 S 465 9.3 S 2239 44.78 P 475 9.5 P 2283 45.66 S 707 14.14 S 5464 257 5.14 P 725 14.5 P 481 9.62 S 519 10.38 P 711 14.22 S 731 14.62 P
In practice though, due to manufacturing tolerances of the valves and converter transformers and slight unbalances in the firing of the two 6-pulse groups, may introduce very small amounts of harmonics at 6n+/-1, that again decrease as n increases. As such, care must be taken at these harmonic orders, with more thought given to the lower order harmonics at the 5th and 7th, as a parallel resonance in the system at the 5th and 7th, combined with even a slight 5th and 7th current, may cause voltage distortions. Further to the low order harmonic issues with a LCC, if a series resonance is present in the higher order harmonics, these harmonic currents can propagate into the system, which may cause interference on communication circuits (I·T product and kV·T). The resonances of concern here are those located in the communication bandwidth.
PDF created with pdfFactory Pro trial version www.pdffactory.com

EirGrid plc Investigating the Impact of HVdc Schemes in the Irish Transmission Network
Final Report
R1116.03.04, Page 114 Oct-18, 2009
© TransGrid Solutions Inc, 2009
Table 9.21. Power flow cases 2.3 and 2.4 – Frequency Scans with the AC line. Scenario Bus Frequency Harmonic Resonance
Type Scenario Bus Frequency Harmonic Resonance
Type
2.3 90120 235 4.70 P 2.4 90120 157 3.14 P
257 5.14 S 167 3.34 S
367 7.34 P 239 4.78 P
445 8.90 S 251 5.02 S
479 9.58 P 575 11.50 P
505 10.10 S 621 12.42 S
1099 21.98 P 717 14.34 P
1161 23.22 S 967 19.34 S
1197 23.94 P 985 19.70 P
1283 25.66 S 1035 20.70 S
1425 28.50 P 1273 25.46 P
1455 29.10 S 1321 26.42 S
1487 29.74 P 1627 32.54 P
1591 31.82 S 1813 36.26 S
1629 32.58 P 1971 39.42 P
1711 34.22 S 2029 40.58 S
2317 46.34 P 2127 42.54 P
2325 46.50 S 2405 48.10 S
2347 46.94 P
2407 48.14 S
2447 48.94 P
3772 531 10.62 P 3772 531 10.62 P
549 10.98 S 547 10.94 S
1103 22.06 P 1163 23.26 P
1125 22.50 S 1251 25.02 S
1201 24.02 P 1503 30.06 P
1251 25.02 S 1633 32.66 S
1425 28.50 P 1639 32.78 P
1529 30.58 S 1667 33.34 S
1565 31.30 P 2253 45.06 P
1633 32.66 S 2295 45.90 S
1637 32.74 P
1669 33.38 S
2247 44.94 P
2293 45.86 S
5464 225 4.50 P 5464 233 4.66 P
269 5.38 S 501 10.02 S
277 5.54 P 525 10.50 P
503 10.06 S 713 14.26 S
527 10.54 P 735 14.70 P
711 14.22 S
731 14.62 P
The VSC converters that use Pulse Width Modulation (PWM) technique generate a small amount of harmonics at the multiples of PWM switching frequency (in the 1 to 2kHz range) and its sidebands as
PDF created with pdfFactory Pro trial version www.pdffactory.com

EirGrid plc Investigating the Impact of HVdc Schemes in the Irish Transmission Network
Final Report
R1116.03.04, Page 115 Oct-18, 2009
© TransGrid Solutions Inc, 2009
explained in section 8.7. If there is series resonance at the VSC switching or sideband frequencies, these harmonic currents may propagate into the system as with a LCC configuration described above. As the switching frequency of a VSC can be selected (has impacts on losses), the harmonics of concern can usually be moved away from the resonance point, but care must be taken for harmonics resonances in the range of 20 to 40. For both the LCC and VSC, parallel resonances at or near the 2nd or 4th are of concern as during the initial energization of the transformers, saturation may occur. If it does occur, and a parallel resonance does exist at the 2nd or 4th, large voltage distortions may occur. These harmonic voltages will then affect the converter operation causing it to produce second harmonic and dc currents which will in turn push transformer further into saturation. The final result could be a sustained or very slow decaying distortion in voltages. Based on the above description, harmonic resonances at the 5th, 7th, 11th,13th , 23rd and 25th must be identified for the LCC option. Resonances between 20 and 40 must be identified for the VSC option. Parallel resonances at the 2nd and 4th must be identified for both the VSC and LCC option Since only 4 possible scenarios were looked at for this study, a wide error margin was used when determining if a harmonic resonance will be an issue. If an LCC is considered the following harmonic resonances must be considered:
Turleenan (90120) Parallel: 2,4,5,7,11 Series: 23,25
mid Cavan (3772) Parallel: 7 Series: 23
Woodland (5464) Parallel: 2,7,13 For the VSC option, the following resonances must be considered:
Turleenan (90120) Series: 22 to 35 mid Cavan (3772) Series: 22 to 36 Woodland (5464) Series: N/A
For both the LCC and VSC, care must be taken when adding any shunt elements for filtering (or adding reactive support) as this will change the system impedance and may shift some of the resonances. Further to this, due to the potential parallel AC/dc paths between the 3 buses to which the dc will be connected, care must be taken to undertake a coordinated AC filter study to ensure that no filter becomes overloaded, or resonant conditions are introduced to other buses. It should be noted that none of these resonance conditions are a determining factor in selecting one transmission alternative (LCC, VSC or AC) over another. The identified possible issues can be resolved by proper design or additional equipment. For instance excessive harmonic distortion at transformer or filter bank energization can be limited using breakers equipped with pre-insertion resistors. The above analysis is a word of caution about where to look for potential problems.
PDF created with pdfFactory Pro trial version www.pdffactory.com
EirGrid plc Investigating the Impact of HVdc Schemes in the Irish Transmission Network
Final Report
R1116.03.04, Page 116 Oct-18, 2009
© TransGrid Solutions Inc, 2009
9.8. SSR Screening
Unit Interaction Factor is defined as (Power System Stability and Control by Prabha Kundur [2], page 1049):
2
1
−=
t
g
g
dc
SCSC
MVAMVA
UIF
Where:
=dcMVA MVA rating of the dc system
=gMVA MVA rating of the generator
=gt SCSC , short-circuit capacity at the dc commutating bus (excluding ac filters) with and without the generator, respectively. This is a Sub Synchronous Resonance screening index. The index is the product of two indicators of SSR; namely (a) the relative rating of the generator and (b) the electrical distance between the HVdc converter terminal and the generating unit. The term within parentheses calculated in terms of SC is a measure of the electrical distance. The AC filters are removed from the network for the above calculations. It is recommended that further detailed studies be performed if the UIF is greater than 0.1. The index UIF is only an empirical formula for screening of SSR risk. Unit Interaction Factors were calculated under four different power flow scenarios. For each of the scenario, the UIF is calculated for each converter terminal. The UIF values calculated for all conditions are well below the threshold value of 0.1 recommended for further studies. Therefore in this case there is no need for further SSR studies. Table 9.22 summarizes the largest of the UIF values calculated. The above UIF formula has been proposed for single terminal (conventional) HVdc converter terminals. However, the very small values obtained for the UIF of multi-terminal bus at mid Cavan suggests that the risk of SSR is low. For power flow case 2.1, the UIF is calculated only for the converter buses at Woodland and Turleenan. In this scenario there are no generators switched on in the vicinity of the converter bus at mid Cavan. For each converter bus, the equivalent impedance (Z) of the network and the SC are shown in the first row (Base Case). Then for each generating unit, Z without that unit, SC without that unit and the UIF are shown. All UIF values are well below the threshold of 0.1.
PDF created with pdfFactory Pro trial version www.pdffactory.com

EirGrid plc Investigating the Impact of HVdc Schemes in the Irish Transmission Network
Final Report
R1116.03.04, Page 117 Oct-18, 2009
© TransGrid Solutions Inc, 2009
Table 9.22. Unit Interaction Factors.
9.9. Summary of Overall Study Results for Scenario 2 and 3
The results of the analysis are summarized as follows: • Due to the short transmission distance being considered, the AC option has lower losses compared
to the HVdc options due to the losses associated with the LCC and VSC converters. In the LCC and VSC configurations being studied, the LCC option has lower losses (0.75% per converter station) than the VSC option (1.65% per converter station).
• Steady state contingency analysis showed that the LCC and VSC options have similar impacts to the AC system in terms of overloads. The following overloads appear in both HVdc options, but not in the AC option: o Woodland 380-220 kV transformer (loss of double circuit Louth-Tandragee 275 kV AC lines with
100% of pre-contingency power transferred to the North-South HVdc): 124% (Note that this overload is likely not a concern with 70-80% power transferred to the HVdc which is what the stability studies deemed was needed.)
o Louth-Tandragee 275 kV line (loss of the parallel line): 117% o Tandragee-Turleenan 275 kV line (loss of the parallel line): 104% o Louth 3-winding transformers (loss of parallel transformer or line): 127% (109% in AC option)
Scenario HVdc Terminal System Intact SC (MVA)
Nearby Thermal Generator
SC with Generator Out
(MVA)
UIF
2.1 Woodland 6228 (31271) Irishtown 5776 0.0193 (39471) Moneypoint 6081 0.0028 mid Cavan None n/a n/a Turleenan 5734 (70516) Ballylumford 5471 0.0316 2.2 Woodland 6502 (31271) Irishtown 6182 0.0089 (39471) Moneypoint 6401 0.0012 (49474) Shannonbridge 6460 0.0004 (19471) Cushaling 6442 0.0010 mid Cavan 3423 (35074) Lanesboro 3416 0.0000 Turleenan 5819 (70516) Ballylumford 5597 0.0219 2.3 Woodland 7228 (31271) Irishtown 6969 0.0047 (35771) Longpoint 7206 0.0000 (39471) Moneypoint 7129 0.0009 (49474) Shannonbridge 7198 0.0002 (19471) Cushaling 7181 0.0005 (29763) Huntstown 6930 0.0213 (35771) Longpoint 7206 0.0000 (50573)Seal Rock 7223 0.0000 (51771) Tynagh 7128 0.0011 mid Cavan 3580 (35074) Lanesboro 3575 0.0000 Turleenan 8979 (70516) Ballylumford 8866 0.0024 (70513) Ballylumford 8732 0.0072 (70515) Ballylumford 8683 0.0081 2.4 Woodland 8296 (31271) Irishtown 8123 0.0016 (39471) Moneypoint 8219 0.0004 (49474) Shannonbridge 8267 0.0001 (19471) Cushaling 8253 0.0003 mid Cavan 3578 (35074) Lanesboro 3573 0.0000 Turleenan 6126 (70516) Ballylumford 5940 0.0139 (75508) Coolkearagh 6060 0.0031 (75010)-2 Coleraine 6038 0.0021 (75515) Coolkearagh 5650 0.0349 (75516) Coolkearagh 5919 0.0123 (82001) Kilroot 5631 0.0327 (82002) Kilroot 5631 0.0327
PDF created with pdfFactory Pro trial version www.pdffactory.com

EirGrid plc Investigating the Impact of HVdc Schemes in the Irish Transmission Network
Final Report
R1116.03.04, Page 118 Oct-18, 2009
© TransGrid Solutions Inc, 2009
• Steady state contingency analysis also revealed many slight voltage violations appearing in all of the
AC, LCC and VSC options, however most were not impacted by the HVdc options. The few that were impacted were slight overvoltages at Cavan (highest overvoltage 1.094 pu), Flagford, Moneypoint and Oldstreet, due mainly to increased steady state operating voltage at mid Cavan due to the required filters associated with the LCC HVdc option. A 75 MVAR reactor at Cavan was found to mitigate the overvoltages. The actual LCC filter design would determine the size of reactor required at mid Cavan. No undervoltage or voltage deviation violation impacts were observed, other than several noted at the open-end of a various transformers which were no longer connected to the AC network due to the contingency being studied and were therefore assumed not to require mitigation.
• Summer peak power flow case 2.2 resulted in a significant number of base case (AC option) non-converged cases, thought mainly to be the result of a lack of reactive power in the system. The VSC option had significantly fewer non-converged cases, likely due to its ability to supply large amounts of reactive power.
• Short circuit analysis showed that generally the HVdc options either reduce or have no impact on short circuit levels when compared to the AC option. Any stations whose short circuit level was found to exceed the specified limit in the AC option were either not impacted or were reduced by the HVdc options. Specifically the LCC option contributes no short circuit current to the AC system. However, the VSC option can contribute up to 1.0 pu current, with this current contribution decreasing as bus voltages decrease. An alternative method suggested in the VSC manual is to assume a 0.5 pu current contribution at nearby buses [3]. Therefore, the VSC fault contribution of 0.5 pu current (1.65 kA at Turleenan, 1.05 kA at mid Cavan and 1.2 kA at Woodland) was manually added to each of the VSC terminal buses. The short circuit levels were found to be very similar to or slightly lower than the AC option short circuit levels at the North-South terminal buses.
• The drawback of the HVdc options reducing short circuit levels is the corresponding reduction in
system strength. The Moyle HVdc converter bus in Northern Ireland requires a minimum short circuit level of 1500 MVA. The summer minimum power flow case 2.1 was the weakest case studied (highest wind generation case), and during system intact conditions the Moyle converter bus remains near 2500 MVA for the HVdc options, but for the n-2 case of a double circuit loss of the Louth-Tandragee 275 kV lines the short circuit level at Moyle goes down to approximately 1526 MVA which is just above the minimum limit. The corresponding minimum in the AC option is 2500 MVA for the double circuit AC line outage. Also note this was not the most onerous case because Ballylumford generator was in service; lower Moyle short circuit levels would result if Coolkeeragh were dispatched instead. The HVdc options reduce the Moyle strength by approximately 400 MVA system intact and by 800 MVA for the n-2 condition.
• Transient stability analysis determined the following: o The LCC option was the only option to exceed transient overvoltage criteria of 1.3 pu for several
contingencies, up to a maximum of approximately 1.4 pu for 15 ms particularly in the 275 kV Northern Ireland network near the Moyle converter bus. The AC and VSC options provided better voltage performance.
o No transient frequency range violations were observed in any of the three transmission options. For cases simulation loss of generation, the AC and HVdc options all performed the same: The system was stable and settled to steady state frequencies below the continuous frequency criteria of 49.5 Hz down to 49.2 Hz. However it is assumed that the system frequency via manual operator action would bring the system back up to 50 Hz in a time frame greater than the PSSE simulation. It should be noted that power flow case 2.2 experienced frequency instability for Northern Ireland wind farms and resulted in conventional generators reaching 48.6 Hz. This occurred in the AC option as well as the HVdc options and was not further investigated as it is a base case issue that does not impact the comparison of the options.
PDF created with pdfFactory Pro trial version www.pdffactory.com

EirGrid plc Investigating the Impact of HVdc Schemes in the Irish Transmission Network
Final Report
R1116.03.04, Page 119 Oct-18, 2009
© TransGrid Solutions Inc, 2009
o Rate of change of frequency (df/dt), as measured through selected generator speed measurements, violated the 0.5 Hz/sec criteria in all three transmission options, with no clear indication of one option being consistently worse or better than the other options. All three transmission options performed similarly. The violation of the df/dt criteria may need further investigation, however it does not appear to be a determining factor in terms of comparison criteria.
o No poorly damped oscillations were observed in any of the three options. In terms of comparison
between the three options, there was no clear indication that one option consistently provided better or worse damping than the other options.
o Wind generator tripping occurred at PSSE buses 153 and 203 for all three options due to an
undervoltage that occurred for all four power flow cases. These wind farms are located near Dundalk 110 kV station and tripped for a three-phase fault at the Louth 110 kV bus.
o HVdc pole blocking and VSC DC pole faults did not pose any problems for the HVdc options; the
system response was within criteria for all cases.
o The most difficult contingency to assess was the three-phase fault at Tandragee followed by the double circuit loss of the Tandragee-Louth 275 kV lines. These two AC lines effectively run in parallel to the North-South AC and HVdc options being studied. For the AC option the majority of the pre-contingency power flowing on these lines automatically transfers to the AC line option when the double circuit lines trip and the system recovers well. The HVdc options require special controls to quickly increase power order to take over the pre-contingency power from the double circuit AC line. However during this time when the lines are open, the angles of the Northern Ireland and Republic of Ireland systems drift further apart in the HVdc options than in the AC option. In order to avoid violating transient undervoltage criteria due to a large disturbance on reclosing the double circuit line, the HVdc options require additional time prior to reclosing to allow for the system angles to become closer. Special controls would likely be needed to determine the appropriate reclosing time based on the angle difference between the systems in the HVdc options, and also to adjust HVdc power so as to minimize the difference in system angles. It was found that 70-80% of the pre-contingency power flowing on the double circuit Louth-Tandragee lines should be transferred to the North-South HVdc line during the double circuit line outage. Somewhat improved dynamic performance can be obtained by increasing this to 90% but any more than this provides no added benefit and only serves to create overloads in the Woodland area. Due to the inherent voltage control capability of the VSC, the VSC option provides slightly better voltage performance than the AC option and also provides better performance than the LCC option. However, if reclosing is delayed to a point in time when the system angles have come close enough together, then the LCC option also provides acceptable performance. A STATCOM or SVC could be added to the AC option to provide similar dynamic voltage performance as the VSC option if deemed necessary. Other than voltage performance of the VSC option, there appears to be no significant benefit to the HVdc options when compared to the AC option. In fact the HVdc options showed more oscillatory frequency response compared to the AC option, however it may be possible to design an HVdc controller to aid in damping the frequency oscillations observed in the HVdc options.
o Line-commutated HVdc converters inherently fail commutation for AC system voltage deviations in the range of 10% or more, or for large phase angle shifts. These commutation failures result in a temporary loss of power transmission of the HVdc system. The North-South LCC option failed commutation for many of the system faults being studied, however the system did recover in all cases. It should also be noted that the East-West Interconnector6, because modeled as an LCC link, also failed commutation for a large number of the faults, with the most occurrences seen if the North-South link was also using LCC technology. The VSC option does not fail commutation and is able to transmit reduced power at reduced voltage, as is true for the AC option.
6 The East-West Interconnector has since been awarded as a VSC and the comment regarding commutation failures of the East-West Interconnector no longer applies.
PDF created with pdfFactory Pro trial version www.pdffactory.com

EirGrid plc Investigating the Impact of HVdc Schemes in the Irish Transmission Network
Final Report
R1116.03.04, Page 120 Oct-18, 2009
© TransGrid Solutions Inc, 2009
• Frequency scans determined the following: o There are a number of shunt and series resonances that may be a concern for either the LCC or
VSC options, due to the harmonics generated by either option. o As only four cases where studied, and details of the actual filter configurations of the Moyle and
East-West interconnectors were not available, these scans should only be considered as cursory.
• LCC converters installed near thermal generating units can excite subsynchronous resonances. Unit Interaction Factor is a subsynchronous resonance (SSR) screening index defined as:
2
1
−=
t
g
g
dc
SCSC
MVAMVA
UIF .
The UIF index is only an empirical formula for screening of SSR risk. It is recommended that further detailed studies be performed if the UIF is greater than 0.1. However, in all four power flow cases considered for Scenario 2 there were no instances found in which the UIF was above 0.1. The highest UIF was found to be 0.035.
9.10. Overall Comparison of HVdc Solutions with Equivalent AC Solution
9.10.1. AC Advantages over HVdc
Based on the study results, the AC option had the following technical advantages compared to the HVdc options: • Lower line losses • No overloads of the Woodland 380-220 kV transformer, the Louth-Tandragee 275 kV lines or the
Tandragee-Turleenan 275 kV lines • Higher short circuit levels at the Moyle converter bus • When compared to the LCC option, can still provide reduced power transfer at reduced AC voltages
whereas the LCC option can fail commutation during nearby and remote AC faults causing temporary disruption in power transmission on the HVdc system.
• Does not require a special protection scheme for loss of the double circuit 275 kV lines between Louth and Tandragee.
9.10.2. HVdc Advantages over AC
Based on the study results, the HVdc options had the following technical advantages compared to the AC option: • Reduced fault levels in nearby areas which may potentially result in fewer breaker replacements, if
that is an issue. • The VSC option had improved dynamic voltage performance compared to both the AC and LCC
options. However if it were deemed necessary a STATCOM could be installed with the AC option to provide similar dynamic reactive power support as the VSC option.
The HVdc options can utilize underground cables.
9.10.3. Comparison of LCC and VSC HVdc
Between the two HVdc options, the following general comparisons can be made between the LCC and VSC options: • A VSC does not fail commutation and therefore can still provide reduced power transfer at reduced
AC voltages, whereas the LCC option may fail commutation during nearby and remote AC faults causing temporary disruption in power transmission on the LCC HVdc system.
• A VSC provides steady state and dynamic AC voltage control with a large range of reactive power support. An LCC consumes 50-60% reactive power based on real power loading, but self-
PDF created with pdfFactory Pro trial version www.pdffactory.com

EirGrid plc Investigating the Impact of HVdc Schemes in the Irish Transmission Network
Final Report
R1116.03.04, Page 121 Oct-18, 2009
© TransGrid Solutions Inc, 2009
compensates through the use of filters banks and shunt capacitors. Therefore the VSC is superior in terms of voltage control.
• A disadvantage of a VSC is that for DC pole faults it will draw short circuit current from the AC system and look to the AC system like a remote AC fault plus a pole block, whereas the LCC DC line fault looks to the AC system only pole block. However in a cable system, as was studied for the LCC and VSC options, dc pole faults are very rare.
A special protection system should be implemented for both HVdc options to increase the HVdc power order to take over 70-80% of the pre-contingency Louth-Tandragee flow in the event of the loss of the double circuit Louth-Tandragee 275 kV lines. The 70-80% power transfer level was tested for the four power flow cases studied, which in general represent various year 2020 network topologies from summer minimum to winter maximum loading with varying dispatches of conventional and wind generation. Whether or not the 70-80% value would need to change based on other system topologies not studied in the scenario would require further testing. However, unless another tie line between Northern Ireland and the Republic of Ireland were added, it is not expected that this value would need to change. Such a special protection scheme could consist of something similar to the following, which is what was tested in this study:
• Monitor the power flow in the double circuit Louth-Tandragee lines. • Monitor breaker status of these lines, and if the breakers open to trip the lines, send a signal to
the HVdc controls to increase the power order by the required percentage of pre-contingency Louth-Tandragee double circuit power transfer. Such communication delays would be expected to be in the range of 10 to 15 ms, however 20 ms was modeled to provide some margin of error.
• The HVdc controls can respond within less than one cycle to increase the power order. The actual power will reach the new power order within a few cycles.
Similar special protection systems exist in other HVdc schemes to quickly reduce or increase HVdc power to maintain system stability depending on major transmission lines tripping. For example, in the Nelson River HVDC scheme in Manitoba, a special protection scheme known as “HVDC reduction” is used to quickly reduce the HVdc power order to two LCC HVdc bipoles in the event of loss of various critical transmission lines in the AC system, including tie lines between Manitoba and the United States. The “HVDC reduction” scheme operates under certain pre-determined power flow conditions and adjusts the HVdc power orders according to the pre-contignency power flow that was measured in the particular transmission line that tripped. Because the AC option does not require the special protection scheme it is simpler than the HVdc option. The special protection scheme relies on remote signals and therefore it is prone to error and mis-operation. There may also be some difficulty in fully testing the scheme as it may require critical outages such as taking the double circuit out of service. However, these issues are not unique to this scheme and are common among protection systems that rely on remote signals. In addition, both HVdc options could be designed with a controller to monitor the phase angle difference between the two systems when the double circuit Louth-Tandragee lines are out of service in order to further adjust the HVdc power transfer to minimize the angle difference between the North and South. AC line reclosing should be delayed until the phase angle difference is minimized. Please note this study did not consider or model such a controller.
9.11. Recommendations
The studies show that the AC and HVdc options are all technically feasible and each option could be integrated into the network provided that the relevant protection, control and telecommunication systems for these HVdc technologies and their interactions are sufficiently robust to maintain the safety, reliability and security of the Irish network. The same requirements would be true for the installation of any new transmission scheme. However, it should be noted that there has not yet been an application in service of
PDF created with pdfFactory Pro trial version www.pdffactory.com

EirGrid plc Investigating the Impact of HVdc Schemes in the Irish Transmission Network
Final Report
R1116.03.04, Page 122 Oct-18, 2009
© TransGrid Solutions Inc, 2009
a multi-terminal DC link (DC network) embedded in a meshed AC network, either using LCC or VSC technology. Having carried out a technical comparison of HVdc versus HVAC technology for this circuit it was found that there are no significant technical reasons to select HVdc over HVAC. The VSC option did show improved dynamic voltage performance over the AC option, however if it were deemed necessary a STATCOM could be installed with the AC option to provide similar dynamic reactive power support as the VSC option. The AC option showed significantly lower losses, fewer overloads in the Louth/Tandragee/Turleenan area and a stronger system at Moyle than both HVdc options. The HVdc options were shown to require a special protection system in the event of the loss of the double circuit Louth-Tandragee 275 kV lines, whereas the AC option did not require such a special protection system. Typical applications of HVdc systems include: • Transmission with overhead line distances above 1 000 km, where the need of various intermediate
tapings is not present; • Interconnecting systems with different frequencies (50 Hz to 60 Hz); • Undersea or underground cables with lengths around 50 km or more; • Need for asynchronous operation (even at the same frequency base), like interconnection of different
markets. • Need for absolute power scheduling The only application that really applies to the situation being studied in this report is the use of HVdc cables. Typical applications of HVdc can also provide benefits such as power oscillation damping and frequency control. An HVdc power order can be quickly changed by an external signal (that should indicate a change in the network is taking place) as an additional signal in the power order scheduling. Power oscillation damping was not observed to be an issue in this study. Use of HVdc controls to achieve steady state or longer term frequency control is not expected to be applicable in the Irish network because the HVdc is being integrated into a meshed AC network, however frequency control was not modeled in this study and would therefore require further investigation to make any definite conclusions. It is not a case of being able to transfer excess generation from one area to another area that is deficient in generation as could typically be the case with an HVdc link connecting two isolated systems. A meshed AC network with embedded HVdc circuits can impose an added complexity to future network planning and expansion. For instance when planning the system it is difficult and expensive to tap into an existing HVdc circuit whereas an AC circuit can be easily tapped to serve new load or build a new AC station and lines. Based on the selected power flow cases and contingencies that were studied, there were no significant technical advantages identified for the use of HVdc transmission instead of AC transmission for the North-South Interconnector. VSC HVdc links have the benefit of inherent reactive power support. Both LCC and VSC HVdc links can utitlize underground cables, and if built as a bipole provide extra reliability. It was assumed that for both of the HVdc options considered in this study that HVdc underground cable would be used for the connections rather than HVdc overhead line. The fact that the selection of an HVdc option would make underground cable a more attractive option is not in and of itself sufficient justification for selecting an HVdc option over the HVAC option. To make such a decision it is necessary to compare the two technologies across the full range of relevant criteria, including environmental, technical and economical. This study merely comprises a technical comparison of the two technologies. An environmental and economic comparison is beyond its scope. It is on this basis that it was concluded that for the scenarios and contingencies that were studied, there were no significant technical avantages
PDF created with pdfFactory Pro trial version www.pdffactory.com

EirGrid plc Investigating the Impact of HVdc Schemes in the Irish Transmission Network
Final Report
R1116.03.04, Page 123 Oct-18, 2009
© TransGrid Solutions Inc, 2009
identified for the use of an HVdc circuit in place of the HVAC circuit proposed for the new North-South Interconnector.
PDF created with pdfFactory Pro trial version www.pdffactory.com

EirGrid plc Investigating the Impact of HVdc Schemes in the Irish Transmission Network
Final Report
R1116.03.04, Page 124 Oct-18, 2009
© TransGrid Solutions Inc, 2009
10. Scenario Four: Drawing Power Out of the Cork Area Scenario 4 involves drawing power out of the congested area near Cork by building new transmission between Glanagow-Cahir-Kilkenny-Loughteeog. Figure 10.1 shows the proposed route and termination locations for this scenario.
Figure 10.1. Proposed route and termination locations for Scenario 4.
The following points describe this scenario in further detail:
• The power flow case for this scenario is based on a year 2020 Summer Peak case.
PDF created with pdfFactory Pro trial version www.pdffactory.com

EirGrid plc Investigating the Impact of HVdc Schemes in the Irish Transmission Network
Final Report
R1116.03.04, Page 125 Oct-18, 2009
© TransGrid Solutions Inc, 2009
• The length of the circuit is approximately 210 km (direct distance from Glanagow to Knockraha +
direct distance from Knockraha to Cahir + direct distance from Cahir to Loughteeog) * margin of uncertainty (1.25)
• The power flow entering the Glanagow end of the line in the equivalent AC solution is used at the sending end of the HVdc solutions.
10.1. Transmission Options
Three alternatives are considered for this scenario as described below; one AC option and two VSC HVdc options.
10.1.1. AC Alternative
The AC alternative consists of three 220 kV AC overhead lines each rated at 1000 MVA. The AC lines are connected from Glanagow to Cahir, from Cahir to Kilkenny and from Kilkenny to Loughteeog as per Grid Development Strategy 2025, as shown in Figure 10.1.
Figure 10.1. Diagram of AC option.
10.1.2. HVdc Alternatives
10.1.2.1. VSC Option 1 The first HVdc scheme consists of three two-terminal bipolar Voltage Source Converter (VSC) based HVdc links connecting the terminals from Glanagow to Cahir, Cahir to Kilkenny and Kilkenny to Loughteeog, as shown in Figure 10.2.
The Methodology Workshop defined the following:
• All links are bidirectional, bipolar and rated at 1424 MW (to match the AC line rating) and 300 kV.
• XLPE underground cables are used.
• HVdc terminals are located at Loughteeog 400 kV station, Cahir 110 kV station, Kilkenny 110 kV station and Glanagow 220 kV station.
Please note that the Glanagow terminal is actually connected to the Aghada 220 kV bus and the Loughteeog terminal is actually connected to the Laois 380 kV bus.
Aghada Cahir Kilkenny Laois
PDF created with pdfFactory Pro trial version www.pdffactory.com
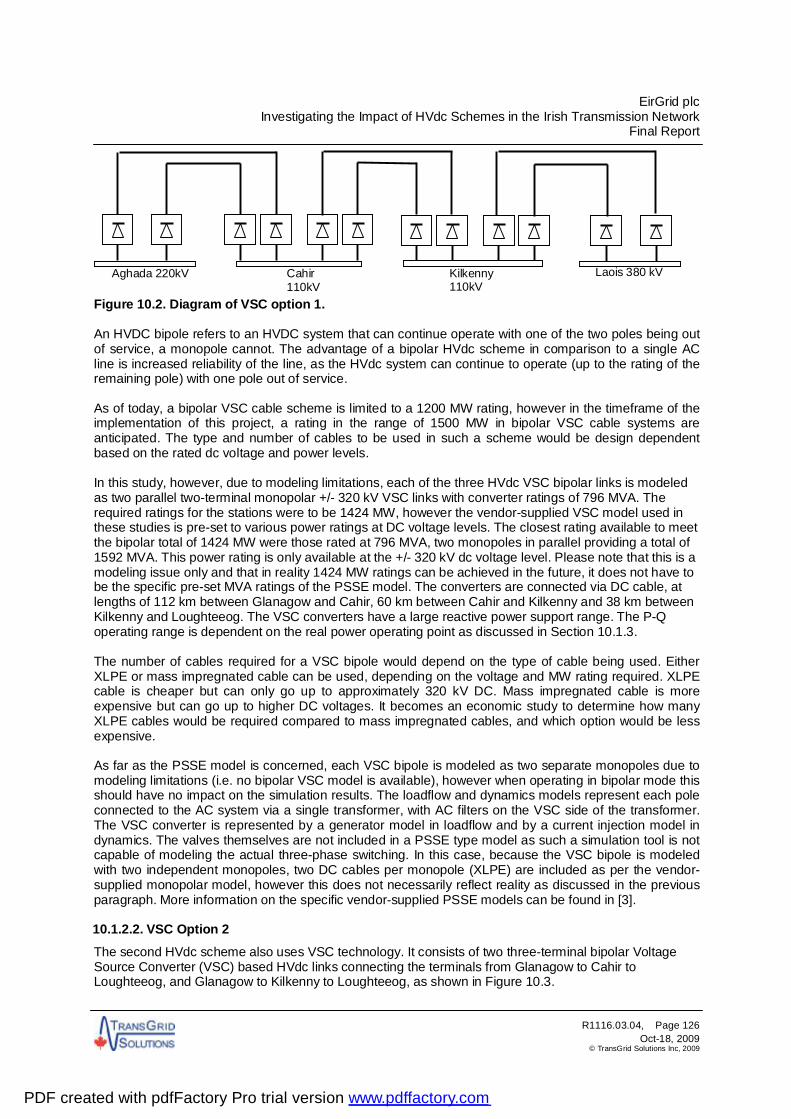
EirGrid plc Investigating the Impact of HVdc Schemes in the Irish Transmission Network
Final Report
R1116.03.04, Page 126 Oct-18, 2009
© TransGrid Solutions Inc, 2009
Figure 10.2. Diagram of VSC option 1. An HVDC bipole refers to an HVDC system that can continue operate with one of the two poles being out of service, a monopole cannot. The advantage of a bipolar HVdc scheme in comparison to a single AC line is increased reliability of the line, as the HVdc system can continue to operate (up to the rating of the remaining pole) with one pole out of service. As of today, a bipolar VSC cable scheme is limited to a 1200 MW rating, however in the timeframe of the implementation of this project, a rating in the range of 1500 MW in bipolar VSC cable systems are anticipated. The type and number of cables to be used in such a scheme would be design dependent based on the rated dc voltage and power levels. In this study, however, due to modeling limitations, each of the three HVdc VSC bipolar links is modeled as two parallel two-terminal monopolar +/- 320 kV VSC links with converter ratings of 796 MVA. The required ratings for the stations were to be 1424 MW, however the vendor-supplied VSC model used in these studies is pre-set to various power ratings at DC voltage levels. The closest rating available to meet the bipolar total of 1424 MW were those rated at 796 MVA, two monopoles in parallel providing a total of 1592 MVA. This power rating is only available at the +/- 320 kV dc voltage level. Please note that this is a modeling issue only and that in reality 1424 MW ratings can be achieved in the future, it does not have to be the specific pre-set MVA ratings of the PSSE model. The converters are connected via DC cable, at lengths of 112 km between Glanagow and Cahir, 60 km between Cahir and Kilkenny and 38 km between Kilkenny and Loughteeog. The VSC converters have a large reactive power support range. The P-Q operating range is dependent on the real power operating point as discussed in Section 10.1.3. The number of cables required for a VSC bipole would depend on the type of cable being used. Either XLPE or mass impregnated cable can be used, depending on the voltage and MW rating required. XLPE cable is cheaper but can only go up to approximately 320 kV DC. Mass impregnated cable is more expensive but can go up to higher DC voltages. It becomes an economic study to determine how many XLPE cables would be required compared to mass impregnated cables, and which option would be less expensive. As far as the PSSE model is concerned, each VSC bipole is modeled as two separate monopoles due to modeling limitations (i.e. no bipolar VSC model is available), however when operating in bipolar mode this should have no impact on the simulation results. The loadflow and dynamics models represent each pole connected to the AC system via a single transformer, with AC filters on the VSC side of the transformer. The VSC converter is represented by a generator model in loadflow and by a current injection model in dynamics. The valves themselves are not included in a PSSE type model as such a simulation tool is not capable of modeling the actual three-phase switching. In this case, because the VSC bipole is modeled with two independent monopoles, two DC cables per monopole (XLPE) are included as per the vendor-supplied monopolar model, however this does not necessarily reflect reality as discussed in the previous paragraph. More information on the specific vendor-supplied PSSE models can be found in [3]. 10.1.2.2. VSC Option 2 The second HVdc scheme also uses VSC technology. It consists of two three-terminal bipolar Voltage Source Converter (VSC) based HVdc links connecting the terminals from Glanagow to Cahir to Loughteeog, and Glanagow to Kilkenny to Loughteeog, as shown in Figure 10.3.
Aghada 220kV Cahir 110kV
Kilkenny 110kV
Laois 380 kV
PDF created with pdfFactory Pro trial version www.pdffactory.com
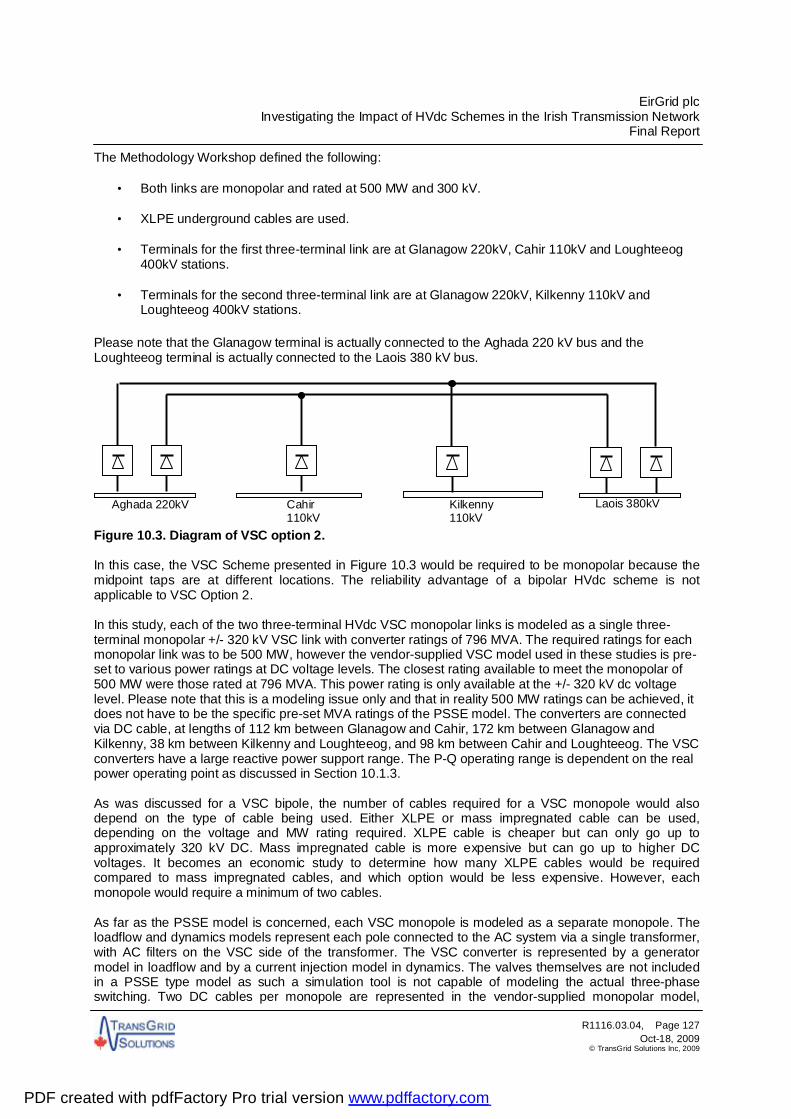
EirGrid plc Investigating the Impact of HVdc Schemes in the Irish Transmission Network
Final Report
R1116.03.04, Page 127 Oct-18, 2009
© TransGrid Solutions Inc, 2009
The Methodology Workshop defined the following:
• Both links are monopolar and rated at 500 MW and 300 kV.
• XLPE underground cables are used.
• Terminals for the first three-terminal link are at Glanagow 220kV, Cahir 110kV and Loughteeog 400kV stations.
• Terminals for the second three-terminal link are at Glanagow 220kV, Kilkenny 110kV and Loughteeog 400kV stations.
Please note that the Glanagow terminal is actually connected to the Aghada 220 kV bus and the Loughteeog terminal is actually connected to the Laois 380 kV bus.
Figure 10.3. Diagram of VSC option 2. In this case, the VSC Scheme presented in Figure 10.3 would be required to be monopolar because the midpoint taps are at different locations. The reliability advantage of a bipolar HVdc scheme is not applicable to VSC Option 2. In this study, each of the two three-terminal HVdc VSC monopolar links is modeled as a single three-terminal monopolar +/- 320 kV VSC link with converter ratings of 796 MVA. The required ratings for each monopolar link was to be 500 MW, however the vendor-supplied VSC model used in these studies is pre-set to various power ratings at DC voltage levels. The closest rating available to meet the monopolar of 500 MW were those rated at 796 MVA. This power rating is only available at the +/- 320 kV dc voltage level. Please note that this is a modeling issue only and that in reality 500 MW ratings can be achieved, it does not have to be the specific pre-set MVA ratings of the PSSE model. The converters are connected via DC cable, at lengths of 112 km between Glanagow and Cahir, 172 km between Glanagow and Kilkenny, 38 km between Kilkenny and Loughteeog, and 98 km between Cahir and Loughteeog. The VSC converters have a large reactive power support range. The P-Q operating range is dependent on the real power operating point as discussed in Section 10.1.3. As was discussed for a VSC bipole, the number of cables required for a VSC monopole would also depend on the type of cable being used. Either XLPE or mass impregnated cable can be used, depending on the voltage and MW rating required. XLPE cable is cheaper but can only go up to approximately 320 kV DC. Mass impregnated cable is more expensive but can go up to higher DC voltages. It becomes an economic study to determine how many XLPE cables would be required compared to mass impregnated cables, and which option would be less expensive. However, each monopole would require a minimum of two cables. As far as the PSSE model is concerned, each VSC monopole is modeled as a separate monopole. The loadflow and dynamics models represent each pole connected to the AC system via a single transformer, with AC filters on the VSC side of the transformer. The VSC converter is represented by a generator model in loadflow and by a current injection model in dynamics. The valves themselves are not included in a PSSE type model as such a simulation tool is not capable of modeling the actual three-phase switching. Two DC cables per monopole are represented in the vendor-supplied monopolar model,
Aghada 220kV Cahir 110kV
Kilkenny 110kV
Laois 380kV
PDF created with pdfFactory Pro trial version www.pdffactory.com

EirGrid plc Investigating the Impact of HVdc Schemes in the Irish Transmission Network
Final Report
R1116.03.04, Page 128 Oct-18, 2009
© TransGrid Solutions Inc, 2009
however this does not necessarily reflect reality as discussed in the previous paragraph. More information on the specific vendor-supplied PSSE models can be found in [3]. 10.1.2.3. VSC in Reality In reality, if a Scenario 4 VSC scheme were actually to be built, it would likely be comprised of a four-terminal bipolar VSC link as shown in Figure 10.4. The reason originally in the Methodology Workshop for deciding to study the VSC Options 1 and 2 as presented in Sections 10.1.2. and 10.1.3 was due to modeling limitations. As of today, a bipolar VSC cable scheme is limited to a 1200 MW rating, however in the timeframe of the implementation of this project, a rating in the range of 1500 MW in bipolar VSC cable systems are anticipated. The type and number of cables to be used in such a scheme would be design dependent based on the rated dc voltage and power levels.
Figure 10.4. Diagram of a four-terminal bipolar VSC link. A four-terminal VSC bipolar link, although requiring more complex controls due to the increased number of terminals, would require the least amount of cables and the least number of converters compared to VSC Options 1 and 2, and would therefore be more economical than what was modeled in the study. For example, VSC Option 1 (three two-terminal bipoles) would require double the amount of converters at Cahir and Kilkenny. VSC Option 2 (two three-terminal monopoles) would require double the number of cables. The expected impact to the study results would be as follows: VSC Option 1 would result in:
• Higher VSC losses due to two extra converters each at Cahir and Kilkenny • Higher short circuit contribution at Cahir and Kilkenny due to two extra converters at each these
stations • Higher reactive power capability at Cahir and Kilkenny due to two extra converters at each of
these stations
10.1.3. Reactive Power Exchange with AC System
Voltage source converters have a large range of fast reactive supply and absorption capability however the reactive power capability depends on the real power transmission. The vendor-supplied model used in this study has the typical per unit P-Q operating diagram shown in Figure 10.5 (figure taken from [3]). This diagram demonstrates that when operating at a real power level near the MVA rating of the VSC, the reactive power capability is significantly less than if operating at a lower power level, in fact the reactive power capability shown in Figure 10.5 is near 0 MVAR at 1 pu real power. The reactive power can be controlled independently at each station. Please note that this P-Q diagram is typical and vendor-specific and does not necessarily reflect the P-Q operating curve of VSCs supplied by other vendors. Also note that the P-Q diagram refers to the converter only. There are filters located on the AC bus on the VSC side of the transformer which are not accounted for in the P-Q diagram. The rating of the filters depends on the rating of the converter (comments as per previous scenarios). Each 796 MVA VSC link as modeled in this scenario has 119.4 MVAR of filters (capacitance).
Aghada 220 kV Cahir 110 kV Kilkenny 110 kV Laois 380 kV
PDF created with pdfFactory Pro trial version www.pdffactory.com

EirGrid plc Investigating the Impact of HVdc Schemes in the Irish Transmission Network
Final Report
R1116.03.04, Page 129 Oct-18, 2009
© TransGrid Solutions Inc, 2009
Figure 10.5. VSC P-Q diagram (converter only). Source: ABB. An AC line loaded to its surge impedance loading will neither consume nor supply reactive power to the AC system. Operating below surge impedance loading, an AC line will supply reactive power; operating above surge impedance loading an AC line will absorb reactive power. Figure 10.5 below shows the P-Q diagram and the range of reactive power supply and consumption for the AC option for the three 400 kV lines from Glanagow to Cahir, from Cahir to Kilkenny and from Kilkenny to Loughteeog.
Figure 10.5. AC Line P-Q diagram.
PDF created with pdfFactory Pro trial version www.pdffactory.com

EirGrid plc Investigating the Impact of HVdc Schemes in the Irish Transmission Network
Final Report
R1116.03.04, Page 130 Oct-18, 2009
© TransGrid Solutions Inc, 2009
10.2. Contingencies
10.2.1. Steady State Analysis
All n-1 contingencies for all 110 kV and above as well as several key double circuit outage conditions were studied.
10.2.2. Transient Stability Analysis
Table 10.1 describes the system disturbances that were applied to perform the transient stability analysis.
Table 10.1. Dynamic Contingencies. Fault At Fault cleared by Contingency
Bus kV 3ph/1ph
Fault duration tripping
Reclosing time
1_0_X Permanent single pole block of VSC Option 1 1_0_P1 Permanent block of VSC Pole-1 in VSC Option 2 1_0_P2 Permanent block of VSC Pole-2 in VSC Option 2
2_1_X 1062 (AGHADA3) 220 1ph 0.3s
AC Option 1062, 2852, ckt 1 – Aghada-Glanagow 220kV 1044-1062-10422 ckt 1 – Aghada 380-220kV VSC Options 1 and 2 1062- 2852, ckt 1 – Aghada-Glanagow 220kV 1062- 330 ckt 1 – Aghada VSC transformer 1 1062- 331 ckt 1 – Aghada VSC transformer 1
No reclose for breaker failure
2_3_L1 1062 (AGHADA3) 220 3ph 0.08s 1062 - 2852, 1– Aghada-Glanagow 220kV 0.68s
2_3_L2 1062 (AGHADA3) 220 3ph 0.08s 1062 - 4722, 1– Aghada-Raffeen 220kV 0.68s
2_3_L3 1062 (AGHADA3) 220 3ph 0.08s 1062 -1041 -10421, 2 - Aghada 380-220kV No reclose for
transformer
3_1_X 1721 (CAHIR) 110 1ph 0.3s
AC Option 1 1721-1891-ckt 1 – Cahir-Kill Hill 110kV 1721-5381- ckt1 – Cahir-Tipperary 110 kV 1724-1721-17221 ckt1- Cahir 380-110kV 1 1724-1721-17222 ckt2 - Cahir 380-110kV 2 VSC Option 1 1721-1891-ckt 1– Cahir-Kill Hill 110kV 1721-5381- ckt1– Cahir-Tipperary 110 kV 1721-340 ckt1- Cahir VSC transformer 1 1721-341 ckt1- Cahir VSC transformer 2 1721-345 ckt1- Cahir VSC transformer 3 1721-346 ckt1- Cahir VSC transformer 4 VSC Option 2 [1721-1891-ckt 1– Cahir-Kill Hill 110kV 1721-5381- ckt1– Cahir-Tipperary 110 kV 1721-340 ckt1- Cahir VSC transformer
No reclose for breaker failure
3_3_L1 1721 (CAHIR) 110 3ph 0.15s 1721 - 2161, 1 – Cahir-Doon 110 kV 0.75s 3_3_L2 1721 (CAHIR) 110 3ph 0.15s 1721 - 1891, 1- Cahir-Kill Hill 110 kV 0.75s
3_3_L3 1721 (CAHIR) 110 3ph 0.15s 1721 - 17204, 1 – Cahir 110-38kV No reclose for transformer
3_3_L4 1721 (CAHIR) 110 3ph 0.15s 1721 - 14619, 1 – Cahir-Barrym ore T 110kV 0.75s 3_3_L5 1721 (CAHIR) 110 3ph 0.15s 1721 - 5381, 1– Cahir-Tipperary 110 kV 0.75s
4_1_X 3261 (KILKENNY) 110 1ph 0.3s
AC Option 1 3261-3341-ckt1 – Kilkenny-Kellis 110kV 3261-32604- ckt 1- Kilkenny 110-38 kV 3441-3261- ckt1 – Kilkenny-Kilmurry 110kV 3264-3261-32621 ckt1- Kilkenny 380-110kV 1 3264-3261-32622 ckt2- Kilkenny 380-110kV 2 VSC Option 1 3261-3341-ckt1– Kilkenny-Kellis 110kV 3261-32604- ckt1- Kilkenny 110-38 kV 3441-3261- ckt1 – Kilkenny-Kilmurry 110kV 3261-350 ckt1 – Kilkenny VSC transformer 1 3261-351 ckt1– Kilkenny VSC transformer 2 3261-355 ckt1– Kilkenny VSC transformer 3 3261-356 ckt1– Kilkenny VSC transformer 4 VSC Option 2
No reclose for breaker failure
PDF created with pdfFactory Pro trial version www.pdffactory.com

EirGrid plc Investigating the Impact of HVdc Schemes in the Irish Transmission Network
Final Report
R1116.03.04, Page 131 Oct-18, 2009
© TransGrid Solutions Inc, 2009
Fault At Fault cleared by Contingency Bus kV 3ph/1ph
Fault duration tripping Reclosing time
3261-3341-ckt1– Kilkenny-Kellis 110kV 3261-32604- ckt 1- Kilkenny 110-38 kV 3441-3261- ckt1– Kilkenny-Kilmurry 110kV 3261-351 ckt1– Kilkenny VSC transformer
4_3_L1 3261 (KILKENNY) 110 3ph 0.15s 3261-1431, 1 – Kilkenny-Ballyragget 110kV 0.75s
4_3_L2 3261 (KILKENNY) 110 3ph 0.15s 3261-32604, 1- Kilkenny 110-38 kV No reclose for
transformers
4_3_L3 3261 (KILKENNY) 110 3ph 0.15s 3261-3441, 1– Kilkenny-Kilmurry 110kV 0.75s
4_3_L4 3261 (KILKENNY) 110 3ph 0.15s 3261-3341, 1 – Kilkenny-Kellis 110kV 0.75s
5_1_X 3554 (LAOIS) 380 1ph 0.3s 3344-3554 ckt 1 – Laois-Kellis 380kV 3554-35511-35542 ckt 2- Laois 380-110 kV
No reclose for breaker failure
5_3_L1 3554 (LAOIS) 380 3ph 0.08s 3554 -2204, 1 – Laois-Dunstown 380kV 0.68s 5_3_L2 3554 (LAOIS) 380 3ph 0.08s 3554 -5494, 1 – Laois-WMD400 380kV 0.68s 5_3_L3 3554 (LAOIS) 380 3ph 0.08s 3554 -3344, 1 – Laois-Kellis 380kV 0.68s
5_3_L4 3554 (LAOIS) 380 3ph 0.08s 3554-3551-35541, 1 – Laois 380-110kV 1 No reclose for transformers
5_3_L5 3554 (LAOIS) 380 3ph 0.08s 3554-35511-35542, 2 – Laois 380-110kV 2 No reclose for transformers
6_X_X 2852 (GLANAGOW) 220 1ph 0.06s 2852-28571, 1 & gen at 28571 – Glanagow
generation No reclose for gens
7_X_X 3122 (IRISH TOWN) 220 1ph 0.06s 3122-31271 , 1 & gen at 31271 – Irishtown
generation No reclose for gens
10.3. Power Flows Cases and Losses
The power flow cases for the HVdc (VSC) options were created by removing the 400 kV AC lines between Glanagow-Cahir-Kilkenny-Loughteeog from service and replacing them with the two VSC options operating at the same power transfers as the AC line was transferring in the given power flow case. Transmission losses in the AC line, the two-terminal VSC HVdc system (VSC Option 1) and the three-terminal VSC HVdc system (VSC Option 2) were calculated and compared. According to the VSC manuals [3], each VSC converter has losses of 1.65% at nominal (rated) MVA loading, with 30% fixed losses and 70% variable plus the losses in the DC line. Table 10.2 summarizes the losses in the AC lines and in the two VSC HVdc systems. Table 10.2. Comparison of Total Losses for the Three Options.
AC Lines (MW)
VSC Option 1 (MW)
VSC Option 2 (MW)
26.3 75.4 36.2 Because the transmission distance is relatively short, the AC option has lower losses than both of the VSC options. The VSC option with three two-terminal links (VSC Option 1) has approximately double the losses of the VSC option with two three-terminal links (VSC Option 2) due to the higher number of VSC converters involved.
10.3.1. Steady State Contingency Analysis
Steady state contingency analysis was performed on the power flow case described in Table 5.1. It was observed that there were several voltage collapse situations due to a lack of reactive power support in the base power flow case that was provided. The mitigation measures taken to prevent the issue are described as follows:
PDF created with pdfFactory Pro trial version www.pdffactory.com

EirGrid plc Investigating the Impact of HVdc Schemes in the Irish Transmission Network
Final Report
R1116.03.04, Page 132 Oct-18, 2009
© TransGrid Solutions Inc, 2009
• The voltage near the Thurles 110kV bus severely dropped when either Thurles-Kill Hill 110kV line or Kill Hill-Cahir 110 kV line was tripped. This was observed in the AC and VSC options. The voltage collapse was mitigated by increasing the Thurles switched capacitor to 135 MVAR (9*15 MVAR) from 30 MVAR (2*15 MVAR).
• In the AC option only, the power flow cases could not be solved when the Oldstreet-Woodland 400kV line or Carrickmines-Charlesland 220kV line was tripped. These problems were mitigated by providing some reactive power support in the Loughteeog area. A switched capacitor of 250 MVAR (5*50MVAR) was added at Portlaoise 110 kV bus as a mitigation measure. In reality this would be considered to be over-compensated and would likely need a new line in the area and/or some amount of dynamic reactive power compensation. Although this switched capacitor was not required in the VSC options to prevent voltage collapse, the switched capacitor was kept in the VSC options for consistency.
These mitigation measures were applied to the power flow cases used in the steady state contingency analysis as well in the transient stability analysis.
10.3.2. Overload Impacts
There were many overloads observed throughout and common to the AC and VSC options, some overloads being the same for the AC and VSC options, some slightly impacted by only a few percent. However, the overloads of interest to this study are those that are significantly impacted by the VSC options when compared to the AC option. Table 10.3 summarizes the overloads impacted by the VSC options when compared to the AC option. Appendix C-2 contains the full listing of contingency analysis results. Table 10.3. Worst Overload Impacts.
Worst Overloads (%) Rating Line
MVA
Contingency
AC VSC-1 VSC-2 380kV
3202 KNOCKRAHA 220.00 3282*KILLONAN 220.00 1 286 Glen-NewTrien 220 kV 106.8 111.9 112.2
110kV
1441 BANDON 110.00 2221*DUNMANWAY 110.00 1 107 Glanagow 220-19 kV 104.0 113.4 113.3
1721 CAHIR 110.00 5381*TIPPERARY 110.00 1 107 Cahir-Kill Hill 110 kV 105.6 121.0 120.5
1721 CAHIR 110.00 14619*BARRYMORE T 110.00 1 107 Cahir-Kill Hill 110 kV <100 113.7 113.3
2001 CULLENAG H 110.00 2141*DUNGARVAN 110.00 1 107 Cullenagh-Knockraha 220 kV 126.4 141.6 141.1
3961*MARINA 110.00 5181 TRABEG 110.00 2 79 Glanagow 220-19 kV 117.9 147.5 147.4
5271*TOEM 110.00 5381 TIPPERARY 110.00 1 107 Cahir-Kill Hill 110 kV 123.1 137.1 136.7
In terms of power flow there is not much difference between the two VSC options, both show very similar overload impacts compared to the AC option. The major differences in the overloads between the AC and VSC options are described below. The Knockraha-Killonan 220 kV line becomes overloaded to approximately 112% for both VSC HVdc cases following the loss of the Glenlara-NewTrien 220 kV line. The AC option shows a worst case overload of 106.8% for the same outage. The Bandon-Dunmanway 110 kV line becomes overloaded to approximately 113% for both VSC HVdc cases following the loss of the Glanagow 220 kV /20 kV transformer. The AC option shows a worst case overload of 104% following the loss of Laois-Woodland 380 kV line.
PDF created with pdfFactory Pro trial version www.pdffactory.com

EirGrid plc Investigating the Impact of HVdc Schemes in the Irish Transmission Network
Final Report
R1116.03.04, Page 133 Oct-18, 2009
© TransGrid Solutions Inc, 2009
The Cahir-Tipperary 110 kV line becomes overloaded to approximately 121% for both VSC HVdc cases following the loss of the Cahir-Kill Hill 110 kV line. The AC option shows a worst case overload of 105.6% following the loss of Laois-Woodland 380 kV line. The Cahir-Barrymore T 110 kV line becomes overloaded to approximately 114% for both VSC HVdc cases following the loss of the Cahir-Kill Hill 110 kV line. The AC option does not show an overload for the contingencies applied. The Cullenagh-Dungarvan 110 kV line becomes overloaded to approximately 142% for both VSC HVdc cases following the loss of the Cullenagh-Knockraha 220 kV line. The AC option shows a worst case overload of 126.4% for the same outage. The Marina-Trabeg 110 kV circuit-2 becomes overloaded to approximately 148% for both VSC HVdc cases following the loss of the Glanagow 220 kV /20 kV transformer. The AC option shows a worst case overload of 118% following the loss of Bandon-Dunmanway 110 kV line. The Toem-Tipperary 110 kV line becomes overloaded to approximately 137% for both VSC HVdc cases following the loss of the Cahir-Kill Hill 110 kV line. The AC option shows a worst case overload of 123.1% following the loss of Laois-Woodland 380 kV line. 10.3.2.1. Re-dispatch VSC to Reduce Congestion One of the important aspects of Scenario 4 is the transmission congestion in the area of study. A purpose of the study is to investigate whether or not it may be possible to use power scheduling flexibility of the VSC links to relieve congestion rather than constraining generation and/or uprating lines in the area. Because the VSC links are integrated within a meshed AC network, the power scheduling becomes complex, especially with four HVdc terminals that all have the ability to be adjusted. For example, if it is known that more power needs to be drawn from one of the four terminals, which of the other three terminals should this power be sent to so as to not create any new overloads? It is not necessarily an easy question to answer. As shown in Appendix C-2, there are many overloads present in the AC and VSC options, in addition to the impacted loads discussed in Section 10.3.2. A few examples were investigated to see if the VSC links could be used to eliminate particular overloads. 1) Cahir-Kill Hill 110 kV line
This line is overloaded to 132% even in system intact. In order to eliminate the system intact overload on this line, the VSC terminal at Cahir must take almost 300 MW more than how the original base case was set up. It was found that this 300 MW of power should come as much as possible from the Kilkenny and Loughteeog terminals, but not too much from Kilkenny otherwise the power flow solution will diverge. If the power were taken from Glanagow instead, more overloads, particularly the Marina-Trabeg 110 kV line begin showing up in that area. This example demonstrates that the VSC links were able to be re-dispatched so as to eliminate the Cahir-Kill Hill overload in system intact without creating any new system intact overloads, so long as the re-dispatch of VSC power comes from the appropriate terminal. It does not guarantee however that if the full contingency analysis were performed on this new system intact case that new n-1 overloads would not be created.
2) Cullenagh – Dungarvan 110 kV Line
This line becomes overloaded following the loss of the Cullenagh-Knockraha 220 kV line, up to 141.6% with the VSC option, and up to 126% with the AC option. Therefore, if the VSC is not redispatched, the AC option has the advantage of neighboring AC lines sharing the extra power
PDF created with pdfFactory Pro trial version www.pdffactory.com

EirGrid plc Investigating the Impact of HVdc Schemes in the Irish Transmission Network
Final Report
R1116.03.04, Page 134 Oct-18, 2009
© TransGrid Solutions Inc, 2009
following the loss of the line and resulting in a lower overload, as opposed to the VSC that continues at its pre-contingency power transfer. In this case, in order to alleviate the overload, more power must be taken out of the area at the Glanagow VSC terminal and injected into the VSC link. In order to completely eliminate the overload, approximately 350 MW of additional power must be taken out of the Glanagow area and transferred to the VSC. This however creates a new 112% overload on the Marina-Trabeg 110 kV line. The extra 350 MW was fed into the Cahir and Kilkenny VSC terminals, which did not create any new overloads and actually eliminated the existing Cahir-Kill Hill overload, similar to the discussion in the previous point. This example demonstrates that the VSC can be re-dispatched to completely eliminate an overload. However, care must be taken so as not to overload a new line in the process. In this case a new overload was created at the expense of eliminating a different overload.
3) Marina – Trabeg 110 kV line
This line becomes overloaded following the loss of the 450 MW Glanagow generator, up to 147.5 % with the VSC option, and up to 117.9% with the AC option. Therefore, if the VSC is not redispatched, the AC option has the advantage of not continuing to draw the same amount of power out of the Glanagow area after loss of a large generator, as opposed to the VSC that continues at its pre-contingency power flow. In this case, in order to alleviate the overload, more power must be brought to the Glanagow area at by taking more power, or in this case sending less power, from the Glanagow terminal of the VSC link. In pre-contingency the Glanagow VSC terminal is operating as a rectifier, taking power from the AC system near Glanagow and transferring it to the VSC link. In order to completely eliminate the overload, approximately 350 MW less power must be transferred from the Glanagow terminal of the VSC. Care must be taken as to where this power comes from. Taking more power from the Cahir terminal only serves to worsen an existing overload on the Cahir-Kill Hill line. Therefore the power was taken from both the Loughteeog and Kilkenny terminals, more so from Loughteeog. This example demonstrates that the VSC can be redispatched to eliminate the overload in question, however if care is not taken as to redispatch the other three VSC terminals appropriately additional overloads can be created.
Although it was demonstrated to be possible to redispatch the VSC link to eliminate a particular overload for a particular contingency, it is not necessarily always possible to do so without creating a new overload. In addition, the appropriate re-dispatch will be dependent on the network topology and the operating point at hand. If the VSC link were connected into a lesser meshed AC network, or connecting to two isolated systems, it might be possible to create a special protection system to monitor the system for a couple of specific contingencies in order to ramp up or ramp down the DC power in a pre-programmed manner to eliminate a known overload, if such a logic could be developed that would work for all network topologies and load and generation dispatches. In this case, the VSC link is connected inside a very meshed AC network and the case has a long list of overloads that occur for a very long list of contingencies. It would be practically impossible to pre-program the VSC to automatically respond to each and every contingency that caused an overload, and additionally without creating new overloads. It would also be difficult for an operator to manage if the re-dispatch were to be done manually.
PDF created with pdfFactory Pro trial version www.pdffactory.com

EirGrid plc Investigating the Impact of HVdc Schemes in the Irish Transmission Network
Final Report
R1116.03.04, Page 135 Oct-18, 2009
© TransGrid Solutions Inc, 2009
The following complications exist with attempting to rely on the VSC link to be re-dispatched to eliminate all n-1 violations:
• There are many overloaded lines and many contingencies causing these overloads. • A re-dispatch of the VSC to eliminate the overload would need to be carefully calculated to
properly share the re-dispatch among the four terminals so as not to create new overloads. • The re-dispatch would be very dependent upon the network topology and load and generation
dispatch. The only potential solution might be to perform a real-time automatic dispatch of the four terminals of the VSC link in such a way as to eliminate the potential for n-1 overloads to occur based on the network topology and operating point at the particular time. It is however not known whether any existing system operation software is capable of performing this task. With the number of overloaded lines recorded in Appendix C-2, along with the number of contingencies causing these overloads, even if such software could be used to minimize the overloads, it may still be necessary that some of the worst case overloads would require certain lines to be uprated. This would require further investigation beyond the scope of this study.
10.3.3. Voltage Violation Impacts
There were a few minor voltage range and deviation violations observed in the steady state contingency analysis, however there were no significant differences seen in these violations when comparing the results of the AC and VSC options. The complete results of the voltage violations can be found in Appendix C-3. With the mitigation measures described in Section 10.3.1, no diverged cases were reported.
10.4. Short Circuit Analysis
Short circuit analysis was performed to compare the difference in short circuit levels between the AC and VSC options. In comparison to the AC option, the VSC options showed lower or similar short circuit levels, particularly in the area near the VSC link. This is because the VSC link only contributes minimal short circuit current, up to 1.0 pu rated current depending on the AC bus voltage, with this short circuit contribution decreasing as the AC bus voltage decreases. According to the VSC model manuals [3], it is recommended to turn off the VSCs in the power flow prior to performing the short circuit analysis. However, as mentioned, the VSC option can contribute up to 1.0 pu rated current, with this current contribution decreasing as bus voltages decrease. An alternative method suggested in the VSC manual is to assume a 0.5 pu current contribution at nearby buses [3]. Therefore, the VSC fault contribution of 0.5 pu current was assumed. VSC option 1 with three two-terminal links showed reduced short circuit levels at Aghada and Laois but very similar short circuit levels at Cahir and Kilkenny in comparison to the AC option. VSC option 2 with two three-terminal links showed reduced short circuit levels at all four terminals in comparison to the AC option. This is due to the fact that there are double the number of VSC converters at Cahir and Kilkenny in the three two-terminal VSC option compared to the two three-terminal VSC option. Table 10.4 compares the short circuit levels of the AC option with the VSC options at the four terminals of the new transmission. The VSC options assume 0.5 pu rated current contribution from each converter.
PDF created with pdfFactory Pro trial version www.pdffactory.com

EirGrid plc Investigating the Impact of HVdc Schemes in the Irish Transmission Network
Final Report
R1116.03.04, Page 136 Oct-18, 2009
© TransGrid Solutions Inc, 2009
Table 10.4. Short Circuit Levels at Terminal Buses. 3-Phase Short Circuit Level (kA)
Terminal AC option VSC option-1 VSC option-2
AC Voltage (pu)
Aghada 220 kV 10.92 10.19 10.13 1.075 Cahir 110 kV 15.19 14.05 9.42 1.034
Kilkenny 110 kV 15.35 14.03 10.55 1.039 Laois 380 kV 10.74 10.99 10.89 1.028
Appendix C-4 contains the full listing of the short circuit analysis results. All short circuit levels exceeding the fault level criteria were flagged in red in Appendix C-4 for the AC and VSC options. Levels were exceeded at a few 220 kV stations, but mostly at 110 kV stations. In all cases the VSC options had minimal impact on the short circuit level violations present in the AC options. It is recommended to perform detailed breaker replacement studies at these stations.
Generally speaking the benefit of decreased short circuit levels is to possibly reduce the number of breakers whose current interrupting ratings are exceeded. The drawback is a decrease in system strength.
10.5. Transient Stability Analysis
The results of the transient stability simulations were analyzed and the three options were compared in terms of the following criteria:
• Transient overvoltages/undervoltages
• Frequency deviations and rate of change of frequency
• System damping
• Generator tripping
In addition to the analysis of the AC system faults and criteria, specific faults associated only with the HVdc systems, namely pole blocking and dc line faults were also analyzed to ensure acceptable system performance.
The required mitigation measures were investigated for any identified violations of the criteria.
Appendix C-1 contains the plots of transient stability analysis.
10.5.1. Overvoltages and Undervoltages
AC system voltages were monitored during the post-fault period at buses rated 110 kV and above in areas 2, 4, 5 and 7. All of the voltage violations that were observed during the transient stability analysis occurred near the Thurles 110kV bus in the area around the Cahir terminal. The voltage violations occurred whenever the Cahir-Kill Hill 110 kV line was tripped and/or when the connection to the new transmission at the Cahir terminal, be it AC or VSC, was tripped. The Cahir-Kill Hill 110 kV line is carrying the majority of the pre-contingency power at Cahir (179 MW), the same amount as is flowing into the new AC and VSC transmission options at the Cahir terminal. Therefore, when the connection to the new transmission and/or the major Cahir-Kill Hill 110 kV line is lost, the underlying system is weakened and large power flows result through the remaining 110 kV lines near Cahir, especially in the Thurles area, leading to voltage problems. Sometimes overvoltages occurred, sometimes undervoltages occurred, depending on the exact facilities being tripped during the various contingencies. These contingencies and corresponding voltage violations are described below.
PDF created with pdfFactory Pro trial version www.pdffactory.com

EirGrid plc Investigating the Impact of HVdc Schemes in the Irish Transmission Network
Final Report
R1116.03.04, Page 137 Oct-18, 2009
© TransGrid Solutions Inc, 2009
Following the breaker failure at Cahir (see contingency 3_1_X in Table 10.1) and following the tripping of Cahir-Kill Hill Thurles 110 kV line, the wind generation and the load connected in Thurles, Ikerrin, Kill Hill and Ikerrin would be tail fed from Shannonbridge. These wind-farms (connected at the distribution network) absorbed VARs, which resulted in low post-fault voltages at the Ikerrin bus as shown in Figure 10.6 below. The voltage at Ikerrin settled to around 0.84 pu in all of the AC and VSC options. Since the 110 kV network is no longer connected to the VSC converter at Cahir, the VSC at Cahir could not provide any reactive power contribution to improve the voltage, likewise for the 400 kV AC option. The dip in voltage around 3.5-3.8 seconds as seen in Figure 10.6 is the result of nearby wind generators tripping, a total of 50 MW in this case, as is discussed in upcoming Section 10.5.2.
Figure 10.6: Ikerrin 110 kV bus voltage during the breaker failure at Cahir 110 kV terminal (Contingency 3_1_X in Table 10.1). When the Cahir-Kill Hill 110 kV line is opened to clear a 3-phase fault at Cahir (Contingency 3_3_L2 in Table 10.1), the same voltage drop at Ikerrin was observed as just described for the breaker failure case. However, the voltage recovered after the line was reclosed, as shown in Figure 10.7. Since the reclosing time (600 ms) is shorter than the allowable time period for voltages to be lower than 0.90 pu, this voltage drop is not considered to be a violation. However, this demonstrates that the voltage at Ikerrin would violate the undervoltage criteria of 0.90 pu if the line could not be reclosed due to a permanent fault on the Cahir-Kill Hill 110 kV line or for any other reason.
0.9pu
Option1 (AC) Option2 (VSC) Option3 (VSC)
PDF created with pdfFactory Pro trial version www.pdffactory.com

EirGrid plc Investigating the Impact of HVdc Schemes in the Irish Transmission Network
Final Report
R1116.03.04, Page 138 Oct-18, 2009
© TransGrid Solutions Inc, 2009
Figure 10.7: Ikerrin 110 kV bus voltage during the fault at Cahir-Kill Hill 110 kV line (Contingency 3_3_L2 in Table 10.1). For VSC Option 2 only (two three-terminal VSC links), when the three-terminal VSC link connecting Glanagow-Cahir-Loughteeog is blocked (Contingency 1_0_P1 in Table 10.1), the connection between the Cahir 110 kV bus and the VSC at Cahir is tripped. This caused the voltages in the Thurles-Kill Hill-Cahir area to rise to unacceptable levels. This voltage rise is shown in Figure 10.8. The same issue does not occur for VSC Option 1 (three two-terminal VSC links) because blocking of one of the VSC links does not result in the Cahir 110 kV bus becoming disconnected from the VSC terminal at Cahir. VSC Option 1 has two connections into Cahir, whereas VSC Option 2 only has one converter connecting into Cahir so if this single VSC converter is blocked then Cahir 110 kV is disconnected from the VSC converter at Cahir and only remains connected to the rest of the system through the 110 kV network.
0.9pu
Option1 (AC) Option2 (VSC) Option3 (VSC)
PDF created with pdfFactory Pro trial version www.pdffactory.com

EirGrid plc Investigating the Impact of HVdc Schemes in the Irish Transmission Network
Final Report
R1116.03.04, Page 139 Oct-18, 2009
© TransGrid Solutions Inc, 2009
Figure 10.8: Thurles, Kill Hill and Cahir bus voltages for the DC pole-1 block in Option3 (Contingency 1_0_P1 in Table 10.1). The names and PSSE bus numbers of the buses in which the high voltage criteria was violated are given in Table 10.8. Table 10.8. Buses exceeded the voltage of 1.15 pu for the DC pole-1 block in Option3.
Bus Number
Name
5301 Thurles 3621 Lisheen 1891 Kill Hill 3631 Cureeny 1721 Cahir
Mitigation measures required for the voltage violations are discussed upcoming in Section 10.5.6. As far as the voltage violations are concerned, there were no noticeable differences between the AC and VSC options, with the exception of the high voltage violations that occurred due to the VSC pole block in the VSC option 2 (two three-terminal VSC links).
10.5.2. Wind Generator Tripping
The same contingencies as just described for the overvoltage and undervoltage violations also resulted in several wind generators tripping due to overvoltage and undervoltage. As was mentioned in Section 10.5.1, the voltage at Ikerrin dropped to 0.84 pu for a the breaker failure at Cahir 110kV terminal (Contingency 3_1_X in Table 10.1). This caused the undervoltage relays of nearby wind generators to operate. The wind generators that tripped due to undervoltage are listed in Table 10.9, for a total amount of 50 MW. The loss of wind generation occurred in all of the AC and VSC options.
Option3 (VSC)
1.15pu
PDF created with pdfFactory Pro trial version www.pdffactory.com

EirGrid plc Investigating the Impact of HVdc Schemes in the Irish Transmission Network
Final Report
R1116.03.04, Page 140 Oct-18, 2009
© TransGrid Solutions Inc, 2009
Table 10.9. Wind Generators Tripped by undervoltage relays during the breaker failure at Cahir 110 kV terminal (Contingency 3_1_X in Table 10.1).
Bus Name ID MW 160 Ikerrin DX 45.24 212 Ikerrin DV 4.76
Total 50.00
For VSC Option 2, when the three-terminal VSC connecting Glanagow-Cahir-Loughteeog terminals was blocked (Contingency 1_0_P1 in Table 10.1), overvoltages occurred in the Thurles-Kill Hill-Cahir area. This causes the overvoltage relays of nearby wind generators to operate. The wind generators that were tripped due to overvoltage are listed in Table 10.10, for a total amount of 114.4 MW. Table 10.10. Wind Generators Tripped by overvoltage relays during the DC pole-1 block in Option3 (Contingency 1_0_P1 in Table 10.1).
Bus Name ID MW 1891 Kill Hill DX 2.50 1891 Kill Hill TX 12.50 2161 Doon DX 5.00 3101 Ikerrin DV 1.19 3101 Ikerrin DX 11.30 3621 Lisheen TW 11.00 3621 Lisheen TX 7.92 3631 Cureeny DX 28.09 5301 Thurles DX 8.36 5271 Toem DV 5.00 5271 Toem DW 2.38 5271 Toem DX 7.60 5271 Toem TW 11.61
Total 114.43
10.5.3. Power Oscillation Damping
In general, plots of power oscillations inspected for various contingencies and powerflow study cases revealed that all AC and VSC options resulted in a satisfactory level of damping for power oscillations. Inspection of power oscillations also indicated that there is no clear evidence to substantiate which option had better system damping. Small signal stability analysis based on Eigenvalues would be recommended for future studies to better quantify the system damping performance.
10.5.4. Frequency Performance
In transient stability programs such as PSS/E, the transmission system frequency is obtained from the derivative of the bus voltage angle. If there is a sharp change in the bus angle, the frequency might change infinitely. Therefore, there are filters associated with the frequency measurements. However, sometimes these filters are not enough to completely rid the frequency calculations of these spikes, particularly if a fault has been applied in the area near to the frequency calculation. For this reason, generator speed quantities were mostly used to analyse frequency deviations as generator speeds are state variables which cannot change instantaneously and therefore should not give erroneous results.
PDF created with pdfFactory Pro trial version www.pdffactory.com

EirGrid plc Investigating the Impact of HVdc Schemes in the Irish Transmission Network
Final Report
R1116.03.04, Page 141 Oct-18, 2009
© TransGrid Solutions Inc, 2009
10.5.4.1. Transient Frequency For the one power flow case that was studied, the AC and VSC transmission options did not show any transient underfrequency or overfrequency violations for any of the contingencies that were studied that did not involve generator tripping. All transient frequency deviations were within criteria. 10.5.4.2. Long Term Frequency Also of interest to the system frequency performance are the two dynamic contingencies that simulate loss of generation, one which simulates loss of 450 MW at Glanagow, and the other which simulates loss of 396 MW at Irishtown. These contingencies, along with the amount of generation tripped, are listed in Table 10.11. Table 10.11: Loss of generation. Contingency Amount of generation tripped (MW) 6_6_X 450 (Glanagow) 7_7_X 396 (Irishtown)
Following the loss of generation, the frequency of the entire system gradually decreased. This caused the pump load Turlough Hill (buses 52071 to 52074 (TURLG1-G4)) to trip for all AC and VSC transmission options within approximately 15 seconds of simulation. As was described for Scenario 1 (Section 8.7.3.2), on the first run-through of these contingencies it was noticed that wind generators in the area near Cork began tripping one at a time, starting with Thurles, Lisheen, Cureeny, Ikerrin and so on until large amount of wind generation had tripped by 30 seconds into the simulation, which further exacerbated the frequency decay. It was discovered that the 110 kV area around Thurles did not appear to have sufficient dynamic voltage control. The area has many switched capacitors that are required to support voltage in the steady state, however in dynamics it seemed that some of this capacitance should rather be dynamic reactive power support such as an SVC. What was happening during the loss of generation cases, as the pump loads at Turlough Hill began to trip, the power flow in the area around Thurles began to change. As the power flow changed, the voltage began to decrease near Thurles, causing the wind generation at Thurles to trip. This further changed the power flow direction in the area, but in the opposite direction, which then caused the voltage to increase due to the large amount of capacitance in the area, resulting in more wind generators tripping on overvoltage. It was found that if some of this capacitance is replaced by an SVC, there was no cascade tripping of wind generators for loss of the Irishtown generation (contingency 7_7_X) and the frequency settled to a stable value, although it settled to around 49 Hz, which is below the nominal 50 Hz. A +100/-50 MVAR SVC at Thurles was found to be sufficient for the particular cases being studied, however it is recommended to perform a more thorough reactive power study to determine the appropriate proportion of fixed and dynamic reactive power requirements. The loss of Glanagow generation showed a similar problem with wind generator tripping in the AC and VSC options but in a different area. For this contingency, wind generators began tripping on overvoltage in the area around Trien, Tarbert, Gortawee and so on. Because this is not an issue directly related to the comparison of the AC and VSC option, mitigation for this contingency was not determined. It is expected that capacitance in that area would required replacement with an SVC similar to the mitigation demonstrated for loss of generation at Irishtown. Further study is recommended. The system frequency decay for the two loss of generation contingencies is shown in Figures 10.9 and 10.10.
PDF created with pdfFactory Pro trial version www.pdffactory.com

EirGrid plc Investigating the Impact of HVdc Schemes in the Irish Transmission Network
Final Report
R1116.03.04, Page 142 Oct-18, 2009
© TransGrid Solutions Inc, 2009
Figure 10.9. Decay in generator speed for loss of 396 MW at Irishtown.
AC option VSC option1 VSC option 2
AC option VSC option1 VSC option 2
PDF created with pdfFactory Pro trial version www.pdffactory.com

EirGrid plc Investigating the Impact of HVdc Schemes in the Irish Transmission Network
Final Report
R1116.03.04, Page 143 Oct-18, 2009
© TransGrid Solutions Inc, 2009
Figure 10.10. Decay in generator speed for loss of 450 MW at Glanagow. At 30 seconds of simulation there is a very slight difference in the steady state system frequency when comparing the AC options to the VSC option. Table 10.12 lists the system frequency at 30 seconds of simulation. Table 10.12. System Frequency Following Loss of Generation. Contingency System Frequency (Hz) 6_6_X 48.6 7_7_X 48.9
In both contingencies the VSC options result in faster frequency decay than the AC option. It is believed that this is because the VSC as modelled continues to transfer the pre-contingency amount of power from the Cork area even after the generation is lost. It may be possible that if controls were designed to respond to the frequency decay that the decay could be slowed down in the VSC cases. However, this was not attempted for two reasons:
• The rate of change of frequency was within the 0.5 Hz/sec criteria. • The frequency settled to the same steady state value as the AC option because the VSC is
installed in a meshed AC network and is not able to bring in excess power from an isolated region and therefore it cannot change the steady state frequency.
The response of higher-speed control (such as machine governors) to short term frequency excursions is modeled in PSSE. Short-term system frequency criteria must be met by the calculated PSS/E frequency responses. In the event of extreme transient under-frequency, there is the risk of load shed and also the risk of the loss of generation through generation protection (typically installed to prevent damage resonances at off-nominal frequency operation).
AC option VSC option1 VSC option 2
AC option VSC option1 VSC option 2
PDF created with pdfFactory Pro trial version www.pdffactory.com
EirGrid plc Investigating the Impact of HVdc Schemes in the Irish Transmission Network
Final Report
R1116.03.04, Page 144 Oct-18, 2009
© TransGrid Solutions Inc, 2009
Steady state frequency control in the Irish transmission system is achieved by manual operator control. It is valid to assume that through corrective action, i.e. manual operator action, the system frequency will be restored to nominal in a timeframe beyond that of the transient stability study. It should be noted that the frequency the system settles to is above the emergency frequency criteria of 47.5 Hz, however is well below the allowable continuous criteria of 49.5 Hz. Note that load shedding as well as the frequency control function of the Moyle HVdc Interconnector were not modelled in this study.
10.5.5. Rate of Change of Frequency
Rate of change of frequency can be a concern for systems with a high penetration of wind generation. This is because wind generators are often equipped with rate-of-change-of-frequency (ROCOF) relays to trip the wind generator if the rate of change of frequency is too high. The EirGrid Grid Code currently states that the maximum rate of change of frequency in the Irish transmission system is 0.5 Hz/sec. Large amounts of wind generation are planned to be connected to the Irish transmission system and this wind generation will replace conventional generation. Because wind generators do not provide as much inertia as conventional generators, the rate of change of system frequency will naturally increase, causing further concern regarding the ROCOF relays. One contingency, a three-phase fault at the 400 kV Laois bus (contingency 5_3_L1 in Table 10.1), was used to compare the rate of change of speed of nearby generators at Glanagow and Dublin Bay. Figure 10.11 shows the comparison. Both the AC and VSC options showed rates of change of speed greater than 0.5 Hz/sec during the fault. The AC option showed the highest rate of change of speed during the fault because the AC option is more closely coupled to the 400 kV AC bus at Laois where the fault is being applied, therefore the rate of change of frequency is higher. However, after the fault is cleared, there did not appear to be a significant difference in the maximum rate of change of speed when comparing the AC option to the VSC options.
PDF created with pdfFactory Pro trial version www.pdffactory.com

EirGrid plc Investigating the Impact of HVdc Schemes in the Irish Transmission Network
Final Report
R1116.03.04, Page 145 Oct-18, 2009
© TransGrid Solutions Inc, 2009
Figure 10.11. Rate of Change of Frequency – Three-Phase Fault at 400 kV Laois Bus.
10.5.6. HVdc Line Faults and Pole Blocking
The system performed well within criteria for the loss of an HVdc pole in the three two-terminal VSC option (VSC Option 1). In the two three-terminal VSC option (VSC Option 2), a pole block of the three-terminal VSC connecting Glanagow-Cahir-Loughteeog caused high voltages near the Cahir terminal as described in Section 10.5.1. However, a pole block of the other three-terminal VSC connecting
2.5 Hz/sec
2.5 Hz/sec
-2.5 Hz/sec
-2.5 Hz/sec
0.5 Hz/sec
-0.5 Hz/sec
0.5 Hz/sec
-0.5 Hz/sec
PDF created with pdfFactory Pro trial version www.pdffactory.com

EirGrid plc Investigating the Impact of HVdc Schemes in the Irish Transmission Network
Final Report
R1116.03.04, Page 146 Oct-18, 2009
© TransGrid Solutions Inc, 2009
Glanagow-Kill Hill-Loughteeog did not cause any voltage violations. The violations only occurred if the Cahir 110 kV bus becomes disconnected from the 400 kV AC lines or the VSC HVDC converters and is left connected to the rest of the system only through the 110 kV network. In addition pole blocking, dc line faults were simulated. In a VSC HVdc link, a dc line fault will draw short circuit current from the AC system and therefore it will look to the AC system like a remote AC fault. The simulation of this disturbance in the VSC options showed that the system performance is well within criteria. To be consistent with the dc fault simulations in the VSC options, three-phase AC faults were applied to the three new 400 kV AC transmission lines in the AC option. The system performed well within criteria for the AC option as well.
10.5.7. Mitigation Measures
In the transient stability analysis as already discussed it was found that there were several undervoltage and overvoltage violations near the Thurles 110 kV bus that occurred due to several contingencies. As a result, the wind generators in close proximity tripped. It is required to dynamically control the reactive power in this area in order to get rid of these violations and the subsequent wind tripping. An SVC was selected for this task. It was found that an SVC with 100 MVAR capacitive limit (Qmax) and 50 MVAR inductive limit (Qmin) would be sufficient to keep the system within limits for the troublesome contingencies described Section 10.5.1. In addition to the +100 to -50 MVAR SVC, there was 135 MVAR (9x15 MVAr) of shunt capacitance at this bus, in reality this would be considered to be over-compensated and it is likely that a new line is needed in the area and/or some amount of dynamic reactive power compensation dispersed around the area. For the breaker failure at the Cahir 110 kV terminal (Contingency 3_1_X in Table 10.1), the voltage at Ikerrin bus is shown in Figure 10.12 for the AC and VSC options, when the proposed SVC is connected at the Thurles 110 kV bus. The post fault voltage which, was 0.84 pu in the initial case, now recovers to 0.935 pu.
Figure 10.12: Ikerrin 110 kV bus voltage during the breaker failure at Cahir 110 kV terminal (Contingency 3_1_X in Table 10.1), with an SVC at Thurles.
0.9pu
Option1 (AC) Option2 (VSC) Option3 (VSC)
PDF created with pdfFactory Pro trial version www.pdffactory.com

EirGrid plc Investigating the Impact of HVdc Schemes in the Irish Transmission Network
Final Report
R1116.03.04, Page 147 Oct-18, 2009
© TransGrid Solutions Inc, 2009
In the two three-terminal VSC option (VSC Option 2), a pole block of the three-terminal VSC connecting Glanagow-Cahir-Loughteeog caused high voltages near the Cahir terminal as described in Section 10.5.1. When the SVC was introduced, the voltages were brought within the limits as shown in Figure 10.13. The proposed mitigation avoids the overvoltage tripping of 143 MW of wind generation that occurred during this contingency prior to the addition of the SVC.
Figure 10.13: Thurles, Kill Hill and Cahir bus voltages for the DC pole-1 block in Option3 (Contingency 1_0_P1 in Table 10.1), when the SVC at Thurles was connected.
Note that the SVC at Thurles also prevented cascade wind tripping for loss of the Irishtown generation as was discussed in Section 10.5.4. Loss of the Glanagow generation also resulted in cascade wind tripping in the area near Trien, Tarbert, Gortawee and so on. Because this is not an issue directly related to the comparison of the AC and VSC options, mitigation for this contingency was not determined. It is expected that capacitance in that area would require replacement with dynamic reactive support (such as an SVC) similar to the mitigation demonstrated for loss of generation at Irishtown. Further study beyond the scope of this report is recommended.
10.6. System Frequency Scans
Similar to scenarios 1 and 2, impedance scans were performed in PSCAD to generate the positive sequence driving point impedance versus frequency (from 0Hz to 2500Hz in 2Hz increments) at the HVdc potential terminal buses, i.e. Aghada (1062), Cahir (1721), Kilkenny (3261) and Laois (3554). Two sets of scans were performed with and without the proposed 400kV AC line connecting Aghada, Cahir, Kilkenny and Laois. In all cases the existing HVdc systems were left in service. To improve the accuracy of the frequency scans a number of existing and planned lines near these buses were modeled as frequency dependant using the geometry data provided by EirGrid. A complete list of lines modeled as frequency dependant is given in Appendix C-5. All other transmission lines are modeled as Bergeron using the R,L,C data from PSS/E base cases.
1.15pu
VSC Option 2
PDF created with pdfFactory Pro trial version www.pdffactory.com

EirGrid plc Investigating the Impact of HVdc Schemes in the Irish Transmission Network
Final Report
R1116.03.04, Page 148 Oct-18, 2009
© TransGrid Solutions Inc, 2009
It should be noted that when developing the PSCAD model for the impedance scans, no information is given on the existing HVdc filters on the Moyle and Wales HVdc link and are inserted as simple capacitors. This will have an impact on the results, but without the details of the filters, this is an acceptable approximation. If an HVdc transmission option is selected a more detailed frequency scan study must be performed to consider all various system configurations in the foreseeable future. Results of this study will define a range of system impedances that may be seen from the converter terminals. The HVdc link manufacturer must design the link such that the injected harmonic currents and the resultant harmonic currents always remain below the set limits for all specified system impedances and HVdc link operating points. If during the lifetime of the HVdc link the system topology changes significantly in a way not predicted before, the original design may not be sufficient and modifications to the filters or other components may be required (see comments from previous scenarios). Appendix C-5 contains the full set of results for the system frequency scans. The results are summarized in Table 10.13. Table 10.13. Frequency scan results for Scenario 4.
Scenario Bus Frequency Harmonic Resonance Type
Scenario Bus Frequency Harmonic Resonance Type
4 Aghada 648 12.96 P 4 Aghada 570 11.4 P Without 1396 27.92 S With 602 12.04 S AC line 1452 29.04 P AC line 810 16.2 P
2430 48.6 S 1392 27.84 S Cahir 266 5.32 P 1462 29.24 P 300 6 S 2430 48.6 S 312 6.24 P Cahir 358 7.16 P Kilkenny 360 7.2 P 440 8.8 S 460 9.2 P Laois 636 12.72 P Kilkenny 474 9.48 P 750 15 S 510 10.2 S 762 15.24 P 570 11.4 P 944 18.88 S 592 11.84 S 990 19.8 P 606 12.12 P 1012 20.24 S 660 13.2 S 1058 21.16 P 686 13.72 P 1236 24.72 S Laois 686 13.72 P 1412 28.24 P 750 15 S 1738 34.76 S 764 15.28 P 2366 47.32 P 944 18.88 S 990 19.8 P 1012 20.24 S 1050 21 P 1222 24.44 S 1424 28.48 P 1742 34.84 S 2284 45.68 P
The frequency scan analysis shows multiple resonance conditions in the 1-2kHz region. A VSC converter using Pulse Width Modulation (PWM) technique generate a small amount of harmonic voltages at the PWM switching frequency (in the 1 to 2kHz range), plus the PWM sideband frequencies as discussed in section 8.7. If there is series resonance at the VSC switching or sideband frequencies, these harmonic currents may propagate into the system. As the switching frequency of a VSC can be selected (has impacts on losses), the harmonics of concern can usually be moved away from the resonance point, but care must be taken for harmonic resonances in the range of 20 to 40.
PDF created with pdfFactory Pro trial version www.pdffactory.com

EirGrid plc Investigating the Impact of HVdc Schemes in the Irish Transmission Network
Final Report
R1116.03.04, Page 149 Oct-18, 2009
© TransGrid Solutions Inc, 2009
In conclusion, if a VSC based HVdc link with PWM modulation is used in this scenario, proper filtering must be provided to avoid harmonic current injection into the system under the worst case resonance conditions.
10.7. SSR Screening
The UIF calculation described in the Study Procedures section is intended to screen for potential interaction between a conventional LCC HVdc system and generator shaft oscillation modes, known as subsynchronous resonance (SSR). With LCC HVdc, any resonance frequency (f) on the DC side gets converted to f0+f and f0-f frequencies on the AC side. Because VSC is a relatively new technology compared to LCC, there is less information available on the possibility of SSR with a VSC HVdc system. A simple test case was setup in PSCAD to test whether the same phenomenon occurred with VSC and results indicate that VSC may have the same potential as LCC to excite SSR. Although the UIF screening calculations are intended to be used for LCC HVdc, the UIF was calculated for the VSC option as well in order to provide an indication of the potential need for detailed SSR studies. Table 10.14 summarizes the results. All UIF calculations were well below the threshold of 0.1 at Cahir and Kilkenny, therefore no concerns are flagged for these terminals. At the Aghada terminal, the UIF calculation with respect to the 535.5 MVA generator at Glanagow results in a UIF of 0.394. At the Laois terminal, the UIF calculation with respect to the 500 MVA generator at Irishtown results in a UIF of 0.123. Both of these terminals result in a UIF greater than 0.1, which suggests a detailed SSR study should be undertaken for these two terminals. Table 10.14. SSR Screening for VSC options.
Aghada 1500 MW VSC
Cahir 3000 MW VSC
Kilkenny 3000 MW VSC
Laois 1500 MW VSC
Short Circuit Level (MVA)
Short Circuit Level (MVA)
Short Circuit Level (MVA)
Short Circuit Level (MVA) Generator
Bus Number
Rating (MVA)
Gen In
Gen Out UIF
Gen In
Gen Out UIF
Gen In
Gen Out UIF
Gen In
Gen Out UIF
19471-Cushaling 153 3166 3163 0.000 1461 1460 0.000 1333 1324 0.001 6098 5977 0.004
28571-Glanagow 535.5 3166 1978 0.394 1461 1435 0.002 1333 1324 0.000 6098 6025 0.000
29673-Huntstown 473 3166 3158 0.000 1461 1458 0.000 1333 1323 0.000 6098 5879 0.004
31271-Irishtown 500 3166 3158 0.000 1461 1458 0.000 1333 1323 0.000 6098 4861 0.123
35074-Lanesboro 121.1 3166 3165 0.000 1461 1460 0.000 1333 1332 0.000 6098 6072 0.000
35771-Longpoint 500 3166 3035 0.005 1461 1445 0.001 1333 1329 0.000 6098 6029 0.000
39471-Moneypoint 359 3166 3158 0.000 1461 1459 0.000 1333 1329 0.000 6098 5953 0.002
39472-Moneypoint 359 3166 3158 0.000 1461 1459 0.000 1333 1329 0.000 6098 5953 0.002
39473-Moneypoint 359 3166 3158 0.000 1461 1459 0.000 1333 1329 0.000 6098 5953 0.002
49474-Shannon-
bridge 181.7 3166 3162 0.000 1461 1455 0.000 1333 1329 0.000 6098 6024 0.001 50573-
Seal Rock 96 3166 3163 0.000 1461 1460 0.000 1333 1333 0.000 6098 6083 0.000 50574 –
Seal Rock 96 3166 3163 0.000 1461 1460 0.000 1333 1333 0.000 6098 6083 0.000 51771- Tynagh 327 3166 3162 0.000 1461 1460 0.000 1333 1331 0.000 6098 6017 0.001
PDF created with pdfFactory Pro trial version www.pdffactory.com

EirGrid plc Investigating the Impact of HVdc Schemes in the Irish Transmission Network
Final Report
R1116.03.04, Page 150 Oct-18, 2009
© TransGrid Solutions Inc, 2009
Aghada 1500 MW VSC
Cahir 3000 MW VSC
Kilkenny 3000 MW VSC
Laois 1500 MW VSC
Short Circuit Level (MVA)
Short Circuit Level (MVA)
Short Circuit Level (MVA)
Short Circuit Level (MVA) Generator
Bus Number
Rating (MVA)
Gen In
Gen Out UIF
Gen In
Gen Out UIF
Gen In
Gen Out UIF
Gen In
Gen Out UIF
51772- Tynagh 163.7 3166 3164 0.000 1461 1460 0.000 1333 1332 0.000 6098 6054 0.000
An example of the UIF calculation at Glanagow (bus 28571) with the VSC at Aghada follows:
2
1
−=
t
g
g
dc
SCSC
MVAMVA
UIF
394.0316619781
5.5351500 2
=
−=UIF
10.8. Summary of Overall Study Results for Scenario 4
The results of the analysis are summarized as follows:
• Steady state contingency analysis observed a lack of reactive power in certain areas: o The first area was near the Thurles 110kV bus when either the Thurles-Kill Hill 110 kV
line or the Kill Hill-Cahir 110 kV line was tripped. This issue was mitigated by increasing the Thurles switched capacitor to 135 MVAR (9*15MVAR) from 30 MVAR. This was required for the AC and VSC options.
o The second area was near Loughteeog in the AC option only when the Oldstreet-Woodland 400 kV line or Carrickmines-Charlesland 220 kV line was tripped. The issue was mitigated by a switched capacitor of 250 MVAR (5*50MVAR) at the Portlaoise 110 kV bus. Although this switched capacitor was not required in the VSC options to prevent voltage collapse, the switched capacitor was kept in the VSC options for consistency.
o In reality this would be considered to be over-compensated and it is likely that a new line is needed in the area and/or some amount of dynamic reactive power compensation dispersed around the area. The reactive power optimization is outside of the scope of this project.
• The VSC options did not result in any negative impacts to steady state voltage range or deviation violations compared to the AC option, and in fact eliminate the need for installing extra reactive power support in the Loughteeog area as mentioned above.
• The AC option had significantly lower losses than the VSC options: o AC – 26.3 MW o VSC Option 1: three 2-terminal VSCs – 75.4 MW o VSC Option 2: two 3-terminal VSCs – 36.2 MW
• The VSC options resulted in several new thermal overloads and impacts to existing overloads as
summarized in Table 10.15.
PDF created with pdfFactory Pro trial version www.pdffactory.com

EirGrid plc Investigating the Impact of HVdc Schemes in the Irish Transmission Network
Final Report
R1116.03.04, Page 151 Oct-18, 2009
© TransGrid Solutions Inc, 2009
Table 10.15. New Overloads and Impacts to Existing Overloads. Worst Overloads (%) Rating Line
MVA
Contingency
AC VSC-1 VSC-2
380kV
3202 KNOCKRAHA 220.00 3282*KILLONAN 220.00 1 286 Glen-NewTrien 220 kV 106.8 111.9 112.2
110kV
1441 BANDON 110.00 2221*DUNMANWAY 110.00 1 107 Glanagow 220-19 kV 104.0 113.4 113.3
1721 CAHIR 110.00 5381*TIPPERARY 110.00 1 107 Cahir-Kill Hill 110 kV 105.6 121.0 120.5
1721 CAHIR 110.00 14619*BARRYM T 110.00 1 107 Cahir-Kill Hill 110 kV <100 113.7 113.3
2001 CULLENAGH 110.00 2141*DUNGARVAN 110.00 1 107 Cullenagh-Knockraha 220 kV 126.4 141.6 141.1
3961*MARINA 110.00 5181 TRABEG 110.00 2 79 Glanagow 220-19 kV 117.9 147.5 147.4
5271*TOEM 110.00 5381 TIPPERARY 110.00 1 107 Cahir-Kill Hill 110 kV 123.1 137.1 136.7
• One of the important aspects of Scenario 4 is the transmission congestion in the area of study. A
purpose of the study was to investigate whether or not it may be possible to use power scheduling flexibility of the VSC links to relieve congestion rather than constraining generation and/or uprating lines in the area. It was found that the following complications exist with attempting to rely on the VSC link to be re-dispatched to eliminate all n-1 violations:
o There are many overloaded lines and many contingencies causing these overloads. o A re-dispatch of the VSC to eliminate the overload would need to be carefully calculated
to properly share the re-dispatch among the four terminals so as not to create new overloads.
o The re-dispatch would be very dependent upon the network topology and load and generation dispatch.
A potential solution might be to to perform a real-time automatic dispatch of the four terminals of the VSC link in such a way as to eliminate the potential for n-1 overloads to occur based on the network topology and operating point at the particular time. However, it is not known whether any existing system operation software is capable of performing this task. With the number of overloaded lines recorded in Appendix C-2, along with the number of contingencies causing these overloads, even if such software could be used to minimize the overloads, it may still be necessary that some of the worst case overloads would still require certain lines to be uprated.
• VSC option 1 (three 2-terminal links) showed reduced short circuit levels at Glanagow and Loughteeog but very similar short circuit levels at Cahir and Kilkenny in comparison to the AC option. VSC option 2 (two 3-terminal links) showed reduced short circuit levels at all four terminals in comparison to the AC option. This is due to the fact that there are double the number of VSC converters at Cahir and Kilkenny in VSC Option 1 compared to VSC Option 2. VSC converters were assumed to contribute 0.5 pu rated current to the short circuit levels. Short circuit levels are summarized in Table 10.16. Table 10.16. Short Circuit Levels at Terminal Buses.
Short Circuit Level (MVA) Terminal
AC option VSC option-1 VSC option-2 Glanagow 4129 3885 3885
Cahir 2831 2896 1828 Kilkenny 2750 2759 1691
Loughteeog 7035 6834 6834
PDF created with pdfFactory Pro trial version www.pdffactory.com
EirGrid plc Investigating the Impact of HVdc Schemes in the Irish Transmission Network
Final Report
R1116.03.04, Page 152 Oct-18, 2009
© TransGrid Solutions Inc, 2009
• Transient stability analysis revealed that in both the AC and VSC options, a reactive power issue was observed in the 110 kV area near Thurles and Cahir. The analysis found transient and steady state voltage violations following the loss of the connection to the new transmission at Cahir, which in turn resulted in tripping of local wind generators. In addition to a 135 MVAR switched capacitor, a +100 to-50 MVAR SVC was added at Thurles and was found to mitigate all of the voltage-related issues.
• Rate of change of frequencies during and immediately following nearby faults resulted in violation of the 0.5 Hz/sec criteria for all AC and VSC options, with no significant difference observed when comparing the AC option to the VSC options.
• Loss of generation at Glanagow (450 MW) and at Irishtown (396 MW) both resulted in the system
frequency settling out to underfrequencies of 48.6 Hz and 48.9 Hz respectively. The settling frequency was the same for the AC and VSC options. The VSC options resulted in slightly faster frequency decay, however the rate of change of frequency was slow and did not violate the 0.5 Hz/sec criteria.
• The VSC options performed within criteria for HVdc line faults and pole blocking.
• SSR screening was performed by calculating the Unit Interaction Factor (UIF). All UIF
calculations were well below the threshold of 0.1 at Cahir and Kilkenny, therefore no concerns were flagged for these terminals. At the Aghada terminal, the UIF calculation with respect to the 535.5 MVA generator at Glanagow resulted in a UIF of 0.394. At the Laois terminal, the UIF calculation with respect to the 500 MVA generator at Irishtown resulted in a UIF of 0.123. Both of these terminals result in a UIF greater than 0.1, which suggests a detailed SSR study should be undertaken for these two terminals.
10.9. Overall Comparison of HVdc Solutions with Equivalent AC Solution
The studies showed no significant difference between the AC and VSC HVdc options in terms of the following aspects:
• Steady state voltage violations once mitigation of reactive power support at Thurles and Portlaoise was added.
• Rate of change of frequency during and following faults. • Long term frequency decay due to loss of generation – the system settles to the same
underfrequency following the loss of generation. The VSC options were not able to improve the frequency because the VSC is not able to transfer power from an area with excess power since the VSC transmission is located within meshed AC network and is not connecting two isolated systems.
10.9.1. AC Advantages over HVdc
Based on the study results, the AC option had the following technical advantages compared to the VSC options:
• Lower line losses • Lower overloads in several 400 kV and 110 kV lines in the south-west area • Higher short circuit levels resulting in stronger local AC system • The VSC terminals at Aghada (near the WhiteGen CCGT generator) and at Laois (near the
Irishtown generator) both flagged the need for detailed SSR studies as the SSR screening procedure identified Unit Interaction Factors greater than 0.1 with the Glanagow and Irishtown generators, respectively. SSR is not a concern for the AC option.
PDF created with pdfFactory Pro trial version www.pdffactory.com

EirGrid plc Investigating the Impact of HVdc Schemes in the Irish Transmission Network
Final Report
R1116.03.04, Page 153 Oct-18, 2009
© TransGrid Solutions Inc, 2009
10.9.2. HVdc Advantages over AC
Based on the study results, the VSC options had the following technical advantages compared to the AC option:
• Improved voltage performance as the VSC inherently provides reactive power support. Tthe VSC options may utilize underground cables.
10.10. Recommendations
The study has shown that the AC and VSC HVdc options are all feasible and each option could be made to work. However, without consideration for economics or environmental impacts, based solely on the technical comparison between the AC and VSC HVdc options it appears that there are no significant reasons to select HVdc over AC transmission, other than reactive power support. The VSC option did show improved dynamic voltage performance over the AC option, however if it were deemed necessary a STATCOM could be installed with the AC option to provide similar dynamic reactive power support as the VSC options. In addition, the AC option showed significantly lower losses, fewer overloads in the local area and a stronger local AC system. Typical applications of HVdc systems include: • Transmission with overhead line distances above 1 000 km, where the need of various intermediate
tapings is not present; • Interconnecting systems with different frequencies (50 Hz to 60 Hz); • Undersea or underground cables with lengths around 50 or more; • Need for asynchronous operation (even at the same frequency base), like interconnection of different
markets. • Need for absolute power scheduling The only application that really applies to the situation being studied in this report is the use of HVdc cables. Typical applications of HVdc can also provide benefits such as power oscillation damping and frequency control. An HVdc power order can be quickly changed by an external signal (that should indicate a change in the network is taking place) as an additional signal in the power order scheduling. Power oscillation damping was not observed to be an issue in this study. Use of HVdc controls to achieve steady state or longer term frequency control is not expected to be applicable in the Irish network because the HVdc is being integrated into a meshed AC network, however frequency control was not modeled in this study and would therefore require further investigation to make any definite conclusions. It is not a case of being able to transfer excess generation from one area to another area that is deficient in generation as could typically be the case with an HVdc link connecting two isolated systems. A meshed AC network with embedded HVdc circuits can impose an added complexity to future network planning and expansion. For instance when planning the system it is difficult and expensive to tap into an existing HVdc circuit whereas an AC circuit can be easily tapped to serve new load or build a new AC station and lines. Based on the selected power flow case and contingencies that were studied, there were no significant technical advantages identified for the use of HVdc transmission instead of AC transmission between Glanagow-Cahir-Kilkenny-Loughteeog. VSC HVdc links have the benefit of inherent reactive power support. VSC HVdc links can utitlize underground cables, and if built as a bipole provide extra reliability. The VSC terminals at Aghada and Laois flagged the need for detailed studies to identify and mitigate potential subsynchronous resonance (SSR) issues with the Glanagow and Irishtown thermal generators, respectively. In some cases, when an overhead AC transmission line cannot be considered, a VSC HVdc solution may be a viable technical solution since it can utilise underground cables. However to make such a decision it
PDF created with pdfFactory Pro trial version www.pdffactory.com

EirGrid plc Investigating the Impact of HVdc Schemes in the Irish Transmission Network
Final Report
R1116.03.04, Page 154 Oct-18, 2009
© TransGrid Solutions Inc, 2009
is necessary to compare the two technologies across the full range of relevant criteria, incuding environmental, technical and economical.
PDF created with pdfFactory Pro trial version www.pdffactory.com
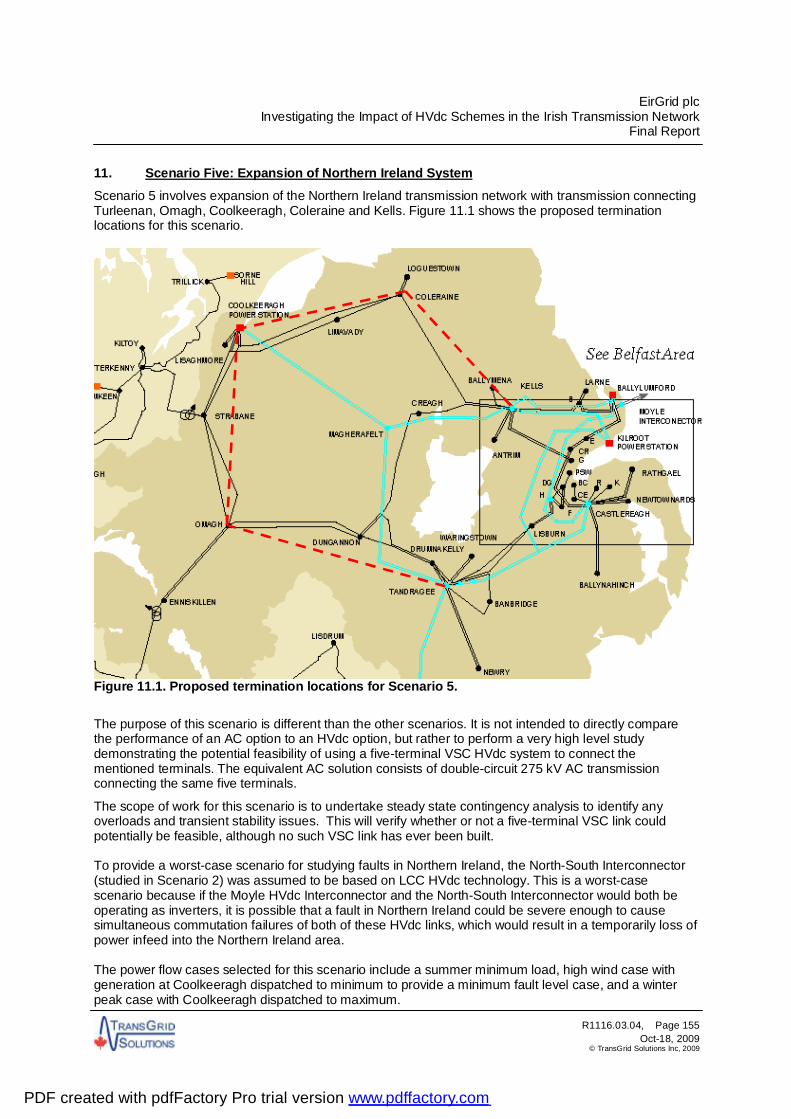
EirGrid plc Investigating the Impact of HVdc Schemes in the Irish Transmission Network
Final Report
R1116.03.04, Page 155 Oct-18, 2009
© TransGrid Solutions Inc, 2009
11. Scenario Five: Expansion of Northern Ireland System Scenario 5 involves expansion of the Northern Ireland transmission network with transmission connecting Turleenan, Omagh, Coolkeeragh, Coleraine and Kells. Figure 11.1 shows the proposed termination locations for this scenario.
Figure 11.1. Proposed termination locations for Scenario 5.
The purpose of this scenario is different than the other scenarios. It is not intended to directly compare the performance of an AC option to an HVdc option, but rather to perform a very high level study demonstrating the potential feasibility of using a five-terminal VSC HVdc system to connect the mentioned terminals. The equivalent AC solution consists of double-circuit 275 kV AC transmission connecting the same five terminals.
The scope of work for this scenario is to undertake steady state contingency analysis to identify any overloads and transient stability issues. This will verify whether or not a five-terminal VSC link could potentially be feasible, although no such VSC link has ever been built. To provide a worst-case scenario for studying faults in Northern Ireland, the North-South Interconnector (studied in Scenario 2) was assumed to be based on LCC HVdc technology. This is a worst-case scenario because if the Moyle HVdc Interconnector and the North-South Interconnector would both be operating as inverters, it is possible that a fault in Northern Ireland could be severe enough to cause simultaneous commutation failures of both of these HVdc links, which would result in a temporarily loss of power infeed into the Northern Ireland area. The power flow cases selected for this scenario include a summer minimum load, high wind case with generation at Coolkeeragh dispatched to minimum to provide a minimum fault level case, and a winter peak case with Coolkeeragh dispatched to maximum.
PDF created with pdfFactory Pro trial version www.pdffactory.com

EirGrid plc Investigating the Impact of HVdc Schemes in the Irish Transmission Network
Final Report
R1116.03.04, Page 156 Oct-18, 2009
© TransGrid Solutions Inc, 2009
11.1. Transmission Options
LCC technology was not studied for this scenario due to the large number of terminals being considered and also because of the potential to connect wind farms into the terminals which is better-suited to VSC technology. The transmission alternative being considered for this scenario is described below. It uses VSC technology.
11.1.1. HVdc Scheme – Five-Terminal VSC
The HVdc scheme consists of a five-terminal bipolar VSC link connecting Turleenan to Omagh, Omagh to Coolkeeragh, Coolkeeragh to Coleraine, and Coleraine and Kells as shown in Figure 11.2.
Figure 11.2. Five-Terminal VSC scheme. The vendor-supplied PSSE VSC [3] model is monopolar and can only model up to 4 terminals, therefore the VSC transmission option was modeled using two parallel sets of two three-terminal monopolar VSC links as shown in Figure 11.2. As a result, two extra VSC converters must be modeled (as shown at Coolkeeragh) which will result in higher loss estimates than would exist in the real case due to the fixed losses associated with a VSC converter. For each of the two three-terminal links, all 12 VSC converters are modeled at +/-320 kV and the MVA rating of each converter was selected to match the closest available MVA rating of the VSC converters models. Table 11.1 tabulates the MVA rating proposed for the converters of the five-terminal VSC link and the actual MVA rating of converters modeled in this study for the two three-terminal VSC links. Table 11.1. Ratings of VSC converters. Converter location
Proposed converter MVA rating Actual MVA rating used in this study Turleenan 750x2 796x2 Omagh 700x2 796x2 Coolkeeragh 250x2 405x2+405x2 Coleraine 600x2 796x2 Kells 750x2 796x2
An HVdc bipole refers to an HVdc system that can continue operate with one of the two poles being out of service, a monopole cannot. Currently, a bipolar VSC cable scheme is limited to a 1200 MW rating, however in the timeframe of the implementation of this project, a rating in the range of 1500 MW in bipolar VSC cable systems are anticipated. The type and number of cables to be used in such a scheme would be design dependent based on the rated dc voltage and power levels.
11.1.2. Reactive Power Exchange with AC System
Voltage source converters have a large range of fast reactive supply and absorption capability, however the reactive power capability depends on the real power transmission. The vendor-supplied model used in this study has the per unit P-Q operating diagram shown in Figure 11.3 (figure taken from [3]). This diagram demonstrates that when operating at a real power level near the MVA rating of the VSC, the reactive power capability is significantly less than if operating at a lower power level, in fact the reactive power capability shown in Figure 11.3 is near 0 MVAR at 1 pu real power. The reactive power can be
Turleenan Omagh
Coolkeeragh
Coleraine
Kells
PDF created with pdfFactory Pro trial version www.pdffactory.com
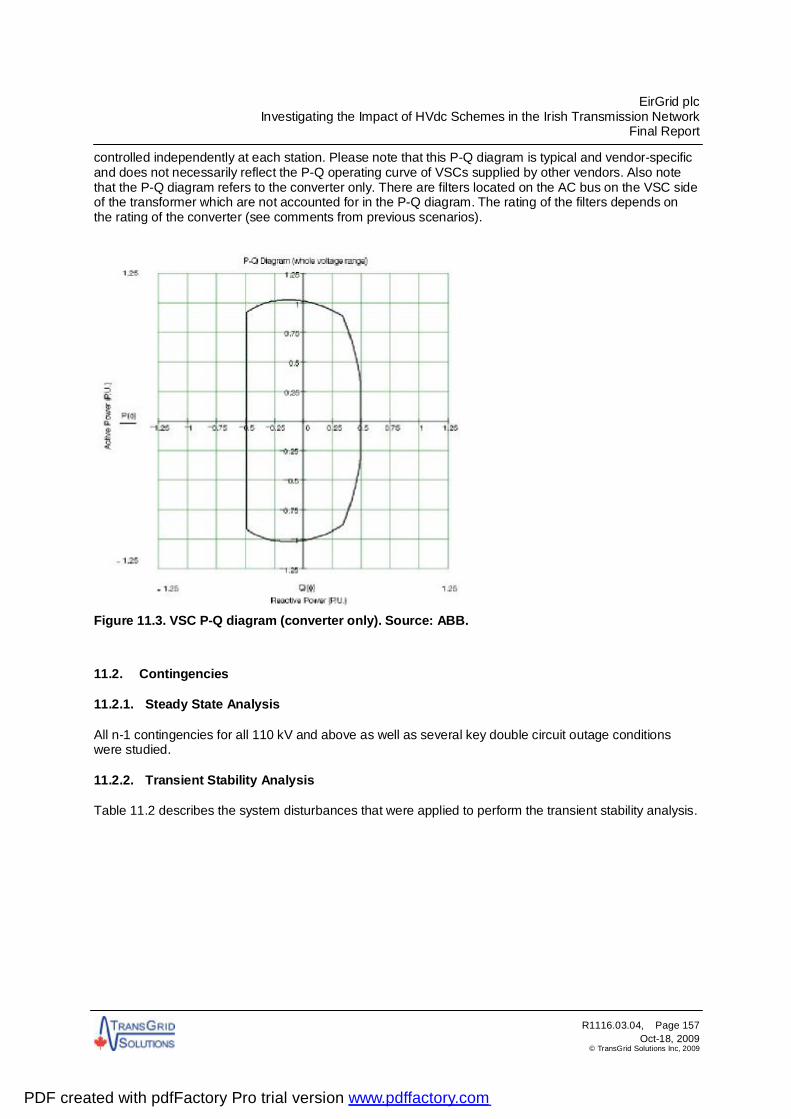
EirGrid plc Investigating the Impact of HVdc Schemes in the Irish Transmission Network
Final Report
R1116.03.04, Page 157 Oct-18, 2009
© TransGrid Solutions Inc, 2009
controlled independently at each station. Please note that this P-Q diagram is typical and vendor-specific and does not necessarily reflect the P-Q operating curve of VSCs supplied by other vendors. Also note that the P-Q diagram refers to the converter only. There are filters located on the AC bus on the VSC side of the transformer which are not accounted for in the P-Q diagram. The rating of the filters depends on the rating of the converter (see comments from previous scenarios).
Figure 11.3. VSC P-Q diagram (converter only). Source: ABB.
11.2. Contingencies
11.2.1. Steady State Analysis
All n-1 contingencies for all 110 kV and above as well as several key double circuit outage conditions were studied.
11.2.2. Transient Stability Analysis
Table 11.2 describes the system disturbances that were applied to perform the transient stability analysis.
PDF created with pdfFactory Pro trial version www.pdffactory.com

EirGrid plc Investigating the Impact of HVdc Schemes in the Irish Transmission Network
Final Report
R1116.03.04, Page 158 Oct-18, 2009
© TransGrid Solutions Inc, 2009
Table 11.2. Contingencies for Scenario 5. Fault Location Contingency Bus No. Base
kV
Fault Duration
Branch(es) Tripped
1 TANDRAGEE 90020 275 120 ms TAND – LOUTH
90020 -35231-1, 90020-35232-2
2 BALLYLUMFORD 70520 275 120 ms BFORD – KELLS
70520 – 81520-1
3 COOLKEERAGH 75520 275 120 ms COOLK – MAGFT
75520 – 73521-85020-1, 75520 – 73522-85020-1
4 TURLEENAN 90120 275 120 ms TURL – TAND
90120 – 90020-1, 90120 – 90020-2
5 TAMNAMORE 90320 275 120 ms TAMN - TURL
90320 – 90120-1 All 5 faults are 3-phase faults. No line reclosing is considered. Power flow case 5.1 studies all 5 contingencies, power flow case 5.2 studies contingencies 1 and 2.
11.3. Power Flows Cases and Losses
As a starting point for the power order settings for the VSC converters, the power order of each converter was set so that the total power injected into the AC system from the VSC converters was approximately equal to the amount of power injected to the AC system from the double-circuit 275 kV network. Table 11.3 describes the method used to set the power order and the corresponding power order for each VSC converter. Table 11.3. Power order setting of VSC converter.
Converter Rule used to set power order Type of Converter Power order setting for one pole (MW)
Turleenan- Omagh- Coolkeeragh VSC link Turleenan Equal to the powerflow in a one circuit from
Turleenan to Omagh 275 kV AC line (321 MW)
Inverter 314
Omagh Sum of powerflows in a one circuit from Omagh to Turleenan and Omagh to Coolkeeragh 275 kV lines (319 MW)
Rectifier 326
Coolkeeragh Equal to the powerflow in a one circuit from Coolkeeragh to Omagh 275 kV AC line (4 MW)
Rectifier 6
Coolkeeragh- Coleraine- Kells VSC link Coolkeeragh Equal to the powerflow in a one circuit from
Coolkeeragh to Coleraine 275 kV AC line (-1 MW)
Rectifier 3
Coleraine Sum of powerflows in a one circuit from Coleraine to Coolkeeragh and Coleraine to Kells 275 kV lines (104 MW)
Rectifier 108
Kells Equal to the powerflow in a one circuit from Kells to Coleraine 275 kV AC line (103 MW)
Inverter 98
Note that the power order values listed in Table 11.3 are slightly different from power transfers in double circuit 275 kV AC system due to the fact that the losses involved in the two systems are slightly different. Transmission losses in the five-terminal VSC link were calculated. According to the VSC manuals [3], each VSC converter has losses of 1.65% at nominal (rated) MVA loading, with 30% fixed losses and 70% variable plus the losses in the DC line.
PDF created with pdfFactory Pro trial version www.pdffactory.com

EirGrid plc Investigating the Impact of HVdc Schemes in the Irish Transmission Network
Final Report
R1116.03.04, Page 159 Oct-18, 2009
© TransGrid Solutions Inc, 2009
The total losses in the five-terminal VSC system at the power flows described in Table 11.3 were calculated to be 59.6 MW.
11.3.1. Steady State Contingency Analysis
Steady state contingency analysis was performed on the two power flow case described in Table 5.1.
11.3.2. Thermal Overloads
Table 11.4 lists the transmission line overloads observed for the VSC option. Table 11.4. Overloaded transmission lines in VSC option.
From Bus To Bus
Bus # Name kV Number Name kV CKT Contingency Rating (MW)
Flow (MW)
Overload (%)
87510 OMAH1 110 90310 TAMN 110 1 COOLK - MAGH 109.0 115.1 103.4
87510 OMAH1 110 90310 TAMN 110 2 COOLK - MAGH 109.0 126.0 113.1
87510 OMAH1 110 90310 TAMN 110 1 COOLK_COCO_MA 109.0 115.1 103.4
87510 OMAH1 110 90310 TAMN 110 2 COOLK_COCO_MA 109.0 126.0 113.1
79010 ENNISKIL 110 87510 OMAH 110 2 Enniskillen -Omagh 1 139.4 251.8 171.6*
79010 ENNISKIL 110 87510 OMAH 110 1 Enniskillen-Omagh 2 139.4 251.8 171.6*
1701 CATH_FAL 110 2321 DRUMKEEN 110 1 Double circuit Louth-Tandragee7 138.2 107 129.2
1701 CATH_FAL 110 28019 GOLAGH T 110 1 Double circuit Louth-Tandragee 127.7 107 119.3
2321 DRUMKEEN 110 3581 LETTERKE 110 1 Double circuit Louth-Tandragee 115.8 107 108.2
3581 LETTERKE 110 28019 GOLAGH T 110 1 Double circuit Louth-Tandragee 123.4 107 115.3
The 110 kV lines from Enniskillen to Omagh were also noted to be overloaded to more than 172% in the double-circuit 275 kV AC option. Three-winding transformers at Louth and Coleraine were found to be overloaded. Table 11.5 lists these overloads. Table 11.5. Overloaded winding of three winding transformers in VSC option.
Winding Information
Bus # Name kV CKT Contingency Rating (MVA) Flow (MW) Overload (%)
3522 LOUTH 220 2 S34 600 644.3 107.4*
3522 LOUTH 220 3 S35 300 321.7 107.2*
3522 LOUTH 220 1 S35 300 324.9 108.3*
3522 LOUTH 220 3 S628 300 321.8 107.3*
3522 LOUTH 220 1 S628 300 325.0 108.3*
75010 COLE1 110 1 S640 240 242.4 101.0 The Louth transformers were also noted to be overloaded in the double-circuit 275 kV AC option by more than the percentages listed in Table 11.5.
7 Contingency INTERCON simulates loss of the double circuit 275 kV lines from Louth to Tandragee. As in Scenario 2, it is assumed the North-South LCC Interconnector increases power order by 70% of pre-contingency power flow in the double circuit AC lines as is required to maintain stability.
PDF created with pdfFactory Pro trial version www.pdffactory.com
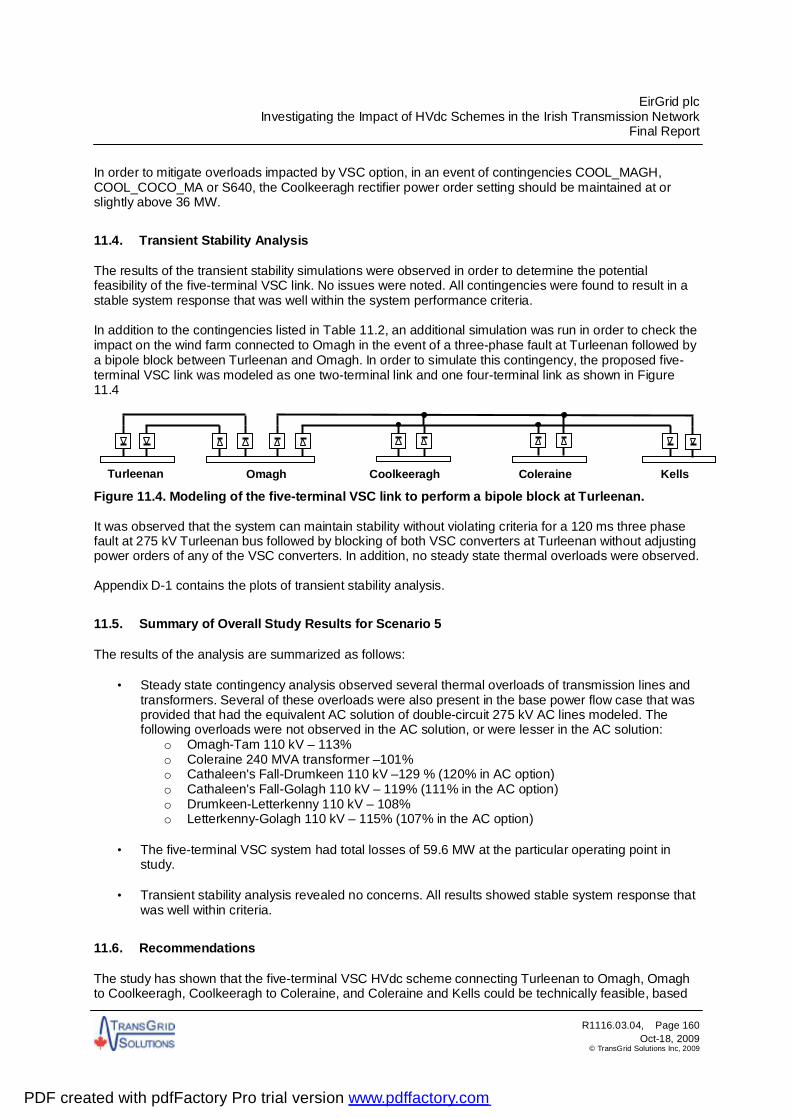
EirGrid plc Investigating the Impact of HVdc Schemes in the Irish Transmission Network
Final Report
R1116.03.04, Page 160 Oct-18, 2009
© TransGrid Solutions Inc, 2009
In order to mitigate overloads impacted by VSC option, in an event of contingencies COOL_MAGH, COOL_COCO_MA or S640, the Coolkeeragh rectifier power order setting should be maintained at or slightly above 36 MW.
11.4. Transient Stability Analysis
The results of the transient stability simulations were observed in order to determine the potential feasibility of the five-terminal VSC link. No issues were noted. All contingencies were found to result in a stable system response that was well within the system performance criteria. In addition to the contingencies listed in Table 11.2, an additional simulation was run in order to check the impact on the wind farm connected to Omagh in the event of a three-phase fault at Turleenan followed by a bipole block between Turleenan and Omagh. In order to simulate this contingency, the proposed five-terminal VSC link was modeled as one two-terminal link and one four-terminal link as shown in Figure 11.4
Figure 11.4. Modeling of the five-terminal VSC link to perform a bipole block at Turleenan. It was observed that the system can maintain stability without violating criteria for a 120 ms three phase fault at 275 kV Turleenan bus followed by blocking of both VSC converters at Turleenan without adjusting power orders of any of the VSC converters. In addition, no steady state thermal overloads were observed. Appendix D-1 contains the plots of transient stability analysis.
11.5. Summary of Overall Study Results for Scenario 5
The results of the analysis are summarized as follows:
• Steady state contingency analysis observed several thermal overloads of transmission lines and transformers. Several of these overloads were also present in the base power flow case that was provided that had the equivalent AC solution of double-circuit 275 kV AC lines modeled. The following overloads were not observed in the AC solution, or were lesser in the AC solution:
o Omagh-Tam 110 kV – 113% o Coleraine 240 MVA transformer –101% o Cathaleen's Fall-Drumkeen 110 kV –129 % (120% in AC option) o Cathaleen's Fall-Golagh 110 kV – 119% (111% in the AC option) o Drumkeen-Letterkenny 110 kV – 108% o Letterkenny-Golagh 110 kV – 115% (107% in the AC option)
• The five-terminal VSC system had total losses of 59.6 MW at the particular operating point in
study.
• Transient stability analysis revealed no concerns. All results showed stable system response that was well within criteria.
11.6. Recommendations
The study has shown that the five-terminal VSC HVdc scheme connecting Turleenan to Omagh, Omagh to Coolkeeragh, Coolkeeragh to Coleraine, and Coleraine and Kells could be technically feasible, based
Turleenan Omagh
Coolkeeragh
Coleraine
Kells
PDF created with pdfFactory Pro trial version www.pdffactory.com

EirGrid plc Investigating the Impact of HVdc Schemes in the Irish Transmission Network
Final Report
R1116.03.04, Page 161 Oct-18, 2009
© TransGrid Solutions Inc, 2009
on the analysis that was performed. It should be noted however that losses are quite high, up to 59.6 MW, due to the fixed losses associated with the five VSC converters. If HVdc transmission is being considered for any part of the expansion plans of the Northern Ireland system, then a more detailed study would need to be undertaken at a point in time when the study scenarios are more developed. Future studies could include more generation and load scenarios, more faults (including DC faults), short circuit analysis, sub-synchronous resonance studies and frequency scans. These studies should compare AC solutions with other viable transmission alternatives that include some or all parts being AC transmission. Typical applications of HVdc systems include: • Transmission with overhead line distances above 1 000 km, where the need of various intermediate
tapings is not present; • Interconnecting systems with different frequencies (50 Hz to 60 Hz); • Undersea or underground cables with lengths around 50 km or more; • Need for asynchronous operation (even at the same frequency base), like interconnection of different
markets. • Need for absolute power scheduling The only application that really applies to the situation being studied in this report is the use of HVdc cables. Typical applications of HVdc can also provide benefits such as power oscillation damping and frequency control. An HVdc power order can be quickly changed by an external signal (that should indicate a change in the network is taking place) as an additional signal in the power order scheduling. Power oscillation damping was not observed to be an issue in this study. Use of HVdc controls to achieve steady state or longer term frequency control is not expected to be applicable in the Irish network because the HVdc is being integrated into a meshed AC network, however frequency control was not modeled in this study and would therefore require further investigation to make any definite conclusions. It is not a case of being able to transfer excess generation from one area to another area that is deficient in generation as could typically be the case with an HVdc link connecting two isolated systems. A meshed AC network with embedded HVdc circuits can impose an added complexity to future network planning and expansion. For instance when planning the system it is difficult and expensive to tap into an existing HVdc circuit whereas an AC circuit can be easily tapped to serve new load or build a new AC station and lines. Based on the selected power flow cases and contingencies that were studied, there was nothing noted to suggest that the five-terminal VSC option would not be technically feasible, however it should be cautioned that no such system has ever been built, and the application of being embedded in a meshed AC network is not typical. In some instances, the use of HVdc technology can be considered as a viable way of transferring bulk power within an AC power system.
PDF created with pdfFactory Pro trial version www.pdffactory.com

EirGrid plc Investigating the Impact of HVdc Schemes in the Irish Transmission Network
Final Report
R1116.03.04, Page 162 Oct-18, 2009
© TransGrid Solutions Inc, 2009
12. References [1] Methodology Report, Investigating the Impact of HVdc Schemes in the Irish Network, Report number R1116.01.02, November 20, 2008.
[2] Prabha Kundur, Power System Stability and Control, McGraw-Hill Inc., 1993.
[3] User guide for the PSS/E Implementation of the HVDC Light Detailed model Version 1.1.6, ABB Memorandum, Document number 06TST0257 Rev. 16, September 26, 2008.
[4] R.M. Brandt, U.D. Annakkage, D.P. Brandt, N. Kshatriya, “Validation of a Two Time Step HVDC Transient Stability Simulation Model including Detailed HVDC Controls and DC Line L/R Dynamics”, IEEE PES General Meeting, Montreal, Canada, June 2006.
[5] R.M. Brandt, U.D. Annakkage, “Validation of a Two Time Step HVDC Converter and Cable Stability Model”, CIGRE Canada Conference on Power Systems, Calgary, Canada, August 27-28, 2007.
[6] Siemens PSS/E-30.2 Program Application Guide: Volume I , Chapter 10.4, November, 2005.
[7] Siemens PSS/E-30.2 Program Operation Manual: Volume I , Chapter 4.95, November, 2005.
[8] Siemens PSS/E-30.2 Program Application Guide: Volume I , Chapter 9.2.2.1, November, 2005.
[9] Ying Jiang-Hafner, Rolf Ottersten, “HVDC with Voltage Source Converters – A Desirable Solution for Connecting Renewable Energies”.
General References for Section 2:
M. P. Bahrman, B. K. Johnson: The ABCs of HVdc Transmission Technologies, IEEE Power and Energy Magazine, Vol.5, No.2, March/April 2007
M. Henderson, J. Gagnon, D. Bertagnolli, B. Hosie, G. DeShazo, B. Silverstein: ibid
Kirsten Faugstad (Convenor of CIGRE WG B4-44 HVdc Environmental Issues): An environmental survey on the operation and impact of HVdc electrodes, CIGRE Osaka Symposium, November 2007
R. Velázquez, H. G. Sarmiento, R. Castellanos, G. Pampin, G. Galicia, R. Adame: Technical and economical considerations of an hvdc submarine interconnection between the Mexican electrical system and the Baja California sur grid, CIGRE 2008 Session
- M. Szechtman, C. V. Thio and T. Wess: CIGRE HVdc Benchmark System for Control Studies, Electra no. 157, 1994.
- J. B. Davies: Notes on the HVdc Tutorial, CIGRE Osaka Meeting, November 2007. References for Section 3: “ANÁLISE ESTATÍSTICA DOS DESLIGAMENTOS FORÇADOS DE COMPONENTES DO SISTEMA ELÉTRICO BRASILEIRO REFERENTE AO ANO DE 2006”, ONS – Brazil, in Portuguese, 2007. “ANALYSIS OF HVDC THYRISTOR CONVERTER TRANSFORMER PERFORMANCE, CIGRÉ SC A2 Transformers and SC B4 HVDC and Power Electronics, JTF B4.04/A2-1, by D. J. CHRISTOFERSEN et al, November 2003. “A SURVEY OF THE RELIABILITY OF HVDC SYSTEMS THROUGHOUT THE WORLD DURING 2005 – 2006, by I. VANCERS, D.J. CHRISTOFERSEN, A. LEIRBUKT, M.G. BENNETT, Paper B4-119, CIGRE 2008.
PDF created with pdfFactory Pro trial version www.pdffactory.com

EirGrid plc Investigating the Impact of HVdc Schemes in the Irish Transmission Network
Final Report
R1116.03.04, Page 163 Oct-18, 2009
© TransGrid Solutions Inc, 2009
Scenario 1
North-West Mayo: 460 MW Wind Connection
APPENDIX A
PDF created with pdfFactory Pro trial version www.pdffactory.com

EirGrid plc Investigating the Impact of HVdc Schemes in the Irish Transmission Network
Final Report
R1116.03.04, Page 164 Oct-18, 2009
© TransGrid Solutions Inc, 2009
Appendix A-1 – Scenario 1: Select Plots for Transient Stability Analysis Contingencies as per Table 8.1.
Legend:
Blue waveforms – AC option 1 – Series-compensated 220 kV AC line
Green waveforms – AC option 2 – Two parallel 220 kV AC lines
Red waveforms – VSC option
PDF created with pdfFactory Pro trial version www.pdffactory.com

EirGrid plc Investigating the Impact of HVdc Schemes in the Irish Transmission Network
Final Report
R1116.03.04, Page 165 Oct-18, 2009
© TransGrid Solutions Inc, 2009
Appendix A-2 – Scenario 1: Steady State Contingency Analysis – Thermal Overloads Steady State Contingency Analysis of Power Flow Case 1.1.
PDF created with pdfFactory Pro trial version www.pdffactory.com

EirGrid plc Investigating the Impact of HVdc Schemes in the Irish Transmission Network
Final Report
R1116.03.04, Page 166 Oct-18, 2009
© TransGrid Solutions Inc, 2009
Appendix A-3 – Scenario 1: Steady State Contingency Analysis – Voltage Violations Steady State Contingency Analysis of Power Flow Case 1.1.
PDF created with pdfFactory Pro trial version www.pdffactory.com

EirGrid plc Investigating the Impact of HVdc Schemes in the Irish Transmission Network
Final Report
R1116.03.04, Page 167 Oct-18, 2009
© TransGrid Solutions Inc, 2009
Appendix A-4 – Scenario 1: Short Circuit Analysis Results System Intact Short Circuit Analysis of Power Flow Case 1.1.
PDF created with pdfFactory Pro trial version www.pdffactory.com

EirGrid plc Investigating the Impact of HVdc Schemes in the Irish Transmission Network
Final Report
R1116.03.04, Page 168 Oct-18, 2009
© TransGrid Solutions Inc, 2009
Appendix A-5 – Scenario 1: Frequency Scans System Intact Frequency Scans of Power Flow Case 1.1.
PDF created with pdfFactory Pro trial version www.pdffactory.com

EirGrid plc Investigating the Impact of HVdc Schemes in the Irish Transmission Network
Final Report
R1116.03.04, Page 169 Oct-18, 2009
© TransGrid Solutions Inc, 2009
Appendix A-6 – Scenario 1: Detailed Generator Dispatch Detailed Generator Dispatches of Power Flow Case 1.1.
PDF created with pdfFactory Pro trial version www.pdffactory.com

EirGrid plc Investigating the Impact of HVdc Schemes in the Irish Transmission Network
Final Report
R1116.03.04, Page 170 Oct-18, 2009
© TransGrid Solutions Inc, 2009
Scenario 2
North-South Interconnector
APPENDIX B
PDF created with pdfFactory Pro trial version www.pdffactory.com

EirGrid plc Investigating the Impact of HVdc Schemes in the Irish Transmission Network
Final Report
R1116.03.04, Page 171 Oct-18, 2009
© TransGrid Solutions Inc, 2009
Appendix B-1a – Scenario 2: Select Plots for Transient Stability Analysis 2.1 Contingencies as per Table 9.3.
Legend:
Blue waveforms – AC option
Green waveforms – LCC option
Red waveforms – VSC option
PDF created with pdfFactory Pro trial version www.pdffactory.com

EirGrid plc Investigating the Impact of HVdc Schemes in the Irish Transmission Network
Final Report
R1116.03.04, Page 172 Oct-18, 2009
© TransGrid Solutions Inc, 2009
Appendix B-1b – Scenario 2: Select Plots for Transient Stability Analysis 2.2 Contingencies as per Table 7.1.
Legend:
Blue waveforms – AC option
Green waveforms – LCC option
Red waveforms – VSC option
PDF created with pdfFactory Pro trial version www.pdffactory.com
EirGrid plc Investigating the Impact of HVdc Schemes in the Irish Transmission Network
Final Report
R1116.03.04, Page 173 Oct-18, 2009
© TransGrid Solutions Inc, 2009
Appendix B-1c – Scenario 2: Select Plots for Transient Stability Analysis 2.3 Contingencies as per Table 7.1.
Legend:
Blue waveforms – AC option
Green waveforms – LCC option
Red waveforms – VSC option
PDF created with pdfFactory Pro trial version www.pdffactory.com

EirGrid plc Investigating the Impact of HVdc Schemes in the Irish Transmission Network
Final Report
R1116.03.04, Page 174 Oct-18, 2009
© TransGrid Solutions Inc, 2009
Appendix B-1d – Scenario 2: Select Plots for Transient Stability Analysis 2.4 Contingencies as per Table 7.1.
Legend:
Blue waveforms – AC option
Green waveforms – LCC option
Red waveforms – VSC option
PDF created with pdfFactory Pro trial version www.pdffactory.com

EirGrid plc Investigating the Impact of HVdc Schemes in the Irish Transmission Network
Final Report
R1116.03.04, Page 175 Oct-18, 2009
© TransGrid Solutions Inc, 2009
Appendix B-2 – Scenario 2: Steady State Contingency Analysis – Thermal Overloads Steady State Contingency Analysis of Power Flow Cases 2.1, 2.2, 2.3, 2.4.
PDF created with pdfFactory Pro trial version www.pdffactory.com

EirGrid plc Investigating the Impact of HVdc Schemes in the Irish Transmission Network
Final Report
R1116.03.04, Page 176 Oct-18, 2009
© TransGrid Solutions Inc, 2009
Appendix B-3 – Scenario 2: Steady State Contingency Analysis – Voltage Violations Steady State Contingency Analysis of Power Flow Cases 2.1, 2.2, 2.3, 2.4.
PDF created with pdfFactory Pro trial version www.pdffactory.com

EirGrid plc Investigating the Impact of HVdc Schemes in the Irish Transmission Network
Final Report
R1116.03.04, Page 177 Oct-18, 2009
© TransGrid Solutions Inc, 2009
Appendix B-4 – Scenario 2: Short Circuit Analysis Results System Intact Short Circuit Analysis of Power Flow Cases 2.1, 2.2, 2.3, 2.4.
PDF created with pdfFactory Pro trial version www.pdffactory.com

EirGrid plc Investigating the Impact of HVdc Schemes in the Irish Transmission Network
Final Report
R1116.03.04, Page 178 Oct-18, 2009
© TransGrid Solutions Inc, 2009
Appendix B-5 – Scenario 2: Frequency Scans System Intact Frequency Scans of Power Flow Cases 2.1, 2.2, 2.3, 2.4.
PDF created with pdfFactory Pro trial version www.pdffactory.com

EirGrid plc Investigating the Impact of HVdc Schemes in the Irish Transmission Network
Final Report
R1116.03.04, Page 179 Oct-18, 2009
© TransGrid Solutions Inc, 2009
Appendix B-6 – Scenario 2: Detailed Generator Dispatch Detailed Generator Dispatches of Power Flow Cases 2.1, 2.2, 2.3, 2.4.
PDF created with pdfFactory Pro trial version www.pdffactory.com

EirGrid plc Investigating the Impact of HVdc Schemes in the Irish Transmission Network
Final Report
R1116.03.04, Page 180 Oct-18, 2009
© TransGrid Solutions Inc, 2009
Scenario 4
Drawing Power out of the Region near Cork
APPENDIX C
PDF created with pdfFactory Pro trial version www.pdffactory.com

EirGrid plc Investigating the Impact of HVdc Schemes in the Irish Transmission Network
Final Report
R1116.03.04, Page 181 Oct-18, 2009
© TransGrid Solutions Inc, 2009
Appendix C-1 – Scenario 4: Select Plots for Transient Stability Analysis Contingencies as per Table 10.1.
Legend:
Blue waveforms – AC option
Green waveforms – VSC option 1 – Three two-terminal VSC links
Red waveforms – VSC option – Two three-terminal VSC links
PDF created with pdfFactory Pro trial version www.pdffactory.com

EirGrid plc Investigating the Impact of HVdc Schemes in the Irish Transmission Network
Final Report
R1116.03.04, Page 182 Oct-18, 2009
© TransGrid Solutions Inc, 2009
Appendix C-2 – Scenario 4: Steady State Contingency Analysis – Thermal Overloads Steady State Contingency Analysis of Power Flow Case 4.1.
PDF created with pdfFactory Pro trial version www.pdffactory.com

EirGrid plc Investigating the Impact of HVdc Schemes in the Irish Transmission Network
Final Report
R1116.03.04, Page 183 Oct-18, 2009
© TransGrid Solutions Inc, 2009
Appendix C-3 – Scenario 4: Steady State Contingency Analysis – Voltage Violations Steady State Contingency Analysis of Power Flow Case 4.1.
PDF created with pdfFactory Pro trial version www.pdffactory.com

EirGrid plc Investigating the Impact of HVdc Schemes in the Irish Transmission Network
Final Report
R1116.03.04, Page 184 Oct-18, 2009
© TransGrid Solutions Inc, 2009
Appendix C-4 – Scenario 4: Short Circuit Analysis Results System Intact Short Circuit Analysis of Power Flow Case 4.1.
PDF created with pdfFactory Pro trial version www.pdffactory.com

EirGrid plc Investigating the Impact of HVdc Schemes in the Irish Transmission Network
Final Report
R1116.03.04, Page 185 Oct-18, 2009
© TransGrid Solutions Inc, 2009
Appendix C-5 – Scenario 4: Frequency Scans System Intact Frequency Scans of Power Flow Case 4.1.
PDF created with pdfFactory Pro trial version www.pdffactory.com

EirGrid plc Investigating the Impact of HVdc Schemes in the Irish Transmission Network
Final Report
R1116.03.04, Page 186 Oct-18, 2009
© TransGrid Solutions Inc, 2009
Appendix C-6 – Scenario 4: Detailed Generator Dispatch Detailed Generator Dispatches of Power Flow Case 4.1.
PDF created with pdfFactory Pro trial version www.pdffactory.com
EirGrid plc Investigating the Impact of HVdc Schemes in the Irish Transmission Network
Final Report
R1116.03.04, Page 187 Oct-18, 2009
© TransGrid Solutions Inc, 2009
Scenario 5
System Expansion in Northern Ireland
APPENDIX D
PDF created with pdfFactory Pro trial version www.pdffactory.com

EirGrid plc Investigating the Impact of HVdc Schemes in the Irish Transmission Network
Final Report
R1116.03.04, Page 188 Oct-18, 2009
© TransGrid Solutions Inc, 2009
Appendix D-1 – Scenario 5: Select Plots for Transient Stability Analysis Contingencies as per Table 11.2.
Fault Location Contingency Bus No. Base
kV
Fault Duration
Branch(es) Tripped
1 TANDRAGEE 90020 275 120 ms TAND – LOUTH
90020 -35231-1, 90020-35232-2
2 BALLYLUMFORD 70520 275 120 ms BFORD – KELLS
70520 – 81520-1
3 COOLKEERAGH 75520 275 120 ms COOLK – MAGFT
75520 – 73521-85020-1, 75520 – 73522-85020-1
4 TURLEENAN 90120 275 120 ms TURL – TAND
90120 – 90020-1, 90120 – 90020-2
5 TAMNAMORE 90320 275 120 ms TAMN - TURL
90320 – 90120-1
Legend:
Blue waveforms – AC option
PDF created with pdfFactory Pro trial version www.pdffactory.com
EirGrid plc Investigating the Impact of HVdc Schemes in the Irish Transmission Network
Final Report
R1116.03.04, Page 189 Oct-18, 2009
© TransGrid Solutions Inc, 2009
Appendix D-2 – Scenario 5: Detailed Generator Dispatch Detailed Generator Dispatches of Power Flow Cases 5.1 and 5.2.
PDF created with pdfFactory Pro trial version www.pdffactory.com