investigating pretreatment methods for struvite ... · i want to thank dr. jactone arogo ogejo, for...
TRANSCRIPT

Investigating Pretreatment Methods for Struvite
Precipitation in Liquid Dairy Manure
Yanwen Shen
Thesis submitted to the faculty of the
Virginia Polytechnic Institute and State University
in partial fulfillment of the requirements for the degree of
Master of Science
In
Biological Systems Engineering
Jactone Arogo Ogejo, Chair
Katharine F. Knowlton, Committee member
Zhiyou Wen, Committee member
June 17, 2010
Blacksburg, VA
Keywords: struvite precipitation, dairy manure, calcium inhibition, phosphorus release

Investigating Pretreatment Methods for Struvite
Precipitation in Liquid Dairy Manure
Yanwen Shen
Abstract
Phosphorus (P) recovery and re-use is very important today for sustainable
nutrient cycling and water quality protection due to the declining global P reserves and
increasingly stringent wastewater treatment regulations. P recovery as struvite
(MgNH4PO4·6H2O) is a promising technology because it can be used as a slow-release
fertilizer. The objective of this study was to investigate different pretreatment methods to
enhance struvite precipitation in dairy manure.
Generally there are two challenges that need to be overcome to precipitate struvite
in liquid dairy manure. The first is the relatively high calcium (Ca) concentration. The
present study investigated the effectiveness of two calcium binding reagents to reduce the
calcium inhibitory effects to enhance the struvite precipitation. A chemical equilibrium
model (Visual MINTEQ 2.60) was used to determine the pH to acidify manure and to
precipitate struvite. Then, bench-scale experiments were conducted to validate the model
results using synthetic and untreated manure. First, the manure was acidified (pH 4.5) to
liberate the particulate-bounded Mg2+
, Ca2+
and inorganic P. Second, EDTA and/or
oxalate compounds were added to the manure. Third, pH was increased to 7.5 for struvite
precipitation from the liquid filtrate. Results showed that struvite-containing crystals
were obtained from the samples treated with calcium removal compounds, with a total
suspended solids (TSS) concentration less than 4,000 mg/L

iii
The second challenge is the low dissolved reactive P (DRP, i.e. PO4-P) to total P
(TP) ratio. This study investigated different pretreatment methods for P release to
enhance struvite precipitation in liquid dairy manure: enhanced biological phosphorus
removal (EBPR), microwave heating (MW) and anaerobic digestion (AD). All of the
pretreatment methods resulted in P release but struvite crystals were observed only in
precipitates obtained in manure pretreated with MW+H2SO4 acidification. Without oxalic
acid to reduce the Ca2+
effects, all the other pretreatment methods were not effective in
enhancing struvite precipitation in liquid dairy manure. Hardly any struvite or crystalline-
like solids were found in the non-centrifuged samples, regardless of any pretreatment,
indicating the effects of suspended solids and organic matter on struvite precipitation.
A partial economic analysis was conducted to assess the chemical costs of P
recovery from liquid dairy manure with different pretreatment methods; P recovery
amounts as struvite were modeled by Visual Minteq 2.61.Three pretreatment conditions
(untreated manure + oxalic acid, MW + H2SO4 acidification, and AD) were selected
based on the precipitation results. MW + H2SO4 acidification produced the highest
struvite quantities among the pretreatment methods to enhance struvite recovery, also
with the lowest chemical addition costs.

iv
Acknowledgement
Funds for this study were provided by National Fish and Wildlife Foundation and
Farm Pilot Project Coordination Inc.
I want to thank Dr. Jactone Arogo Ogejo, for his guidance, support and
encouragement through my thesis studies. My sincere gratitude also goes to Dr.
Katharine F. Knowlton and Dr. Zhiyou Wen for your invaluable advice and assistance in
my study.
I would like to express my appreciation to those lovely people who showed their
kindness to help me with my thesis research: Kathy Lowe (Virginia-Maryland Regional
College of Veterinary Medicine), Stephen McCartney (Institute for Critical Technology
and Applied Science), Hubert L. Walker (Crop and Soil Environmental Science
Department), Karen Hall (Dairy Science), Leslie Sarmiento, Rana Roshdieh, Issac
Alukwee, Sara Senyodo and Porter Knight.
Finally, I would like to give my deepest appreciation for my mother, who is
always there to support me, loving me forever.

v
TABLE OF CONTENTS
1. Introduction ..................................................................................................................... 1
1.1 Problem Definition .................................................................................................... 1
1.2 Research Objectives .................................................................................................. 6
References ....................................................................................................................... 7
2. Background ................................................................................................................... 13
2.1 Dairy Manure Nutrients and forms of Phosphorus ................................................. 13
2.2 Phosphorus Recovery .............................................................................................. 16
2.2.1 Calcium phosphate ........................................................................................... 16
2.2.2 Magnesium ammonium phosphate (struvite) ................................................... 19
2.3 Struvite Precipitation Chemistry ............................................................................. 20
2.4 Factors Affecting Struvite Precipitation Process .................................................... 22
2.4.1 pH ..................................................................................................................... 22
2.4.2 Mg2+
/NH4-N/PO4-P ratio .................................................................................. 23
2.4.3 Presence of other ions ....................................................................................... 25
2.4.4 Suspended solids and organic matter content ................................................... 27
2.5 Pretreatment to Enhance Struvite Precipitation in Dairy Manure ........................... 30
2.5.1 Anaerobic digestion .......................................................................................... 30
2.5.2 Enhanced biological phosphorus removal (EBPR) .......................................... 31
2.5.3 Microwave digestion ........................................................................................ 32
2.5.4 Ethylenediaminetetraacetic acid (EDTA) or oxalate addition .......................... 33
2.5.5 Bio-Catalytic Calcification (BCC) ................................................................... 34
References ..................................................................................................................... 35
3. Abating the Effects of Calcium on Struvite Precipitation in Liquid Dairy Manure ..... 46
3.1 Introduction ............................................................................................................. 46
3.2 Materials and Methods ............................................................................................ 49
3.2.1 Chemical Modeling .......................................................................................... 49
3.2.2 Testing Model Results With Synthetic Liquid Dairy Manure .......................... 53
3.2.3 Struvite Precipitation in Liquid Dairy Manure ................................................. 56
3.2.4 Sampling and Analysis ..................................................................................... 57

vi
3.3 Results and Discussions .......................................................................................... 58
3.3.1 Chemical Equilibrium Modeling ...................................................................... 58
3.3.2 Synthetic Liquid Dairy Manure Experiments ................................................... 65
3.3.3 Liquid Dairy Manure Experiments ................................................................... 69
3.4 Conclusions ............................................................................................................. 74
References ..................................................................................................................... 75
4. Thermal and biological-based pretreatment methods for phosphorus release to enhance
struvite precipitation ......................................................................................................... 79
4.1 Introduction ............................................................................................................. 79
4.2 Objectives ................................................................................................................ 79
4.3 Materials and Methods ............................................................................................ 79
4.3.1 EBPR pretreatment ........................................................................................... 79
4.3.2 Microwave heating ........................................................................................... 82
4.3.3 Anaerobic digestion .......................................................................................... 83
4.3.4 Struvite precipitation ........................................................................................ 85
4.3.5 Sampling and Analytical Methods ................................................................... 87
4.4 Results and Discussions .......................................................................................... 88
4.4.1 EBPR P release and struvite precipitation ........................................................ 88
4.4.2 Precipitates characteristics from EBPR treated manure ................................... 90
4.4.3 Microwave P solubilization and struvite precipitation ..................................... 98
4.4.4 Precipitates characteristics (microwave treatment) ........................................ 101
4.4.5 Anaerobic digestion performance ................................................................... 110
4.4.6 Precipitates characteristics (anaerobic digestion) ........................................... 112
4.4.7 TSS effects ...................................................................................................... 116
4.5 Conclusions ........................................................................................................... 118
References ................................................................................................................... 119
5. Economic evaluation of different pretreatment methods to enhance struvite
precipitation in liquid dairy manure ................................................................................ 121
5.1 Introduction ........................................................................................................... 121
5.2 Objective ............................................................................................................... 121
5.3 Materials and Methods .......................................................................................... 121

vii
5.4 Results and Discussions ........................................................................................ 124
5.5 Conclusions ........................................................................................................... 127
References ................................................................................................................... 127

viii
List of Figures
Figure 1. Global key phosphorus flows, where units are in million tons per year (adapted
from Cordell et al., 2009) .................................................................................................... 3
Figure 2. P forms in dairy manure .................................................................................... 15
Figure 3. Average characteristics (n = 107) of dairy manure in Rockingham County (VA).
Error bars show standard deviations. ................................................................................ 47
Figure 4. Model predictions of the (a) saturation index of minerals at pH 4.0 to 6.5 and (b)
quantities of minerals precipitated dissolved DRP fraction .............................................. 59
Figure 5. Model predictions for struvite precipitation in the positive control with
Mg/Ca/PO4-P molar ratio of 1.6/0.4/1 .............................................................................. 62
Figure 6. Model predictions for struvite precipitation in the negative control with
Ca/Mg/PO4-P molar ratio of 4.43/3.04/1 .......................................................................... 62
Figure 7. Model predictions for struvite precipitation in the EDTA treated dairy manure
........................................................................................................................................... 63
Figure 8. Model predictions for struvite precipitation in the oxalic acid treated dairy
manure............................................................................................................................... 63
Figure 9. Model predictions for struvite precipitation in the Mg amended (Ca/Mg 0.25)
dairy manure ..................................................................................................................... 64
Figure 10. SEM and XRD results of recovered precipitates from synthetic liquid dairy
manure for (a) positive control, (b) negative control, (c) EDTA treatment, (d) oxalate
treatment and (e) Mg amendment. The blue vertical lines are the XRD patterns from the
reference (struvite) in the database. .................................................................................. 67
Figure 11. SEM and XRD results of recovered precipitates from non centrifuged (raw)
liquid dairy manure for the untreated and the EDTA and oxalic acid treatments. The blue
vertical lines are the XRD patterns from the reference (struvite) in the database. ........... 71
Figure 12. SEM and XRD results of recovered precipitates from centrifuged liquid dairy
manure for the (a) untreated (control), (b) EDTA treatment, (c) oxalic acid treatment and
(d) Mg amendment. The blue vertical lines are the XRD patterns from the reference
(struvite) in the database. .................................................................................................. 72
Figure 13. Flow diagram of single-stage complete mix digester ...................................... 86

ix
Figure 14. The effects of (a) NaAc amendment dosage and (b) anaerobic storage time on
P release in EBPR AML ................................................................................................... 89
Figure 15. Energy dispersive X-ray mapping analysis of precipitated solids from different
EBPR mediums: (a1) C - AML; (a2) NC - AML; (b1) C - Feed; (b2) NC - Feed. .......... 93
Figure 16. SEM image and (b) XRD patterns of precipitated solids from centrifuged
EBPR AML ....................................................................................................................... 95
Figure 17. SEM images of precipitated solids from centrifuged EBPR feed; the EDS
analysis output an approximate 1:1:4.5 molar ratio of Mg:P:O for focused orthorhombic
crystal , with a mass composition of 24.13 % P, 18.77 % Mg, 56.18 % O and 0.59 % Ca
........................................................................................................................................... 96
Figure 18. SEM image and (b) XRD patterns of non-centrifuged EBPR AML; (c) SEM
image and (d) XRD patterns of non-centrifuged EBPR feed ........................................... 97
Figure 19. (a) DRP concentrations digested using microwave radiation with different
acidification pretreatment methods versus heating temperatures (data were means of 3
replicates and error bars showed standard deviations); (b) pH value of microwave
digested manure without acidification pretreatment versus heating temperatures. The dash
lines in Figure 19 (a) represented the DRP concentration of acidified manure (254.96
mg/L) and untreated manure (30.67 mg/L), respectively. ................................................ 99
Figure 20. Energy dispersive X-ray mapping analysis output of microwave digested
manure with varying acidification pretreatments: (a1) H2SO4 (centrifuged); (a2) H2SO4
(non-centrifuged); (a3) H2SO4+oxalic acid (centrifuged); (b1) HCl (centrifuged); (b2)
HCl (non-centrifuged); (b3) HCl+oxalic acid (centrifuged); (c1) control (centrifuged); (c2)
control (non-centrifuged); (c3) control+oxalic acid (centrifuged).................................. 104
Figure 21. Scanning electron micrographs of solids precipitated from MW manure with
pretreatment of (a1) H2SO4 (centrifuged); (a2) H2SO4+oxalic acid (centrifuged); (b1) HCl
(centrifuged); (b2) HCl+oxalic acid (centrifuged); (c1) control (centrifuged); (c2)
control+oxalic acid (centrifuged) .................................................................................... 105
Figure 22. X-ray diffractograms of materials precipitated from MW manure pretreated
with (a) H2SO4 (centrifuged); (b) H2SO4+oxalic acid (centrifuged). Blue lines represented
standard struvite crystals (JCPDF-2 # 71-2089) ............................................................. 107
Figure 23. X-ray diffractograms of materials precipitated from MW manure pretreated
with (a) HCl (centrifuged); (b) HCl+oxalic acid (centrifuged). Blue line represented
standard struvite crystals (JCPDF-2 # 71-2089) ............................................................. 108

x
Figure 24. X-ray diffractograms of materials precipitated from MW manure (a) without
acidification pretreatment; (b) with oxalic acid pretreatment. Blue line represented
standard struvite crystals (JCPDF-2 # 71-2089) ............................................................. 109
Figure 25. Scanning electron micrographs of solids precipitated from (a1) anaerobically
digested manure (centrifuged); (a2) anaerobically digested manure (non-centrifuged); (a3)
anaerobically digested manure pretreated with oxalic acid (centrifuged); (b1) raw manure
(centrifuged); (b2) raw manure (non-centrifuged) .......................................................... 114
Figure 26. X-ray diffractograms of materials precipitated from (a) anaerobically digested
manure; (b) anaerobically digested manure pretreated with oxalic acid. Blue line
represented standard struvite crystals (JCPDF-2 # 71-2089) ......................................... 115
Figure 27. Schematic process of enhanced struvite precipitation with different
pretreatment methods ...................................................................................................... 122

xi
List of Tables
Table 1. P recovery as calcium phosphate: advantages and disadvantages ...................... 18
Table 2. The P removal by struvite precipitation from swine or dairy manure in published
studies ............................................................................................................................... 28
Table 3. Average composition of liquid dairy manure ..................................................... 51
Table 4. Table Experimental treatments ........................................................................... 54
Table 5. Visual MINTEQ model inputs ............................................................................ 54
Table 6. Precipitation equations for the possible minerals that can formed during struvite
precipitation ...................................................................................................................... 55
Table 7. DRP removal from synthetic liquid dairy manure .............................................. 66
Table 8. DRP removal from liquid dairy manure ............................................................. 70
Table 9. Characteristics of EBPR AML in this study ....................................................... 81
Table 10. Anaerobic digestion feed characteristics .......................................................... 84
Table 11. Compositions of EBPR feed and AML before and after struvite precipitation
(C-AML, centrifuged AML; NC-AML, non-centrifuged AML; C-Feed, centrifuged feed;
NC-Feed, centrifuged feed) .............................................................................................. 91
Table 12. Energy dispersive X-ray spectra analysis results of precipitated solids from
different EBPR mediums .................................................................................................. 92
Table 13. EDS analysis results of precipitated solids from microwave digested (MW)
manure............................................................................................................................. 103
Table 14. Characteristics of AD influents and effluents ................................................. 111
Table 15. EDS analysis for precipitated solids from raw and anaerobically digested
manure............................................................................................................................. 113
Table 16. TS and TSS concentrations of different dairy manure ................................... 117
Table 17. Visual Minteq inputs for different pretreated manure .................................... 123

xii
Table 18. Quantities of struvite recovered from manure subjected to different
pretreatment methods by Visual Minteq 2.61. ................................................................ 126
Table 19. Chemical costs analysis for struvite recovery from manure with different
pretreatments ................................................................................................................... 126
Table 20. Annual chemical costs of struvite recovery and corresponding struvite
productions for a typical dairy farm (200 cows with 68 L manure/day·animal) ............ 126

1
1. INTRODUCTION
1.1 PROBLEM DEFINITION
Phosphorus (P) is an essential element needed by all living matters for growth and
development, as its availability controls many biological productivities. The major source
of P is in the form of mined phosphate (PO4-P) rock and about 90 % of the phosphate
rock extracted globally is used as mineral fertilizer for productions of crops, industrial
products (e.g. detergents), human food, animal feed additives and other (Smil, 2000;
Jasinski, 2008). The global phosphorus fates were analyzed key phosphorus flows were
illustrated in Figure 1 (Cordell et al., 2009). Unlike fossil fuels which have the potential
to be substituted by renewable energy (e.g. wind, biomass, or thermal energy),
phosphorus is a non-renewable resource with no substitute and cannot be manufactured
or synthesized. It has been estimated that mined phosphate rock reserves could be
exhausted within 50 ~ 100 years if used at the current rate (Cordell et al., 2009).
Furthermore, the fertilizer industries recognize that the quality of phosphate rock is
declining, thus forcing the cost of extraction, processing and shipping to increase (Driver,
1998; Steen, 1998; Smil, 2000; EcoSanRez, 2003). Additional demands on P are being
experienced from the population growth, which requires commensurate increase in food
production and the current interest in expanding the production of biofuels derived from
crops (Cordell et al., 2009).
Before 1945, organic waste such as animal manure and human excreta was
recycled in agriculture as the main P fertilizer for agricultural production (Cordell et al.,
2009). Thus, locally produced food was consumed locally, and nutrients from different
waste streams would be applied back to the local agricultural land. However, this P

2
recycle loop was broken because of the explosion in human population growth and
associated increasing food demand and urbanization. Thus after 1945, phosphate rock
was exploited in large quantities and became the dominant P fertilizer source. The unit
price of phosphate rock has increased constantly since early 1970’s (Jasinski, 2009). The
price increased more than 700 % in a 14-month period between 2007 and 2009 due the
pressure of global food crisis and the prediction that phosphate rock is in short supply
(Cordell et al., 2009). Based on the consumer behavior and the availability of P, the
global P production is estimated to reach the peak point in the next 20 to 30 years
(Cordell et al., 2009). The “peak phosphorus” prediction was derived from Hubbert
theory (Hubbert, 1949) for oil crisis.
On the other hand, eutrophication of water bodies caused by P enrichment from
point and/or non-point sources (e.g. agricultural runoff, municipal sewage and industrial
wastewater) has been the focus of water quality protection for a long time. For example,
agricultural sources were reported to account for approximately 48 % of the impaired
lakes, rivers and streams in United States (USEPA, 2002). Therefore, recovering P
released from sources like wastewater and livestock manure has important implications in
controlling water pollution and making the use of P sustainable.

3
Figure 1. Global key phosphorus flows, where units are in million tons per year (adapted from Cordell et al., 2009)
Phosphate Rock
Reserves
Industrial products
like detergents
Natural
Water
Bodies
17.5
3 1.2
0.2
0.3 1.5
1.8
0.8 0.9
8
0.9 3
0.9
Animal Feed
Additives
Mined
Phosphate
Rock
P Fertilizer
Production Soil Crops Harvested
Crops
Food
Commodities
Human
Need
Animal
Development Animal
Manure
Human
Excreta
Biosolid
s Waste
2
12.1
0.6
1.2
Vegetation Natural Environment
(biomass, land, water)
15
7
8
14.9 14 12 7 3.5 3
2.6

4
Today, the upgrades of existing and planning of new wastewater treatment plants are
based on improving their performance in nutrient reduction as well as recovery of
resources such as phosphorus and energy from biogas production (Giesen, 1999).
Recovery of P through precipitation as magnesium ammonium phosphate (struvite) has
gained interest in the past decade. The recovery of struvite from municipal wastewater
(Ohlinger et al, 2000; Adnan et al., 2003a; Adnan et al, 2003b; Bhuiyan et al., 2008;
Forrest et al., 2008), swine wastewater (Burns et al., 2001; Nelson et al., 2003; Suzuki et
al., 2005), and industrial wastewater (El Diwani et al., 2007; Kim et al., 2009;
Warmadewanthi and Liu, 2009) recovery has been successfully demonstrated. In fact,
there are several full scale struvite recovery systems in operation in wastewater treatment
plants around the world (Williams, 1999; Ueno and Fujii, 2001; Battistoni et al., 2004;
Battistoni et al, 2006). The constituents of struvite i.e., ammonium (NH4+), PO4
3-, and
magnesium (Mg2+
) ions in equal molar concentrations makes it a good fertilizer
compared to other phosphate containing fertilizers (Gaterell et al., 2000; Li and Zhao,
2003; Johnson and Richards, 2003; de-Bashan and Bashan 2004; Ponce and De Sa
MEGL, 2007).
Animal manure is rich in phosphorus and other nutrients (ASABE, 2005) and has
been identified as a potential resource for P recovery and reuse (Greaves et al., 1999;
Barnard 2009). However, limited information is available on struvite recovery from
liquid dairy manure and some of the challenges associated with struvite recovery have
been reported to be (i) the high suspended solids concentration (Schuiling and Andrade,
1999), (ii) low dissolved reactive phosphorus to total phosphorus (DRP/TP) ratio (Barnett,
1994; Harris et al., 2008) and (iii) high Ca2+
concentration (Gungor and Karthikeyan,

5
2005). It has been observed that most of inorganic fraction of total P in dairy manure is
predominantly in a particulate-bound form and associated with Ca and Mg (Gungor and
Karthikeyan, 2005), leaving very little soluble PO43-
to precipitate struvite. Furthermore,
calcium ions (Ca2+
) have been noted to interfere with or inhibit struvite precipitation
through reacting with PO43-
to form calcium phosphates (Le Corre et al., 2005; Wang et
al., 2005). Attempts to enhance struvite precipitation from dairy manure included
anaerobic digestion, Mg augmentation (Zeng and Li, 2006) and microwave heating
assisted with inorganic acid addition and hydrogen peroxide (Pan et al, 2006; Qureshi et
al., 2008). These pretreatment methods were employed to increase DRP/TP ratios and/or
Mg2+
availability. However, very few studies were carried out to study the effects of
reducing Ca2+
on struvite precipitation from dairy manure.

6
1.2 RESEARCH OBJECTIVES
The major goal of this study was to investigate the pretreatment methods for struvite
precipitation in liquid dairy manure. The specific objectives were to:
Investigate the effectiveness of ethylenediaminetetraacetic acid (EDTA) and
oxalic acid in reducing the effects of calcium to enhance struvite precipitation in
liquid dairy manure.
Evaluate the potential of struvite precipitation in liquid dairy manure pretreated
by EBPR (enhanced biological phosphorus removal) treatment.
Evaluate the struvite precipitation potential in liquid dairy manure treated with
thermal and biological-based methods (EBPR, microwave heating and anaerobic
digestion).
Make a comparative chemical costs analysis of struvite precipitation in liquid
dairy manure subjected to different pretreatments: (1) untreated manure + oxalic
acid; (2) MW + H2SO4 acidification; (3) AD + oxalic acid.

7
REFERENCES
Adnan, A., D. S. Mavinic, and F. A. Koch. 2003a. Pilot-scale study of phosphorus
recovery through struvite crystallization - I. Examining the feasibility of applying
the process technology. Journal of Environmental Engineering and Science 2(5):
315-324.
Adnan, A., D. S. Mavinic, and F. A. Koch. 2003b. Pilot-scale study of phosphorus
recovery through struvite crystallization - II. Applying in-reactor supersaturation
ratio as a process control parameter. Journal of Environmental Engineering and
Science 2(6): 473-483.
Adnan, A., M. Dastur, D. S. Mavinic, and F. A. Koch. 2004. Preliminary investigation
into factors affecting controlled struvite crystallization at the bench scale. Journal
of Environmental Engineering and Science 3(3): 195-202.
ASABE. 2005. Manure characteristics. American Society of Agricultural and Biological
Engineers (ASABE) Standard D384.2. St. Joseph, Mich.
Barnard, J. 2009. Elimination of eutrophication through resource recovery. International
conference on nutrient recovery from wastewater streams. Eds K. Ashley, D.
Mavinic, and F. Koch. IWA Publishing, pp 45-54.
Barnett, G. M. 1994. Phosphorus forms in animal manure. Bioresource Technology 49(2):
139-147.
Battistoni, P. 2004. Phosphorus recovery trials in Treviso, Italy – theory modeling and
application. Phosphorus in environmental technologies: Principles and
applications. London: IWA Publishing, pp. 428-469.

8
Battistoni, P., B. Paci, F. Fatone, and P. Pavan. 2006. Phosphorus removal from
anaerobic supernatants: start-up and steady-state conditions of a fluidized bed
reactor full-scale plant. Industrial & Engineering Chemistry Research 45(2): 663-
669
Bhuiyan, M. I. H., D. S. Mavinic, and F. A. Koch. 2008. Phosphorus recovery from
wastewater through struvite formation in fluidized bed reactors: a sustainable
approach. Water Science and Technology 57(2):175-181.
Burns, R. T., L. B. Moody, F. R. Walker, and D. R. Raman. 2001. Laboratory and in-situ
reductions of soluble phosphorus in swine waste slurries. Environmental
Technology 22(11): 1273-1278.
Cordell, D., Drangert, J-O., White, S., 2009. The story of phosphorus: Global food
security and food for thought. Global Environmental Change 19, 292-305.
de-Bashan, L. E., and Y. Bashan. 2004. Recent advances in removing phosphorus from
wastewater and its future use as fertilizer (1997-2003). Water Research 38(19):
4222-4246.
Driver, J., 1998. Phosphates recovery for recycling from sewage and animal waste.
Phosphorus and Potassium 216, 17-21.
EcoSanRes, 2003. Closing the loop on phorsphorus: Stockholm Environment Institute
(SEI) funded by SIDA Stockholm.
El Diwani, G., S. El Rafie, N. N. El Ibiari, and H. I. El-Aila. 2007. Recovery of ammonia
nitrogen from industrial wastewater treatment as struvite slow releasing fertilizer.
Desalination 214(1-3): 200-214.

9
Forrest, A. L., K. P. Fattah, D. S. Mavinic, and F. A. Koch. 2008. Optimizing struvite
production for phosphate recovery in WWTP. Journal of Environmental
Engineering-ASCE 134(5): 395-402.
Gaterell, M. R., R. Gay, R. Wilson, R. J. Gochin, and J. N. Lester. 2000. An economic
and environmental evaluation of the opportunities for substituting phosphorus
recovered from wastewater treatment works in existing UK fertilizer markets.
Environmental Technology 21(9): 1067-1084.
Giesen, A. 1999. Crystallization process enables environmental friendly phosphate
removal at low costs. Environmental Technology 20(7): 769-775.
Greaves, J., P. Hobbs, D. Chadwick, and P. Haygarth. 1999. Prospects for the recovery of
phosphorus from animal manures: a review. Environmental Technology 20(7):
697-708.
Gungor, K., and K. G. Karthikeyan. 2005. Influence of anaerobic digestion on dairy
manure phosphorus extractability. Transactions of the ASAE 48(4): 1497-1507.
Harris, W. G., A. C. Wilkie, X. Cao and R. Sirengo. 2008. Bench-scale recovery of
phosphorus from flushed dairy manure wastewater. Bioresource Technology
99(8): 3036-3043.
Hubbert, M. K. 1949. Energy from fossil fuels. Science 109(2823): 103-109.
Jasinski, S. M., 2008. Phosphate Rock, Mineral Commodity Summaries, U. S. Geological
Survey.
Jasinski, S. M., 2009. Phosphate Rock, Mineral Commodity Summaries, U. S. Geological
Survey.

10
Johnston, A. E. and Richards, I. R. 2003. Effectiveness of different precipitated
phosphates as phosphorus sources for plants. Soil Use and Management 19(1):
45-49.
Kim, D., J. Kim, H-D. Ryu, and S. Lee. 2009. Effect of mixing on spontaneous struvite
precipitation from semiconductor wastewater. Bioresource Technology 100(1):
74-78.
Le Corre, K. S., E. Valsami-Jones, P. Hobbs, and S. A. Parsons. 2005. Impact of calcium
on struvite crystal size, shape and purity. Journal of Crystal Growth 283(3-4):
514-552.
Li, X. Z. and Q. L. Zhao. 2003. Recovery of ammonium-nitrogen from landfill leachate
as a multi-nutrient fertilizer. Ecological Engineering 20(2): 171-181.
Nelson, N.O., R. L. Mikkelsen, and D. L. Hesterberg. 2003. Struvite precipitation in
anaerobic swine lagoon liquid: effect of pH and Mg:P ratio and determination of
rate constant. Bioresource Technology 89(3): 229-236.
Ohlinger, K. N., T. M. Young, and E. D. Schoeder. 2000. Postdigestion struvite
precipitation using a fluidized bed reactor. Journal of Environmental Engineering-
ASCE 126(4): 361-368.
Pan, S. H., K. V. Lo, P. H. Liao, and H. Schreier. 2006. Microwave pretreatment for
enhancement of phosphorus release from dairy manure. Journal of Environmental
Science and Health Part B – Pesticides Food Contaminants and Agricultural
Wastes 41(4): 451-458.
Ponce, R. G. and De Sa MEGL. 2007. Evaluation of struvite as a fertilizer: a comparison
with traditional P sources. Agrochimica 51(6): 301-308.

11
Qureshi, A., K. V. Lo and P. H. Liao. 2008. Microwave treatment and struvite recovery
potential of dairy manure. Journal of Environmental Science and Health Part B –
Pesticides Food Contaminants and Agricultural Wastes 43(4): 350-357.
Schuiling, R. D and A. Andrade. 1999. Recovery of struvite from calf manure.
Environmental Technology 20(7): 765-768.
Smil, V. 2000. Phosphorus in the environment: natural flows and human interferences.
Annual Review of Energy and the Environment 25: 53-88.
Steen, I. 1998. Phosphorus availability in the 21st century: management of a non-
renewable resource, Phosphors and potassium 217: 25-31.
Suzuki, K., Y. Tanaka, K. Kuroda, D. Hanajima, and Y. Fukumoto. 2005. Recovery of
phosphorus from swine wastewater through crystallization. Bioresource
Technology 96(14): 1544-1550.
Ueno, Y. and M. Fujii. 2001. Three years experience of operating and selling recovered
struvite from full-scale plant. Environmental Technology 22(11): 1373-1381.
U.S. Environmental Protection Agency. 2002. 2000 National Water Quality Inventory,
EPA 841-R-02-001, Office of Water, U.S. EPA: Washington DC.
(http://www.epa.gov/OWOW/305b/).
Wang, L. and G. H. Nancollas. 2008. Calcium orthophosphates: crystallization and
dissolution. Chemical Reviews 108(11): 4628-4669.
Warmadewanthi and J. C. Liu. 2009. Recovery of phosphate and ammonium as struvite
from semiconductor wastewater. Separation and Purification Technology 64(3):
368-373.

12
Williams, S. 1999. Struvite precipitation in the sludge treatment stream at slough
wastewater treatment plant and opportunities for phosphorus recovery.
Environmental Technology 20(7): 743-747.
Zeng, L. and X. Li. 2006. Nutrient removal from anaerobically digested cattle manure by
struvite precipitation. Journal of Environmental Engineering and Science 5(4):
285-294.

13
2. BACKGROUND
2.1 DAIRY MANURE NUTRIENTS AND FORMS OF PHOSPHORUS
Dairy manure has been used a fertilizer for crops for many years because it is a good
source of nutrients (nitrogen, phosphorus, and potassium).However, some nutrients
contained in animal diets are not completely utilized by animals. These nutrients include
calcium (Ca), magnesium (Mg), sodium (Na), sulfur (S), chloride (Cl), iron (Fe),
aluminum (Al), copper (Cu), zinc (Zn) and manganese (Mn) (National Research Council,
2001). On average a mature dairy cow produces 68 kg (or 68 L) manure daily containing
0.45 kg N, 0.078 kg P and 0.103 kg K (ASABE, 2005).
However, if quantity of land-applied manure contains P in excess of crop nutrient
requirements, P losses from agricultural land to natural water bodies through runoff and
erosion may occur (Weld et al., 2001; Maguire and Sims, 2002) causing deterioration of
water quality e.g. eutrophication. With the shift from N-based to P-based nutrient
management plans, land may be limiting to dairy farms for manure application. Therefore,
P removal and/or recovery treatment may be required on dairy farms to manage the
manure N to P ratio.
Total P (TP) concentration in dairy manure varies considerably from farm to farm,
depending on dietary P levels, feed source and many other digestive capabilities of the
cow (Barnett, 1994). P is present in dairy manure in several forms, varying widely in
their stability and bioavailability. Basically, TP is grouped into inorganic P (Pi) and
organic P (Po) (Ormaza-Gonzalez and Statham, 1996). Inorganic P includes dissolved
reactive P (DRP) and acid-soluble reactive P (ASRP), taking up to 63.2 % of the TP in
animal manure (Barnett, 1994). There are various forms of organic P, including phytate

14
(i.e. inositol hexaphosphates (IHP)), phospholipids and nucleic acid-type P (e.g. DNA
and RNA). Phytate is also called acid-soluble organic P because it could interact with
many metal ions to form insoluble or less soluble metal species (Dao, 2003; He et al.,
2009). The composition of organic P in manure has been characterized by solution-based
techniques such as sequential fractionation (Dou et al., 2002) and enzymatic hydrolysis
(He and Honeycutt, 2001) and by solid state 31
P nuclear magnetic resonance (NMR)
spectroscopy (He et al., 2009), with an emphasis on understanding the metal
complexation of organic P. The P forms in manure are illustrated in Figure 2.

15
Figure 2. P forms in dairy manure
Total P (TP)
Inorganic P (Pi) Organic P (Po)
DRP ASRP phospholipids IHP nucleic acid-type P

16
2.2 PHOSPHORUS RECOVERY
2.2.1 Calcium phosphate
There are several forms of calcium phosphate that can precipitate in solution,
depending on pH, reaction time, Ca2+
to PO4-P ratio and concentrations of other ions.
Generally, hydroxyapatite (HAP, Ca5(PO4)3OH) is the least soluble and the most
thermodynamically stable calcium phosphate formed under neutral to basic conditions. In
acidic solution, other forms like brushite (DCPD, CaHPO4·2H2O), mononite (DCPA,
CaHPO4), octacalcium phosphate (OCP, Ca8(HPO4)2(PO4)4·5H2O), and amorphous
calcium phosphate (ACP, CaxHy(PO4)z·nH2O, n=3~4.5) may also form (Musvoto et al.,
2000). Furthermore, it is has been observed that the crystallization of HAP involves the
formation of metastable precursor phases such as ACP and OCP (Wang and Nancollas,
2008).
Theoretically, calcium phosphate should be useful to the phosphate industry for re-
use and recycling, because it is similar in chemical composition as mined phosphate rock
used in industry. However, it has not been widely adopted to realize P recovery from
wastewater as calcium phosphate in full scale industries. By adding lime, many
wastewater treatment plants produced calcium phosphates in the form of slime, contained
in huge amounts of sludge with high water content (65 % to 85 %) (Giesen, 1999), which
cannot be accepted by industries. Their main objective was P removal, rather than P
recovery. Two full-scale P recovery trials (Angel, 1999; Giesen, 1999) used the DHV
Crystalactor to facilitate P recovery as calcium phosphate pellets with up to 11 % P
content, containing only 5 % to 10 % water. One of the key challenges to operate this
technology successfully was to control the bicarbonate/carbonate (HCO3-/CO3
2-)

17
concentration of the influent at low levels, otherwise they would precipitate calcium
carbonate (CaCO3). This was overcome by reducing the pH of the influent to 3 to release
CO2 and then raising it to 9 to induce calcium phosphate precipitation (Giesen, 1999);
this increases the cost of P recovery processes. Furthermore, seed materials addition like
calcite (Song et al., 2006) and silica sand (Giesen, 1999) is required for P recovery as
calcium phosphates, which would add to the process complexity and costs.
Besides bicarbonate/carbonate (HCO3-/CO3
2-) alkalinity, calcium phosphate
precipitation is also interfered by other compounds. For example, organic ligands like
citrate inhibit the precipitation by binding to active growth sites of the nuclei (Van Der
Houwen and Valsami-Jones, 2001). Also, high Mg2+
concentration in solution with the
presence of sufficient ammonium ions (NH4+) has the potential to alter the precipitation
pathway from calcium phosphate to struvite (MgNH4PO4·6H2O) (Cao and Harris, 2008).
There are questions about the use of calcium phosphate as a fertilizer because of its low
solubility (Wang and Nancollas, 2008), indicating inadequate phosphate release for crops
nutrition requirements. A summary of the advantages and disadvantages of P recovery as
calcium phosphate are listed in Table 1.

18
Table 1. P recovery as calcium phosphate: advantages and disadvantages
Advantages Disadvantages
similar to mined phosphate rock used
in industry
can be readily accepted by industries if
recovered in a suitable physical form
(like pellets)
usually in the form of slime with high
water content, which is useless to
industries
hard to recover: need to add external
seed materials to facilitate
crystallization process
hard to recover: need to reduce CO3 as
pretreatment before inducing calcium
phosphate precipitation
hard to recover: be easily interfered by
other ions

19
2.2.2 Magnesium ammonium phosphate (struvite)
One of the most promising wastewater phosphate recovery techniques is its co-
precipitation with Mg2+
and NH4+ as magnesium ammonium phosphate hexahydrate
(MgNH4PO4·6H2O), commonly known as struvite (de-Bashan and Bashan, 2004). This
technique is beneficial for several reasons. First, struvite has the potential to be used as a
slow-release fertilizer (Bridger et al., 1962; Parsons et al., 1999). Li and Zhao (2003)
showed that it provides easy-taking sources of nutrients (N, P and Mg) for plants. Also,
nutrient taking responses of some plants to struvite application were found to be similar
or even superior to those obtained with conventional P fertilizers (phosphate rock,
monoammonium phosphate and monocalcium phosphates) (Johnson and Richards, 2003;
Ponce and De Sa MEGL, 2007). Especially, its low solubility in water (about 0.02 g/100
mL H2O, at 25 °C and 1 atm) ensures nutrient release over a longer period of time and
decreases the danger of burning roots of crops struvite is applied (Gaterell et al., 2000).
Second, struvite crystallization allows the recovery of both phosphorus and nitrogen
simultaneously. Third, struvite crystals are regarded as being more easily recovered than
calcium phosphates. It was recently found that struvite is as effective as conventional
phosphate rock when being used as fertilizer in agriculture (Ponce and De Sa MEGL,
2007), in agreement with earlier research conclusion (Gaterell et al., 2000). Full-scale
struvite recovery industry was reported in Japan and fertilizer companies bought struvite
recovered from wastewater treatment plants (WWTPs), using it to adjust the
nitrogen/phosphorus/potassium ratio of the fertilizer mixture; the final product has been
widely used for paddy rice and other agricultural plants (Ueno and Fujii, 2001).

20
However, up to now the commercial profit of struvite used as fertilizer is still not
clear (Massey et al., 2010). Compared with calcium phosphate, many problems are
encountered by current phosphate industry in producing struvite (Schipper et al., 2001),
including Mg interference during P purification in the “wet” process and NH3 emissions
during heating in the “dry” P manufacturing process. Shu et al. (2006) pointed out that
the reasons why struvite is not widely used as fertilizer lie in two primary reasons: its
limited availability to farmers and lack of information on its land-applicability and
economic benefits.
2.3 STRUVITE PRECIPITATION CHEMISTRY
Struvite is a white orthorhombic crystalline consisting of magnesium, ammonium
and orthophosphate in equal molar ratio. It precipitates by the chemical reaction of Mg2+
,
NH4+ and HnPO4
3-n (with n = 0, 1 or 2), following the general equation (1).
(1)
Generally, the formation of a mineral precipitates is controlled by its solubility
(Aage et al., 1997; Bhuiyan et al., 2007; Webb and Ho, 1992). The solubility product of
struvite can be expressed by equation (2) and (3).
(2)
(3)
As shown in equation (3), the solution will be supersaturated and struvite
precipitation will occur when the product of Mg2+
, NH4+, and PO4
3- concentrations
exceeds the value of Ksp. Yet the solubility product can also be calculated in terms of
conditional solubility product (Kso) (Doyle and Parsons, 2002; Le Corre et al., 2009). Its
value is only accurate under a given specific conditions because its calculation takes into

21
account the ionic strength and activity of the ionic species, which are highly pH
dependent. The conditional solubility product (Kso) is expressed in equation (4), where γ
is the activity coefficient (Ohlinger et al., 1998).
(4)
Solution consisting of magnesium, ammonium and phosphate forms ions and
complexes including Mg2+
, MgOH+, MgH2PO4
+, MgHPO4 (aq), MgPO4
-, H3PO4, H2PO4
-,
HPO42-
, PO43-
, NH3 and NH4+ (Ohlinger et al., 1998). The total constituent concentration
for Mg, NH4 and PO4, denoting
, are the sum of measured ionic
concentration of their complexes and free ions, illustrated in equation (5)~(7) as follows.
(5)
(6)
(7)
One of the key thermodynamic parameters describing struvite saturation degree is
the supersaturation ratio (SSR), relating to the ion activity product (IAP) and the
conditional solubility product (Kso) , as shown in equation (8) (Snoeyink and Jenkins,
1980; Ohlinger, 1999).
(8)

22
The saturation degree of struvite in solution are influenced by many factors, such
as pH, its component ions concentrations (Mg2+
, NH4+, and PO4
3-) and presence of other
ionic species (e.g. Ca2+
, CO32-
, K+). Therefore it is difficult to predict or control struvite
precipitation in media like animal manure and municipal wastewater, due to the
complexity of the solution.
2.4 FACTORS AFFECTING STRUVITE PRECIPITATION PROCESS
2.4.1 pH
The pH is one of the most important factors affecting the struvite precipitation
process, because the struvite solubility and solution supersaturation are directly
influenced by it. Firstly, according to equation (1), the pH of solution will be decreased
due to the released protons during the precipitation of struvite (Kofina and Koutsoukos,
2005). Thus the rate of pH drop can be used as an indicator of struvite formation (Le
Corre et al., 2005). Secondly, the concentration of ammonium ions (NH4+) is sensitive to
solution pH value, because ammonium will transfer into ammonia gas (NH3) when pH is
raised above 9 (Booker et al., 1999), as shown in equation (9) (Snoeyink and Jenkins,
1980). The decrease of ammonium ions in solution will increase the struvite solubility,
thus decrease the solution supersaturation degree with respect to struvite precipitation.
(9)
Many researchers investigated the effects of pH on struvite precipitation and
reported optimum value between7.5 and 10.7 (Bouropoulos and Koutsoukos, 2000;
Ohlinger et al., 1998; Stratful et al., 2001). Adnan et al (2003) found that it was possible
to achieve over 90% P removal as struvite at pH 7.3, indicating that very alkaline pH was
not necessary to trigger precipitation of struvite.

23
However, many previous studies pointed out that pH > 8 is needed to precipitate
struvite in animal manure wastewater. Burns et al (2001, 2003) enhanced struvite
precipitation in swine slurries supernatants by increasing pH value to 8.6 and over 90 % P
removal rate was observed in both the bench- and field-scale experiments. This supports
the results found by Wrigley et al (1992) when treating the supernatants from
anaerobically digested swine waste. Nelson et al (2003) quantified the crossed effects of
pH and Mg/P ratio and pointed out that pH for the minimum struvite solubility (ranging
from 8.90 to 9.25) was not significantly affected by the Mg to ortho-P ratio.
2.4.2 Mg2+
/NH4-N/PO4-P ratio
Magnesium (Mg) addition can be used to enhance struvite precipitation in waste
streams where Mg2+
is a limiting factor (Stratful et al., 2001). Basically, Mg2+
to PO4-P
molar ratio above 1:1 is recommended in practice. Beal et al. (1999) induced struvite
precipitation from swine waste by increasing the Mg2+
/PO4-P molar ratio from 0.25 to 1
using MgO to supply Mg and increase the pH. Maekawa et al. (1995) obtained maximum
PO4-P removal using Mg/PO4-P ratio of 1.5. Likewise, Nelson et al. (2003) investigated
the interactive effects of pH and Mg/PO4 ratio and found that increasing Mg to P ratio
resulted in P removal at any given pH, indicating the importance of Mg concentration
adjustment from practical standpoint because PO4-P reduction could be achieved with a
smaller increase in pH. For example, adequate P removal can be obtained at a pH (8.2)
with a correspondingly high Mg/PO4-P ratio (1.6), rather than at pH 9.0 with a Mg/PO4
ratio of 1:1. Lower level of alkaline pH not only means less cost of NaOH addition but
also avoids potentially negative effects such as NH3 volatilization resulted from high pH
(>9.0). One hypothesis about the benefits of higher Mg/PO4 ratio was raised by Schulze-

24
Rettmer (1991), saying that high Mg concentrations promote struvite precipitation by
overcoming the effects of complex agents binding to magnesium. Tong and Chen (2007)
supported this hypothesis, suggesting that organic matter (soluble COD) would co-
precipitate with Mg2+
, resulting in decreased PO4-P removal efficiency. However,
Bowers and Westerman (2005) found that excessively high Mg concentrations relative to
P suppressed struvite precipitation. They reported that an Mg/TP ratio greater than 1 may
decrease P removal rate. It was possible that high concentrations of Mg inhibited struvite
precipitation, likely from the formation of other mineral solids (e.g. MgCO3 and
MgHPO4).
Besides Mg2+
/PO4-P ratio, ammonium (NH4+) concentration is also a very
important factor for struvite precipitation. Stratful et al. (2001) investigated the effects of
excess ammonium concentration on struvite precipitation and found that higher residual
NH4+ concentration could limit the further precipitation of excess Mg
2+ and phosphate
and thus increase the yield of pure struvite in the final precipitates. Another possible
explanation for beneficial effects of excess ammonium could be that ammonium could
provide buffering solution. As shown in equation (1), in an unbuffered system, the pH
falls as struvite forms. Experiments carried on the influence of ammonium concentration
on calcium phosphate precipitation supported this hypothesis, because no significant drop
in pH was observed when amorphous calcium phosphate (ACP) formed as a result of the
buffering effects of ammonium (Lopez-Valero et al., 1992). On the other hand, the
presence of ammonium in solution with high calcium ions (Ca2+
) concentration has the
potential to alter the pathway from calcium phosphate to struvite precipitation (Cao and
Harris, 2008).

25
2.4.3 Presence of other ions
Theoretically, any impurities in solution can affect the formation of crystalline
compounds through changing the ionic activity and/or suppressing the increase of crystal
size due to blocking of growth sites (Jones, 2002). It is known that numerous ions have
negative effects on struvite precipitation process by either retarding induction time
preceding the first occurrence of crystals or competing PO43-
with Mg2+
to form
phosphate minerals (Kofina and Koustsoukos, 2004).
Ca2+
received much attention in terms of interfering struvite precipitation. They
compete with Mg2+
to interact with PO43-
to form ACP, tricalcium phosphate (TCP),
and/or hydroxyapatite (HAP), according to equation (10)~(12) below (Wang and
Nancollas, 2008).
(10)
(11)
(12)
Le Corre et al. (2005) conducted experiments with synthetic solution and reported
the significant negative impacts of Ca2+
on struvite crystallization with respect to size,
shape and purity. Hardly any struvite crystals form when Ca2+
to Mg2+
molar ratio if
greater than 1. Similar observations were found by Wang et al. (2005) that Ca is the
major interfering ion in struvite formation from animal manure/wastewater. They
employed NH4/PO4 ratio in the precipitates as the indicator to estimate the struvite purity
and observed a clear trend where struvite purity decreased with Ca2+
concentration
increased. Harris et al. (2008) investigated the forms of P recovery from flushed dairy

26
manure and found that poorly crystalline calcium phosphate (ACP and HAP) formed fast
enough to be recovered as dominant P minerals in precipitates, which indicated that the
greater solubility of struvite (pKsp = 13.26, Ohlinger et al., 1998) compared to HAP (pKsp
= 116.8, Wang and Nancollas, 2008) thermodynamically favors the latter to precipitate,
especially in the media with high Ca2+
concentration such as liquid dairy manure. Other
studies (Bowers and Westerman, 2005; Massey, 2008) also reported the inhibitory effects
of Ca2+
on struvite precipitation in liquid dairy manure. The P removal efficiencies by
struvite precipitation from swine or dairy manure are summarized in Table 2. In manure
wastewater where Ca/PO4-P molar ratio less than 1 coupled with high NH4-N/PO4-P ratio,
struvite could form as the dominant solid phase in the precipitates. As reported by Nelson
et al. (2003), in swine lagoon liquid with Ca/PO4-P molar ratio of 2.13, struvite crystals
were still observed among the precipitates. These findings partially confirmed the
benefits brought by excess ammonium on struvite formation (Stratful et al., 2001).
However, in flushed dairy manure with Ca/PO4-P molar ratio > 5, no struvite was found
there, indicating that the suppression from high Ca2+
concentration overweighed the
effects of excess ammonium (Harris et al., 2008). Pastor et al. (2008) observed the
negative effects of Ca2+
treating EBPR anaerobic digestion sludge liquors with Ca/Mg
molar ratios of 0.4 and 1.6 respectively. Only 35.4 % of the removed P precipitated as
struvite in high Ca/Mg molar ratio, while 72.6 % in low Ca/Mg molar ratio. However,
high P removal efficiencies (91.1 % and 83.1 %) were achieved in both liquors,
indicating that P removal was mainly attributed to calcium phosphate precipitation in the
former liquor. They also pointed out the importance of management of the sludge
treatment line to recover P as struvite precipitates.

27
Besides Ca2+
, other ions such as carbonate/bicarbonate (CO32-
/HCO3-), sodium
(Na+) and sulfate (SO4
2-) also have impacts on either induction time or struvite crystal
morphology and sizes (Kabdaşli et al., 2006). In a solution system containing Mg2+
, NH4+,
Ca2+
, CO32-
and PO43-
, the precipitation conditions are very complex because any form of
ions would have inhibitory effects on other precipitates. For example, either Mg2+
or
CO32-
ions suppress the formation of calcium phosphates (Ferguson and McCarty, 1971),
separately. Coexistence of Mg2+
and CO32-
showed a synergistic inhibitory effect on this
suppression and the likely reason for this mitigated inhibition involves the formation of
MgCO3 (Cao and Harris, 2008).
2.4.4 Suspended solids and organic matter content
Interference may be caused by suspended solids (TSS) and/or organic compounds
and dairy manure typically contains high concentration of these matters. In the efforts to
recover struvite from calf manure slurries in pilot-scale system, Schuiling and Andrade
(1999) reported that the TSS concentration greater than 1000 mg/L (or 0.1 %) inhibited
precipitation of struvite. Schulze-Rettmer (1991) also reported that organic compounds
could potentially co-precipitate with Mg2+
, resulting in the increase in the equilibrium
phosphate concentration. Kofina et al. (2007) investigated the effects of citrate and
phosphocitrate on both the kinetics and the morphology of the spontaneous precipitation
of struvite in synthetic wastewater supersaturated solutions and demonstrated that these
ions can inhibit struvite precipitation by retarding the induction time and increasing the
supersaturation level required for precipitation.

28
Table 2. The P removal by struvite precipitation from swine or dairy manure in published studies
Material Before treatment
Treatment Precipitated ratio (%)
Precipitates Reference Mg/PO4-P Ca/PO4-P Ca/Mg NH4-N/PO4-P PO4-P Mg Ca
swine
wastewater 0.90 0.80 0.89 6.98
increase pH to 8.1~8.7 by
aeration 81.2 71.7 55.7 MAP + HAP
Suzuki et al.,
2002
swine
wastewater 0.91 0.95 1.04 -
increase pH to 7.3~8.1 by
aeration 50.0 37.5 20.5 MAP (95 %)
Suzuki et al.,
2005
swine
wastewater 0.83 0.86 1.04 16.36
increase pH to 8.0 by
aeration 51.4 - - MAP (95 %)
Suzuki et al.,
2007 MgCl2 addition + increase
pH to 8.0 78.6 - - MAP (97 %)
swine waste
slurry - - - -
MgCl2 addition to Mg/TP 1.6
+ increase pH to 9.0 91.0 - - MAP (51 %)
Burns et al.,
2001
swine waste
slurry
0.26 - - 18 MgCl2 addition to Mg/TP
1.6~3.5 + increase pH to 8.5
98.0 - - MAP +
brushite
Burns et al.,
2003 0.58 - - 12 90.4 - -
swine
wastewater 0.3~0.6 - - 91.3~124.5
MgCl2 addition to Mg/PO4-P
2.0 + increase pH to 9.0~9.5 99.2 - - MAP Kim et al., 2004
swine
wastewater 0.73 0.74 0.61 19.88
MgCl2 addition to Mg/PO4-P
1.1~1.4 + increase pH to 8.5 98 - - MAP
Laridi et al.,
2005
swine lagoon
liquid 1.13 2.13 1.88 21.31
MgCl2 addition to Mg/PO4-P
1.0~1.6 + increase pH to
8.3~9
85 - - MAP (91 %) Nelson et al.,
2003
swine manure 0.43 0.39 0.91 14.50
increase pH to 8.5 by NaOH
addition 55 36 56
MAP +
monetite +
brushite Celen et al.,
2007 MgCl2 addition to Mg/PO4-P
2.0 + pH increase to 8.5 98 40 0 MAP
swine manure 0.74 0.48 0.65 13.49
MgCl2 addition to Mg/PO4-P
1.0 + pH increase to 8.5 94 88 0 MAP
Celen et al.,
2007 MgCl2 addition to Mg/PO4-P
1.5 + pH increase to 8.5 97 50 0 MAP
anaerobically
digested swine
manure
0.78 - - 7.83 MgO addition to Mg/PO4-P
2.0 + pH increase to 9 98 - - N/A
Moody et al.,
2009
liquid swine
manure 1.90 3.22 2.49 -
Mg smelting by-products
addition to Mg/PO4-P 3.1 or
higher + pH increase to 8.6
or higher
> 96 - - no struvite Parent et al.,
2007

29
Material Before treatment
Treatment Precipitated ratio (%)
Precipitates Reference Mg/PO4-P Ca/PO4-P Ca/Mg NH4-N/PO4-P PO4-P Mg Ca
flushed dairy
manure 2.99 5.59 1.29 9.19 increase pH to 8.75 80.4 - -
amorphous
calcium
phosphate
(ACP)
Harris et al.,
2008
untreated dairy
manure 3.04 4.44 1.46 10.27
increase pH to 8.5 99.4 - - ACP
present study
add oxalate to decrease
Ca/Mg to 0.02 + pH increase
to 7.0
94.4 - - MAP
add EDTA to decrease
Ca/Mg to 0.18 + pH increase
to 7.0
95.2 - MAP
MgCl2 addition to Ca/Mg
0.25 + pH increase to 7.0 99.6 - - N/A

30
2.5 PRETREATMENT TO ENHANCE STRUVITE PRECIPITATION IN DAIRY
MANURE
Phosphorus recovery via struvite precipitation is limited to available soluble
orthophosphate (i.e. dissolved reactive phosphorus, DRP). However, nearly 50% of the
TP in dairy manure is in organic form (Wilkie et al., 2004) and most of the inorganic
phosphate in dairy manure exists in the insoluble forms of particulate Ca- and Mg-PO4
minerals (Van Rensburg et al., 2003, Gungor and Karthekiyan 2005, 2008). Massey
(2008) attempted to recover struvite from liquid dairy manure and obtained low recovery
efficiency and suspected that struvite might have been precipitated and present in fine
suspended form mixed with other metal-phosphate solids. However, many successful
cases about high P removal in untreated animal manure, but few of them were removed
by struvite precipitation (Harris et al., 2008). Bowers et al (2007) achieved TP removal
rates of 80 % in swine lagoon wastewater but only as high as 49 % in dairy wastewater.
Massey (2008) failed to capture struvite from dairy lagoon liquid with only 14% P
removal efficiency using a fluidized bed crytallizer similar to what Bowers et al. (2007)
used. Therefore, the main obstacles to precipitate struvite in dairy manure can be
summarized as (1) low orthophosphate to TP ratio and (2) high Ca concentrations. Five
pretreatments that can be used to increase orthophosphate to TP ratio and abate the
effects of Ca on struvite precipitation were described below.
2.5.1 Anaerobic digestion
Anaerobic digestion (AD) is a commonly used treatment practice in animal
manure management due to the potential benefits like biogas production, COD reduction,
volatile solids (VS) destruction, odor mitigation and pathogen reduction. Several recent

31
researches investigated the effects of AD of animal manure prior to the struvite
precipitation in quality and quantity. Moody et al (2009) observed that AD
simultaneously increased the concentration of soluble ortho-P (PO4-P) by 26 % and the
amount of available magnesium (Mg2+
) by 254 %, and assumed that this would enhance
P removal through struvite precipitation in swine waste slurries. A similar conclusion was
made by Marti et al (2008) that Mg would be released from organic compounds by their
degradation during the AD process in WWTP sludge management line optimization (e.g.
configuration modification). These findings offered a strong support for earlier findings
by Wrigley et al (1992) and Buchanan (1993).
The influence of AD on forced struvite precipitation might be explained by the
following conditions. Volatile fatty acids (VFAs) have been reported to form complexes
with Ca and Mg, thus it is expected that high VFA concentrations would inhibit P
precipitation (Van Rensburg et al., 2003), but under AD, VFAs are usually consumed
thus reducing their concentrations. Gungor and Karthikeyan (2005) evaluated different
ratios of inoculum (anaerobically digested dairy manure) to substrate (undigested dairy
manure) to test the hypothesis that VS destruction could release Ca and Mg from organo-
metal complexes in manure. The molar ratio of Ca2+
/DRP after AD treatment was
increased in low inoculum to substrate ratios (from 2.66 to 3.15), while the converse was
found for high ratios of inoculum to substrate.
2.5.2 Enhanced biological phosphorus removal (EBPR)
More attention is being paid to EBPR municipal wastewater treatment plants due
to the potential of increasing soluble P by the release of phosphates taken up by
phosphorus accumulating organisms (PAOs, Mino et al., 1998). EBPR occurs through an

32
anaerobic-aerobic sequence configuration (Mino et al., 1998). In the anaerobic phase,
PAOs take up the carbon sources such as volatile fatty acids, degrading the poly-P with
the consequent release of DRP. In the aerobic phase, PAOs take up the DRP to recover
the poly-P inside and re-build the cell. The high phosphate-containing sludge is a good
media for struvite crystallization. Pastor et al. (2008) performed struvite recovery from
EBPR sludge in WWTP and observed that P recovery as struvite requires not only the
optimization of the crystallization process, but also the efficient management strategy of
the sludge treatment configuration line.
2.5.3 Microwave digestion
As a new digestion technology in wastewater treatment, microwave heating
exhibits various advantages like precise control of temperature and shorter period of
digestion time, compared with conventional conduction digestion. After the successful
application to municipal sewage sludges (Liao et al., 2005), Qureshi et al (2008) extended
this technique to dairy manure. Microwave digestion of liquid dairy manure was
investigated for the release of PO4-P, NH4-N, Mg2+
, Ca2+
and K+, with and without the
addition of oxidizing agent. After 5 min microwave pretreatment, ortho-P to TP ratio was
increased from 21 % to 80 %. In addition, more than 36 % of total COD was reduced by
microwave digestion assisted with oxidizing agent and the distribution of VFAs shifted to
acetic acid dominance by increasing the operating temperature. In spite of a non-
consistent trendency, free magnesium (Mg2+
), calcium (Ca2+
) and potassium (K+) ions
release was also observed by different amounts. The results of second part of the
experiment indicated the potential of microwave digestion to enhance the struvite
precipitation process. Jin et al (2009) investigated the dairy manure solubilization using

33
microwave heating technology with different pretreatment conditions and reported
struvite recovery potentials.
2.5.4 Ethylenediaminetetraacetic acid (EDTA) or oxalate addition
EDTA is a chelating agent that widely used in industry. Doyle et al., 2003 used it
to control unexpected struvite in wastewater treatment to mitigate the pipe blocking
problems. Experimental results showed that an EDTA : struvite molar ratio of 2 : 1
dissolved over 90 % of struvite precipitation back into the solution even at above 7.5 pH
values, indicating two facts of EDTA: (1) it can dissolve the metal-phosphate
precipitation, releasing the free ortho-phosphate ions into the solution; (2) it is more
favorable to form metal-EDTA chelate than metal-phosphate compounds. In this respect,
it is feasible to mitigate the negative impacts of calcium on struvite precipitation process
by adding any agent having stronger binding-strength to capture calcium ions (Ca2+
) than
soluble ortho-phosphate, such as EDTA and oxalic acid. By removing the Ca-EDTA or
Ca-oxalate compounds before struvite precipitation, is more favorable for efficeint
struvite recovery with optimal operation control. For full-scale or in-situ application,
oxalic acid might be a feasible substitute for EDTA because it is commercially affordable.
This concept has been applied to a pilot-scale crystallizer treating effluents from a mixed
waste (dairy manure and food processing waste) digester with good struvite harvesting
performance (Bowers et al., 2007). On the other hand, simultaneous formation of Mg-
EDTA or Mg-oxalate should be noted because the decrease of available Mg would
inhibite struvite precipitation. Future efforts should be made to improve this technology.

34
2.5.5 Bio-Catalytic Calcification (BCC)
Although not considered in this study, biological mineral precipitation represents
an interesting breakthrough for wastewater treatmentBio-catalytic calcification (BCC)
reactors have been developed as an alternative to chemical precipitation methods for the
removal of soluble calcium from industrial wastewater (Hammes et al., 2003a, 2003b),
based on ureolytic microbial calcium carbonate (CaCO3) precipitation, facilitating urea
hydrolysis, as shown in the equations 13 and 14. In their research, Hammes et al., (2003c)
characterized the microbial ecology inside the BCC reactor and observed no significant
decrease in soluble magnesium (Mg2+
) during the Ca removal process. This observation
suggested that struvite crystalline is more favorable to form in BCC effluents. The
concept of this novel Ca-removal approach was recently applied to industrial wastewater
P removal treatment by Carballa et al (2009), who compared ureolytic induced struvite
crystallization with air-stripping strategy and suggested that this novel approach is a
feasible alternative to conventional methods technically and economically. They also
noted that the N removal should be evaluated in combination with the advantages of
sustainable P removal due to the high ammonium concentration contained in BCC
effluents.
(13)
(14)
Dairy manure have relatively high concentrations of urea and calcium. Therefore,
there is a great potential for future research on P recovery configuration line
improvement by placing a BCC reactor preceding the struvite crystallizer.

35
REFERENCES
Aage, H. K., B. L. Andersen, A. Blom, and I. Jensen. 1997. The solubility of struvite.
Journal of Radioanalytical and Nuclear Chemistry 223(1-2): 213-215.
Adnan, A., D. S. Mavinic, and F. A. Koch. 2003. Pilot-scale study of phosphorus
recovery through struvite crystallization - II. Applying in-reactor supersaturation
ratio as a process control parameter. Journal of Environmental Engineering and
Science 2(6): 473-483.
Angel, R. 1999. Removal of phosphate from sewage as amorphous calcium phosphate.
Environmental Technology 20(7): 709-720.
ASABE. 2005. Manure characteristics. American Society of Agricultural and Biological
Engineers (ASABE) Standard D384.2. St. Joseph, Mich.
Barnett, G. M. 1994. Phosphorus forms in animal manure. Bioresource Technology 49(2):
139-147.
Beal, L. J., R. T. Burns and K. J. Stalder. 1999. Effect of anaerobic digestion on struvite
production for nutrient removal from swine waste prior to land application.
Presented at the 1999 ASAE International Meeting in Toronto, Canada. Paper No.
994042. ASAE St. Joseph, MI.
Bhuiyan, M. I. H., D. S. Mavinic, and R. D. Beckie. 2007. A solubility and
thermodynamic of struvite. Environmental Technology 28(9): 1015-1026.
Booker, N. A., A. J. Priestley and I. H. Fraser. 1999. Struvite formation in wastewater
treatment plants: Opportunities for nutrient recovery. Environmental Technology
20(7): 777-782.

36
Bouropoulos, N. C. and P. G. Koutsoukos. 2000. Spontaneous precipitation of struvite
from aqueous solutions. Journal of Crystal Growth 213(3-4): 381-388.
Bowers, K. E. and P. W. Westerman. 2005. Performance of cone-shaped fluidized bed
struvite crystallizers in removing phosphorus from wastewater. Transactions of
the ASAE 48(3): 1227-1234.
Bowers, K. E., T. Zhang and J. H. Harrison. 2007. Phosphorus removal by struvite
crystallization in various livestock wastewaters. Presented in Proc. International
Symposium on Air Quality and Waste Management for Agriculture. ASABE
Paper No. 701P0907cd. St. Joseph, MI.
Bridger, G. L., M. L. Salutsky, and R. W. Starostka. 1962. Metal ammonium phosphates
as fertilizers. Journal of Agricultural and Food Chemistry 10(3): 181-188.
Buchanan, J. 1993. Struvite control in flush water recycle components of livestock waste
management systems. M.S. thesis. University of Tennessee, Knoxville, TN.
Burns, R. T., L. B. Moody, F. R. Walker and D. R. Raman. 2001. Laboratory and in-situ
reductions of soluble phosphorus in swine waste slurries. Environmental
Technology 22(11): 1273-1278.
Burns, R. T., L. B. Moody, I. Celen and J. R. Buchanan. 2003. Optimization of
phosphorus precipitation from swine manure slurries to enhance recovery. Water
Science and Technology 48(1): 139-146.
Cao, X. and W. Harris. 2008. Carbonate and magnesium interactive effect on calcium
phosphate precipitation. Environmental Science & Technology 42(2): 436-442.
Carballa, M., W. Moerman, W. De Windt, H. Grootaerd and W. Verstraete. Strategies to
optimize phosphate removal from industrial anaerobic effluents by magnesium

37
ammonium phosphate (MAP) production. Journal of Chemical Technology and
Biotechnology 84(1): 63-68.
Celen, I., J. R. Buchanan, R. T. Burns, R. B. Robinson, and D. R. Raman. 2007. Using a
chemical equilibrium model to predict amendments required to precipitate
phosphorus as struvite in liquid swine manure. Water Research 41(8): 1689-1696.
Dao, T. H. 2003. Polyvalent cation effects on myo-inositol hexakisdihydrogenphosphate
enzymatic dephosphorylation in dairy wastewater. Journal of Environmental
Quality 32(2): 694-701.
de-Bashan, L. E., and Y. Bashan. 2004. Recent advances in removing phosphorus from
wastewater and its future use as fertilizer (1997-2003). Water Research 38(19):
4222-4246.
Dou, Z., K. F. Knowlton, R. A. Kohn, Z. Wu, L. D. Satter, G. Zhang, J. D. Toth, and J. D.
Ferguson. 2002. Phosphorus characteristics of dairy feces affected by diets.
Journal of Environmental Quality 31(6): 2058-2065.
Doyle, J. D. and S. A. Parsons. 2002. Struvite formation, control and recovery. Water
Research 36(16): 3925-3940.
Ferguson, J. F. and P. L. McCarty. 1971. Effects of carbonate and magnesium on calcium
phosphate precipitation. Environmental Science & Technology 5(6): 534-540.
Gaterell, M. R., R. Gay, R. Wilson, R. J. Gochin, and J. N. Lester. 2000. An economic
and environmental evaluation of the opportunities for substituting phosphorus
recovered from wastewater treatment works in existing UK fertilizer markets.
Environmental Technology 21(9): 1067-1084.

38
Giesen, A. 1999. Crystallisation process enables environmental friendly phosphate
removal at low costs. Environmental Technology 20(7): 769-775.
Greaves, J., P. Hobbs, D. Chadwick, and P. Haygarth. 1999. Prospects for the recovery of
phosphorus from animal manures: a review. Environmental Technology 20(7):
697-708.
Gungor, K. and K. G. Kathikeyan. 2005. Influence of anaerobic digestion on dairy
manure phosphorus extractability. Transactions of the ASAE 48(4): 1497-1507.
Gungor, K. and K. G. Kathikeyan. 2008. Phosphorus forms and extractability in dairy
manure: A case study for Wisconsin on-farm anaerobic digesters. Bioresource
Technology 99(2): 425-436.
Hammers, F., A. Seka, K. van Hege, T. van de Wiele, J. Vanderdeelen, S. D Siciliano and
W. Verstraete. 2003b. Calcium removal from industrial wastewater by bio-
catalytic CaCO3 precipitation. Journal of Chemical Technology and
Biotechnology 78(6): 670-677.
Hammers, F., A. Seka, S. De Knijf, and W. Verstraete. 2003a. A novel approach to
calcium removal from calcium-rich industrial wastewater. Water Research 37(3):
699-704.
Hammers, F., Boon, N.; Clement, G.; De Villiers, J.; Siciliano, S. D.; Verstraete, W.,
2003c. Molecular, biochemical and ecological characterization of a bio-catalytic
calcification reactor. Applied Microbiology and Biotechnology 62(2-3): 191-201.
Harris, W. G., A. C. Wilkie, X. Cao and R. Sirengo. 2008. Bench-scale recovery of
phosphorus from flushed dairy manure wastewater. Bioresource Technology
99(8): 3036-3043.

39
He, Z. and C. W. Honeycutt. 2001. Enzymatic characterization of organic phosphorus in
animal manure. Journal of Environmental Quality 30(5): 1685-1692.
He, Z., C. W. Honeycutt, T. S. Griffn, B. J. Cade-Menun, P. J. Pellechia, and Z. Dou.
2009. Phosphorus forms in conventional and organic dairy manure identified by
solution and solid state P-31 NMR spectroscopy. Journal of Environmental
Quality 38(5): 1909-1918.
Jin, Y., Z. Hu, and Z. Wen. 2009. Enhancing anaerobic digestibility and phosphorus
recovery of dairy manure through microwave-based thermochemical pretreatment.
Water Research 43(14): 3493-3502.
Johnson, A. E. and I. R. Richards. 2003. Effectiveness of different precipitated
phosphates as phosphorus sources for plants. Soil Use and Management 19(1):
45-49.
Jones, A. G. 2002. Crystallization process system. Oxford, Great Britain:
Butterworth/Heinemann.
Kabdasli, I., S. A. Parsons, and O. Tunay. 2006. Effect of major ions on induction time of
struvite precipitation. Croatica Chemica Acta 79(2): 243-251.
Kim, B. U., W. H. Lee, H. J. Lee and J. M. Rim. 2004. Ammonium nitrogen removal
from slurry type swine wastewater by pretreatment using struvite crystallization
for nitrogen control of anaerobic digestion. Water Science and Technology 49(5-
6): 215-222.
Kofina, A. N. and P. G. Koutsoukos. 2004. Nucleation and growth of struvite from
synthetic wastewater. International Conference on Struvite: Its Role in
Phosphorus Recovery and Reuse, Cranfield, UK.

40
Kofina, A. N. and P. G. Koutsoukos. 2005. Spontaneous precipitation of struvite from
synthetic wastewater solutions. Crystal Growth and Design 5(2): 489-496.
Kofina, A. N., K. D. Demadis, and P. G. Koutsoukos. 2007. The effect of citrate and
phosphocitrate on struvite spontaneous precipitation. Crystal Growth and Design
7(12): 2705-2712.
Laridi, R. J. C. Auclair and H. Benmoussa. 2005. Laboratory and pilot-scale phosphate
and ammonium removal by controlled struvite precipitation following coagulation
and flocculation of swine wastewater. Environmental Technology 26(5): 525-536.
Le Corre, K. S., E. Valsami-Jones, P. Hobbs, and S. A. Parsons. 2009. Phosphorus
recovery from wastewater by struvite crystallization: A review. Critical Reviews
in Environmental Science and Technology 39(6): 433-477.
Le Corre, K. S., E. Valsami-Jones, P. Hobbs, and S. A. Parsons. 2005. Impact of calcium
on struvite crystal size, shape and purity. Journal of Crystal Growth 283(3-4):
514-552.
Li, X. Z. and Q. L. Zhao. 2003. Recovery of ammonium-nitrogen from landfill leachate
as a multi-nutrient fertilizer. Ecological Engineering 20(2): 171-181.
Liao, P. H., W. T. Wong and K. V. Lo. 2005. Release of phosphorus from sewage sludge
using microwave technology. Journal of Environmental Engineering and Science
4(1): 77-81.
Lopez-Valero, I., C. Gomez-Lorente and R. Boistelle. 1992. Effects of sodium and
ammonium ions on occurrence, evolution and crystallinity of calcium phosphates.
Journal of Crystal Growth 121(3): 297-304.

41
Maekawa, T., C. M. Laio, and X. D. Feng. 1995. Nitrogen and phosphorus removal for
swine wastewater using intermittent aeration hatch reactor followed by
ammonium crystallization process. Water Research 29(12): 2643-2650.
Maguire, R.O. and J. T. Sims. 2002. Soil testing to predict phosphorus leaching. Journal
of Environmental Quality 31(5): 1601-1609.
Marti, N., J. Ferrer, A. Seco, and A. Bouzas. 2008. Optimization of sludge line
management to enhance phosphorus recovery in WWTP. Water Research 42(18):
4609-4618.
Massey, M. S. 2008. Dairy Farm Phosphorus Recovery and Re-use to Reduce Water
Quality Risk and Improve Phosphorus Cycling in Agriculture. M. S. Thesis.
Colorado State University, Fort Collins, CO.
Massey, M. S., J. A. Ippolito, J. G. Davis, and R. E. Sheffield. 2010. Macroscopic and
microscopic variation in recovered magnesium phosphate materials: implication
for phosphorus removal processes and product re-use. Bioresource Technology
101(3): 877-885.
Moody, L. B., R. T. Burns and K. J. Stalder. 2009. Effect of anaerobic digestion on
manure characteristics for phosphorus precipitation from swine waste. Applied
Engineering in Agriculture 25(1): 97-102.
Moriyama, K., T. Kojima, Y. Minawa, S. Matsumoto, and K. Nakamachi. 2001.
Development of artificial seed crystal for crystallization of calcium phosphate.
Environmental Technology 22(11): 1245-1252.
Murphy, J. and J. P. Riley. 1962. A modified single solution method for the
determination of phosphate in natural waters. Analytica Chimica Acta 27: 31-36.

42
Musvoto, E. V., M. C. Wentzel, R. E. Loewenthal, and G. A. Ekama. 2000. Integrated
chemical-physical processes modeling - II. Simulating aeration treatment of
anaerobic digester supernatants. Water Research 34(6): 1868-1880.
Nelson, N.O., R. L. Mikkelsen, and D. L. Hesterberg. 2003. Struvite precipitation in
anaerobic swine lagoon liquid: effect of pH and Mg:P ratio and determination of
rate constant. Bioresource Technology 89(3): 229-236.
Ohlinger, K. N., T. M. Young, and E. D. Schoeder. 1998. Predicting struvite formation in
digestion. Water Research 32(12): 3607-3614.
Ohlinger, K. N., T. M. Young, and E. D. Schoeder. 1999. Kinetics effects on preferential
struvite accumulation in wastewater. Journal of Environmental Engineerin-ASCE
125(8): 730-737.
Ormaza-Gonzalez, F. I. and P. J. Statham. 1996. A comparison of methods for the
determination of dissolved and particulate phosphorus in natural waters. Water
Research 30(11): 2739-2747.
Parent, G., G. Belanger, N. Ziadi, J-P. Deland and J. Laperriere. 2007. Precipitation of
liquid swine manure phosphates using magnesium smelting by-products. Journal
of Environmental Quality 36(2): 557-567.
Parsons, S. A., F. Wall, J. Doyle, K. Oldring, and J. Churchley. 1999. Assessing the
potential for struvite recovery at sewage treatment works. Environmental
Technology 22(11): 1279-1286.
Pastor, L., N. Marti, A. Bouzas, and A. Seco, 2008. Sewage sludge management for
phosphorus recovery as struvite in EBPR wastewater treatment plants.
Bioresource Technology 99(11): 4817-4824.

43
Ponce, R. G. and De Sa MEGL. 2007. Evaluation of struvite as a fertilizer: a comparison
with traditional P sources. Agrochimica 51(6): 301-308.
Qureshi, A., K. V. Lo, and P. Liao. 2008. Microwave treatment and struvite recovery
potential of dairy manure. Journal of Environmental Science and Health Part B -
Pesticides Food Contaminants and Agricultural Wastes 43(4): 350-357.
Rowland, A. P. and P. M. Haygarth. 1997. Determination of total dissolved phosphorus
in soil solutions. Journal of Environmental Quality 26(2): 410-415.
Schipper, W. J., A. Klapwjik, B. Potjer, W. H. Rulkens, B. G. Temmink, F. D. G. Kiestra,
and A. C. M. Ljimbach. 2001. Phosphate recycling in the phosphorus industry.
Environmental Technology 22(11): 1337-1345.
Schuiling, R. D. and A. Andrade. 1999. Recovery of struvite from calf manure.
Environmental Technology 20(7): 765-768.
Schulze-Rettmer, R. 1991. The simultaneous chemical precipitation of ammonium and
phosphate in the form of magnesium-ammonium-phosphate. Water Science and
Technology 23(4-6): 659-667.
Shu, L., P. Schneider, V. Jegatheesan, and J. Johnson. 2006. An economic evaluation of
phosphorus recovery as struvite from digester supernatant. Bioresource
Technology 97(17): 2211-2216.
Snoeyink, V. L. and D. Jenkins. 1980. Water Chemistry. New York: John Wiley and
Sons.
Song, Y., P. G. Weidler, U. Berg, R. Nuesch, and D. Donnert. 2006. Calcite-seeded
crystallization of calcium phosphate for phosphorus recovery. Chemosphere 63(2):
236-243.

44
Stratful, I., M. D. Scrimshaw, and J. N. Lester. 2001. Conditions influencing the
precipitation of magnesium ammonium phosphate. Water Research 35(17): 4191-
4199.
Suzuki, K., Y. Tanaka, K. Kuroda, D. Hanajima and Y. Fukumoto. 2005. Recovery of
phosphorus from swine wastewater through crystallization. Bioresource
Technology 96(14): 1544-1550.
Suzuki, K., Y. Tanaka, K. Kuroda, D. Hanajima, Y. Fukumoto, T. Yasuda and M. Waki.
2007. Removal and recovery of phosphorus from swine wastewater by
demonstration crystallization reactor and struvite accumulation device.
Bioresource Technology 98(8): 1573-1578.
Suzuki, K., Y. Tanaka, T. Osada and M. Waki. 2002. Removal of phosphate, magnesium
and calcium from swine wastewater through crystallization enhanced by aeration.
Water Research 36(12): 2991-2998.
Tong, J. and Y. Chen. 2007. Enhanced biological phosphorus removal driven by short-
chain fatty acids produced from waste activated sludge alkaline fermentation.
Environmental Science & Technology 41: 7126-7130.
Ueno, Y. and M. Fujii. 2001. Three years experience of operating and selling recovered
struvite from full-scale plant. Environmental Technology 22(11): 1373-1381.
Van Der Houwen, J.A.M. and E. Valsami-Jones. 2001. The application of calcium
phosphate precipitation chemistry to phosphorus recovery: The influence of
organic ligands. Environmental Technology 22(11): 1325-1335.

45
Van Rensburg, P., E. V. Musvoto, M. C. Wentzel and G. A. Ekama. 2003. Modeling
multiple mineral precipitation in anaerobic digester liquor. Water Research 37(13):
3087-3097.
Wang, L. and G. H. Nancollas. 2008. Calcium orthophosphates: crystallization and
dissolution. Chemical Reviews 108(11): 4628-4669.
Webb, K. M. and G. E. Ho. 1992. Struvite (MgNH4PO4·6H2O) solubility and its
application to a piggery effluent problem. Water Science and Technology 26(9-
11): 2229-2232.
Weld, J. L., A. N., Sharpley, D. B. Beegle and W. J. Gburek. 2001. Identifying critical
sources of phosphorus export from agricultural watersheds. Nutrient Cycling in
Agroecysystems 59(1): 29-38.
Wilkie, A. C., H. F. Castro, K. R. Cubinski, J. M. Owens and S. C. Yan. 2004. Fixed-film
anaerobic digestion of flushed dairy manure after primary treatment: wastewater
production and characterization. Biosystems Engineering 89(4): 457-471.
Wrigley, T., K. Webb and H. Venkitachalam. 1992. A laboratory study of struvite
precipitation after anaerobic digestion of piggery wastes. Bioresource Technology
41(2): 117-121.

46
3. ABATING THE EFFECTS OF CALCIUM ON STRUVITE
PRECIPITATION IN LIQUID DAIRY MANURE
3.1 INTRODUCTION
Published literatures have demonstrated the negative impacts of calcium (Ca) on
struvite preciptation (Le Corre et al., 2005; Wang et al., 2005), but limited information is
available on enhancing struvite precipitation by reducing the effects of Ca in liquid dairy
manure. The Ca concentration of dairy manure is significantly high, and strongly
correlated to the diet and bedding management (Clanton et al., 2005). However, standard
estimates (ASABE, 2005) showed that typical dairy manure slurry contains 0.4 % Ca,
0.13 % P and 1535 ppm Na (total weight basis), indicating a quite high Ca/TP molar ratio
(2.4), which could further suppress the struvite formation. According to the survey of
2006~2009 Rockingham County (VA) farms (Figure 3), the dairy manure Ca ranged
from 95 to 11,055 mg/L with an average of 1537 mg/L and a standard deviation of 1245
mg/L. It was found that the average Ca/TP molar ratio (5.9) of the dairy manure in this
area of interest exceeded the value of typical manure (ASABE, 2005). Therefore, Ca
removal is an essential pretreatment to facilitate struvite precipitation in liquid dairy
manure, based on the scope of average level in United States.

47
Figure 3. Average characteristics (n = 107) of dairy manure in Rockingham County (VA).
Error bars show standard deviations.
1139
2477
202
542
15371698
541
0
500
1,000
1,500
2,000
2,500
3,000
3,500
TAN TKN TP Mg Ca K Na
Av
era
ge
con
cen
tra
tio
n (
mg
/L)

48
The bio-catalytic calcification mechanism was used to achieve Ca removal from
calcium-rich industrial wastewater based on ureolytic microbiological carbonate
precipitation (Hammes et al., 2003) and this technology was further employed to induce
struvite production (Carballa et al., 2009). However, such reactors are complex to run and
sometimes hard to be stable to provide high removal efficiencies when applied to
practical works. In fact, Ca removal can also be accomplished simply by adding Ca-
binding reagents such as ethylenediaminetetraacetic acid (EDTA) and oxalic acid
(H2C2O4), according to equation (15) and (16).
(15)
(16)
On the other hand, since Mg2+
availability is the limiting factor in many
wastewater management systems for struvite preciptiation, Mg amendment was a general
method applied by many investigators to maximate P removal and to recover struvite
from animal manure/wastewater (Burns et al., 2001; Burns et al., 2003; Suzuki et al.,
2005; Celen et al., 2007). One issue in terms of Ca inhibition and Mg augmentation is the
Ca/Mg molar ratio. Diverse findings were reported on the effects of this parameter. Le
Corre et al (2005) and Wang et al (2005) found that a Ca/Mg molar ratio greater than 1 in
wastewater would significantly suppress struvite formation, while anaerobic supernatants
with Ca/Mg ratios of up to 6 were still conductive to recover P precipitates containing
highly pure struvite (Huang et al., 2006). These conflicting observations might possibly
be explained by the initial absolute Ca2+
concentration, not the Ca/Mg molar ratio,

49
because the Ca/Mg molar ratio can be suppressed by directly reducing the Ca
concentration and/or adding external Mg (e.g. MgCl6, MgO). Since the initial Ca/Mg
molar ratio is directly attributed to the Ca2+
/DRP molar ratio, the latter might be a key
factor for struvite production.
This chapter focused on calcium removal in liquid dairy manure to facilitate
struvite precipitation. Two compounds, EDTA and oxalic acid that have been used to
reduce the potential of forming Ca precipitates in solution were used in this study (Doyle
et al., 2003, Doherty, 2006; Cao et al., 2007). The specific objectives are two-folded: (1)
to investigate the effectiveness of EDTA and oxalate in enhancing struvite precipitation
in liquid dairy manure with high Ca2+
concentration; and (2) to compare the two
strategies (reducing absolute Ca2+
and increasing Mg2+
) of struvite precipitation in liquid
dairy manure.
3.2 MATERIALS AND METHODS
A series of experiments were conducted to assess how to reduce the effects of Ca2+
on struvite precipitation in liquid dairy manure. First, a chemical equilibrium model,
Visual MINTEQ 2.60 (Gustafsson, 2008), was used to determine the appropriate
conditions required to minimize the Ca2+
effects and to enhance struvite precipitation.
Then, the chemical modeling results were validated using synthetic liquid dairy manure.
The results from the model validation were applied to liquid dairy manure to test struvite
precipitation.
3.2.1 Chemical Modeling
Two tests were conducted in the chemical modeling phase: (1) determination of the
solution pH at which the bound inorganic phosphate ions are released into solution, and

50
thus when to add EDTA or oxalic acid; and (2) evaluate struvite precipitation potential
from liquid dairy manure with different Ca2+
concentrations.
Visual MINTEQ 2.60 uses saturation index (SI) as a key parameter to evaluate the
saturation states of thermodynamically probable precipitates that could form in solution,
as described in equation (17).
(17)
where IAP is the ionic activity product for a specific precipitate, and KSO is the
solubility product. Theoretically, when SI > 0, the solution is supersaturated and
precipitation occurs spontaneously; when SI < 0, the solution is undersaturated and no
precipitation occurs; and SI = 0 implies equilibrium state.
Since Visual MINTEQ 2.60 does not have the characteristics of struvite in its
database, the first step before running the model was to manually load its solubility
product (pKSO = 13.26) and enthalpy of reaction, ΔH = 22.6 kJ/mol (Ohlinger et al., 1998;
Ronteltap et al., 2007). The model was set to calculate the ionic strength of the solution
using Debye-Huckel method for activity correction at room temperature (22 °C).
3.2.1.1 Test 1: Determining the required pH for manure acidification pretreatment
and constituent ions distribution after adding EDTA or oxalic acid
Five phosphate minerals (struvite, newberyite, monenite, brushite, beta-tricalcium
phosphate) were selected as the solid phases that potentially control availability of
orthophosphate in solution (Gungor and Karthikeyan, 2005b).The pH range considered
for the release of orthophosphate from the solid phases for manure by acidification was
4.0 to 6.5. The composition and concentration of the constituent ions used as inputs in
Visual MINTEQ are presented in Table 3.

51
Table 3. Average composition of liquid dairy manure
Parameter (unit) Mean ( ± SD)
TS (%) 4.61 (± 0.01)
TSS (%) 2.36 (± 0.05)
pH 7.04 (± 0.01)
Total VFA (as acetate, mg/L) 2070 (± 246)
Alkalinity (as CaCO3, mg/L) 9300 (± 676)
Total P (TP, mg/L) 460 (± 14)
dissolved reactive P (DRP, mg/L) 19 (± 1)
DRP of acidified manure (pH 4.5, mg/L) 303 (± 15)
Total Kjeldahl N (TKN, mg/L) 2845 (± 40)
Total NH4-N (TAN, mg/L) 1405 (± 18)
Mg (mg/L) 712 (± 25)
Ca (mg/L) 1735 (± 55)
Na (mg/L) 908 (± 74)
K (mg/L) 1198 (± 158)
Cu (mg/L) 12.3 (± 6.8)
Zn (mg/L) 15.3 (± 0.8)
Mn (mg/L) 11.3 (± 1.3)
Fe (mg/L) 45 (± 2.5)
Al (mg/L) 27.9 (± 1.8)
S (mg/L) 261 (± 41)

52
The quantities of EDTA and oxalic acid used as model inputs were set equal to the
Ca2+
concentration (1735 mg/L = 43.375 mmol/L), based on the stoichiometry of the
reaction between oxalate and EDTA with Ca shown in equations (15) and (16) as
described in introduction part.
At each pH, the model was set to output the dissolved orthophosphate in solution,
equilibrium concentrations of free ions in solution, and amounts of precipitated minerals
and/or Ca- and Mg-EDTA chelates formed at the end of the reactions after adding oxalic
acid or EDTA to sequester Ca2+
. The SI values and the precipitated minerals calculated
by the model were plotted against the pH to determine the required pH to release DRP
into solution.
3.2.1.2 Test 2: Evaluating struvite precipitation potential
To evaluate the struvite precipitation potential, the model was run under five
conditions: positive control (PC), negative control (NC), EDTA treatment (ED), oxalate
treatment (OX) and Mg amendment (Mg) described in Table 4. The purpose of including
Mg amendment was to compare the effects of Ca/Mg ratio decrease on struvite
production resulted from directly reducing the absolute Ca2+
concentration through Ca-
binding reagents addition and from increasing the Mg2+
availability in solution by
external Mg amendment. The model inputs of test 2 (Table 5) were derived from manure
analysis presented in table 3. The Ca2+
and Mg2+
inputs for ED and OX were adjusted
using removal efficiencies from Test 1. For the Mg amendment test, Mg2+
was input as
the value to make Ca/Mg ratio at 0.25. The potential minerals that can precipitate based
on thermodynamics and kinetics of reactions and used in the model included struvite
(MgNH4PO4∙6H2O), newberyite (MgHPO4∙3H2O), mononite (CaHPO4), brushite

53
(CaHPO4∙2H2O), magnesite (MgCO3), nesquehonite (MgCO3∙3H2O), brucite (Mg(OH)2),
and beta-tricalcium phosphate (β-Ca3(PO4)2) (Celen et al., 2007; Gungor and Karthikeyan,
2005a). The precipitation reactions for these minerals are listed in Table 6. The quantities
of mineral precipitated was calculated by the model and plotted against pH ranging from
6 to 11.
3.2.2 Testing Model Results With Synthetic Liquid Dairy Manure
3.2.2.1 Preparation of synthetic liquid dairy manure
The composition and concentration of the constituents of the synthetic liquid dairy
manure were prepared based on the values presented in Table 3. Stock synthetic solutions
were prepared by dissolving laboratory grade MgCl2∙6H2O, NH4Cl, KH2PO4,
CaCl2∙6H2O, NaHCO3, FeCl3∙6H2O, AlCl3∙6H2O, CuSO4·5H2O and CH3COONa in
deionized water. EDTA and oxalate were added later in the forms of Na2-EDTA∙2H2O
and H2C2O4∙2H2O, respectively. The suspended solids in dairy manure were not
accounted for in the synthetic liquid simulate.

54
Table 4. Table Experimental treatments
Condition Description
Positive control (PC) synthetic solution (initial Mg/Ca/PO4-P molar ratio = 1.6:0.4:1); NaOH
addition to raise pH
Negative control (NC) Liquid dairy manure (initial Ca/Mg molar ratio = 1.46); NaOH
addition to raise pH
EDTA treatment (ED) Disodium-EDTA added to reduce the effects of calcium; NaOH
addition to raise pH
Oxalate treatment (OX) Oxalic acid added to reduce the effects of calcium; NaOH addition to
raise pH
Mg amendment (Mg) MgCl2·6H2O added to bring Ca/Mg molar ratio to 0.25; NaOH
addition to raise pH
Table 5. Visual MINTEQ model inputs
Input
Concentration
PC
(mmol/L)
NC
(mg/L)
ED [a]
(mg/L)
OX [b]
(mg/L)
Mg
(mg/L)
PO43-
10 [c]
303 303 303 303
NH4+ 100 1405 1405 1405 1405
Mg2+
16 712 638.6 712 4164
Ca2+
4 1735 189.3 28.87 1735
Na+ 80 908 908 908 908
K+ 36 1198 1198 1198 1198
HCO3- 45 2700 2700 2700 2700
acetate- 35 2070 2070 2070 2070
Fe3+
1 53.6 8.4 47.7 53.6
Al3+
1.2 33.7 14.5 18.3 33.7
Cu2+
0.07 4.8 0 1.2 4.8
SO42-
8 183.3 183.3 183.3 183.3
Cl- 140 1284 1284 1284 1284
[a] The composition and concentrations of the stock synthetic solution for EDTA
treatment were similar to negative control, plus addition of 43.4 mM EDTA4-
.
[b] The composition and concentrations of the stock synthetic solution for oxalate
treatment were similar to negative control, plus addition of 43.4 mM oxalate2-
.

55
Table 6. Precipitation equations for the possible minerals that can formed during struvite
precipitation
Mineral Reaction pKsp
(25 °C) Reference
struvite
13.26 Ohlinger et al., 1998
newberyite
5.8 Taylor et al., 1963
monenite 6.9 Wang and Nancollas, 2008
brushite
6.59 Stumm and Morgan, 1981
magnesite 7.46; 8.2 Stumm and Morgan, 1981
nesquehonite
5.19 Stumm and Morgan, 1981
β-TCP 28.9 Wang and Nancollas, 2008
brucite 11.16 Stumm and Morgan, 1981

56
3.2.2.2. Struvite precipitation in synthetic liquid dairy manure
The experiments were conducted in batch using a six-station 2 L jar test apparatus
(PB700 Phipps & BirdTM, Richmond, VA). 1000 mL of synthetic solution was placed
in the jars and mixed at 100 rpm. The initial pH of the solution was measured and
adjusted to 4.5 by adding 5 N HCl, if necessary, Then EDTA and oxalic acid was added
to their respective treatments and mixed for 30 min. The mixed solution was transferred
into 1000 mL Imhoff cones and settled for 60 min. After settling, 200 mL supernatant
was placed in a 250 mL beaker for struvite precipitation. Struvite was precipitated by
raising the pH of the supernatant to appropriate value, based on the model results for
different precipitation conditions (discussed later) while mixing slowly with a magnetic
stirrer. After attaining the desired pH, the mixing was continued for about 10 min. and the
precipitation test stopped. The resulting solution was filtered with 0.22 µm filter
(Millipore, Billerica, MA, USA). The filtrate was analyzed for DRP. The precipitates on
the filter paper were dried at 40 °C to prevent the struvite crystals from losing
crystallization water (Ohlinger et al., 1998). The dried precipitated materials were
analyzed for morphology and structure using scanning electron microscopy (SEM) and
X-ray diffraction (XRD), respectively. Each test was conducted in triplicate.
3.2.3 Struvite Precipitation in Liquid Dairy Manure
Struvite precipitation from liquid dairy manure was also conducted in batch
following the same procedures as synthetic solutions. The first set of tests was done using
raw manure with no amendment (control), raw manure + EDTA, raw manure + oxalic
acid and raw manure + MgCl2·6H2OThe second set of tests was performed using the
centrate from centrifuged acidified manure with no amendments (control) and amended

57
with EDTA, oxalic acid and MgCl2·6H2O, respectively.. The purpose of employing the
second set was to assess the effects of suspended solids on struvite precipitation. The pH
of manure was decreased from 7.0 to 4.5 by adding 5 N HCl and then the treatment
(control, EDTA, oxalic acid and MgCl2·6H2O) administrated. The manure was then
centrifuged using an Eppendorf centrifuge (model 5804, Hamburg, Germany) at 10,000
rpm for 15 min. The centrate was transferred to a 250 mL beaker and then struvite
precipitation conducted following the same procedures as described in 3.2.2. All the tests
were done in triplicate.
3.2.4 Sampling and Analysis
Samples were collected during parts of the study dealing with testing model results
with synthetic liquid dairy manure and struvite precipitation from liquid dairy manure.
Samples were taken before and after the required treatment were administered. The pH in
this study was measured using a handheld meter (Multi 340i, WTW Inc., West Wareham,
Mass.). The liquid samples were analyzed for ortho-phosphate to assess removal of
reactive phosphate from solution. The ortho-phosphate was analyzed using HACH kit
with DR/2800 spectrophotometer (HACH, USA). The solid or particulate fractions were
subjected to SEM and XRD analysis for identification and determination of the presence
of struvite crystals. X-ray Diffraction (XRD) data were collected with the Scintag PAD V
via Omni-Scientific automation using Tasker (TXRD) software interface at the
department of Geology and Geophysics, Yale University. The morphology of the
precipitated material was examined using scanning electron microscopy (SEM, Zeiss
EVO 40XVP, Germany) at the Morphology laboratory at Virginia Tech, Veterinary
School.

58
3.3 RESULTS AND DISCUSSIONS
3.3.1 Chemical Equilibrium Modeling
3.3.1.1 Manure acidification pretreatment and EDTA/oxalate treatment
Saturation indices for the phosphate minerals considered in this study were presented
in Fig 4 (a). At pH 4.5 or below, the SI values for all the phosphate minerals are negative,
indicating that all the inorganic phosphate is in dissolved phase. The SI values of
monenite (CaHPO4) and brushite (CaHPO4·2H2O) turn positive at pH 4.6 or higher,
implying potential for their formations occurring in solution. The model also predicted
the amounts of precipitates formed (mM) and dissolved proportion (%) of total DRP at
each pH level respectively, as shown in Fig 4 (b). For example, it was noted that the
proportion of ortho-P in dissolved phase increased from 43 % to 100 % when pH dropped
from 5.0 to 4.5. Hence, the pH of liquid dairy manure should be decreased to below 4.5 to
release most of the DRP back into the solution as dissolved reactive phosphate, based on
the model results. This required acidification pH (4.5) was lower than the frequent value
(pH 5.0) used in research literature for calcium phosphate dissolution (Wang and
Nancollas, 2008). But it was not unexpected because monenite and/or brushite precipitate
at pH < 7.0 (Musvoto et al., 2000) and an even stronger acidification level (pH 3.8) was
adopted by Zhang et al (2010) to release P from calcium phosphate for struvite fertilizer
production. Furthermore, according to modeling results, it was apparent that nearly all
(99.2 %) of the DRP was precipitated by Ca and/or Mg at pH 6.5, forming several solids
phases, but it might not be the case in the real condition because the detected DRP
concentration of the raw liquid dairy manure (pH 7.04) accounts for 6.27 % of its total
ortho-P (based on Table 3).

59
Figure 4. Model predictions of the (a) saturation index of minerals at pH 4.0 to 6.5 and (b)
quantities of minerals precipitated dissolved DRP fraction
-5.0
-4.0
-3.0
-2.0
-1.0
0.0
1.0
2.0
3.0
4.0
5.0
4.0 4.5 5.0 5.5 6.0 6.5
Sa
tura
tio
n I
nd
ex
pH
(a)Struvite MgHPO4·3H2O CaHPO4 CaHPO4·2H2O beta-TCP
42.926
0
10
20
30
40
50
60
70
80
90
100
0.0
1.0
2.0
3.0
4.0
5.0
6.0
7.0
8.0
9.0
10.0
4.0 4.5 5.0 5.5 6.0 6.5
Dis
solv
ed P
O4
(%
)
Pre
cip
ita
ted
min
era
ls a
mo
un
t (m
M)
pH
(b) CaHPO4 beta-TCP Dissolved PO4 (%)

60
EDTA does not form mineral precipitates but metal-EDTA chelates with Ca2+
,
Mg2+
and the other metal cations in solution. Thus, instead of saturation index, the
distributions of species in the dissolved phases were used in the analysis (data not shown).
The model outputs showed that 89.1% Ca2+
and 10.3 % Mg2+
was captured by EDTA to
form Ca-EDTA and Mg-EDTA chelates, respectively, indicating that only 10.9 % Ca2+
(187.2 mg/L) remained in solution compared to 89.7 % Mg2+
(638.55 mg/L). Thus, it was
predicted that Ca/Mg molar ratio was decreased to 0.18 from 1.46.
3.3.1.2 Struvite precipitation
The SI values and the corresponding amounts of minerals precipitated at pH 6 to 11
under the five conditions tested were shown in Figure 5 to 9. For the positive control,
struvite precipitation occurs at pH as low as 6.1 and struvite was predicted to be a
dominant solid phase of the precipitates with pH 6.5 or higher (Figure 5). This was
expectable because the Mg//Ca/DRP ratio adopted in positive control was 1.6/0.4/1,
which was suggested as an optimal condition for struvite production (Munch and Barr,
2001; Nelson et al., 2003; Wang et al., 2005). The amounts of struvite precipitates
approximately reach its maximum value at pH 7.2 and this value keeps stable at higher
pH. When the pH was above 7.0, large amounts of magnesite (MgCO3) were estimated to
form simultaneously with struvite precipitation, due to the high Mg2+
concentration and
high alkalinity. So the optimum pH was estimated to be 7.0~7.2 to precipitate struvite as
the main solid phase in positive control solution. For the negative control, no struvite was
predicted to be present in the precipitated minerals (Figure 6) regardless of pH and the
model output the main solid phases as β-Ca3(PO4)2, MgCO3 and/or Mg(OH)2, which was
pH specific. One obvious issue was the high Ca/Mg molar ratio (1.46) in negative control.

61
The SI values and the solid phase distributions under the EDTA and oxalic acid
treatment were presented in Figure 7 and 8. For EDTA treatment, struvite and CaHPO4
were predicted as the main solid phases at pH 6.5 or below, but CaHPO4 phase
disappeared when pH was above 6.5. Like the positive control modeling results, struvite
and MgCO3 were predicted to be the dominant precipitates with pH increased to 7.0 or
higher, due to the high alkalinity and low Ca2+
concentration after EDTA addition. For
oxalic acid treatment, the modeling results were quite similar to those of EDTA set
except for the solid phase at pH 6.0~6.5 (MgHPO4·3H2O instead of CaHPO4 was
present), resulting from the even lower Ca2+
concentration and comparatively higher
Mg2+
concentration in solution treated by oxalate, compared with solution treated by
EDTA. For Mg amendment treatment (Figure 9), there was no struvite forming in
mineral precipitates and the dominant solid phases were MgCO3 and β-Ca3(PO4)2 with
pH below 9.5, because of the excessively high Mg2+
concentration and high Ca2+
concentration.

62
Figure 5. Model predictions for struvite precipitation in the positive control with
Mg/Ca/PO4-P molar ratio of 1.6/0.4/1
Figure 6. Model predictions for struvite precipitation in the negative control with
Ca/Mg/PO4-P molar ratio of 4.43/3.04/1
0.0
1.0
2.0
3.0
4.0
5.0
6.0
7.0
8.0
9.0
10.0
6.0 6.5 7.0 7.5 8.0 8.5 9.0 9.5 10.0 10.5 11.0
Pre
cip
ita
ted
min
era
ls a
mo
un
t (m
M)
pH
beta-TCP
CaHPO4
MgCO3
Struvite
0.0
5.0
10.0
15.0
20.0
25.0
30.0
6.0 6.5 7.0 7.5 8.0 8.5 9.0 9.5 10.0 10.5 11.0
Pre
cip
ita
ted
min
era
ls a
mo
un
t (m
M)
pH
beta-TCP
MgCO3
Mg(OH)2

63
Figure 7. Model predictions for struvite precipitation in the EDTA treated dairy manure
Figure 8. Model predictions for struvite precipitation in the oxalic acid treated dairy
manure
0.0
2.0
4.0
6.0
8.0
10.0
12.0
14.0
16.0
18.0
20.0
6.0 6.5 7.0 7.5 8.0 8.5 9.0 9.5 10.0 10.5 11.0
Pre
cip
ita
ted
min
era
ls a
mo
un
t (m
M)
pH
CaHPO4
MgCO3
Struvite
0.0
2.0
4.0
6.0
8.0
10.0
12.0
14.0
16.0
18.0
20.0
6.0 6.5 7.0 7.5 8.0 8.5 9.0 9.5 10.0 10.5 11.0
Pre
cip
ita
ted
min
era
ls a
mo
un
t (m
M)
pH
MgCO3
MgHPO4·3H2O
Struvite

64
Figure 9. Model predictions for struvite precipitation in the Mg amended (Ca/Mg 0.25)
dairy manure
0.0
5.0
10.0
15.0
20.0
25.0
30.0
35.0
40.0
6.0 6.5 7.0 7.5 8.0 8.5 9.0 9.5 10.0 10.5 11.0
Pre
cip
ita
ted
min
era
ls a
mo
un
t (m
M)
pH
beta-TCP
MgCO3
Mg(OH)2

65
3.3.2 Synthetic Liquid Dairy Manure Experiments
All treatments with synthetic liquid dairy manure removed up to 99.6 % soluble
phosphate (Table 7), resulting from Mg- and Ca-phosphate formation. The SEM and
XRD analyses performed to determine the morphology and structure of the precipitates
are presented in Figure 10 (a), (b), (c), (d) and (e) for the positive control, negative
control, EDTA treatment, oxalic acid treatment and Mg amendment respectively. The
XRD patterns of the positive control, in which the Mg/Ca/DRP ratio was1.6/0.4/1,
matched the database reference pattern for struvite, confirming a dominant presence of
struvite in the precipitates. In contrast, no definite peaks were observed in the XRD
patterns of the negative control (Figure 10 b), in which the Ca/Mg/DRP ratio was
4.44/3.04/1. The morphology of the precipitates observed under SEM for the positive
control showed well defined crystals (Figure 10 a) while the images for the negative
control had plenty of a powdery amorphous compound indicating no crystalline structure,
thus no struvite present. The observation of struvite in the positive and no struvite in the
negative control was consistent with the observations by Le Corre et al (2005) at ratios in
similar ranges. The SEM pictures confirmed the XRD results, where orthorhombic
struvite crystals were clearly visible with small amounts of amorphous material on the
surface in the positive control and no discernible struvite in the negative control sample.

66
Table 7. DRP removal from synthetic liquid dairy manure
Condition Final DRP (mg/L) Removal efficiency (%)
positive control 28.8 (± 1.8) 95.8 (± 0.3)
negative control 4.2 (± 1.5) 99.4 (± 0.2)
EDTA treatment 32.3 (± 1.0) 95.2 (± 0.2)
oxalate treatment 37.8 (± 0.8) 94.4 (± 0.1)
Mg amendment 1.2 (± 0.3) 99.6 (± 0.0)

67
(a) Positive control: Ca/Mg/DRP = 0.4/1.6/1
(b) Negative control: Ca/Mg/DRP = 4.44/3.04/1
(c) EDTA treatment: Ca/Mg/DRP = 0.48/2.72/1
(d) Oxalate treatment: Ca/Mg/DRP = 0.07/3.04/1
(e) Mg amendment: Ca/Mg/DRP = 4.44/17.75/1
Figure 10. SEM and XRD results of recovered precipitates from synthetic liquid dairy
manure for (a) positive control, (b) negative control, (c) EDTA treatment, (d) oxalate
treatment and (e) Mg amendment. The blue vertical lines are the XRD patterns from the
reference (struvite) in the database.

68
The XRD patterns generated for the precipitates recovered from EDTA and oxalic
acid treated synthetic solution showed dominant presence of struvite (Figure 10 c and d).
The corresponding SEM pictures clearly show agglomerates of orthorhombic crystalline.
Thus the XRD and SEM images verified the Minteq model results, that struvite
precipitates as a dominant solid phase in EDTA and/or oxalic acid treated solution. Large
amounts of white precipitates were observed to form rapidly when treating the synthetic
liquid with oxalic acid. These were assumed to be Ca-oxalate precipitates based on
observations reported by Cao et al. (2007) that kinetically favored Ca-oxalate forms
preemptively, which inhibits calcium phosphate precipitation. For Mg amendment, hardly
any crystal-like solids were found in the SEM image, indicating no struvite formation,
which was in accordance with the Minteq model result (Figure 10 e). The clear difference
in the potential to precipitate struvite in two different solutions tested could probably
explained by the varying Ca/DRP ratios (positive control = 0.4, Mg amendment = 4.44),
implying that not only the Ca/Mg molar ratio affects struvite precipitation, but also the
absolute Ca/DRP ratio. Since the Ca/Mg molar ratio is directly derived by Ca/DRP ratio,
the latter might be used as a determinative parameter for struvite production in the
wastewater management systems. Though successful struvite recovery was reported
through Mg amendment (Nelson et al., 2003; Suzuki et al., 2005; Celen et al., 2007) in
swine wastewater, no struvite crystals were observed in this negative control test,
indicating that the high P removal was mainly attributed to amorphous calcium
phosphates (ACP) formation. It was also noted that Mg amendment does not work
effectively to enhance struvite precipitation from solutions where Ca/DRP ratio is greater

69
than 1. Alternatively, Ca2+
reduction pretreatment should be carried out firstly to produce
struvite crystals.
3.3.3 Liquid Dairy Manure Experiments
The phosphate removals from the liquid dairy manure were presented in Table 8. The
removal efficiencies were greater than 90 % for both the non- and centrifuged manure,
suggesting no influence of suspended solids on phosphate removal. The SEM and XRD
analysis performed on the material recovered from the non-centrifuged and the
centrifuged dairy manure are presented in Figure 11 and 12, respectively. No distinct
crystals were observed in the non-centrifuged manure imaged by SEM, regardless of any
treatments. The XRD patterns of the material precipitated from EDTA treatment was
primarily amorphous with 3 peaks at 2θ = 21°, 31° and 34.5°. Compared with the
reference struvite pattern, there may be some presence of struvite crystals. Material
recovered from oxalate treated manure appeared crystalline but no match existed between
the peaks in the sample’s XRD pattern and reference pattern for struvite, implying no
formation of struvite. No XRD analyses were conducted for the control and Mg
amendment tests in non-centrifuged set due to the absence of crystals observed in SEM
images (Fig 11 a and 11 d).

70
Table 8. DRP removal from liquid dairy manure
Condition Final DRP (mg/L) Removal efficiency (%)
Centrifuged control 18.6 (± 1.6) 93.9 (± 0.1)
EDTA treatment 29.9 (± 10.9) 90.2 (± 3.6)
oxalate treatment 24.6 (± 0.2) 91.9 (± 0.1)
Mg amendment 5.7 (± 0.8) 98.1 (± 0.0)
Non-centrifuged control 17.4 (± 1.8) 94.3 (± 0.6)
EDTA treatment 25.1 (± 7.1) 91.7 (± 2.3)
oxalate treatment 23.9 (± 0.3) 92.1 (± 0.1)
Mg amendment 3.3 (± 0.2) 98.9 (± 0.0)

71
(a) NC-control
(b) NC-EDTA treatment
(c) NC-oxalate treatment
(d) NC-Mg amendment
Figure 11. SEM and XRD results of recovered precipitates from non centrifuged (raw)
liquid dairy manure for the untreated and the EDTA and oxalic acid treatments. The blue
vertical lines are the XRD patterns from the reference (struvite) in the database.

72
(a) Control
(b) EDTA treatment
(c) Oxalate treatment
(d) Mg amendment
Figure 12. SEM and XRD results of recovered precipitates from centrifuged liquid dairy
manure for the (a) untreated (control), (b) EDTA treatment, (c) oxalic acid treatment and
(d) Mg amendment. The blue vertical lines are the XRD patterns from the reference
(struvite) in the database.

73
For the centrifuged manure the EDTA treatment produced short prism-shaped
crystals (Figure 12 b), while the oxalic acid treatment produced leaf-like crystals (Figure
12 c). The XRD patterns confirmed the dominance of struvite crystals in both EDTA and
oxalate treated samples, although the morphology of the crystals looked quite different
from the long, orthorhombic-shaped struvite previously observed in synthetic solution
and also by Le Corre et al. (2005). The diverse morphology (blocky and dendritic shape)
of the struvite obtained in the experiment is not unusual, and might be caused by
differences in physical properties of the crystals formed (Adnan et al., 2004).
Furthermore, pH and crystal growing time also affect the morphology of final struvite
crystals. Many twin and dendritic struvite crystals were observed at pH>8 (crystal
growing time > 24 hours), while struvite crystals take blocky and hemimorphic
morphology at pH 7.5 (crystal growing time 3~8 hours) (Prywer and Torzewska, 2009).
No crystalline materials were observed in the control (Figure 12 a). Some mineral-
precipitates-like solids were found in SEM image of Mg amendment test (Fig 12 d) but
the morphology is not crystalline. Therefore, EDTA and/or oxalate addition could reduce
the calcium effects in order to facilitate struvite precipitation in liquid dairy manure,
which was consistent with the results obtained in Minteq model synthetic solutions.
The TSS concentrations used in this study were 0.44 % and 2.15 %, for the
centrifuged and the non centrifuged dairy manure, respectively. These TSS values are
much higher than the 0.1% Schuling and Andrade (1999) reported interferes with struvite
precipitation. As has been noted, there was better struvite precipitation in the centrifuged
manure (Figure 12) compared to the non centrifuged manure (Figure 11), directly

74
attributed to the varying TSS, the non centrifuged manure had almost four times TSS
compared to the centrifuged manure.
3.4 CONCLUSIONS
Recovery of P through precipitation as magnesium ammonium phosphate (struvite)
from animal manure including dairy cattle will be the key to finding ways to recover and
reuse phosphorus as the phosphate rock reserve diminishes in quantity and quality, for the
use of phosphorus to be sustainable. To recover struvite from dairy manure, the first step
is to precipitation. Precipitation of struvite in a medium like dairy manure is a challenge
because of the interference of high calcium concentration. This study has shown that:
Acidifying the manure to pH 4.5, followed by addition of EDTA or oxalic acid
will reduce the inhibitory effects of calcium and enhance struvite precipitation.
Struvite can be precipitated at pH 7.0 in dairy manure, thus it is not necessary to
raise the pH to values > 8.0 as presented in some literature.
Ca/DRP molar ratio should be employed as the determinative parameter instead of
the Ca/Mg molar ratio to evaluate the potential of struvite precipitation in
wastewater management systems.
Mg amendment works ineffectively to enhance struvite precipitation for solutions
with Ca/DRP molar ratios higher than 1.
Precipitation of struvite can be achieved in the medium with 4,400 mg/L total
suspended solids concentrations.

75
REFERENCES
Adnan, A., Dastur, M., Mavinic, D.S., Koch, F.A., 2004. Preliminary investigation into
factors affecting controlled struvite crystallization at the bench scale. Journal of
Environmental Engineering and Science 3(3), 195-202.
ASABE. 2005. Manure characteristics. American Society of Agricultural and Biological
Engineers (ASABE) Standard D384.2. St. Joseph, Mich.
Burns, R. T., L. B. Moody, F. R. Walker, and D. R. Raman. 2001. Laboratory and in-situ
reductions of soluble phosphorus in swine waste slurries. Environmental
Technology 22(11): 1273-1278.
Burns, R. T., L. B. Moody, I. Celen and J. R. Buchanan. 2003. Optimization of
phosphorus precipitation from swine manure slurries to enhance recovery. Water
Science and Technology 48(1): 139-146.
Cao, X., W. G. Harris, M. S. Josan, and V. D. Nair. 2007. Inhibition of calcium
phosphate precipitation under environmentally relevant conditions. Science of the
Total Environmment 383(1-3): 205-215.
Carballa, M., W. Moerman, W. de Windt, H. Grootaerd and W. Verstraete. 2009.
Strategies to optimize phosphate removal from industrial anaerobic effluents by
magnesium ammonium phosphate (MAP) production. Journal of Chemical
Technology and Biotechnology 84(1): 63-68.
Celen, I., J. R. Buchanan, R. T. Burns, R. B. Robinson, and D. R. Raman. 2007. Using a
chemical equilibrium model to predict amendments required to precipitate
phosphorus as struvite in liquid swine manure. Water Research 41(8): 1689-1696.

76
Clanton, C. J., D. R. Schmidt, K. A. Janni, M. I. Endres. 2005. Dolomitic limestone
bedding effects on dairy manure characteristics. Applied Engineering in
Agriculture 21(4): 697-706.
Doherty, W. O. S. 2006. Effect of calcium and magnesium ions on calcium oxalate
formation in sugar solutions. Industrial & Engineering Chemistry Research 45(2):
642-647
Doyle, J. D., K. Oldring, J. Churchley, C. Price, and S. A. Parsons. 2003. Chemical
control of struvite precipitation. Journal of Environmental Engineering 129(5):
419-426.
Gungor, K., and K. G. Karthikeyan. 2005a. Influence of anaerobic digestion on dairy
manure phosphorus extractability. Transactions of the ASAE 48(4): 1497-1507.
Gungor, K., and K. G. Karthikeyan. 2005b. Probable phosphorus solid phases and their
stability in anaerobically digested dairy manure. Transactions of the ASAE 48(4):
1509-1520.
Gustafsson, J. P. 2008. Visual MINTEQ, ver 2.60. Department of Land and Water
Resources Engineering, Royal Institute of Technology, Stockholm, Sweden.
Hammes, F., A. Seka, S. de Knijf, and W. Verstraete. 2003. A novel approach to calcium
removal from calcium-rich industrial wastewater. Water Research 37(3): 699-704.
Huang, H., D. S. Mavinic, K. V. Lo, and F. A. Koch. 2006. Production and basic
morphology of struvite crystals from a pilot-scale crystallization process.
Environmental Technology 27(3): 233-245.

77
Le Corre, K. S., E. Valsami-Jones, P. Hobbs, and S. A. Parsons. 2005. Impact of calcium
on struvite crystal size, shape and purity. Journal of Crystal Growth 283(3-4):
514-552.
Munch, E. V. and K. Barr. 2001. Controlled struvite crystallization for removing
phosphorus from anaerobic digester sidestreams. Water Research 35(1): 151-159.
Musvoto, E. V., M. C. Wentzel, R. E. Loewenthal, and G. A. Ekama. 2000. Integrated
chemical-physical processes modeling - II. Simulating aeration treatment of
anaerobic digester supernatants. Water Research 34(6): 1868-1880.
Nelson, N.O., R. L. Mikkelsen, and D. L. Hesterberg. 2003. Struvite precipitation in
anaerobic swine lagoon liquid: effect of pH and Mg:P ratio and determination of
rate constant. Bioresource Technology 89(3): 229-236.
Ohlinger, K. N., T. M. Young, and E. D. Schoeder. 1998. Predicting struvite formation in
digestion. Water Research 32(12): 3607-3614.
Prywer, J. and A. Torzewska. 2009. Bacterially induced struvite growth from synthetic
urine: experimental and theoretical characterization of crystal morphology.
Crystal Growth & Design 9(8): 3538-3543
Ronteltap, M., M. Maurer, and W. Gujer. 2007. Struvite precipitation thermodynamics in
source-separated urine. Water Research 41(5): 977-984.
Schuiling, R. D and A. Andrade. 1999. Recovery of struvite from calf manure.
Environmental Technology 20(7): 765-768.
Stumm, W. and J. J. Morgan. 1981. Aquatic Chemistry: An Introduction Emphasizing
Chemical Equilibria in Natural Waters. Wiley-Interscience, New York.

78
Suzuki, K., Y. Tanaka, K. Kuroda, D. Hanajima, and Y. Fukumoto. 2005. Recovery of
phosphorus from swine wastewater through crystallization. Bioresource
Technology 96(14): 1544-1550.
Taylor, A. W., A. W. Frazier and E. L. Gurney. 1963. Solubility products of magnesium
ammonium and magnesium potassium phosphates. Transactions of the Faraday
Society 59: 1580-1584.
Wang, J., J. G. Burken, X. Zhang, and R. Surampalli. 2005. Engineered struvite
precipitation: impacts of component-ion molar ratios and pH. Journal of
Environmental Engineering 131(10): 1433-1440.
Wang, L. and G. H. Nancollas. 2008. Calcium DRPs: crystallization and dissolution.
Chemical Reviews 108(11): 4628-4669.
Zhang, T., K. E. Bowers, J. H. Harrison and S. Chen. 2010. Releasing phosphorus from
calcium for struvite fertilizer production from anaerobically digested dairy
effluent. Water Environment Research 82(1): 34-42.

79
4. THERMAL AND BIOLOGICAL-BASED PRETREATMENT
METHODS FOR PHOSPHORUS RELEASE TO ENHANCE
STRUVITE PRECIPITATION
4.1 INTRODUCTION
One of the challenges to overcome to precipitate struvite in liquid dairy manure is
the low DRP to TP ratio. This chapter focused on DRP release to facilitate struvite
precipitation in dairy manure using thermal and biological-based pretreatment methods.
The thermal method was based on microwave-assisted heating and the biological-based
methods included EBPR and AD.
4.2 OBJECTIVES
The objective of this study was to evaluate the struvite precipitation potential in
liquid dairy manure treated with thermal and biological-based methods (EBPR,
microwave heating and AD).
4.3 MATERIALS AND METHODS
4.3.1 EBPR pretreatment
4.3.1.1 Source and characteristics of EBPR aerated mixed liquor (AML)
The manure used in the EBPR study was collected from the floor of the free stall
barn by scraping, diluted with tap water at a 1:2 ratio (one part manure and one part water)
and ran through a mechanical separator with 3.18 mm screen size openings to remove
solids (Knowlton et al., 2005). The separated liquid manure was further diluted using tap
water before being feed to the reactor. The overall dilution of the manure fed to the
EBPR systems was 1:10.

80
The EBPR was obtained from a pilot-scale EBPR system which has been
operational for three years (Gungor et al., 2009; Hong, 2009). Briefly, two parallel EBPR
systems consisting separate feed tanks, separate fermenters, separate SBRs, and a
common effluent storage tank were used. Manure was fermented in a mixed, semi
continuous-flow mode (Gungor et al 2009) before feeding to the downstream SBR for
EBPR wasting into the effluent storage tanks at the end of the process. The SBR was
operated on an 8-h cycle consisting of four sub cycles. Each sub-cycle had a 2 min
feeding, 40 min anaerobic, and 70 min aerobic phases. The last sub cycle had a 40 min
settling phase in addition to the feed, anaerobic, and aerobic phases in the first three sub-
cycles. At the beginning of each sub-cycle 1.2 L of fermented liquid dairy manure was
fed into SBR. Five minutes before the end of the aeration phase during the fourth sub-
cycle, 1.2 L of the AML in the SBR was pumped from the system (wasted) into the
effluent storage tank. The AML left in the SBR was then allowed to settle for a period of
40 min (aerators and mixers were turned off), before pumping out 3.6 L of the SBR
supernatant (low P content effluent stream) into the effluent storage tank (Hong, 2009).
The AML from the two parallel EBPR systems was collected struvite
precipitation experiments. The chemical characteristics of the AML are presented in
Table 9.

81
Table 9. Characteristics of EBPR AML in this study
Parameter (unit) EBPR effluent
pH 7.92
Total P (mg/L) 137.1
DRP (mg/L) 25.2
TKN (mg/L) 635.1
TAN (mg/L) 110.2
Mg (mg/L) 113.8
Ca (mg/L) 406.8
Na 36.6
K (mg/L) 66.9
S (mg/L) 56.3
Fe (ppm) 17.6
Al (ppm) 15.1
Zn (ppm) 4.2
Cu (ppm) 1.2
Mn (ppm) 4.2
Cl (ppm) 225.0

82
4.3.1.2 EBPR AML preparation
For EBPR to be used as a treatment, it is necessary to release the DRP inside the
PAO back into solution for struvite recovery. This requires the EBPR AML to undergo
an anaerobic storage prior to struvite precipitation. Two experiments were conducted to
investigate the release of DRP from PAO based on (1) time of storage under anaerobic
storage and (2) addition of external carbon source (sodium acetate)
Sodium acetate (NaAc) was used as the external carbon source. Dosages of NaAc
ranging from 0 to 20 mg/mL were applied to AML and allowed to sit anaerobically for 24
hours before measurement of DRP released back in solution. Another test was conducted
to determine the release of DRP over time (storage period of 48 h) under anaerobic
conditions using the optimum NaAc dosage and a control. At the end of each experiment
setting, samples were collected and centrifuged at 10,000 for 15 min, filtered through
0.45 µm filter paper and then analyzed for DRP concentration.
4.3.2 Microwave heating
Microwave heating was conducted in a CEM MARSXpress microwave digestion
system (CEM Corporation, Matthews, NC, USA), delivering approximately 1600 W IEC
of microwave energy at a frequency of 2450 MHz, equipped with a real-time temperature
and pressure control. The system can accommodate up to 40 vessels simultaneously. The
vessel was a CEM Teflon closed vessel with pressure relief device. Each vessel has a
capacity of 75 mL, with the working volume of 30 mL.
Liquid dairy manure (Table 3) was acidified to pH 4 by adding 5 N HCl or 5 N
H2SO4. Raw manure without inorganic acid addition served as control. Thirty (30) mL of
each of the acidified manure and the control was transferred to microwave vessels and

83
then subjected to microwave digestion. The microwave was operated at 100% power of
1200 W under ramp-to-temperature working mode (15 min ramp time, five minute hold
at the designed temperature, and then cooled to room temperature). Microwave heating at
temperatures 60, 90, 120, 150, 170, 200 and 220 °C were tested to investigate the effects
of temperature on microwave-based P solubilization, similar to the series selected by Pan
et al. (2006) and Qureshi et al. (2008). Each run was conducted in triplicate. After each
heating treatment, the vessels were cooled to room temperature and the pH and the DRP
concentration of the digested manure were determined.
4.3.3 Anaerobic digestion
4.3.3.1 Feed characteristics
The anaerobic digester was started up using a mixture of separated flushed dairy
manure and sedimentation tank effluent from the Virginia Tech Dairy Complex with
volume ratio of 1 : 1 (day 1 ~ 3) and 3 : 1 (day 4 ~ 6) and the digester was fed using 100 %
flushed manure from day 7 to day 16. From day 17, feed was the liquid dairy manure
collected from a dairy farm located in Rockingham County, VA and flushed manure as
described earlier. The amount of flush manure in the manure was decreased by 25 %
every 3 days. After 25 days, the feed was 100% dairy manure from the Rockingham dairy.
The characteristics of the dairy manure used in this study are presented in Table 10.

84
Table 10. Anaerobic digestion feed characteristics
Parameter (unit) Substrate
TS (%) 4.09
VS (%) 1.29
pH 7.38
Total P (mg/L) 364.15
DRP (mg/L) 30.67
TKN (mg/L) 2740.51
TAN (mg/L) 1515.12
Mg (mg/L) 639.89
Ca (mg/L) 1461.93
K (mg/L) 1794.71
Na (ppm) 919.56
Total COD (mg/L) 63160
Soluble COD (mg/L) 22787

85
4.3.3.2 Reactor design and setup
A single-stage complete mix reactor (Figure 13) was used in this study. The
digester was 0.25 m in diameter, 0.40 m tall with a 12 L working volume and a 3 L head
space. The digester was made from a schedule 40 PVC pipe capped off the 0.95 cm thick
PVC plates. Two Cole-Parmer pumps (Masterflex, Model 77200-62, Cole Parmer
Instrument Co., Chicago, IL) were used to feed, mix and discharge the reactor contents.
The digester was heated a heating coil (Chromalox company, Richmond, VA) mounted to
the side of the reactor. The digester temperature was controlled at 38 ± 1 °C by a
temperature controller (Model 11-463-47A, Fisher Scientific, Waltham, MA). The
sequence of the operation of the pumps and mixers was controlled by Chrontrol time
controllers (Chrontrol Co., San Diego, CA). The HRT was kept at 20 days and the reactor
was fed and discharged 4 times per day (every 6 hours).
4.3.4 Struvite precipitation
Struvite precipitation from pretreated liquid dairy manure was conducted in batch
following the same procedures as described in 3.2.3. The first set of tests was done using
EBPR sludge + NaAc, EBPR influent, microwave digested manure (MW) + H2SO4, MW
+ HCl, MW without acidification, MW + H2SO4 + oxalic acid, MW + HCl + oxalic acid,
MW + oxalic acid, anaerobic digested manure (AD), AD + oxalic acid. The second set of
tests was performed using the centrate of acidified manure according to the first set. The
purpose of employing the second set was conducted to investigate the effects of
suspended solids on struvite precipitation.

86
Figure 13. Flow diagram of single-stage complete mix digester
Effluent pump Feed pump
effluents
bucket
feed
bucket heater
Temp.
controller

87
The pH of the pretreated manure was decreased to 4.5 by adding 5 N HCl, if
necessary and then the appropriate treatment administrated. The manure was then
centrifuged using an Eppendorf centrifuge (model 5804, Hamburg, Germany) at 10,000
for 15 min. The centrate was transferred to a 250 mL beaker and then struvite
precipitation conducted following the same procedures as described in 3.2.2. All the tests
were done in triplicate.
4.3.5 Sampling and Analytical Methods
Anaerobic digester feed and effluents were sampled twice a week and analyzed
for pH, TS, VS, total COD and soluble COD. The pH was measured using a handheld
meter (Multi 340i, WTW Inc., West Wareham, MA); TS and VS were determined
according to standard methods (APHA, 1995); total COD and soluble COD (filtered
through 0.45 µm filter paper) were analyzed using HACH high range COD digestion
vials (HACH Company, Loveland, CO). The composition of biogas produced was
measured by SRI gas chromatograph (model 8610C) with molecular sieve packed
column and HayeSep D packed column (SRI Company, Torrance, CA, USA) every other
week.
The precipitates were analyzed using SEM at an accelerating voltage of 5 kV
using FEI Quanta 600 FEG environmental scanning electron microscope (FEI Company,
Hillsboro, OR). Simultaneously, solid phase element composition was identified using
Bruker QUANTAX 400 Energy Dispersive X-ray Spectrometer (EDS, Bruker AXS Inc.,
Madison, WI), equipped with a high speed silicon drift detector. EDS was performed at
voltage of 15 kV and a working distance of 11.8 ~ 12.5 mm. XRD analysis was

88
conducted at Crop and Soil Environmental Science Department, Virginia Polytechnic
Institute and State University following the same procedures as described in section 3.2.4.
4.4 RESULTS AND DISCUSSIONS
4.4.1 EBPR P release and struvite precipitation
The DRP release in EBPR AML was shown in Figure 14. With the same storage
time (24 hours), the DRP concentration increased with the increase of NaAc dosage up to
10 mg/mL AML. Beyond 10 mg/mL AML dosage amount, there was minimal increase in
DRP concentration (Figure 14 (a)). Thus, 10 mg NaAc / mL AML was selected as the
dosage for external carbon source amendment. Figure 14 (b) showed the DRP release
with different anaerobic storage time and it was found that “AML only” curve and “AML
+ NaAc” curve had the same increasing tendency: DRP kept increasing from 0 to 24
hours and beyond 24 hours, no significant (P > 0.1) DRP increases were observed. For
“AML only”, the DRP concentration increased 172.8 %, from 13.79 mg/L at 0 hours to
37.61 mg/L at 24 hours; for “AML + NaAc”, the DRP concentration increased 252.1 %,
from 13.79 mg/L at 0 hours to 48.54 mg/L at 24 hours. Additionally, the DRP release was
significantly different (P < 0.05) between “AML only” and “AML + NaAc”, indicating
the positive effects of external carbon resource on DRP release in EBPR AML.

89
Figure 14. The effects of (a) NaAc amendment dosage and (b) anaerobic storage time on
P release in EBPR AML
20.0
25.0
30.0
35.0
40.0
45.0
0 5 10 15 20
DR
P (
mg
/L)
NaAc amendment dosage (mg/mL AML)
(a)
0.0
10.0
20.0
30.0
40.0
50.0
60.0
0 6 12 18 24 30 36 42 48
DR
P (
mg
/L)
Anaerobic storage time (hours)
(b)
AML only
AML+NaAc (10 mg/mL AML)

90
As shown in Table 11, DRP reductions (43.8 ~ 69.4 %) were achieved in all the
treatments after precipitation process, although removal efficiencies varied in different
manure medium. It was apparent that Ca2+
availability was increased by about 50 %
while Mg2+
concentration only 11 % in EBPR AML, based on values measured in EBPR
feed. Moreover, NH4-N removals were observed in all the treatments, which could be
attributed to struvite precipitation and/or volatilization losses. Mg2+
reductions were
relatively low (<10 %) in the solutions compared to Ca2+
reductions, indicating that at
least magnesium phosphate (including struvite) was not the dominant solid phase of the
precipitates in EBPR AML.
4.4.2 Precipitates characteristics from EBPR treated manure
Energy dispersive X-ray spectroscopic analyses of solids precipitated from
different EBPR mediums were listed in Table 12 and Figure 15. As indicated in chemical
analysis (section 4.4.1), Mg phosphate did not appear in any precipitation medium as the
dominant solid phase. Instead, calcium was detected as the major elemental composition
consisting of almost all the precipitates except for non-centrifuged influents sample.
Phosphorus (P), oxygen (O) and calcium (Ca) appeared to be the main elemental
presence in the solids precipitated from centrifuged set and P to O molar ratios (>4)
implied that other solid phases existed in the precipitates besides calcium phosphate.

91
Table 11. Compositions of EBPR feed and AML before and after struvite precipitation
(C-AML, centrifuged AML; NC-AML, non-centrifuged AML; C-Feed, centrifuged feed;
NC-Feed, centrifuged feed)
Parameters C-AML (before)
(mg/L)
C-AML (after)
(mg/L)
NC-AML (before)
(mg/L)
NC-AML (after)
(mg/L)
DRP 58.72 17.97 59.52 28.76
TAN 131.59 113.83 140.20 119.83
Mg2+
111.44 105.45 112.64 109.05
Ca2+
375.07 268.42 389.45 294.78
K+ 131.25 136.22 132.24 150.14
pH 4.0 8.0 4.0 8.0
Parameters C-Feed (before)
(mg/L)
C-Feed (after)
(mg/L)
NC-Feed (before)
(mg/L)
NC-Feed (after)
(mg/L)
DRP 37.15 13.18 38.35 21.57
TAN 134.35 86.05 131.42 109.86
Mg2+
99.46 89.87 101.86 97.06
Ca2+
244.45 204.91 263.63 232.47
K+ 109.37 129.26 115.34 133.24
pH 4.0 8.0 4.0 8.0

92
Table 12. Energy dispersive X-ray spectra analysis results of precipitated solids from
different EBPR mediums
EBPR
manure
Point P
(mass %)
O
(mass %)
Mg
(mass %)
Ca
(mass %)
C - AML
1 11.21 38.82 1.59 18.05
2 11.69 34.74 1.30 19.35
3 10.96 31.60 1.04 20.38
4 11.38 47.44 2.04 17.34
NC - AML
1 0 41.07 0 0.78
2 0 34.79 0.69 1.40
3 1.92 43.56 0.53 1.21
4 0 51.97 1.10 21.95
Feed - C
1 24.13 56.18 18.77 0.59
2 12.41 42.42 2.44 17.63
3 12.36 45.18 3.03 19.02
4 13.30 34.08 2.16 20.79
Feed - NC
1 0 25.95 0.90 1.52
2 3.20 47.48 3.12 5.05
3 2.21 46.03 1.33 2.09
4 0 7.63 0.10 1.01

93
Figure 15. Energy dispersive X-ray mapping analysis of precipitated solids from different EBPR mediums: (a1) C - AML; (a2) NC -
AML; (b1) C - Feed; (b2) NC - Feed.
(a1) (a2)
(b1) (b2)

94
The SEM images and XRD patterns results are shown in Figure 16 ~ 18. Hardly
any crystals were observed in SEM image of centrifuged EBPR AML (Figure 16 (a)) and
the corresponding XRD diffractograms (Figure 16 (b)) did not match with standard
struvite diffraction patterns. The precipitates were heterogeneous, consisting of various
solid phase including calcite (CaCO3), huntite (CaMg3(CO3)4), quartz (SiO2), brushite
(CaHPO4·2H2O) and newberyite (MgHPO4·3H2O), compared with JCPDF library
database (ICDD, International Center for Diffraction Data). In contrast, orthorhombic Mg
phosphate crystalline (Figure 17) was found in SEM image although it was surrounded
by amorphous precipitates and EDS analysis showed an approximate 1:1:4.5 molar ratio
of Mg:P:O, with a mass composition of 24.13 % P, 18.77 % Mg, 56.18 % O and 0.59 %
Ca. This difference in the potential to produce Mg phosphate from EBPR AML and feed
can be probably explained by the varying Ca2+
/DRP and/or Ca2+
/Mg2+
molar ratios
(Table 11); the Ca2+
/Mg2+
molar ratio of EBPR AML (2.02) was higher than that of
EBPR feed (1.47) and therefore Mg phosphate formation was more suppressed by high
Ca2+
in the solution. The SEM images for non-centrifuged (NC) set (Figure 18 (a); (c))
exhibited amorphous structure, coupled with EDS results showing elemental
compositions were 17.97 % C, 43.56 % O and 30.84 % Si and small amounts of Ca, Na
and Cl, indicating high strengths of organic matters and suspended solids like quartz in
the precipitation system.

95
Figure 16. SEM image and (b) XRD patterns of precipitated solids from centrifuged
EBPR AML
0
1000
2000
3000
4000
5000
6000
7000
8000
10 15 20 25 30 35 40 45 50 55 60
Inte
nsi
ty (
cps)
2-theta (°)
(b)
Hu
nti
te
(a)
Qu
art
z
New
bery
ite
Calc
ite
Calc
ite
Bru
sh
ite

96
Figure 17. SEM images of precipitated solids from centrifuged EBPR feed; the EDS
analysis output an approximate 1:1:4.5 molar ratio of Mg:P:O for focused orthorhombic
crystal , with a mass composition of 24.13 % P, 18.77 % Mg, 56.18 % O and 0.59 % Ca

97
Figure 18. SEM image and (b) XRD patterns of non-centrifuged EBPR AML; (c) SEM image and (d) XRD patterns of non-
centrifuged EBPR feed
0
200
400
600
800
1000
10 15 20 25 30 35 40 45 50 55 60
Inte
nsi
ty (
cps)
2-theta (°)
(b)
0
200
400
600
800
1000
10 15 20 25 30 35 40 45 50 55 60
Inte
nsi
ty (
cps)
2-theta (°)
(d)
Hu
nti
te (a)
Hu
nti
te (c)
New
bery
ite
Bru
sh
ite
Calc
ite
New
bery
ite
Bru
sh
ite
Calc
ite

98
4.4.3 Microwave P solubilization and struvite precipitation
Figure 19 (a) showed the DRP concentrations of microwave-digested dairy
manure at varying heating temperatures and the first data point of each curve (at 25 °C)
was the DRP concentration of manure pretreated with administrated acidification
treatment (using HCl or H2SO4 to pH, and the control) prior to microwave heating.
Acidification pretreatment facilitated P solubilization in liquid dairy manure but the
results were different for HCl and H2SO4. For HCl acidification, the DRP concentration
kept a slight increasing trend with heating temperature raised from 60 °C to 150 °C;
however, it plunged to 175.56 (± 5.18) mg/L at 170 °C from peak value 297.60 (±2.35)
mg/L obtained at 150 °C and DRP concentration remained constant at temperature higher
than 170 °C. For manure acidified with H2SO4, its DRP concentration decreased from
60 °C to 120 °C but increased to a large extent as the heating temperature increased from
120 °C to 170 °C. There was not significant DRP increase at temperature higher than
170 °C. In contrast, there was apparent DRP decrease occurred instead of increase in
manure without acidification treatment. This was consistent with what was observed by
Pan et al (2006); however, it could not be demonstrated that there was no P solubilization
occurring in the manure treated with only microwave radiation. The pH of manure in
“microwave only” series was measured (Figure 19 (b)) and it showed that pH increased
with the increase of microwave heating temperature. Hence, it was probable that DRO
was released from manure without acidification pretreatment after being microwave
digested but precipitated as Ca- and/or Mg-bounded phosphate solids immediately; since
Ca2+
and/or Mg2+
was sufficient in manure solution, Mg- or Ca-phosphate precipitation
occurs easily at pH higher than 8.
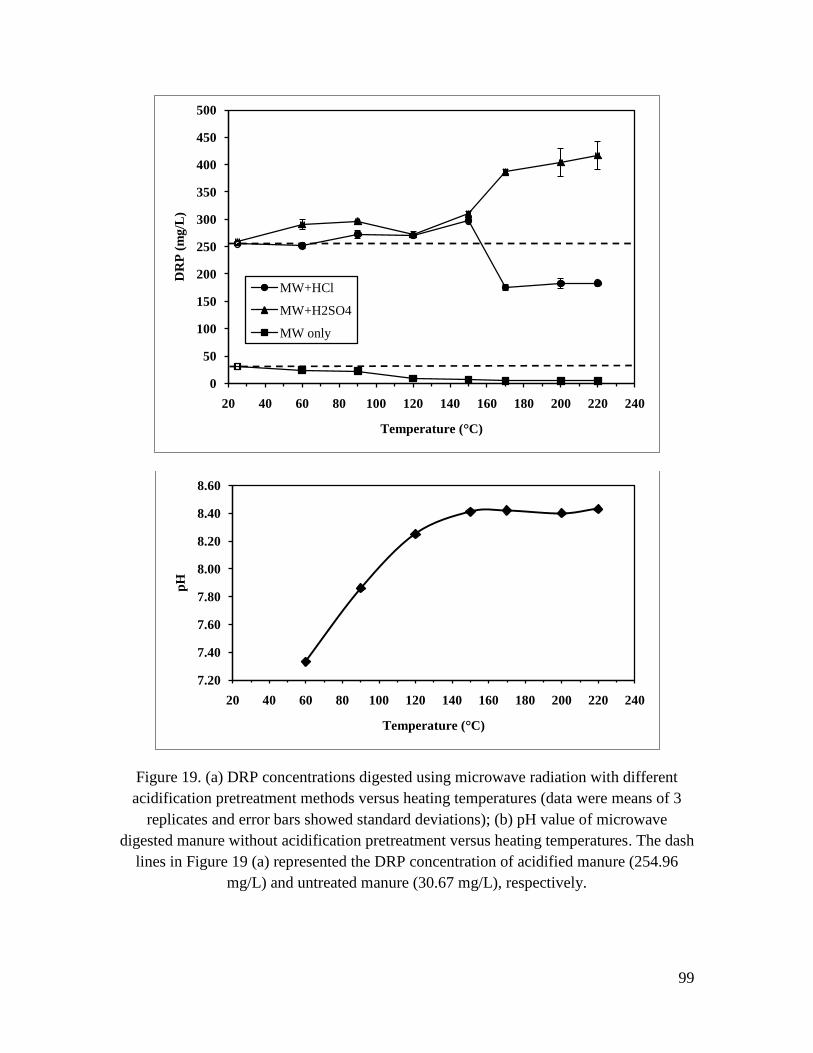
99
Figure 19. (a) DRP concentrations digested using microwave radiation with different
acidification pretreatment methods versus heating temperatures (data were means of 3
replicates and error bars showed standard deviations); (b) pH value of microwave
digested manure without acidification pretreatment versus heating temperatures. The dash
lines in Figure 19 (a) represented the DRP concentration of acidified manure (254.96
mg/L) and untreated manure (30.67 mg/L), respectively.
0
50
100
150
200
250
300
350
400
450
500
20 40 60 80 100 120 140 160 180 200 220 240
DR
P (
mg
/L)
Temperature (°C)
MW+HCl
MW+H2SO4
MW only
7.20
7.40
7.60
7.80
8.00
8.20
8.40
8.60
20 40 60 80 100 120 140 160 180 200 220 240
pH
Temperature (°C)

100
For manure pretreated with H2SO4, microwave digestion at 170 °C resulted in
highest P solubilization; for HCl acidification pretreatment, highest P release yield
occurred at 150 °C. Therefore, the manure treated with the two pretreatment methods was
selected for further struvite precipitation.
The DRP/TP ratio was increased from 6.7 % to 55.4 % by acidification only in
room temperature and further increased to 84.1 % (MW+H2SO4, 170 °C) and 67.4 %
(MW+HCl, 150 °C) respectively. Therefore, acidification contributed to the major part of
DRP increase in dairy manure. Microwave digestion only made contribution to DRP
increase at 150 °C (HCl) or 170 °C (H2SO4). This increase might be partly attributed to
microwave converting part of organic P to DRP.
In addition, there was significant difference (P < 0.05) between the DRP
concentration of MW+H2SO4 and that of MW+HCl at 150 °C or higher temperatures.
This could possibly attribute to the interactions occurring between the ions (SO42-
and Cl-)
and organic P forms of the liquid dairy manure. The presence of SO42-
might facilitate the
P solubilization. The polar substances in the dairy manure were heated more rapidly than
non-polar substances (de la Hoz et al., 2005), resulting in “explosion” effect, which
accelerated the disruption of organic P complexes (i.e. soluble organic P, lipid-P, nucleic
acid-type-P). Hence, presence of SO42-
might have positive impact on the degraded P
substances, improving their conversion to DRP. Also, the acid loading might impose
effects on the DRP release process, depending on the type of inorganic acid used in the
acidification pretreatment prior to the microwave heating. Since the normality was
identical for both H2SO4 and HCl (5 N) to reach the goal of pH 4, the acid loading was

101
supposed to be the same. However, such loading rate might be optimal for H2SO4 at
170 °C, while not the best for HCl.
4.4.4 Precipitates characteristics (microwave treatment)
SEM-EDS analyses of solids precipitated from microwave digested manure with
different acidification pretreatments were presented in Table 13, Figure 20 and Figure 21.
Among the centrifuged set, Ca, P and O were the major elements found in microwave
digested (MW) manure with HCl acidification pretreatment and control, probably
resulting from the high Ca2+
availability caused by microwave digestion (Qureshi et al.,
2008); Mg presented only as one of the minor composition in the precipitates. In contrast,
Mg phosphate solid phase was found as the dominant solid phase in MW manure
pretreated with H2SO4 acidification, where the randomly selected 3 points element
analysis results showed an average Mg : P : O molar ratio of 1 : 1.2 : 4.5 (Table 13;
Figure 20 (a1)). These Mg phosphates may be struvite based on their dendritic and rod-
like (Figure 21 (a1)) morphology (Babic-Ivanic et al., 2002), even though this was not
confirmed by the EDS examination. Additionally, heterogeneous poorly-crystalline
materials were found in the precipitates as the minor solid phase, with a mass
composition of 8.70 % Ca, 14.75 % Na, 15.01 % S and 46.95 %. Hence, H2SO4 addition
was demonstrated to suppress the negative effects of Ca2+
on struvite formation, although
we could not determine whether it was the individual SO42-
effect or the interactive
effects of SO42-
and other components (e.g. organic ligands and macroelements like Na+
and K+) due to the complex composition of dairy manure, since the microwave digestion
was found to facilitate nutrients (N and P) release (Qureshi et al., 2008) and COD
solubilization (Jin et al., 2009) in dairy manure. However, such Ca2+
mitigation effect

102
was not observed in either MW manure or MW+HCl manure (Figure 20 (b1), (c1);
Figure 21 (b1), (c1)). Similar to many experimental runs, no struvite-like crystals were
found among the non-centrifuged MW manure, regardless of acidification pretreatment
(Figure 20 (a2), (b2), (c2)). EDS results showed that C, O and Si were the general
element compositions in the solids precipitated in non-centrifuged manure, in spite of the
TSS reduction resulted from the microwave digestion. For example, TSS concentration of
H2SO4 acidified manure was decreased from 2.15 % to 1.01 % after being subjected to
microwave digestion at 170 °C for 5 min, but complex TSS compositions like organic
ligands and quartz still interfered with struvite formation in manure. As for the MW
manure treated with oxalic acid to minimize the Ca2+
inhibition prior to struvite
precipitation, the element compositions were Mg, P and O, with traces of Ca, Na and K,
where the Mg : P : O molar ratios indicated Mg phosphate as the dominant solid phase. It
was noticed that dendritic and leaf-like Mg phosphate crystalline partially covered with
small rhombohedral crystal consisting of Ca and O (shown in yellow spots in Figure 20
(a3), (b3) and (c3)) were the main structural characteristics of the precipitates. Specially,
crystals precipitated from MW+H2SO4 manure pretreated with oxalic acid had a
crystalline, large and homogeneous nature (Figure 21 (b1)), different from those from
MW+HCl or MW control, which were generally very small in nature (Figure 21 (b2),
(b3)).

103
Table 13. EDS analysis results of precipitated solids from microwave digested (MW)
manure
MW manure Point
P
(mass %)
O
(mass %)
Mg
(mass %)
Ca
(mass %)
H2SO4 - C
1 22.85 49.43 16.49 0.12
2 26.00 52.72 16.54 0.11
3 27.56 51.34 17.76 0.13
4 2.97 46.95 2.67 8.70
H2SO4 - NC
1 1.05 28.58 0.01 2.00
2 1.52 51.60 0.92 3.28
3 1.58 55.67 0.69 1.93
4 1.28 33.50 0.23 3.79
H2SO4 - C+OX
1 22.46 44.16 14.29 0
2 22.00 44.95 13.49 0
3 22.78 52.87 15.66 0
4 15.50 55.33 11.53 10.48
HCl - C
1 12.44 44.77 2.94 19.63
2 6.71 35.55 1.59 15.77
3 20.88 53.75 15.61 1.37
4 11.31 23.87 1.54 19.82
HCl - NC
1 2.95 33.20 0.02 6.63
2 2.46 43.36 0.17 3.40
3 2.10 36.04 1.02 5.67
4 1.99 47.57 1.23 2.76
HCl – C+OX
1 23.54 55.26 18.42 0
2 19.86 50.85 15.28 0
3 20.26 44.74 13.62 0
4 21.45 61.01 18.00 0
control - C
1 12.55 31.90 1.77 23.50
2 8.66 22.48 0.09 21.62
3 9.84 7.11 0 28.80
4 11.15 46.11 3.59 20.90
control - NC
1 3.14 48.62 0.72 8.88
2 1.35 44.32 2.85 3.86
3 6.91 43.67 3.75 13.73
4 3.71 50.48 1.62 7.95
control – C+OX
1 23.71 54.77 17.80 0.34
2 22.66 49.11 15.36 0.32
3 5.62 60.22 4.72 23.16
4 25.19 52.31 18.77 0.61

104
Figure 20. Energy dispersive X-ray mapping analysis output of microwave digested manure with varying acidification pretreatments:
(a1) H2SO4 (centrifuged); (a2) H2SO4 (non-centrifuged); (a3) H2SO4+oxalic acid (centrifuged); (b1) HCl (centrifuged); (b2) HCl (non-
centrifuged); (b3) HCl+oxalic acid (centrifuged); (c1) control (centrifuged); (c2) control (non-centrifuged); (c3) control+oxalic acid
(centrifuged)
(a1) (a2) (a3)
(b1) (b2) (b3)
(c1) (c2) (c3)

105
Figure 21. Scanning electron micrographs of solids precipitated from MW manure with
pretreatment of (a1) H2SO4 (centrifuged); (a2) H2SO4+oxalic acid (centrifuged); (b1) HCl
(centrifuged); (b2) HCl+oxalic acid (centrifuged); (c1) control (centrifuged); (c2) control+oxalic
acid (centrifuged)
(a1) (a2)
(b1) (b2)
(c1) (c2)

106
XRD analyses were conducted to further identify the structural characteristics of these
materials precipitated from MW manure, shown in Figure 22 to 24. The diffractogram of the
materials precipitated from MW manure with H2SO4 pretreatment matched well with standard
struvite (Figure 22 (a)), confirming the presence of struvite crystalline as the dominant solid
phase (Figure 20 (a1)). This indicated that the presence of SO42-
might mitigate the inhibition of
Ca2+
on struvite formation, possibly resulting from the Ca2+
capture by SO42-
. However,
precipitates obtained from MW+H2SO4 manure with oxalic acid pretreatment were
heterogeneous, a mixture of struvite, newberyite and magnesite (Figure 22 (b)). This discrepancy
is attributed to (1) the possible suppression from SO42-
to inhibit struvite formation; (2) the
probable ammonia losses due to volatilization and (3) the high alkalinity inducing the co-
precipitation of MgCO3.
No struvite crystals were observed in MW+HCl or MW without acidification manure
(Figure 23 (a) and Figure 24 (a)). With the oxalic acid amendment, the diffractograms of the
materials from MW+HCl and MW without acidification manure match perfectly with the struvite
standard (Figure 23 (b) and Figure 24 (b)). Therefore, although microwave digestion plus HCl
acidification contributed to the DRP release in dairy manure (Figure 19 (a)), this pretreatment
could not effectively enhance struvite precipitation in dairy manure with high Ca concentration.

107
Figure 22. X-ray diffractograms of materials precipitated from MW manure pretreated with (a)
H2SO4 (centrifuged); (b) H2SO4+oxalic acid (centrifuged). Blue lines represented standard
struvite crystals (JCPDF-2 # 71-2089)
(a)
(b)
New
bery
ite
Mag
nesit
e
Str
uvit
e
Str
uvit
e
Str
uvit
e

108
Figure 23. X-ray diffractograms of materials precipitated from MW manure pretreated with (a)
HCl (centrifuged); (b) HCl+oxalic acid (centrifuged). Blue line represented standard struvite
crystals (JCPDF-2 # 71-2089)
(b)
(a)
Bru
sh
ite
Calc
ite
Hyd
roxy
lap
ati
te

109
Figure 24. X-ray diffractograms of materials precipitated from MW manure (a) without
acidification pretreatment; (b) with oxalic acid pretreatment. Blue line represented standard
struvite crystals (JCPDF-2 # 71-2089)
(b)
(a)
Hyd
roxy
lap
ati
te

110
4.4.5 Anaerobic digestion performance
The characteristics of AD influents and effluents were shown in Table 14. As expected,
TS and VS destructions were observed in anaerobically digested manure. The DRP concentration
was increased, indicating some P conversion occurring from poly-P and/or organic P to DRP.
The reduction in NH4-N concentration may be indicative of NH3 volatilization occurring from
the digested manure; this was expected due to the initial high NH4-N concentration, which would
result in high volatilization rates (Brunke et al., 1988). On the other hand, decrease in organic N
(29.8 %) indicated the N solubilization achieved by AD treatment. Slight mass losses were
observed in total Mg, Ca, Na and K, but the molar ratio of Ca/Mg was the same before and after
AD treatment. Although the Mg2+
availability was not evaluated in this study, it has been
reported that AD treatment contributed to increase in available Mg2+
in livestock manure
(Buchanan, J., 1993; Moody et al., 2009). However, calcium effects were not taken into accounts
in these studies. Since the Ca/Mg of the undigested manure in this case was high to produce
negative effects on struvite formation, it was expected at the first place that struvite precipitation
would not be enhanced by anaerobic digestion.

111
Table 14. Characteristics of AD influents and effluents
Parameter (unit) Influent Effluent
TS (%) 3.98 2.58
VS (%) 1.21 0.87
pH 7.43 7.25
Total COD (mg/L) 59220 42080
Soluble COD (mg/L) 22437 18453
Total P (mg/L) 364.2 296.1
DRP (mg/L) 30.7 55.0
Organic N (mg/L) 1310.9 920.3
TAN (mg/L) 1429.6 1300.2
Mg (mg/L) 639.9 536.8
Ca (mg/L) 1461.9 1239.0
Na (mg/L) 919.6 769.7
K (mg/L) 1794.7 1737.0

112
4.4.6 Precipitates characteristics (anaerobic digestion)
SEM-EDS analysis results of the solids precipitated from anaerobically digested and raw
manure were shown in Table 15 and Figure 25. No evidence of crystalline materials were found
in anaerobically digested manure; in centrifuged sample, irregular-shaped solids and ball-like
materials with smooth surface were found to be the dominant compositions (Figure 25 (a1)),
while for the non-centrifuged sample, SEM imaging yielded a mixture of organic ligands with C
and O as the major elements (non shown) and irregular-shaped solids (Figure 25 (a2)), which
were quite similar to what was observed (Figure 25 (b2)) in raw manure (non-centrifuged). In
contrast, crystals were observed in the materials precipitated from anaerobically digested manure
pretreated with oxalic acid, with blocky crystalline features (Figure 25 (a3)), and other particles
had the same rhombohedral crystal as what was observed in microwave set (section 4.4.4), with
Ca and O as the major element composition. EDS results showed a Ca : C : O molar ratio of
approximate 1.2 : 1 : 5.
XRD analyses were conducted to further confirm whether struvite precipitation was
enhanced by anaerobic digestion, shown in Figure 26. Apparently, struvite crystals only
precipitated in the anaerobically digested manure pretreated with oxalic acid (Figure 26 (b)),
while heterogeneous phased crystalline solids (not struvite) were found (Figure 26 (a)). XRD
patterns indicated that the material was a mixture of calcite and hydroxyapatite. Hence, the high
Ca/Mg molar ratio (1.38) inhibited the struvite formation in anaerobically digested manure, even
though the DRP availability was increased.

113
Table 15. EDS analysis for precipitated solids from raw and anaerobically digested manure
Manure Point
P
(mass %)
O
(mass %)
Mg
(mass %)
Ca
(mass %)
Digested - C
1 5.49 47.45 3.25 27.24
2 9.42 47.18 3.14 19.37
3 9.58 45.61 3.10 15.81
4 10.52 44.48 4.07 20.40
Digested - NC
1 2.19 43.46 0.90 2.87
2 1.89 25.68 0.88 33.84
3 3.10 55.56 3.67 23.08
4 2.81 39.06 0.05 4.60
Digested - C+OX
1 24.40 52.16 18.08 0.99
2 22.58 52.62 16.95 0.64
3 1.58 53.82 0.58 33.28
4 2.84 51.35 1.19 38.60
Raw - C
1 6.03 10.85 1.02 13.50
2 2.62 16.81 1.78 2.41
3 4.63 8.63 0.68 5.66
4 0 3.49 0 0
Raw - NC
1 2.33 45.99 2.95 3.20
2 0 45.69 3.23 3.22
3 4.48 38.81 1.48 4.90
4 4.04 46.40 2.03 6.82

114
Figure 25. Scanning electron micrographs of solids precipitated from (a1) anaerobically digested
manure (centrifuged); (a2) anaerobically digested manure (non-centrifuged); (a3) anaerobically
digested manure pretreated with oxalic acid (centrifuged); (b1) raw manure (centrifuged); (b2)
raw manure (non-centrifuged)
(a1) (a2)
(a3)
(b1) (b2)

115
Figure 26. X-ray diffractograms of materials precipitated from (a) anaerobically digested manure;
(b) anaerobically digested manure pretreated with oxalic acid. Blue line represented standard
struvite crystals (JCPDF-2 # 71-2089)
Calc
ite
Calc
ite
Calc
ite
Hyd
roxy
ap
ati
te

116
4.4.7 TSS effects
Table 4.8 showed the TS and TSS concentrations of dairy manure under different
pretreatments. The non-centrifuged manure contained significantly higher TS and TSS than those
of the centrifuged manure, regardless of pretreatment methods. This provided evidence that
suspended solids (including particle fines and organic matter) interfered struvite precipitation, as
discussed in 3.3.3, which also explains why no crystal minerals but fibers and irregular-shaped
particles (probably the mixture of organic matter and minerals) were found in SEM-EDS
imaging results (pictures not included). On the other hand, struvite, magnesium phosphate,
and/or other amorphous precipitate (possibly calcium phosphate) were observed in centrifuged
sets, where in low calcium manure (those with oxalic acid amendment), pure struvite crystals
were found.

117
Table 16. TS and TSS concentrations of different dairy manure
Acidified dairy manure (pH 4) TS (unit) TSS (unit)
Centrifuged untreated 2.3 % 0.4 %
Untreated 4.2 % 2.2 %
Centrifuged EBPR sludge 0.3 % 1580 mg/L
EBPR sludge 3.3 % 2.4 %
Centrifuged microwave digested (MW) +H2SO4 manure 392 mg/L 86 mg/L
MW + H2SO4 manure 4.2 % 1.2 %
Centrifuged MW + HCl manure 438 mg/L 103 mg/L
MW + HCl manure 4.2 % 1.2 %
Centrifuged MW manure 987 mg/L 374 mg/L
MW manure 4.2 % 1.4 %
Centrifuged anaerobically digested manure 1.5 % 0.2 %
Anaerobically digested manure 3.0 % 1.9 %

118
4.5 CONCLUSIONS
No struvite crystals were found in EBPR effluents due to the high Ca2+
to Mg2+
molar
ratio.
No struvite crystals were found in AD effluents but large amounts of struvite with high
purity were observed to precipitate in AD effluents pretreated with oxalic acid to remove
the Ca2+
interference.
Acidification pretreatment affected struvite precipitation potential in microwave digested
manure: struvite crystals were found as the dominant solid phase in microwave digested
manure (MW manure) with H2SO4 acidification. However, presence of struvite was not
found in MW manure pretreated with HCl acidification or MW manure without
acidification.
TSS has a significant effect on struvite precipitation. No struvite or other types of crystals
were found in non centrifuged manure (containing high TS and TSS).

119
REFERENCES
Babic-Ivancic, V., J. Kontrec, D. Kralj and L. Brecevic. 2002. Precipitation diagrams of struvite
and dissolution kinetics of different struvite morphologies. Croatica Chemica ACTA
75(1): 89-106
De la Hoz, A., A. Diaz-Ortiz and A. Moreno. 2005. Microwaves in organic synthesis. Thermal
and non-thermal microwave effects. Chemical Society Reviews 34(2): 164-178.
Gungor, K., M. B., Muftugil, J. A. Ogejo, K. F. Knowlton and N. G. Love. 2009.
Prefermentation of liquid dairy manure to support biological nutrient removal.
Bioresource Technology 100(7): 2124-2129.
Hong, Y. 2009. Enhanced Biological Phosphorus Removal for Liquid Dairy Manure. M. S.
Thesis. Virginia Polytechnic Institute and State University, Blacksburg, VA.
Jin, Y., Z. Hu, and Z. Wen. 2009. Enhancing anaerobic digestibility and phosphorus recovery of
dairy manure through microwave-based thermochemical pretreatment. Water Research
43(14): 3493-3502.
Knowlton, K. F., N. G. Love and C. M. Parsons. 2005. Dietary phosphorus effects on
characteristics of mechanically separated dairy manure. Transactions of the ASAE 48(3):
1253-1258.
Pan, S., K. V. Lo., P. Liao and H. Schreier. 2006. Microwave pretreatment for enhancement of
phosphorus release from dairy manure. Journal of Environmental Science and Health Part
B 41(4): 451-458.
Qureshi, A., K. V. Lo, and P. Liao. 2008. Microwave treatment and struvite recovery potential of
dairy manure. Journal of Environmental Science and Health Part B - Pesticides Food
Contaminants and Agricultural Wastes 43(4): 350-357.

120
Srida, V. 1998. Microwave radiation as a catalyst for chemical reactions. Current Science 74(5):
446-450.

121
5. ECONOMIC EVALUATION OF DIFFERENT PRETREATMENT
METHODS TO ENHANCE STRUVITE PRECIPITATION IN LIQUID
DAIRY MANURE
5.1 INTRODUCTION
Different pretreatment methods enhanced struvite precipitation in liquid dairy manure by
increasing DRP availability and/or mitigating Ca2+
interference. Therefore, it is necessary to
conduct pretreatment costs analysis because (1) the amounts of struvite production varied among
manure with different pretreatment methods and (2) the chemical cost of each pretreatment was
different.
5.2 OBJECTIVE
The objective was to assess the chemical costs of P recovery from liquid dairy manure
with different pretreatment methods.
5.3 MATERIALS AND METHODS
Three pretreatment methods, untreated manure + oxalic acid (RM+OX), anaerobically
digested manure + oxalic acid (AD+OX), and microwave digested manure pretreated with
H2SO4 acidification (MW+H2SO4), were selected for a partial cost analysis based on chemical
dosing and processes shown in Figure 27 Visual Minteq 2.61 modeling was used to estimate the
amounts of struvite precipitated pretreated manure and using similar procedure described in
section 3.1. Model inputs are listed in Table 17 and pH was fixed at 8 for struvite recovery.

122
Figure 27. Schematic process of enhanced struvite precipitation with different pretreatment methods
Raw manure
3 mL 5N HCl/100
mL manure
Centrifuge, take centrate
460.5 mg H2C2O4·2H2O
/100 mL manure
Settle,
take supernatant
6 mL 5N NaOH
/100 mL manure
Struvite
Anaerobically
digested manure
3 mL 5N HCl/100
mL manure
Centrifuge, take centrate
390.3 mg H2C2O4·2H2O
/100 mL manure
Settle,
take supernatant
6 mL 5N NaOH
/100 mL manure
Struvite
Microwave digestion (170 °C)
Centrifuge, take centrate
6 mL 5N NaOH
/100 mL manure
Struvite
Raw manure
3 mL 5N H2SO4
/100 mL manure

123
Table 17. Visual Minteq inputs for different pretreated manure
Inputs (mg/L) RW+OX AD+OX MW+H2SO4
PO43-
781.3 878 1186
NH4+ 1838 1671.6 1838
Mg2+
639.9 536.8 639.9
Ca2+
71.3 68.5 1461.9
K+ 1794.7 1737 1794.7
Na+ 919.6 769.7 919.6
SO42-
733.4 596.8 20,000
CO32-
2200 2800 2200
Cl- 1434 1111 1434

124
A simple partial economic analysis was conducted based on the current market price of
chemicals added to enhance struvite precipitation, while capital costs (e.g. anaerobic digestion
building, centrifuge and microwave heater) and other operating costs such as labor, were not
included in this study. The chemical costs were presented based on their market prices by Fisher
Scientific. The annual dairy manure production calculation was based on a dairy farm with 200
cows, excreting 68 L manure per day per animal (ASABE, 2005).
5.4 RESULTS AND DISCUSSIONS
Table 18 showed the quantities of struvite produced from liquid dairy manure with
different pretreatment methods and the recovery efficiencies were calculated according to the
equation below. The higher recovery efficiencies achieved in AD+OX and MW+H2SO4 runs
partially attributed to the initial higher DRP concentrations (Table 17), compared to that of
untreated manure.
Chemical costs analysis and struvite recovery production quantities were summarized in
Table 19 and 20 The microwave digested manure with H2SO4 acidification pretreatment
produced the highest quantities of struvite out of the 3 pretreatments, with the lowest chemical
costs. However, since this study only focused on chemical addition costs, we could not conclude
that this pretreatment was optimum to recover struvite in field application on full scale, because
apparently the capital investment of microwave heating might be higher other pretreatments
considered. Additionally, just struvite quantities could not account for the profit that the dairy

125
farm made from struvite fertilizer production, the transportation fee (0.08 cents/liter per 20 miles)
should also be included when applied to practice.

126
Table 18. Quantities of struvite recovered from manure subjected to different pretreatment
methods by Visual Minteq 2.61.
Pretreatment Struvite amounts
(mg/L)
Recovery efficiency
(%)
RM+OX 1977.1 68.7
AD+OX 2196.7 76.3
MW+H2SO4 2960.1 80.9
Table 19. Chemical costs analysis for struvite recovery from manure with different pretreatments
Pretreatment Chemical
added
Dosage
(per liter
manure)
Unit cost Chemical cost
($/L manure)
RW+OX
36.5-38 % HCl
(~12 N) 12.5 mL $ 96.87/2.5 L 0.484
H2C2O4·2H2O
powders 4605 mg $ 318.4/5 kg 0.293
NaOH pellets 12 g $ 277.9/10 kg 0.333
AD+OX
36.5-38 % HCl
(~12 N) 12.5 mL $ 96.87/2.5 L 0.484
H2C2O4·2H2O
powders 3903 mg $ 318.4/5 kg 0.249
NaOH pellets 12 g $ 277.9/10 kg 0.333
MW+H2SO4
98 % H2SO4
(~ 36 N) 4.17 mL $ 97.13/2.5 L 0.162
NaOH pellets 12 g $ 277.9/10 kg 0.333
Table 20. Annual chemical costs of struvite recovery and corresponding struvite productions for
a typical dairy farm (200 cows with 68 L manure/day·animal)
Pretreatment Chemical costs
($/L manure)
Struvite production
(kg/year·farm)
RW+OX 1.110 9,819
AD+OX 1.066 10.906
MW+H2SO4 0.495 14,693

127
5.5 CONCLUSIONS
Microwave digested manure pretreated with H2SO4 produced the highest struvite
quantities among the 3 pretreatment methods to enhance struvite recovery, also with the
lowest chemical addition costs.
REFERENCES
ASABE. 2005. Manure characteristics. American Society of Agricultural and Biological
Engineers (ASABE) Standard D384.2. St. Joseph, Mich.