investigating influences in idaho stem education
TRANSCRIPT

Investigating Influences in Idaho STEM Education
Co-PIs Cori Mantle-Bromley, Dean, College of Education
Melinda Hamilton, Director, STEM Education

∗ STEM fields stand at the center of virtually all global conditions in the 21st century.
∗ At the same time, however, national- and state-level student interest and performance in STEM education is insufficient.
∗ Little research to date has investigated the complex factors that shape STEM attitudes, interest, and performance in Idaho.
Background

Project Goals
To investigate the complexity of cultural dimensions that shape STEM educational outcomes with a focus on local contexts, as well as state-level patterns, in Idaho.
To collect data which can inform policy makers, educators, and other stakeholders when STEM education interventions and legislation are considered, developed and implemented.

Bancroft (Caribou Co.)
Boise (Ada Co.)
Fairfield (Camas Co.)
Idaho Falls (Bonneville Co.)
Jerome (Jerome Co.)
Kamiah (Lewis Co.)
Lewiston (Nez Perce, Co.)
Melba (Canyon Co.)
Mud Lake/Terreton (Jefferson Co.)
Pocatello (Bannock Co.)
Post Falls (Kootenai Co.)
Priest River (Bonner Co.)
The Twelve Communities

Year 1 • Thirty-nine focus groups of teachers, parents, and community members
conducted in 12 counties
Year 2 • Statewide phone survey with 12 counties oversampled
Year 3 • Surveys of: students in grades 4, 7 and 10; their parents; random sample of
teachers statewide; UI retreat/workshop; pilot innovations
Year 4 • Further implementation of innovations, assessment of interventions, statewide
STEM conference, dissemination of results, development of key partnerships
Year 5 • Continued progress with innovations, final surveys to assess progress
Five-year Project Design

Year 1 • Highlights from Focus Groups
Year 2 • Important Statewide findings

Statewide Survey Response
• 77.1% support state budget increases in K-12 education.
• 77.4% support state budget increases in STEM education.
• 66.6% support state budget increases in higher education.
• For comparison, 41.7% support state budget increases in law enforcement/public safety.
High levels of support for investment in education
So much of legislation in politics, and even education decisions that are being made, go back to assuming that you understand what [the science is] they’re even talking about. So, while we can’t all be experts in everything, I think there’s a certain level of literacy in these areas that we all need to be good citizens to be able to make responsible decisions.
-- 2011 Focus Group Response

Parents appear uncomfortable
with their abilities
Statewide Survey Response
• 41.1% of parents were unsure about what courses a child should take to be successful in college
• 37.7% of parents were unsure about how to help someone apply to college
• 41.3% of parents were unsure how financial aid works in college
Statewide Survey Response
• 42.5% of parents in the statewide survey felt their math and science abilities make it difficult to help their children with their homework.
• 48.3% of parents in the statewide survey felt they do not have as much time as they would like to be involved in their children’s education.

Science is supported, but
support is tempered by uncertainty.
Statewide Survey Response
• 58.5% of respondents felt that scientists have a political agenda with their research
“It's alright if they give the facts, but leave it to that. [They] don't need to get on a high horse and press their agenda on others.”
Statewide Survey Response
• 45.5% said that science can be in conflict with their religious beliefs
• 49.1% reported that scientific knowledge changes so rapidly that it is hard to know what to trust
• 60.2% think scientists have had a positive influence in their communities

Year 3
• Student Survey • Parent Survey • Teacher Survey

∗ Only 28% of Idaho eighth graders are proficient in math and 36% are proficient in science (NCES 2011). In addition, Idaho has a significantly lower percentage (29.5%) of 18-24 year olds in college compared to 36.5% enrolled in the nation as a whole (NCHEMS 2009).
11
Student Survey

∗ Randomly selected 10th, 7th, and 4th grade classes in 12 communities/districts
∗ Total of 2,600 student surveys collected ∗ 426 4th graders ∗ 995 7th graders ∗ 1179 10th graders
Student Survey Sample

Student Sample Demographics
Demographic Groups 4th Graders (n=426)
7th Graders (n=995)
10th Graders (n=1179)
Gender
Girl 49% (207) 49% (455) 52% (600)
Boy 51% (217) 51% (483) 48% (554)
Ethnicity*
White -- 71% (662) 80% (932)
Hispanic -- 17% (161) 17% (195)
American Indian or Alaskan Native
-- 7% (66) 4% (47)
Black or African American, Asian American, or Other
-- 15% (138) 9% (90)
Geographic Residence
Rural 32% (135) 14% (143) 12% (141)
Urban 68% (291) 86% (852) 88% (1038)
Parents’ Educational Level
One or more parents with college degree
-- 50% (454) 52% (601)
Neither parent has a college degree
-- 19% (170) 35% (400)
Don’t know -- 31% (279) 13% (146)
*Students could identify with more than one ethnicity, thus percentages do not total 100. Fourth graders were not asked this question. Note: Frequencies are listed in parentheses.
The proportion of boys and girls in our sample is similar to the state population. According to National Center for Educational Statistics, boys comprised 51.5% and girls 48.5% of Idaho’s K-12 school population (2010-11).
The ethnic distribution of the sample is similar to the state population. National Center for Educational Statistics reports white students comprise 78.5% of Idaho’s K-12 school population. Hispanic students represent 15.9% while other minority populations (including American Indians, African-Americans, and Asian-Americans) are 5.6% of the student population (2010-11).
Students in our survey reported having more highly educated parents than is typical among adults in Idaho (34% of Idahoans 25 years or older had an associate’s degree or higher in 2011).
A large number of students in our sample did not know if their parents had college degrees.

∗ The majority of 4th graders like math (84%) and science (92%) yet…. ∗ over half (54%) do not want to have a job that uses a lot of
math when an adult ∗ over half (60%) would not like to be a scientist
How do 4th grade students perceive STEM careers?

84 92
75 86
61 67
0
20
40
60
80
100
% Students whoanswered "I like math"
% Students whoanswered "I like science"
4th Grade7th Grade10th Grade
Students’ Interest In Science And Math Declines As They Progress Through
School

84%
71%
31%
46%
75%
40%
27%
40%
61%
20%
28%
25%
0% 10% 20% 30% 40% 50% 60% 70% 80% 90% 100%
I like math
Most of my friends like math
Math is harder for me than for most of mypeers
I would like a job that uses a lot of math
10th Graders
7th Graders
4th Graders
Numbers in the figure reflect the percent of students who agreed or strongly agreed with each listed statement.
Math Attitudes
Most students enjoy math. However, more than half of the students across all grades did not want a job that used a lot of math. This becomes more pronounced as they age.

92%
84%
40%
86%
62%
24%
28%
67%
36%
28%
22%
0% 10% 20% 30% 40% 50% 60% 70% 80% 90% 100%
I like science
Most of my friends like science
Science is harder for me than for most of mypeers*
I would like to be a scientist
10th Graders
7th Graders
4th Graders
Fourth, seventh, and tenth graders liked science at higher rates than for math, both in reference to themselves and to their peers. However, students from all three grades indicated lower interest in being a scientist than having a job that used a lot of math.
Science Attitudes

10th Grade Student Confidence in College Readiness
58
29
71
38
0102030405060708090
100
Do
not
know
HS
clas
ses
to t
ake
for
colle
gesu
cces
s
Do
not
know
how
to a
pply
for
colle
ge
Do
not
know
how
to a
pply
for
fina
ncia
l aid
Do
not
get
enou
gh c
aree
r or
colle
geco
unse
ling
Idaho High school students are unsure how to prepare for college and by high school their interest in STEM has declined significantly.

∗ Nearly half of Hispanic tenth graders wanted jobs that didn’t require math or science beyond high school.
∗ Hispanic students were more likely than white students to say they want a job that meets their parents’ wishes and is really physical.
∗ Boys said they like math more often than girls did, but boys were less interested in jobs requiring math beyond high school level. Over a fifth of boys would like a job that doesn’t require a college degree.
∗ Tenth grade boys were more likely than girls to indicate they would like a job that meets their parents’ wishes and allows them to stay in their hometowns.
19
Student Attitudes and Aspirations Vary by Race and Gender

The Career Disconnect
When asked about careers, students didn’t want jobs that require a lot of science and math, but then listed STEM jobs as ideal???

∗ Research surrounding parental involvement in their child’s education consistently finds that higher academic achievement is linked to parents’ expectations and presence in student learning (Jeynes, 2005).
Parent Survey

Parent Sample Demographics: Gender, Ethnicity, and Geographic Residence
Demographic Groups 4th Grade Parents (n=258)
7th Grade Parents (n=634)
10th Grade Parents (n=701)
Gender
Women 80% 82% 76%
Men 20% 18% 24%
Ethnicity*
White 85% 81% 83%
Hispanic 10% 13% 10%
American Indian or Alaskan Native
3% 3% 2%
Black or African American, Asian American, or Other
2% 2% 3%
Geographic Residence
Rural 30% 15% 14%
Urban 70% 85% 86%
*Respondents could identify with more than one ethnicity, thus percentages do not total 100. 22
Of the 4th-grade students who participated in the survey fall 2012, 61% of their parents participated. Of 7th-grade students, 64% of their parents participated and 60% of 10th-grade students’ parents participated.
The ethnic distribution of the parent sample is not as diverse as the student sample. Although 17% of the student sample reported being Hispanic, only 10% of the parents identified as Hispanic.

Parent Experiences with Math and Science Compared to Student Responses
62%
75%
39%
45%
69%
38%
25%
61%
55%
31%
0% 10% 20% 30% 40% 50% 60% 70% 80% 90%
Parents: I liked math.
Students: I like math.
Parents: Most of my friendsliked math.
Students: Most of myfriends like math.
Parents: I wish I wouldhave put more effort intolearning math when I was
in school.
Consider your experiences with math in school.
Disagree/Strongly Disagree Strongly Agree/Agree
82%
82%
59%
59%
70%
18%
18%
41%
41%
30%
0% 50% 100%
Parents: I liked science.
Students: I like science.
Parents: Most of my friendsliked science.
Students: Most of myfriends like science.
Parents: I wish I wouldhave put more effort intolearning science when I
was in school.
Consider your experiences with science in school.
Disagree/Strongly Disagree Strongly Agree/Agree

∗ Parents said they wished they had put more effort into learning math and science when they were in school
∗ There was a small but significant correlation between how much children reported liking math and how much their parents reported liking math (r=.11, p<.001)
∗ Perceptions of peers may be more influential than parents with regard to liking math as children who believed their friends liked math were more likely to report that they too liked math (r=.29, p<.001).
∗ Students showed the same pattern as their parents with regard to their own and perceptions of their friends’ liking for science.
Do Parent’s Influence How Their Students Feel About Math And Science?

2.82b
2.61c
2.98a
2.84b
2.98a
2.74b
3.04a
2.94b
3.09a
3.02a
3.03a
3.10a
1.00 2.00 3.00 4.00
My child's teachers are mostly succeeding ingetting him or her excited about learning
SCIENCE.
My child's teachers are mostly succeeding ingetting him or her excited about learning
MATH.
My child's teachers are mostly succeeding atshowing how SCIENCE is relevant and important
in the real world.
My child's teachers are mostly succeeding atshowing how MATH is relevant and important in
the real world.
Strongly Disagree Strongly Agree
Degree of Parent Agreement with Each Item
4th grade parents
7th grade parents
10th grade parents
How Do Parents Feel About Their Student’s Education?
As grade levels advance parents increasingly
perceive that teachers are less successful in getting students excited about
math or science.
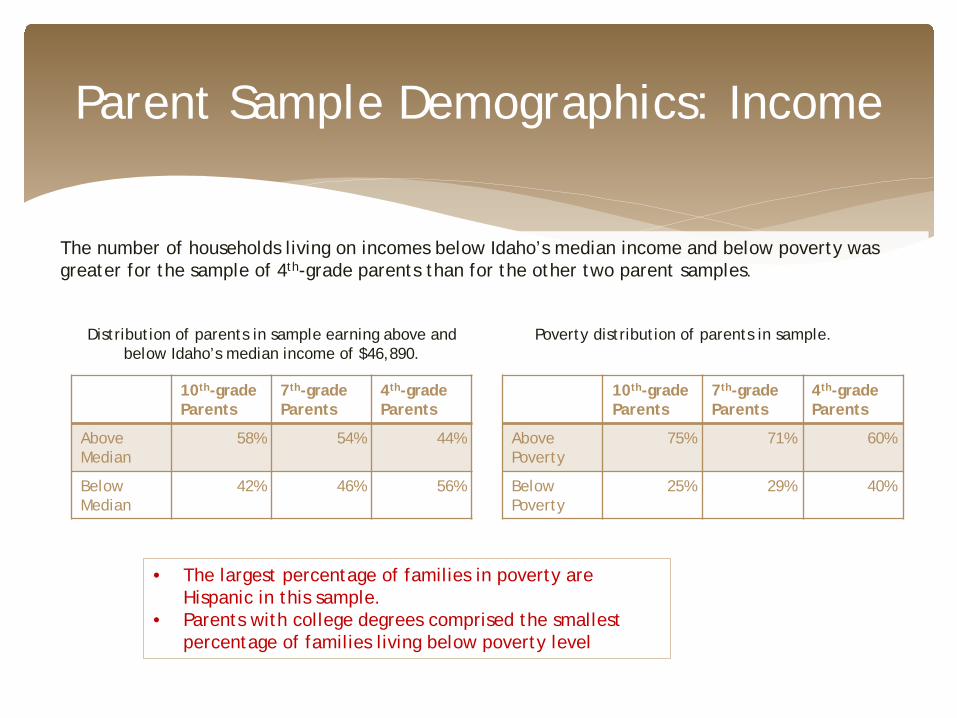
Parent Sample Demographics: Income
Distribution of parents in sample earning above and below Idaho’s median income of $46,890.
10th-grade Parents
7th-grade Parents
4th-grade Parents
Above Median
58% 54% 44%
Below Median
42% 46% 56%
Poverty distribution of parents in sample.
10th-grade Parents
7th-grade Parents
4th-grade Parents
Above Poverty
75% 71% 60%
Below Poverty
25% 29% 40%
The number of households living on incomes below Idaho’s median income and below poverty was greater for the sample of 4th-grade parents than for the other two parent samples.
• The largest percentage of families in poverty are Hispanic in this sample.
• Parents with college degrees comprised the smallest percentage of families living below poverty level

73%
27%
47%
53%
0% 20% 40% 60% 80%
Disagree/Strongly Disagree
Agree/Strongly Agree
Percent of Parent Respondents
My family’s financial situation makes it difficult to be involved in my child’s education.
BelowPoverty
AbovePoverty
The Relationship Between Poverty and Family Involvement with Education
• 60% of parents felt they knew how to support their child’s efforts in college preparation.
• Parents experiencing poverty were less likely to report understanding different aspects of college preparation.
• 40 % of parents living below poverty level reported they did not know how to help their child apply for financial aid.
28
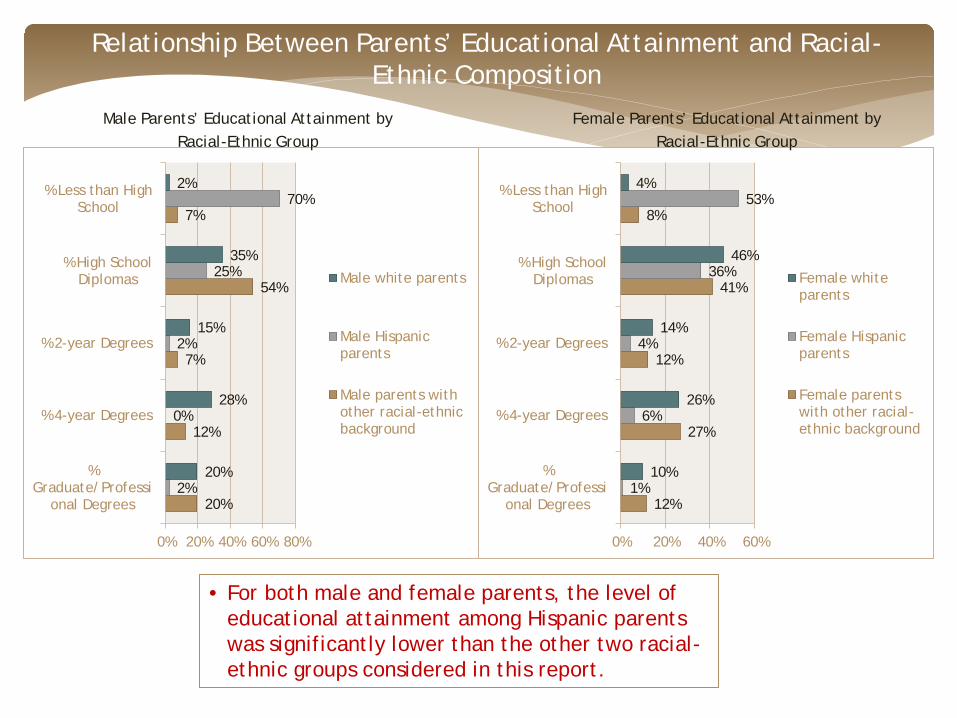
Relationship Between Parents’ Educational Attainment and Racial-Ethnic Composition
20%
12%
7%
54%
7%
2%
0%
2%
25%
70%
20%
28%
15%
35%
2%
0% 20% 40% 60% 80%
%Graduate/Professi
onal Degrees
% 4-year Degrees
% 2-year Degrees
% High SchoolDiplomas
% Less than HighSchool
Male white parents
Male Hispanicparents
Male parents withother racial-ethnicbackground
12%
27%
12%
41%
8%
1%
6%
4%
36%
53%
10%
26%
14%
46%
4%
0% 20% 40% 60%
%Graduate/Professi
onal Degrees
% 4-year Degrees
% 2-year Degrees
% High SchoolDiplomas
% Less than HighSchool
Female whiteparents
Female Hispanicparents
Female parentswith other racial-ethnic background
Female Parents’ Educational Attainment by Racial-Ethnic Group
Male Parents’ Educational Attainment by Racial-Ethnic Group
• For both male and female parents, the level of educational attainment among Hispanic parents was significantly lower than the other two racial-ethnic groups considered in this report.

∗ Parents with less than a high school education wish they had more time
to be involved in their child’s education compared to other parents ∗ The largest portion of students who indicate they do not want to be
scientists come from homes where the parent has less than a high school diploma
∗ Parents’ educational attainment significantly correlates with students’ career aspirations, with the desire to use a lot of math increasing as parents’ education level increases (r=.07, p=.01).
∗ Regression analysis indicates that a female parent’s educational attainment and grade in school are significant predictors of a child’s agreement with the statement, “I want to be a Scientist.”
Why Does Parent Educational Attainment Matter?
Over 50% of parents, both male and female, reported having a high school
education or less, YET
91% of parents said they would like their child to earn at least
a four-year degree.

Teacher Survey
“Tell me and I forget, teach me and I may remember, involve me and I learn.” ― Benjamin Franklin

Teacher Sample Demographics
Demographic Groups Teacher Sample
Idaho Population
(Census Bureau)
US Population
(Census Bureau)
US Teachers (Natl Ctr for Ed Stats)
Gender
Women 56% 50% 51% 476%
Men 44% 50% 49% 24%
Ethnicity*
White 96% 94% 78% 383%
Hispanic 2% 12% 17% 7%
American Indian or Alaskan Native
1% 2% 1% Less than 1%
Black or African American, Asian
American, or Other
2% 1% 18% 8%
*Respondents could identify with more than one ethnicity. Sources: US Census Bureau and Idaho Department of Education
The sample of Idaho teachers is dominated by females at 56%, yet not as drastically as the national 76%; however, the Idaho State Department of Education reported that 71% of public k-12 teachers were female in 2012-13.
Both the sample and the State reported 2% of Idaho teachers are Hispanic, while the general population of Idaho has 12% Hispanic.

All grade levels from kindergarten through twelfth grade are represented in the sample
Teacher Sample Demographics: Grade Levels and Subject Areas Represented
Grade Level K 1st 2nd 3rd 4th 5th 6th 7th 8th 9th 10th 11th 12th
# Teachers in Sample 24 46 46 35 27 24 25 38 43 28 32 30 31
Teachers represented a wide variety of subject areas.
Subject in Jr.
High/High School
Social Sciences Math English Science
Vocational
/Technical
Health /PE Arts
Foreign Language
/ELL Speech Special
Ed Elec tives
#Teachers in Sample
47 39 37 36 13 11 7 6 5 3 9

0
5
10
15
20
25
30
35
40
45
50
ElementaryTeachers
SecondaryMath
Teachers
SecondaryScience
Teachers
OtherSecondaryTeachers
Year
s Ex
peri
ence
Years Teaching Experience
Maximum: Top ofupper whisker
75th percentile: Topof box
25th percentile:Bottom of box
Minimum: Bottom oflower whisker
Teachers had between 2 and 46 years of teaching
experience including the 2012-2013 school year
245
18
Current Teaching Schedule
Full-TimeTeachers
Part-TimeTeachers
Teacher Experience
249
14
Teacher Sample Public/Private Schools
PublicSchoolTeachers
PrivateSchoolTeachers
(74 districts)
The average number of years taught for the entire sample was 20 years. The median was also 20 years.

Teacher Preparation in Science and Mathematics
Elementary teachers, who must teach several subjects, tend to take fewer math and science courses in college.
0
10
20
30
40
50
60
0 2 4 6 8 10 12 14 16 20 30 42
Freq
uenc
y of
Res
pons
e
Number of Classes Taken
All TeachersSurveyed
ElementaryTeachers
Science Classes Taken
0
10
20
30
40
50
60
0 2 4 6 8 10 15 20 25
Freq
uenc
y of
Res
pons
e
Number of Classes Taken
All TeachersSurveyed
ElementaryTeachers
Math Classes Taken

Teacher Professional Development
75%
57%
59%
0 10 20 30 40 50 60 70 80 90 100
Science, technology, engineering, andmath related professionaldevelopment opportunities
The quality of professionaldevelopment opportunities
The amount of time your districtprovides for professional development
Please indicate how satisfied or dissatisfied you are currently with each of the following at your
school:
Percent Satisfied or Very satisfied
Yet, in another question, only 42% agreed/strongly
agreed with There has been sufficient
professional development devoted
to supporting the transition to the
CCSS at my school.

36
What Do These Teachers Have to Say About:
• Parental Involvement? • Community Engagement? • Student Achievement? • School Culture? • Student Motivation? • Student College Preparation?
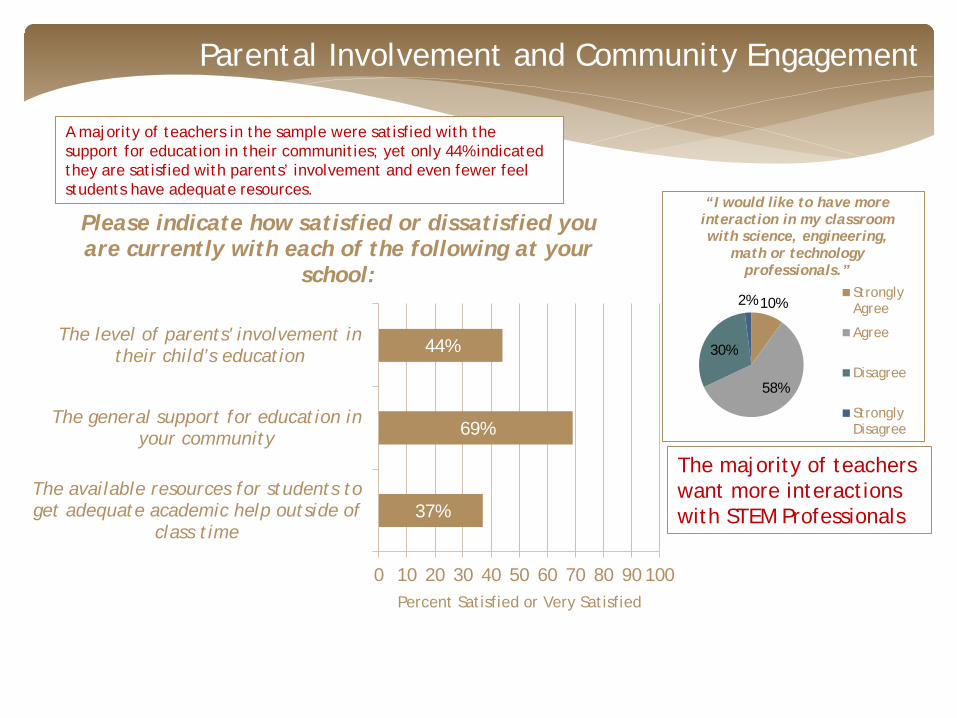
Parental Involvement and Community Engagement
37%
69%
44%
0 10 20 30 40 50 60 70 80 90 100
The available resources for students toget adequate academic help outside of
class time
The general support for education inyour community
The level of parents' involvement in their child’s education
Please indicate how satisfied or dissatisfied you are currently with each of the following at your
school:
Percent Satisfied or Very Satisfied
10%
58%
30%
2%
“I would like to have more interaction in my classroom with science, engineering,
math or technology professionals.”
StronglyAgree
Agree
Disagree
StronglyDisagree
A majority of teachers in the sample were satisfied with the support for education in their communities; yet only 44% indicated they are satisfied with parents’ involvement and even fewer feel students have adequate resources.
The majority of teachers want more interactions with STEM Professionals

Student Achievement
0 10 20 30 40 50 60 70 80 90 100
There is not much I can do as a teacher to overcome the influence of adverse family
conditions on students’ learning.
**Student achievement in math is mostly areflection of their natural abilities.
*Many of my students are not motivated towork in school because they feel education
has no place in the futures they see forthemselves.
Percent of Teachers Responding
Influence of Various Factors on Student Achievement
Strongly Agree Agree Disagree Strongly Disagree
Sub-groups: 34% of elementary teachers
agreed with this statement, while 57% of secondary teachers
agreed.
Teachers Believe they have an impact.

School Culture
0 10 20 30 40 50 60 70 80 90 100
The student peer culture at my school encourageswhite students more so than ethnic minoritystudents to succeed at math and/or science.
The student peer culture at my school encouragesboys more so than girls to succeed at math and/or
science.
**My school emphasizes math and/or science at theexpense of other subject areas.
*Most of my students have a clear idea of how mathand science can be used in their future employment
and daily lives as adults.
Percent of Teachers Responding
Strongly Agree Agree Disagree Strongly Disagree
Teachers perceive a positive peer culture but feel there could be more emphasis on Science and Math and how it relates to employment

40
Student Motivation
Teachers indicate themselves and parents as having more significant influence than peers and community members for students’ academic motivation. A very similar distribution occurred for a parallel question about influences on a student’s decision to attend college or not.
0 10 20 30 40 50 60 70 80 90 100
Community Members' Influence
Peers' Influence
Teachers' Influence
Parents' Influence
Percent of Teachers Responding
Influence on Student Academic Motivation:
0 = No Influence 1 2 3 4 5 6 7 = Significant Influence
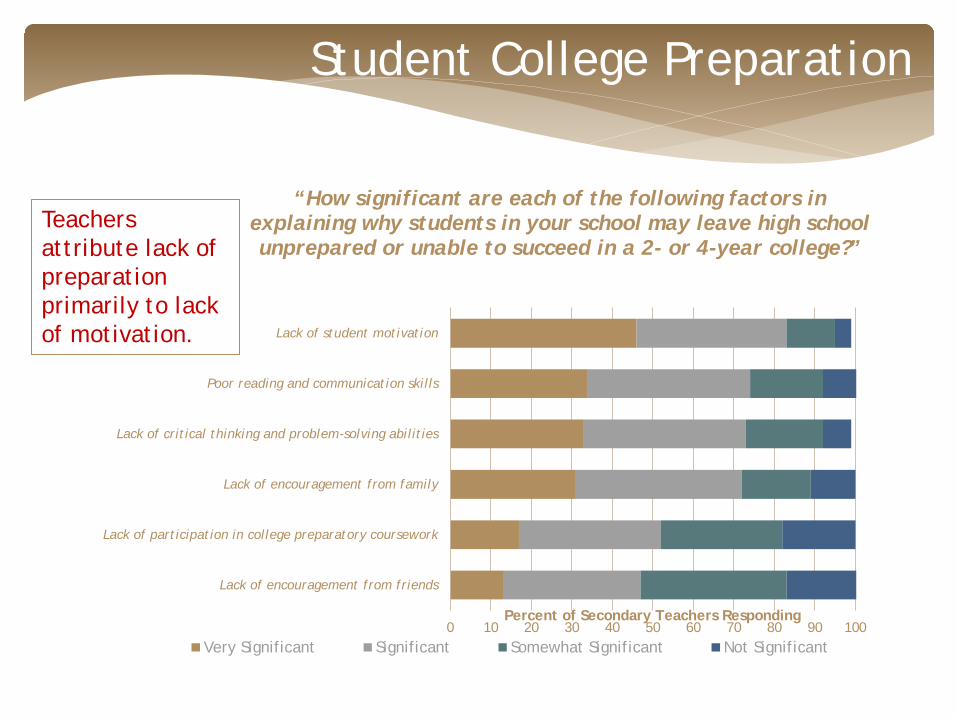
Teachers attribute lack of preparation primarily to lack of motivation.
Student College Preparation
0 10 20 30 40 50 60 70 80 90 100
Lack of encouragement from friends
Lack of participation in college preparatory coursework
Lack of encouragement from family
Lack of critical thinking and problem-solving abilities
Poor reading and communication skills
Lack of student motivation
Percent of Secondary Teachers Responding
“How significant are each of the following factors in explaining why students in your school may leave high school unprepared or unable to succeed in a 2- or 4-year college?”
Very Significant Significant Somewhat Significant Not Significant

Conclusions ∗ The statewide survey suggests that Idaho citizens support education and
specifically STEM education ∗ Most students were not interested in jobs that use a lot of math and did not
want to be scientists. Yet, they are interested in STEM-related careers. Career awareness may be the key to resolving this disconnect. (Poster presents more detail)
∗ Students’ positive experiences with, and attitudes toward, math and science significantly decline as they progress in grade level. High School may be too late for interventions.
∗ Gender and Ethnicity are related to student attitudes. (Posters present more detail)
∗ Parents and students alike have doubts regarding the necessary steps to proceed to college and parents are concerned about their abilities to help their children with math and science and this is pronounced with lower income and lower educational attainment. (Posters present more detail)
∗ Many teachers have only the minimum requirements in math and science education and do not feel prepared to implement the Common Core Standards in math. Teacher Preparation in math may be key

∗ “Introducing STEM Experiences to Head Start Children in Jerome County” ∗ Develop and deliver hands-on bilingual STEM activities ∗ Target children 3-5 years old and their parents and teachers ∗ Jerome County
∗ “How I do STEM” Community Awareness Campaign ∗ YouTube video competition highlighting STEM careers ∗ Produced by H.S. students for broad community awareness ∗ Lewiston area
∗ Technology to Teach Mathematical Practices to Parents” ∗ Develop and deliver video tutorials for parents to help them support children with
math homework ∗ Target parents of students in grades K-6 ∗ Kootenai County
Innovation Projects

∗ “ Dig’ n IT” Digital Innovation Generating New Information Technology ∗ Summer internship experience focused on technology ∗ Target high school girls ∗ Post Falls, Idaho
∗ “Virtual World Village” ∗ Development of the web-based Virtual World Village 3D learning environment ∗ Targeting High School Student use ∗ Statewide
∗ “iSTEM from Excellence” ∗ Informal STEM education using the place-based theme of Watersheds ∗ Elementary Schools ∗ Lakeland School District
∗ “Eastern Idaho Awareness” ∗ A public awareness and assistance campaign about FAFSA and college applications ∗ High School students and parents ∗ Caribou County, Bannock County, Bonneville County
Innovation Projects