invest now in - baroda pioneer · invest now in factsheet as on ... an employee of the asset...
TRANSCRIPT

Baroda Pioneer Credit Opportunities FundAn Open Ended Debt Scheme
Invest Now In
Factsheetas on August 2017
* Investors should consult their financial advisers if in doubt about
whether the product is suitable for them.
Income over medium term.
Investment in a mix of debt and money market instruments across
the credit and maturity spectrum.
This product is suitable for investors who are seeking*

31st August, 2017
BARODA PIONEER MUTUAL FUND
Dear Investors,
Warm Greetings!
Post hitting all-time highs in July, BSE Sensex pulled back during the month of August, closing down by 2.4%. While August witnessed increased volatility levels, sell off was triggered by SEBI’s ban on 331 companies. These companies have been suspected to be shell companies as per Ministry of Corporate Affairs. Separately, corporate results were negative and internationally, focus shifted to deteriorating relations between US and North Korea and geopolitical issues between China and India. FPIs (Foreign Portfolio Investments) remained sellers for the second consecutive month with outflows of USD 2bn.
1Q results season just concluded. As expected, performance was disappointing. On aggregate basis, profits for Nifty were flattish, while revenues increased by 9% YoY. EBITDA margins declined by 200 bps on YoY basis. Auto, Pharmaceuticals, IT,
energy and Telecom were key sectors that disappointed. Cement, Metals, Infrastructure and Media reported robust growth in operating profits. Compared to previous quarters, PAT growth was much weaker. Nifty PAT growth was flattish vs 21% growth reported in 4Q FY17 and 7% growth reported during 3Q FY17.
After falling for five consecutive months, Consumer Price Index (CPI) inflation rose to 2.4% in Jul’17, from 1.5% in Jun’17. Food inflation came out of the deflationary zone led by a sharp sequential jump in vegetables’ prices. Reflecting the HRA increase impact, housing inflation increased to a 6-month high to 5% in Jul’17. Core inflation also picked up to 3.9% vs 3.8% in June’17.
June Index Of Industrial Production (IIP) growth at negative 0.1% was a reflection of the production slowdown before the GST implementation from July 1, 2017. Post the demonetization-led disruption in production, industrial production has been further weighed down by GST-led inventory destocking. Sector-wise, manufacturing growth was at negative 0.4% after 1.2% in May’17. Sequentially manufacturing contracted on month on month basis. Within manufacturing, 15 out of the 22 groups have shown negative growth. On the positive side, Mining grew 0.4% after negative 0.9% in May’17. Electricity production growth was at 2.1% against 8.7% in May’17. 1QFY18 IIP growth was 2% against 7% in 1QFY17 and 2.6% in 4QFY17.
In the August Bi Monthly Monetary policy, RBI cut the repo rate by 25bps to 6%, which is in line with the market. The Monetary Policy Committee (MPC) maintained its neutral stance on monetary policy. Four members of the MPC voted in favor of the decision. The RBI projects headline inflation excluding the house rent allowance (HRA) impact to be a “little above 4% by Q4” (Jan-Mar 2018). It left its Gross Value Added growth projection at 7.3% y-o-y for FY18 (from 6.6% in FY17). The policy is neutral and any future rate action may mainly be dependent on future inflation figure. We expect that the inflation may move up due to rise in vegetable prices, house rent allowance and high base effect. Therefore, there may be no changes in rates by RBI. We expect that the yield may trade in a narrow range in future. However, hike in rate by Federal Reserve rise in crude and commodity prices are likely to remain key risks to the market.
We expect markets may consolidate at these levels given earnings expectations post recent downgrades are more realistic, fund raising activity (public issues) is expected to pick up over the coming months and market valuations are higher than historic levels. We are cautiously optimistic on the market.
Happy Investing!
Sanjay Chawla
Chief Investment Officer
Source : Bloomberg, Economic Times
CIO Letter
2
Mr. Sanjay ChawlaChief Investment Officer

31st August, 2017
BARODA PIONEER MUTUAL FUND
INDEX
Title
How To Read Factsheet Pg 4
Baroda Pioneer Growth Fund Pg 5
Baroda Pioneer ELSS’ 96 Pg 6
Baroda Pioneer Mid Cap Fund Pg 7
Baroda Pioneer Large Cap Fund Pg 8
Baroda Pioneer Banking and Financial Services Fund Pg 9
Baroda Pioneer Balance Fund Pg 10
Baroda Pioneer Monthly Income Plan (MIP) Fund(Monthly income is not assured and is subject to the availability of distributable surplus)
Pg 11
Baroda Pioneer Credit Opportunities Fund Pg 12
Baroda Pioneer Gilt Fund Pg 13
Baroda Pioneer Income Fund Pg 14
Baroda Pioneer Dynamic Bond Fund Pg 15
Baroda Pioneer Short Term Bond Fund Pg 16
Baroda Pioneer Treasury Advantage Fund Pg 17
Baroda Pioneer Liquid Fund Pg 18
Investment Performance Pg 19
SIP Returns Pg 23
Dividend History Pg 24
3

31st August, 2017
BARODA PIONEER MUTUAL FUND
Fund Manager : An employee of the asset management company such as a mutual fund or life insurer, who manages investments of the scheme. He is usually part of a larger team of fund managers and research analysts.
Application Amount for Fresh Subscription : This is the minimum investment amount for a new investor in a mutual fund scheme.
Minimum Additional Amount : This is the minimum investment amount for an existing investor in a mutual fund scheme.
Yield to Maturity : The Yield to Maturity or the YTM is the rate of return anticipated on a bond if held until maturity. YTM is expressed as an annual rate. The YTM factors in the bond’s current market price, par value, coupon interest rate and time to maturity.
SIP : SIP or systematic investment plan works on the principle of making periodic investments of a fixed sum. It works similar to a recurring bank deposit. For instance, an investor may opt for an SIP that invests Rs 500 every 15th of the month in an equity fund for a period of three years.
NAV : The NAV or the net asset value is the total asset value per unit of the mutual fund after deducting all related and permissible expenses. The NAV is calculated at the end of every business day. It is the value at which the investor enters or exits the mutual fund.
Benchmark : A group of securities, usually a market index, whose performance is used as a standard or benchmark to measure investment performance of mutual funds, among other investments. Some typical benchmarks include the Nifty, Sensex, BSE200, BSE500, 10-Year Gsec.
Entry Load : A mutual fund may have a sales charge or load at the time of entry and/or exit to compensate the distributor/agent. Entry load is charged at the time an investor purchases the units of a mutual fund. The entry load is added to the prevailing NAV at the time of investment. For instance, if the NAV is Rs. 100 and the entry load is 1%, the investor will enter the fund at Rs. 101.
Note: SEBI, vide circular dated June 30, 2009 has abolished entry load and mandated that the upfront commission to distributors will be paid by the investor directly to the distributor, based on his assessment of various factors including the service rendered by the distributor.
Exit Load : Exit load is charged at the time an investor redeems the units of a mutual fund. The exit load is deducted from the prevailing NAV at the time of redemption. For instance, if the NAV is Rs 100 and the exit load is 1%, the redemption price would be Rs 99 Per Unit.
Modified Duration : Modified duration is the price sensitivity and the percentage change in price for a unit change in yield
Standard Deviation : Standard deviation is a statistical measure of the range of an investment’s performance. When a mutual fund has a high standard deviation, its means its range of performance is wide, implying greater volatility.
Sharpe Ratio : The Sharpe Ratio, named after its founder, the Nobel Laureate William Sharpe, is a measure of risk-adjusted returns. It is calculated using standard deviation and excess return to determine reward per unit of risk.
Beta : Beta is a measure of an investment’s volatility vis-à-vis the market. Beta of less than 1 means that the security will be less volatile than the market. A beta of greater than 1 implies that the security’s price will be more volatile than the market.
AUM : AUM or assets under management refers to the recent / updated cumulative market value of investments managed by a mutual fund or any investment firm.
Holdings : The holdings or the portfolio is a mutual fund’s latest or updated reported statement of investments/securities. These are usually displayed in terms of percentage to net assets or the rupee value or both. The objective is to give investors an idea of where their money is being invested by the fund manager.
Nature of Scheme : The investment objective and underlying investments determine the nature of the mutual fund scheme. For instance, a mutual fund that aims at generating capital appreciation by investing in stock markets is an equity fund or growth fund. Likewise, a mutual fund that aims at capital preservation by investing in debt markets is a debt fund or income fund. Each of these categories may have sub-categories.
Rating Profile : Mutual funds invest in securities after evaluating their creditworthiness as disclosed by the ratings. A depiction of the mutual fund in various investments based on their ratings becomes the rating profile of the fund. Typically, this is a feature of debt funds.
How To Read Factsheet?
4

31st August, 2017
BARODA PIONEER MUTUAL FUND
Baroda Pioneer Growth Fund
PORTFOLIO
Name of Instruments Ratings / Industries
% to Net Assets
EQUITY & EQUITY RELATED
Listed / awaiting listing on the stock exchanges
HDFC Bank Ltd. Banks 5.26%
Maruti Suzuki India Ltd. Auto 4.27%
Yes Bank Ltd. Banks 4.05%
ICICI Bank Ltd. Banks 3.86%
Hindalco Industries Ltd.Non - Ferrous Metals
3.56%
Mahindra & Mahindra Financial Services Ltd.
Finance 3.48%
ITC Ltd.Consumer Non Durables
3.13%
Kansai Nerolac Paints Ltd.Consumer Non Durables
3.06%
State Bank of India Banks 2.77%
Petronet LNG Ltd. Gas 2.77%
Motherson Sumi Systems Ltd.
Auto Ancillaries 2.68%
LIC Housing Finance Ltd. Finance 2.49%
The Federal Bank Ltd. Banks 2.48%
Tata Steel Ltd. Ferrous Metals 2.36%
Bank of Baroda Banks 2.36%
Britannia Industries Ltd.Consumer Non Durables
2.35%
Blue Star Ltd.Consumer Durables
2.26%
HCL Technologies Ltd. Software 2.24%
GAIL (India) Ltd. Gas 2.24%
Apollo Tyres Ltd. Auto Ancillaries 2.11%
Bajaj Finserv Ltd. Finance 2.03%
Whirlpool of India Ltd.Consumer Durables
1.97%
NBCC (India) Ltd. Construction 1.89%
Indraprastha Gas Ltd. Gas 1.89%
Pidilite Industries Ltd. Chemicals 1.85%
Vedanta Ltd.Non - Ferrous Metals
1.71%
Ultratech Cement Ltd. Cement 1.70%
The Ramco Cements Ltd. Cement 1.66%
Central Depository Services (I) Ltd.
Finance 1.56%
Bharat Forge Ltd.Industrial Products
1.56%
Mahindra & Mahindra Ltd. Auto 1.49%
Larsen & Toubro Ltd.Construction Project
1.42%
Mangalore Refinery and Petrochemicals Ltd.
Petroleum Products
1.41%
Capital First Ltd. Finance 1.40%
Axis Bank Ltd. Banks 1.39%
Eicher Motors Ltd. Auto 1.34%
IndusInd Bank Ltd. Banks 1.23%
Sadbhav Engineering Ltd.Construction Project
1.18%
Tata Motors Ltd. Auto 1.07%
Max Financial Services Ltd. Finance 1.06%
Indian Oil Corporation Ltd.Petroleum Products
1.05%
PORTFOLIO
Name of Instruments Ratings / Industries
% to Net Assets
Sun TV Network Ltd.Media & Entertainment
1.03%
Bharti Airtel Ltd.Telecom - Services
0.99%
Astral Poly Technik Ltd.Industrial Products
0.98%
Shriram City Union Finance Ltd.
Finance 0.87%
Cummins India Ltd.Industrial Products
0.84%
Security and Intelligence Services (I) Ltd.
Commercial Services
0.35%
Total 96.70%
CBLO / Reverse Repo Investments 3.93%
Total 3.93%
Cash & Cash Equivalents
Net Receivable/Payable -0.63%
Total -0.63%
Grand Total 100.00%
INDUSTRIES/RATINGS
23.40%12.89%
8.54%8.17%
6.90%5.27%4.79%4.23%
3.38%3.36%3.30%2.60%2.46%2.36%2.24%1.89%1.85%
1.03%0.99%0.35%
BanksFinance
Consumer Non DurablesAutoGas
Non - Ferrous MetalsAuto Ancillaries
Consumer DurablesIndustrial Products
CementCash & Equivalent
Construction ProjectPetroleum Products
Ferrous MetalsSoftware
ConstructionChemicals
Media & EntertainmentTelecom - Services
Commercial Services
Investors understand that their principal will be at Moderately High risk
This product is suitable for investors who are seeking*• Capital appreciation over long term• Investment predominantly in equity and equity related
instruments.* Investors should consult their financial advisers if in doubt about whether the product is suitable for them.
INVESTMENT OBJECTIVE
To generate long term capital appreciation from an actively managed portfolio of equity & equity related instruments.
FUND DETAILS
Type of Scheme An Open Ended Growth Scheme
Date of Allotment September 12, 2003
Fund Manager# Mr. Sanjay Chawla& (Experience 29 yrs) Mr. Dipak Acharya (Experience 13 yrs)
Benchmark S&P BSE 200*
Monthly Average AUM (`)
529.33 Crs
Month end AUM (`) 541.05 Crs
Minimum Investment ` 5,000/- & in multiples of ` 1/- thereafter
Entry Load NAExit Load 1% if redeemed on or before
365 days from the date ofallotment of units, Nil if redeemed after 365 days from the date of allotment of units
Plans Plan A and Plan B (Direct)Option A. Growth Option (default
option in case no option specified by investor);B. Dividend Option1. Payout2. Re-investment (default sub-option in case no option specified by investor) C. Bonus Option$
SIP (Minimum) ` 500/month - 12 Installments` 1500/quarter - 4 Installments
RISk PROFILE 31 AUGUST 2017Standard deviation 14.48%Sharpe@ 0.42Beta 0.98Portfolio Turnover (last 12 months) 1.47
NAV AS ON 31 AUGUST 2017NAV (Per Unit) `Plan AGrowth 95.9500Dividend 36.6700Plan B - DirectGrowth 99.9600Dividend 36.2600
TOTAL EXPENSE RATIOPlan A 2.94%Plan B (Direct) 1.84%
$ The Bonus Option in the Schemes has been discontinued effective June 08, 2015 # For performance of the Scheme and other funds managed by the said Fund manager, either individually or jointly, please refer page no 19 - 22*For Disclaimer please refer page no 22@risk free rate (FBIL Overnight MIBOR) 5.96%& Mr. Chawla is managing the Scheme along with Mr. Acharya effective November 1, 2015
An Open Ended Growth Scheme
5

31st August, 2017
BARODA PIONEER MUTUAL FUND
PORTFOLIO
Name of Instruments Ratings / Industries
% to Net Assets
EQUITY & EQUITY RELATED
Listed / awaiting listing on the stock exchanges
HDFC Bank Ltd. Banks 5.54%
Yes Bank Ltd. Banks 4.18%
Maruti Suzuki India Ltd. Auto 4.06%
Hindalco Industries Ltd.Non - Ferrous Metals
3.60%
Mahindra & Mahindra Financial Services Ltd.
Finance 3.53%
Kansai Nerolac Paints Ltd.
Consumer Non Durables
3.36%
Petronet LNG Ltd. Gas 3.13%
Bata India Ltd.Consumer Durables
3.12%
ITC Ltd.Consumer Non Durables
3.11%
Cholamandalam Investment and Finance Company Ltd.
Finance 3.10%
Apollo Tyres Ltd. Auto Ancillaries 2.91%
State Bank of India Banks 2.80%
Carborundum Universal Ltd.
Industrial Products 2.76%
ICICI Bank Ltd. Banks 2.74%
Motherson Sumi Systems Ltd.
Auto Ancillaries 2.69%
Whirlpool of India Ltd.Consumer Durables
2.62%
Eicher Motors Ltd. Auto 2.60%
Bajaj Finserv Ltd. Finance 2.53%
The Federal Bank Ltd. Banks 2.34%
GAIL (India) Ltd. Gas 2.26%
NBCC (India) Ltd. Construction 2.25%
Mcleod Russel India Ltd.Consumer Non Durables
2.10%
Infosys Ltd. Software 2.10%
Tata Steel Ltd. Ferrous Metals 2.05%
LIC Housing Finance Ltd. Finance 2.01%
HCL Technologies Ltd. Software 1.99%
Pidilite Industries Ltd. Chemicals 1.92%
Central Depository Services (I) Ltd.
Finance 1.86%
AIA Engineering Ltd. Industrial Products 1.81%
Indraprastha Gas Ltd. Gas 1.76%
Security and Intelligence Services (I) Ltd.
Commercial Services
1.75%
Blue Star Ltd.Consumer Durables
1.55%
Britannia Industries Ltd.Consumer Non Durables
1.55%
Symphony Ltd.Consumer Durables
1.39%
Mahindra & Mahindra Ltd.
Auto 1.36%
Capital First Ltd. Finance 1.33%
The Ramco Cements Ltd. Cement 1.27%
Larsen & Toubro Ltd.Construction Project
1.17%
PORTFOLIO
Name of Instruments Ratings / Industries
% to Net Assets
Vedanta Ltd.Non - Ferrous Metals
1.13%
Karnataka Bank Ltd. Banks 1.04%
Sun TV Network Ltd.Media & Entertainment
0.96%
Tata Motors Ltd. Auto 0.80%
Sadbhav Engineering Ltd.Construction Project
0.66%
Total 98.79%
CBLO / Reverse Repo Investments 2.26%
Total 2.26%
Cash & Cash Equivalents
Net Receivable/Payable -1.05%
Total -1.05%
Grand Total 100.00%
INDUSTRIES/RATINGS
18.64%14.36%
10.12%8.82%8.68%
7.15%5.60%
4.73%4.57%4.09%
2.25%2.05%1.92%1.83%1.75%1.27%1.21%0.96%
BanksFinance
Consumer Non DurablesAuto
Consumer DurablesGas
Auto AncillariesNon - Ferrous Metals
Industrial ProductsSoftware
ConstructionFerrous Metals
ChemicalsConstruction ProjectCommercial Services
CementCash & Equivalent
Media & Entertainment
Baroda Pioneer ELSS’ 96
Investors understand that their principal will be at Moderately High risk
This product is suitable for investors who are seeking*• Capital growth over long term• Investment predominantly in equity and equity related
instruments.* Investors should consult their financial advisers if in doubt about whether the product is suitable for them.
INVESTMENT OBJECTIVE
The main objective of the scheme is to provide the investor long term capital growth as also tax benefit under section 80C of the Income Tax Act, 1961.
FUND DETAILS
Type of Scheme An Open Ended Tax Benefit-Cum-Growth Scheme
Date of Allotment March 31, 1996Fund Manager# Mr. Sanjay Chawla& (Experience
29 yrs) Mr. Dipak Acharya (Experience 13 yrs)
Benchmark S&P BSE 200*Monthly Average AUM (`)
107.13 Crs
Month end AUM (`) 108.94 Crs Minimum Investment ` 500/- & in multiples of ` 1/-
thereafterEntry Load NilExit Load NilPlans Plan A and Plan B (Direct)
Option A. Growth Option (default option in case no option specified by investor);B. Dividend Option C. Bonus Option$
SIP (Minimum) ` 500/month - 12 Installments` 1500/quarter - 4 Installments
RISk PROFILE 31 AUGUST 2017Standard deviation 17.98%Sharpe@ 0.31Beta 1.02Portfolio Turnover (last 12 months) 1.72
NAV AS ON 31 AUGUST 2017NAV (Per Unit) `Plan ADividend 32.4700Bonus 44.9900Growth 44.9900Plan B - DirectDividend 37.9200Bonus 47.5900Growth 47.5900
TOTAL EXPENSE RATIOPlan A 3.01%Plan B (Direct) 1.73%
$ The Bonus Option in the Schemes has been discontinued effective June 08, 2015 # For performance of the Scheme and other funds managed by the said Fund manager, either individually or jointly, please refer page no 19 - 22@risk free rate (FBIL Overnight MIBOR) 5.96%*For Disclaimer please refer page no 22& Mr. Chawla is managing the Scheme along with Mr. Acharya effective November 1, 2015
An Open Ended Tax Benefit - Cum - Growth Scheme
6

31st August, 2017
BARODA PIONEER MUTUAL FUND
Baroda Pioneer Mid-Cap Fund
Investors understand that their principal will be at High risk
This product is suitable for investors who are seeking*• Capital appreciation over long term.• Investment predominantly in equity and equity related
securities of growth oriented Mid-Cap stocks.* Investors should consult their financial advisers if in doubt about whether the product is suitable for them.
INVESTMENT OBJECTIVE
The primary objective of the Scheme is to generate capital appreciation by investing predominantly in a diversified portfolio of equity and equity related securities of growth oriented mid cap stocks. However, there is no assurance or guarantee that the investment objective of the Scheme will be realized
FUND DETAILS
Type of Scheme An Open Ended Equity Scheme
Date of Allotment October 4, 2010
Fund Manager# Mr. Sanjay Chawla (Experience 29 yrs) Mr. Dipak Acharya (Experience 13 yrs)
Benchmark S&P BSE Mid-cap index*Monthly Average AUM (`) 33.56 Crs
Month end AUM (`) 32.52 Crs
Minimum Investment` 5,000/- & in multiples of ` 1/- thereafter
Entry Load NA
Exit Load
1.00% if redeemed on or before 365 days from the date of allotment of units, Nil if redeemed after 365 days from the date of allotment of units
Plans Plan A and Plan B (Direct)
Option A. Growth Option (default option in case no option specified by investor);B. Dividend Option 1. Payout;2. Reinvestment (default sub-option in case no option specified by investor)C. Bonus Option$
SIP (Minimum) ` 500/month - 12 Installments` 1500/quarter - 4 Installments
PORTFOLIO
Name of Instruments Ratings / Industries
% to Net
Assets
EQUITY & EQUITY RELATED
Listed / awaiting listing on the stock exchanges
Bata India Ltd.Consumer Durables
3.97%
Bharat Financial Inclusion Ltd. Finance 3.84%
Carborundum Universal Ltd.Industrial Products
3.60%
NBCC (India) Ltd. Construction 3.58%
Essel Propack Ltd.Industrial Products
3.55%
JK Cement Ltd. Cement 3.51%
Cholamandalam Investment and Finance Company Ltd.
Finance 3.39%
Mahindra & Mahindra Financial Services Ltd.
Finance 3.36%
City Union Bank Ltd. Banks 3.33%
Balkrishna Industries Ltd. Auto Ancillaries 3.20%
Whirlpool of India Ltd.Consumer Durables
3.10%
BEML Ltd.Industrial Capital Goods
3.08%
Mcleod Russel India Ltd.Consumer Non Durables
3.08%
Dhanuka Agritech Ltd. Pesticides 3.00%
Astral Poly Technik Ltd.Industrial Products
3.00%
Indraprastha Gas Ltd. Gas 2.97%
Symphony Ltd.Consumer Durables
2.94%
K.P.R. Mill Ltd. Textile Products 2.88%
Karnataka Bank Ltd. Banks 2.87%
The Federal Bank Ltd. Banks 2.76%
Security and Intelligence Services (I) Ltd.
Commercial Services
2.76%
Central Depository Services (I) Ltd.
Finance 2.71%
Crompton Greaves Consumer Electricals Ltd.
Consumer Durables
2.55%
Gulf Oil Lubricants India Ltd.Petroleum Products
2.29%
AIA Engineering Ltd.Industrial Products
2.29%
Coffee Day Enterprises Ltd.Consumer Non Durables
2.09%
V.S.T Tillers Tractors Ltd. Auto 2.07%
Bajaj Electricals Ltd.Consumer Durables
2.03%
Mangalore Refinery and Petrochemicals Ltd.
Petroleum Products
2.02%
Blue Star Ltd.Consumer Durables
1.78%
Orient Cement Ltd. Cement 1.78%
Igarashi Motors India Ltd. Auto Ancillaries 1.75%
TVS Srichakra Ltd. Auto Ancillaries 1.68%
Tube Investment of India Ltd. Auto Ancillaries 1.16%
TI Financial Holdings Ltd. Finance 1.16%
DCB Bank Ltd. Banks 1.07%
Total 96.20%
CBLO / Reverse Repo Investments 5.22%
Total 5.22%
PORTFOLIO
Name of Instruments Ratings / Industries
% to Net
Assets
Cash & Cash Equivalents
Net Receivable/Payable -1.42%
Total -1.42%
Grand Total 100.00%
INDUSTRIES/RATINGS
16.37%14.46%
12.44%10.03%
7.79%5.29%5.17%
4.31%3.80%3.58%3.08%3.00%2.97%2.88%2.76%
2.07%
Consumer DurablesFinance
Industrial ProductsBanks
Auto AncillariesCement
Consumer Non DurablesPetroleum ProductsCash & Equivalent
ConstructionIndustrial Capital Goods
PesticidesGas
Textile ProductsCommercial Services
Auto
An Open Ended Equity Scheme
$ The Bonus Option in the Schemes has been discontinued effective June 08, 2015*For Disclaimer please refer page no 22 # For performance of the Scheme and other funds managed by the said Fund manager, either individually or jointly, please refer page no 19 - 22@risk free rate (FBIL Overnight MIBOR) 5.96%
7
RISk PROFILE 31 AUGUST 2017
Standard deviation 17.17%Sharpe@ -0.25Beta 0.93Portfolio Turnover (last 12 months) 2.35
NAV AS ON 31 AUGUST 2017
NAV (Per Unit) `Plan AGrowth 9.0000Dividend 9.0000Plan B - DirectGrowth 9.3300Dividend 9.3300
TOTAL EXPENSE RATIO
Plan A 3.06%Plan B (Direct) 2.04%

31st August, 2017
BARODA PIONEER MUTUAL FUND
Baroda Pioneer Large Cap Fund
Investors understand that their principal will be at Moderately High risk
This product is suitable for investors who are seeking*• Capital appreciation over long term• Investment predominantly in a diversified portfolio
of equity and equity related securities of Large Cap companies.* Investors should consult their financial advisers if in doubt about whether the product is suitable for them.
INVESTMENT OBJECTIVE
The primary objective of the Scheme is to generate capital appreciation by investing predominantly in a diversified portfolio of equity and equity related securities of large cap companies. The Scheme may also invest in debt and money market securities.However, there is no assurance or guarantee that the investment objective of the Scheme will be realized.
FUND DETAILS
Type of Scheme An Open Ended Equity SchemeDate of Allotment June 22, 2010Fund Manager# Mr. Sanjay Chawla (Experience 29 yrs)
Mr. Dipak Acharya (Experience 13 yrs)
Benchmark Nifty 100*Monthly Average AUM (`) 27.40 CrsMonth end AUM (`) 28.02 Crs Minimum Investment ` 5,000/- & in multiples of ` 1/-
thereafterEntry Load NAExit Load 1.00% if redeemed on or before 365
days from the date of allotment of units, Nil if redeemed after 365 days from the date of allotment of units
Plans Plan A and Plan B (Direct)
Option A. Growth Option (default option in case no option specified by investor);B. Dividend Option 1. Payout;2. Reinvestment (default sub-option in case no option specified by investor)C. Bonus Option$
SIP (Minimum) ` 500/month - 12 Installments` 1500/quarter - 4 Installments
PORTFOLIO
Name of Instruments Ratings / Industries
% to Net
Assets
EQUITY & EQUITY RELATED
Listed / awaiting listing on the stock exchanges
HDFC Bank Ltd. Banks 6.34%
Hindalco Industries Ltd.Non - Ferrous Metals
5.52%
Maruti Suzuki India Ltd. Auto 5.50%
State Bank of India Banks 5.20%
Larsen & Toubro Ltd.Construction Project
4.87%
ITC Ltd.Consumer Non Durables
4.53%
Yes Bank Ltd. Banks 4.38%
Ultratech Cement Ltd. Cement 4.28%
GAIL (India) Ltd. Gas 3.78%
ICICI Bank Ltd. Banks 3.72%
Hindustan Unilever Ltd.Consumer Non Durables
3.70%
Adani Ports and Special Economic Zone Ltd.
Transportation 3.51%
Axis Bank Ltd. Banks 2.68%
PNB Housing Finance Ltd. Finance 2.33%
Siemens Ltd.Industrial Capital Goods
2.29%
Mahindra & Mahindra Financial Services Ltd.
Finance 2.29%
Reliance Industries Ltd. Petroleum Products 2.28%
Eicher Motors Ltd. Auto 2.24%
Bank of Baroda Banks 2.21%
Colgate Palmolive (India) Ltd.Consumer Non Durables
2.18%
Zee Entertainment Enterprises Ltd.
Media & Entertainment
2.04%
Ambuja Cements Ltd. Cement 2.00%
Power Grid Corporation of India Ltd.
Power 1.96%
Nestle India Ltd.Consumer Non Durables
1.91%
Vedanta Ltd.Non - Ferrous Metals
1.65%
Cummins India Ltd. Industrial Products 1.63%
HCL Technologies Ltd. Software 1.54%
Bharti Airtel Ltd. Telecom - Services 1.53%
Mahindra & Mahindra Ltd. Auto 1.44%
Tata Power Company Ltd. Power 1.41%
Indian Oil Corporation Ltd. Petroleum Products 1.30%
Tata Motors Ltd. Auto 1.17%
Tata Steel Ltd. Ferrous Metals 0.68%
Total 94.09%
CBLO / Reverse Repo Investments 2.92%
Total 2.92%
Cash & Cash Equivalents
Net Receivable/Payable 2.99%
Total 2.99%
Grand Total 100.00%
INDUSTRIES/RATINGS
24.53%12.32%
10.35%7.17%
6.28%5.91%
4.87%4.62%
3.78%3.58%3.51%3.37%
2.29%2.04%1.63%1.54%1.53%
0.68%
BanksConsumer Non Durables
AutoNon - Ferrous Metals
CementCash & Equivalent
Construction ProjectFinance
GasPetroleum Products
TransportationPower
Industrial Capital GoodsMedia & Entertainment
Industrial ProductsSoftware
Telecom - ServicesFerrous Metals
An Open Ended Equity Scheme
$ The Bonus Option in the Schemes has been discontinued effective June 08, 2015 # For performance of the Scheme and other funds managed by the said Fund manager, either individually or jointly, please refer page no 19 - 22*For Disclaimer please refer page no 22@risk free rate (FBIL Overnight MIBOR) 5.96%
8
RISk PROFILE 31 AUGUST 2017
Standard deviation 16.16%
Sharpe@ 0.12
Beta 1.02
Portfolio Turnover (last 12 months) 2.06
NAV AS ON 31 AUGUST 2017
NAV (Per Unit) `
Plan AGrowth 13.5400
Dividend 12.4600
Plan B - DirectGrowth 13.9600
Dividend 12.8700
TOTAL EXPENSE RATIO
Plan A 3.13%
Plan B (Direct) 1.91%

31st August, 2017
BARODA PIONEER MUTUAL FUND
Baroda Pioneer Banking and Financial Services Fund
Investors understand that their principal will be atHigh risk
This product is suitable for investors who are seeking*• Capital appreciation over long term• Investment predominantly in equity and equity related
securities of companies engaged in the Banking & Financial Services Sector* Investors should consult their financial advisers if in doubt about whether the product is suitable for them.
INVESTMENT OBJECTIVE
The investment objective is to generate long-term capital appreciation for unit holders from a portfolio invested predominantly in equity and equity related securities of companies engaged in the Banking & Financial Services Sector.
FUND DETAILS
Type of Scheme An Open Ended Sectoral Scheme
Date of Allotment June 22, 2012
Fund Manager# Mr. Dipak Acharya(Experience 13 yrs)
Benchmark Nifty Bank Index*
Monthly Average AUM (`) 42.21 Crs
Month end AUM (`) 41.73 Crs
Minimum Investment ` 5,000/- & in multiples of ` 1/- thereafter
Entry Load NA
Exit Load Exit Load - 1.00% if redeemed on or before 365 days from the date of allotment of units, Nil if redeemed after 365 days from the date of allotment of units
Plans Plan A and Plan B (Direct)
Option A. Growth Option (default option in case no option specified by investor);B. Dividend Option 1. Payout;2. Reinvestment (default sub-option in case no option specified by investor)C. Bonus Option$
SIP (Minimum) ` 500/month - 12 Installments` 1500/quarter - 4 Installments
RISk PROFILE 31 AUGUST 2017Standard deviation 18.43%Sharpe@ 0.42Beta 0.93Portfolio Turnover (last 12 months) 1.77
NAV AS ON 31 AUGUST 2017NAV (Per Unit) `Plan AGrowth 20.4400Dividend 17.3800Bonus 20.4400Plan B - DirectGrowth 21.2300Dividend 18.1100Bonus NA
TOTAL EXPENSE RATIOPlan A 3.08%Plan B (Direct) 2.34%
PORTFOLIO
Name of Instruments Ratings / Industries
% to Net Assets
EQUITY & EQUITY RELATED
Listed / awaiting listing on the stock exchanges
HDFC Bank Ltd. Banks 22.32%
ICICI Bank Ltd. Banks 13.55%
Yes Bank Ltd. Banks 10.07%
State Bank of India Banks 9.97%
IndusInd Bank Ltd. Banks 6.94%
Kotak Mahindra Bank Ltd. Banks 6.42%
Axis Bank Ltd. Banks 5.99%
The Federal Bank Ltd. Banks 3.47%
Bank of Baroda Banks 3.30%
Mahindra & Mahindra Financial Services Ltd.
Finance 3.07%
Bajaj Finserv Ltd. Finance 2.63%
LIC Housing Finance Ltd. Finance 2.42%
Cholamandalam Investment and Finance Company Ltd.
Finance 2.09%
Central Depository Services (I) Ltd.
Finance 1.62%
City Union Bank Ltd. Banks 1.14%
Karnataka Bank Ltd. Banks 1.09%
Total 96.09%
CBLO / Reverse Repo Investments 0.14%
Total 0.14%
Cash & Cash Equivalents
Net Receivable/Payable 3.77%
Total 3.77%
Grand Total 100.00%
INDUSTRIES/RATINGS
84.26%
11.83%
3.91%
Banks
Finance
Cash & Equivalent
An Open Ended Sectoral Scheme
$ The Bonus Option in the Schemes has been discontinued effective June 08, 2015 # For performance of the Scheme and other funds managed by the said Fund manager, either individually or jointly, please refer page no 19 - 22*For Disclaimer please refer page no 22@risk free rate (FBIL Overnight MIBOR) 5.96%
9

31st August, 2017
BARODA PIONEER MUTUAL FUND
Baroda Pioneer Balance Fund
Investors understand that their principal will be at Moderately High risk
This product is suitable for investors who are seeking*• Capital appreciation along with stability over long term• Investment predominantly in equity and equity related
instruments with balance exposure to money market instruments and debt securities.* Investors should consult their financial advisers if in doubt about whether the product is suitable for them.
INVESTMENT OBJECTIVE
The scheme is targeted for long-term capital appreciation along with stability through a well balanced portfolio comprising of equity, equity related instruments, money market instrument and debt securities.
FUND DETAILS
Type of Scheme An Open Ended Balanced Scheme
Date of Allotment September 12, 2003
Fund Manager# Mr. Sanjay Chawla& (Experience 29 yrs) Mr. Dipak Acharya (Experience 13 yrs)
Benchmark CRISIL Balanced Fund Aggressive index(effective April 4, 2016)
Monthly Average AUM (`) 330.06 CrsMonth end AUM (`) 338.78 Crs
Minimum Investment ` 5,000/- & in multiples of ` 1/- thereafter
Entry Load NA
Exit Load 1% if redeemed on or before 12 months from the date of allotment of units, Nil if redeemed after 12 months from the date of allotment of units
Plans Plan A and Plan B (Direct)
Option A. Growth Option (default option in case no option specified by investor);B. Dividend Option 1. Payout;2. Reinvestment (default sub-option in case no option specified by investor)C. Bonus Option$
SIP (Minimum) ` 500/month - 12 Installments` 1500/quarter - 4 Installments
RISk PROFILE 31 AUGUST 2017Standard deviation 11.03%Sharpe@ 0.46Beta 1.08Portfolio Turnover (last 12 months) 1.95
NAV AS ON 31 AUGUST 2017NAV (Per Unit) `Plan AGrowth 54.0400Dividend 18.7400Bonus NAPlan B - DirectGrowth 56.8700Dividend 20.3100
TOTAL EXPENSE RATIOPlan A 3.08%Plan B (Direct) 1.86%
$ The Bonus Option in the Schemes has been discontinued effective June 08, 2015 # For performance of the Scheme and other funds managed by the said Fund manager, either individually or jointly, please refer page no 19 - 22@risk free rate (FBIL Overnight MIBOR) 5.96% & Mr. Chawla is managing the Scheme along with Mr. Acharya effective November 1, 2015
PORTFOLIO
Name of Instruments Ratings / Industries
% to Net
Assets
EQUITY & EQUITY RELATED
Listed / awaiting listing on the stock exchanges
HDFC Bank Ltd. Banks 4.72%
Maruti Suzuki India Ltd. Auto 4.09%
Yes Bank Ltd. Banks 3.88%
Hindalco Industries Ltd.Non - Ferrous Metals
3.06%
Mahindra & Mahindra Financial Services Ltd.
Finance 3.03%
ITC Ltd.Consumer Non Durables
2.92%
Petronet LNG Ltd. Gas 2.55%
Bata India Ltd.Consumer Durables
2.41%
Motherson Sumi Systems Ltd. Auto Ancillaries 2.37%
KEC International Ltd.Construction Project
2.26%
Kansai Nerolac Paints Ltd.Consumer Non Durables
2.25%
Cholamandalam Investment and Finance Company Ltd.
Finance 2.23%
ICICI Bank Ltd. Banks 2.20%
Carborundum Universal Ltd. Industrial Products 2.19%
Indraprastha Gas Ltd. Gas 1.88%
Eicher Motors Ltd. Auto 1.86%
GAIL (India) Ltd. Gas 1.84%
State Bank of India Banks 1.80%
Whirlpool of India Ltd.Consumer Durables
1.75%
Mcleod Russel India Ltd.Consumer Non Durables
1.72%
NBCC (India) Ltd. Construction 1.66%
Apollo Tyres Ltd. Auto Ancillaries 1.61%
Pidilite Industries Ltd. Chemicals 1.52%Central Depository Services (I) Ltd.
Finance 1.50%
Bharat Forge Ltd. Industrial Products 1.50%
The Federal Bank Ltd. Banks 1.49%Bajaj Finserv Ltd. Finance 1.46%Security and Intelligence Services (I) Ltd.
Commercial Services
1.46%
Bajaj Electricals Ltd.Consumer Durables
1.23%
Interglobe Aviation Ltd. Transportation 1.12%
Ambuja Cements Ltd. Cement 1.04%
Sun TV Network Ltd.Media & Entertainment
1.03%
IPCA Laboratories Ltd. Pharmaceuticals 0.99%
Mahindra & Mahindra Ltd. Auto 0.89%
Vedanta Ltd.Non - Ferrous Metals
0.87%
The Ramco Cements Ltd. Cement 0.82%
Larsen & Toubro Ltd.Construction Project
0.78%
HCL Technologies Ltd. Software 0.77%
Total 72.75%
CENTRAL GOVERNMENT SECURITIES
6.79% CGL 2029 Sovereign 2.06%7.61% CGL 2030 Sovereign 1.55%7.88% CGL 2030 Sovereign 0.57%8.24% CGL 2027 Sovereign 0.42%8.83% CGL 2023 Sovereign 0.16%8.60% CGL 2028 Sovereign 0.03%8.28% CGL 2027 Sovereign 0.03%
Total 4.82%
PORTFOLIO
Name of Instruments Ratings / Industries
% to Net
Assets
STATE GOVERNMENT SECURITIES
9.72% SDL 2023 Sovereign 0.99%
Total 0.99%
BONDS & NCDs
Listed / awaiting listing on the stock exchanges
ICICI Bank Ltd. [ICRA]AA+ 4.55%
IndusInd Bank Ltd. CRISIL AA 4.53%
Bank of Baroda CRISIL AA+ 4.14%
Vijaya Bank [ICRA]AA- 1.49%
Dewan Housing Finance Corporation Ltd.
CARE AAA 0.62%
Rural Electrification Corporation Ltd.
CRISIL AAA 0.27%
Total 15.60%
CBLO / Reverse Repo Investments 4.40%
Total 4.40%
Cash & Cash Equivalents
Net Receivable/Payable 1.44%
Total 1.44%
Grand Total 100.00%
All corporate ratings are assigned by rating agencies like CRISIL; CARE; ICRA; IND.
INDUSTRIES/RATINGS
14.09%8.22%
6.89%6.84%
6.27%5.84%5.81%
5.39%4.55%4.53%
4.14%3.98%3.93%3.69%
3.04%1.86%1.66%1.52%1.49%1.46%1.12%1.03%0.99%0.77%0.62%0.27%
BanksFinance
Consumer Non DurablesAutoGas
Cash & EquivalentSovereign
Consumer Durables[ICRA]AA+CRISIL AA
CRISIL AA+Auto Ancillaries
Non - Ferrous MetalsIndustrial Products
Construction ProjectCement
ConstructionChemicals[ICRA]AA-
Commercial ServicesTransportation
Media & EntertainmentPharmaceuticals
SoftwareCARE AAACRISIL AAA
An Open Ended Balanced Scheme
10

31st August, 2017
BARODA PIONEER MUTUAL FUND
Baroda Pioneer Monthly Income Plan (MIP) Fund
Investors understand that their principal will be at Moderate risk
This product is suitable for investors who are seeking*• Regular Income and capital appreciation over medium
term with providing liquidity• Investment in debt and money market instruments and
in equity and equity related instruments.* Investors should consult their financial advisers if in doubt about whether the product is suitable for them.
INVESTMENT OBJECTIVE
To generate regular income through investment in debt and money market instruments and also to generate long-term capital appreciation by investing a portion in equity and equity related instruments.
FUND DETAILS
Type of Scheme An Open Ended Income Scheme with no assured returns.
Date of Allotment September 08, 2004
Fund Manager Ms. Hetal Shah#
(Experience 15 yrs)
Benchmark CRISIL MIP Blended Index
Monthly Average AUM (`) 28.21 Crs
Month end AUM (`) 28.07 Crs
Minimum Investment ` 5,000/- & in multiples of ` 1/- thereafter
Entry Load NA
Exit Load NIL
Plans Plan A and Plan B (Direct)
Options • Growth (default option in case no option specified by investor);• Monthly Dividend (default) 1. Payout 2. Reinvestment ((default sub-option in case no option specified by investor)• Quarterly Dividend 1. Payout 2. Reinvestment (default sub-option in case no option specified by investor)• Bonus Option$
SIP (Minimum) ` 500/month - 12 Installments` 1500/quarter - 4 Installments
NAV AS ON 31 AUGUST 2017
NAV (Per Unit) `Plan AGrowth 22.0034Dividend - Monthly 13.7263Dividend - Quarterly 13.4855Plan B - Direct
Growth 22.8642Dividend - Monthly 14.0448Dividend - Quarterly 13.8345
PORTFOLIO CHARACTERISTIC
Average Maturity (Days) 2432.95Modified Duration (Years) 4.35Portfolio Yield (%) 6.77
TOTAL EXPENSE RATIO
Plan A 2.44%Plan B (Direct) 1.72%
$ The Bonus Option in the Schemes has been discontinued effective June 08, 2015 # For performance of the Scheme and other funds managed by the said Fund manager, either individually or jointly, please refer page no 19 - 22
PORTFOLIO
Name of Instruments Ratings / Industries
% to Net
Assets
EQUITY & EQUITY RELATEDListed / awaiting listing on the stock exchangesSecurity and Intelligence Services (I) Ltd.
Commercial Services
1.82%
Mahindra & Mahindra Financial Services Ltd.
Finance 0.99%
ICICI Bank Ltd. Banks 0.96%
HDFC Bank Ltd. Banks 0.95%
Hindalco Industries Ltd.Non - Ferrous Metals
0.85%
Kansai Nerolac Paints Ltd.Consumer Non Durables
0.72%
BEML Ltd.Industrial Capital Goods
0.63%
Bharat Financial Inclusion Ltd.
Finance 0.63%
Cholamandalam Investment and Finance Company Ltd.
Finance 0.62%
Bata India Ltd.Consumer Durables
0.61%
ITC Ltd.Consumer Non Durables
0.60%
LIC Housing Finance Ltd. Finance 0.60%
State Bank of India Banks 0.59%
Tata Steel Ltd. Ferrous Metals 0.57%
Maruti Suzuki India Ltd. Auto 0.55%
Carborundum Universal Ltd.Industrial Products
0.50%
Indraprastha Gas Ltd. Gas 0.50%
Apollo Tyres Ltd. Auto Ancillaries 0.47%
PVR Ltd.Media & Entertainment
0.47%
Vedanta Ltd.Non - Ferrous Metals
0.44%
Coffee Day Enterprises Ltd.Consumer Non Durables
0.43%
Whirlpool of India Ltd.Consumer Durables
0.42%
Karnataka Bank Ltd. Banks 0.40%
GAIL (India) Ltd. Gas 0.40%
Hindustan Unilever Ltd.Consumer Non Durables
0.39%
Nestle India Ltd.Consumer Non Durables
0.38%
NBCC (India) Ltd. Construction 0.36%
JK Cement Ltd. Cement 0.36%
Petronet LNG Ltd. Gas 0.32%
Central Depository Services (I) Ltd.
Finance 0.30%
Orient Cement Ltd. Cement 0.30%
IPCA Laboratories Ltd. Pharmaceuticals 0.30%
Bank of Baroda Banks 0.27%
Mcleod Russel India Ltd.Consumer Non Durables
0.25%
Bharti Airtel Ltd.Telecom - Services
0.23%
Pidilite Industries Ltd. Chemicals 0.22%
The Federal Bank Ltd. Banks 0.12%
Total 19.52%
CENTRAL GOVERNMENT SECURITIES
8.60% CGL 2028 Sovereign 11.92%
7.61% CGL 2030 Sovereign 11.23%
7.88% CGL 2030 Sovereign 9.54%
7.59% CGL 2026 Sovereign 3.73%
6.79% CGL 2029 Sovereign 3.55%
PORTFOLIO
Name of Instruments Ratings / Industries
% to Net
Assets
8.24% CGL 2027 Sovereign 1.94%
7.59% CGL 2029 Sovereign 1.86%
Total 43.77%
BONDS & NCDs
Listed / awaiting listing on the stock exchanges
IndusInd Bank Ltd. CRISIL AA 3.65%
India Infoline Housing Finance Ltd.
[ICRA]AA 2.78%
IIFL Facilities Services Ltd. [ICRA]AA 2.27%
Power Grid Corporation of India Ltd.
[ICRA] AAA 2.25%
Total 10.95%
CBLO / Reverse Repo Investments 24.91%
Total 24.91%
Cash & Cash Equivalents
Net Receivable/Payable 0.85%
Total 0.85%
Grand Total 100.00%
All corporate ratings are assigned by rating agencies like CRISIL; CARE; ICRA; IND.
RATING PROFILE
43.77%25.76%
5.05%3.65%3.29%3.14%2.77%2.25%1.82%1.29%1.22%1.03%0.66%0.63%0.57%0.55%0.50%0.47%0.47%0.36%0.30%0.23%0.22%
SovereignCash & Equivalent
[ICRA]AACRISIL AA
BanksFinance
Consumer Non Durables[ICRA] AAA
Commercial ServicesNon - Ferrous Metals
GasConsumer Durables
CementIndustrial Capital Goods
Ferrous MetalsAuto
Industrial ProductsAuto Ancillaries
Media & EntertainmentConstruction
PharmaceuticalsTelecom - Services
Chemicals
INSTRUMENTS
43.77%
24.91%
19.52%
10.95%0.85%
CENTRALGOVERNMENTSECURITIES
CBLO / Reverse RepoInvestments
EQUITY & EQUITYRELATED
BONDS & NCDs
Cash & CashEquivalents
An Open Ended Income Scheme with no assured returns.(Monthly income is not assured and is subject to the availability of distributable surplus.)
11

31st August, 2017
BARODA PIONEER MUTUAL FUND
Baroda Pioneer Credit Opportunities Fund
Investors understand that their principal will be at Moderate risk
This product is suitable for investors who are seeking*• Income over medium term.• Investment in a mix of debt and money market
instruments across the credit and maturity spectrum.* Investors should consult their financial advisers if in doubt about whether the product is suitable for them.
INVESTMENT OBJECTIVE
The primary objective of the Scheme is to generate returns by investing in debt and money market instruments across the credit spectrum. There is no assurance or guarantee that the investment objective of the Scheme will be realized.
FUND DETAILS
Type of Scheme An Open Ended Debt SchemeDate of Allotment January 23, 2015Fund Manager Mr. Alok Sahoo#
(Experience 17 yrs), Mr. Karn Kumar&
(Experience 13 yrs)
Benchmark CRISIL Short Term Bond Fund Index
Monthly Average AUM (`)
836.57 Crs
Month end AUM (`) 898.81 CrsMinimum Investment ` 5,000/- & in multiples of ` 1/-
thereafterEntry Load NAExit Load If units are redeemed upto 10%
of the units, on or before one year from the date of allotment : NilIf units are redeemed over and above the 10% limit, on or before one year from the date of allotment : 1% of the applicable Net Asset Value (NAV) If units are redeemed after one year from the date of allotment : Nil
Plans Plan A and Plan B (Direct)
Options • Growth (default option in case no option specified by investor);• Monthly Dividend 1.Payout 2.Reinvestment (default sub-option in case no option specified by investor)• Quarterly Dividend 1.Payout 2.Reinvestment (default sub-option in case no option specified by investor)• Bonus Option$
SIP (Minimum) ` 500/month - 12 Installments` 1500/quarter - 4 Installments
PORTFOLIO CHARACTERISTIC
Average Maturity (Days) 1000.44Modified Duration (Years) 2.05Portfolio Yield (%) 8.16
TOTAL EXPENSE RATIO
Plan A 1.97%Plan B (Direct) 0.67%
$ The Bonus Option in the Schemes has been discontinued effective June 08, 2015 # For performance of the Scheme and other funds, if any, managed by the said Fund manager, either individually or jointly, please refer page no 19 - 22& Mr. Karn Kumar is managing the Scheme along with Mr. Alok Sahoo effective July 24, 2017
PORTFOLIO
Name of Instruments Ratings / Industries
% to Net
Assets
MONEY MARkET INSTRUMENT
Commercial Paper**
Adani Enterprises Ltd. BWR A1+ 3.32%
Peninsula Land Ltd. [ICRA]A1 5.47%
Total 8.79%
CENTRAL GOVERNMENT SECURITIES
6.79% CGL 2029 Sovereign 1.27%
8.40% CGL 2024 Sovereign 0.36%
7.61% CGL 2030 Sovereign 0.12%
Total 1.75%
BONDS & NCDsListed / awaiting listing on the stock exchanges
Piramal Enterprises Ltd. [ICRA]AA 6.71%
Edelweiss Commodities Services Ltd.
[ICRA]AA 6.27%
Aspire Home Finance Corporation Ltd.
[ICRA]AA- 5.84%
Dewan Housing Finance Corporation Ltd.
CARE AAA 4.51%
IIFL Facilities Services Ltd. [ICRA]AA 4.18%
India Infoline Housing Finance Ltd.
CRISIL AA 3.74%
Apollo Hospitals Enterprise Ltd. CRISIL AA 3.72%
IndusInd Bank Ltd. CRISIL AA 3.42%
Edelweiss Housing Finance Ltd. [ICRA]AA 2.91%
Power Finance Corporation Ltd. [ICRA]AAA 2.88%
ICICI Bank Ltd. [ICRA]AA+ 2.86%
Indian Railway Finance Corporation Ltd.
[ICRA]AAA 2.46%
Bank of Baroda CARE AA 2.27%
Bank of Baroda CRISIL AA+ 1.23%
HDFC Bank Ltd. CRISIL AA+ 1.14%
Janalakshmi Financial Services Ltd.
[ICRA]A 0.67%
Total 54.81%
UnlistedARM Infra & Utilities Private Ltd. BWR A1+ (so) 5.01%
IIFL Wealth Finance Ltd. [ICRA]AA 4.49%
Cyquator Media Services Private Ltd.
BWR A1+ (so) 4.46%
Janalakshmi Financial Services Ltd.
[ICRA]A 1.98%
Total 15.94%
Investment Funds/Mutual FundsBaroda Pioneer Liquid Fund - Plan B (Direct) - Growth Option
[ICRA]A1+mfs 2.79%
Total 2.79%
CBLO /Reverse Repo investments 14.28%
Total 14.28%
Cash & Cash Equivalents
Net Receivable/Payable 1.64%
Total 1.64%
Grand Total 100.00%
All corporate ratings are assigned by rating agencies like CRISIL; CARE; ICRA; IND.**Thinly traded / Non traded securities and illiquid securities as defined in SEBI Regulations and Guidelines.
RATING PROFILE
24.56%
15.92%
10.88%
9.47%
5.84%
5.47%
5.34%
4.51%
3.32%
2.86%
2.65%
2.37%
2.27%
1.75%
[ICRA]AA
Cash & Equivalent
CRISIL AA
BWR A1+ (so)
[ICRA]AA-
[ICRA]A1
[ICRA]AAA
CARE AAA
BWR A1+
[ICRA]AA+
[ICRA]A
CRISIL AA+
CARE AA
Sovereign
INSTRUMENTS
54.81%15.94%
14.28%
8.79%
2.79%1.75%
1.64%BONDS & NCDsUnlistedCBLO / Reverse RepoInvestmentsMONEY MARKETINSTRUMENTInvestmentFunds/Mutual FundsCENTRALGOVERNMENTSECURITIESCash & CashEquivalents
NAV AS ON 31 AUGUST 2017
NAV (Per Unit) `Plan ABonus NAGrowth 13.0347Dividend - Quarterly 10.9343Dividend - Monthly 10.9198Plan B - Direct
Bonus 13.4538Growth 13.4538Dividend - Quarterly 11.2882Dividend - Monthly 11.3290
An Open Ended Debt Scheme
12

31st August, 2017
BARODA PIONEER MUTUAL FUND
Baroda Pioneer Gilt Fund
Investors understand that their principal will be at Moderate risk
This product is suitable for investors who are seeking*
• Credit risk free regular Income over long term
• Investment only in Government (both Central and State Government) Securities* Investors should consult their financial advisers if in doubt about whether the product is suitable for them.
INVESTMENT OBJECTIVE
To generate income by investing in a portfolio of Government securities.
FUND DETAILS
Type of Scheme An Open Ended Gilt SchemeDate of Allotment March 21, 2002Fund Manager Ms. Hetal Shah#
(Experience 15 yrs)
Benchmark I SEC-MI BEXMonthly Average AUM (`)
46.67 Crs
Month end AUM (`) 46.57 CrsMinimum Investment ` 5,000/- & in multiples of ` 1/-
thereafterEntry Load NAExit Load 0.25% if redeemed on or before
1 month (30 days) from the date of allotment of units. Nil if redeemed after 1 month (30 days) from the date of allotment of units
Plans Plan A and Plan B (Direct)Options • Growth (default option in case no
option specified by investor);• Dividend 1 .Payout 2 .Reinvestment (default sub-option in case no option specified by investor)• Bonus Option$
SIP (Minimum) ` 500/month - 12 Installments` 1500/quarter - 4 Installments
NAV AS ON 31 AUGUST 2017
NAV (Per Unit) `Plan AGrowth 26.7508Dividend 20.5017Plan B - DirectGrowth 27.9214Dividend 24.1722
PORTFOLIO CHARACTERISTIC
Average Maturity (Days) 2978.00Modified Duration (Years) 5.37Portfolio Yield (%) 6.73
TOTAL EXPENSE RATIO
Plan A 1.97%
Plan B (Direct) 1.18%
PORTFOLIO
Name of Instruments Ratings / Industries
% to Net Assets
CENTRAL GOVERNMENT SECURITIES
7.59% CGL 2029 Sovereign 17.52%
7.61% CGL 2030 Sovereign 13.53%
7.88% CGL 2030 Sovereign 10.25%
8.33% CGL 2026 Sovereign 8.20%
8.24% CGL 2027 Sovereign 7.47%
8.28% CGL 2027 Sovereign 5.63%
8.83% CGL 2023 Sovereign 2.85%
8.60% CGL 2028 Sovereign 1.68%
7.59% CGL 2026 Sovereign 1.12%
6.79% CGL 2029 Sovereign 1.07%
Total 69.32%
STATE GOVERNMENT SECURITIES
9.39% SDL 2023 Sovereign 5.94%
Total 5.94%
CBLO / Reverse Repo Investments 23.08%
Total 23.08%
Cash & Cash Equivalents
Net Receivable/Payable 1.66%
Total 1.66%
Grand Total 100.00%
RATING PROFILE
75.26%
24.74%
Sovereign
Cash & Equivalent
INSTRUMENTS
69.32%
23.08%
5.94%1.66% CENTRAL
GOVERNMENTSECURITIES
CBLO / Reverse RepoInvestments
STATE GOVERNMENTSECURITIES
Cash & CashEquivalents
$ The Bonus Option in the Schemes has been discontinued effective June 08, 2015 # For performance of the Scheme and other funds managed by the said Fund manager, either individually or jointly, please refer page no 19 - 22
An Open Ended Gilt Scheme
13

31st August, 2017
BARODA PIONEER MUTUAL FUND
Baroda Pioneer Income Fund
Investors understand that their principal will be at Moderate risk
This product is suitable for investors who are seeking*• Regular Income over long term• Investment predominantly in good quality Fixed Income
Securities by maintaining a balance between Risk & Return.* Investors should consult their financial advisers if in doubt about whether the product is suitable for them.
INVESTMENT OBJECTIVE
To generate regular income by investing in a portfolio of good quality Fixed Income Securities by maintaining a balance between Risk & Return.
FUND DETAILS
Type of Scheme An Open Ended Income SchemeDate of Allotment March 21, 2002Fund Manager Ms. Hetal Shah#
(Experience 15 yrs)
Benchmark CRISIL Composite Bond Fund IndexMonthly Average AUM (`)
23.65 Crs
Month end AUM (`) 23.46 CrsMinimum Investment ` 5,000/- & in multiples of ` 1/-
thereafterEntry Load NAExit Load If units are redeemed upto 10%
of the units, on or before one year from the date of allotment : NilIf units are redeemed over and above the 10% limit, on or before one year from the date of allotment : 1% of the applicable Net Asset Value (NAV) If units are redeemed after one year from the date of allotment : Nil
Plans Plan A and Plan B (Direct)
Options • Growth (default option in case no option specified by investor);• Dividend 1.Payout 2.Reinvestment (default sub-option in case no option specified by investor)• Bonus Option$
SIP (Minimum) ` 500/month - 12 Installments` 1500/quarter - 4 Installments
NAV AS ON 31 AUGUST 2017
NAV (Per Unit) `Plan AGrowth 26.2577Dividend 23.1132Plan B - DirectGrowth 27.2820Dividend 23.3679
PORTFOLIO CHARACTERISTIC
Average Maturity (Days) 2627.38Modified Duration (Years) 5.11Portfolio Yield (%) 7.38
TOTAL EXPENSE RATIO
Plan A 2.49%Plan B (Direct) 1.88%
PORTFOLIO
Name of Instruments Ratings / Industries
% to Net Assets
CENTRAL GOVERNMENT SECURITIES
7.59% CGL 2026 Sovereign 11.16%
8.40% CGL 2024 Sovereign 9.27%
7.88% CGL 2030 Sovereign 9.13%
8.83% CGL 2023 Sovereign 8.48%
8.33% CGL 2026 Sovereign 6.98%
8.60% CGL 2028 Sovereign 4.28%
7.59% CGL 2029 Sovereign 2.23%
Total 51.53%
STATE GOVERNMENT SECURITIES
9.35% SDL 2024 Sovereign 3.56%
8.58% SDL 2023 Sovereign 3.22%
9.39% SDL 2023 Sovereign 2.04%
8.60% SDL 2023 Sovereign 0.61%
Total 9.43%
BONDS & NCDs
Listed / awaiting listing on the stock exchanges
IndusInd Bank Ltd. CRISIL AA 8.73%
Edelweiss Commodities Services Ltd.
[ICRA]AA 8.57%
Indian Railway Finance Corporation Ltd.
[ICRA]AAA 7.92%
Dewan Housing Finance Corporation Ltd.
CARE AAA 7.91%
Total 33.13%
CBLO / Reverse Repo Investments 3.60%
Total 3.60%
Cash & Cash Equivalents
Net Receivable/Payable 2.31%
Total 2.31%
Grand Total 100.00%
All corporate ratings are assigned by rating agencies like CRISIL; CARE; ICRA; IND.
RATING PROFILE
60.96%
8.73%
8.57%
7.92%
7.91%
5.91%
Sovereign
CRISIL AA
[ICRA]AA
[ICRA]AAA
CARE AAA
Cash & Equivalent
INSTRUMENTS
51.53%
33.13%
9.43%
3.60% 2.31% CENTRALGOVERNMENTSECURITIES
BONDS & NCDs
STATE GOVERNMENTSECURITIES
CBLO / Reverse RepoInvestments
Cash & CashEquivalents
$ The Bonus Option in the Schemes has been discontinued effective June 08, 2015# For performance of the Scheme and other funds managed by the said Fund manager, either individually or jointly, please refer page no 19 - 22
An Open Ended Income Scheme
14
31st August, 2017
BARODA PIONEER MUTUAL FUND
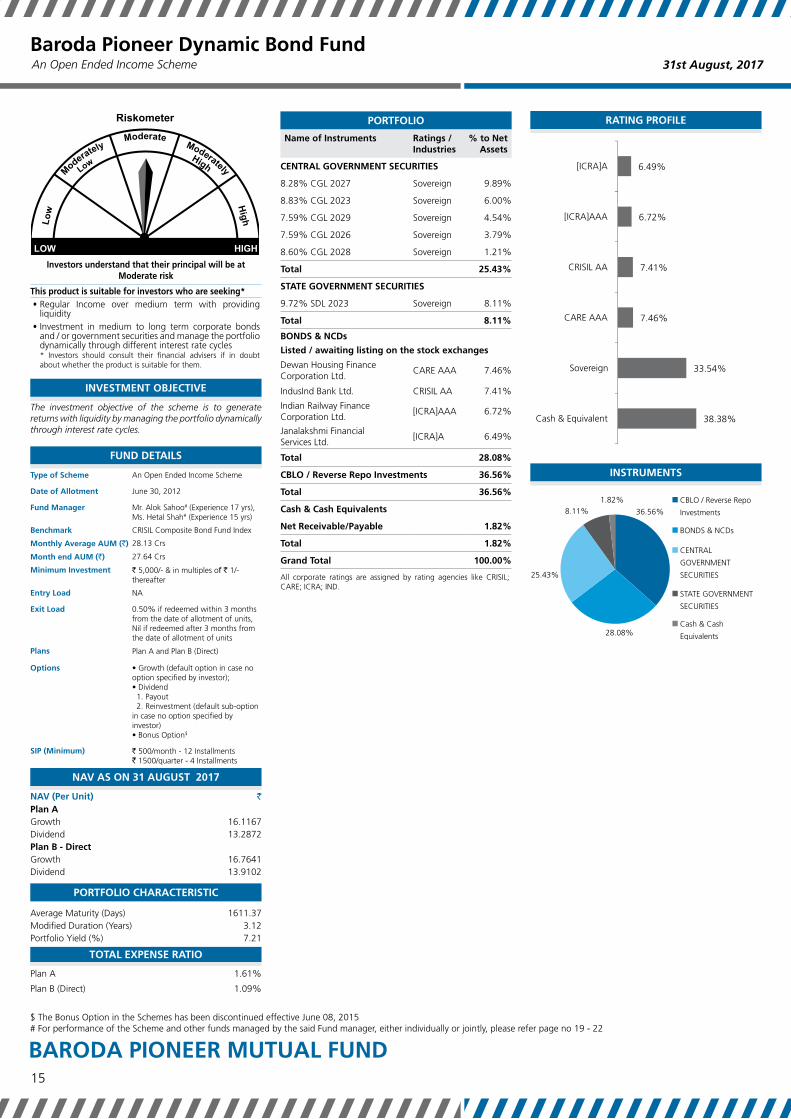
Baroda Pioneer Dynamic Bond Fund
Investors understand that their principal will be at Moderate risk
This product is suitable for investors who are seeking*• Regular Income over medium term with providing
liquidity• Investment in medium to long term corporate bonds
and / or government securities and manage the portfolio dynamically through different interest rate cycles* Investors should consult their financial advisers if in doubt about whether the product is suitable for them.
INVESTMENT OBJECTIVE
The investment objective of the scheme is to generate returns with liquidity by managing the portfolio dynamically through interest rate cycles.
FUND DETAILS
Type of Scheme An Open Ended Income Scheme
Date of Allotment June 30, 2012
Fund Manager Mr. Alok Sahoo# (Experience 17 yrs), Ms. Hetal Shah# (Experience 15 yrs)
Benchmark CRISIL Composite Bond Fund Index
Monthly Average AUM (`) 28.13 Crs
Month end AUM (`) 27.64 Crs
Minimum Investment ` 5,000/- & in multiples of ` 1/- thereafter
Entry Load NA
Exit Load 0.50% if redeemed within 3 months from the date of allotment of units, Nil if redeemed after 3 months from the date of allotment of units
Plans Plan A and Plan B (Direct)
Options • Growth (default option in case no option specified by investor);• Dividend 1. Payout 2. Reinvestment (default sub-option in case no option specified by investor)• Bonus Option$
SIP (Minimum) ` 500/month - 12 Installments` 1500/quarter - 4 Installments
NAV AS ON 31 AUGUST 2017
NAV (Per Unit) `Plan AGrowth 16.1167Dividend 13.2872Plan B - DirectGrowth 16.7641Dividend 13.9102
PORTFOLIO CHARACTERISTIC
Average Maturity (Days) 1611.37Modified Duration (Years) 3.12Portfolio Yield (%) 7.21
TOTAL EXPENSE RATIO
Plan A 1.61%
Plan B (Direct) 1.09%
PORTFOLIO
Name of Instruments Ratings / Industries
% to Net Assets
CENTRAL GOVERNMENT SECURITIES
8.28% CGL 2027 Sovereign 9.89%
8.83% CGL 2023 Sovereign 6.00%
7.59% CGL 2029 Sovereign 4.54%
7.59% CGL 2026 Sovereign 3.79%
8.60% CGL 2028 Sovereign 1.21%
Total 25.43%
STATE GOVERNMENT SECURITIES
9.72% SDL 2023 Sovereign 8.11%
Total 8.11%
BONDS & NCDs
Listed / awaiting listing on the stock exchanges
Dewan Housing Finance Corporation Ltd.
CARE AAA 7.46%
IndusInd Bank Ltd. CRISIL AA 7.41%
Indian Railway Finance Corporation Ltd.
[ICRA]AAA 6.72%
Janalakshmi Financial Services Ltd.
[ICRA]A 6.49%
Total 28.08%
CBLO / Reverse Repo Investments 36.56%
Total 36.56%
Cash & Cash Equivalents
Net Receivable/Payable 1.82%
Total 1.82%
Grand Total 100.00%
All corporate ratings are assigned by rating agencies like CRISIL; CARE; ICRA; IND.
RATING PROFILE
38.38%
33.54%
7.46%
7.41%
6.72%
6.49%
Cash & Equivalent
Sovereign
CARE AAA
CRISIL AA
[ICRA]AAA
[ICRA]A
INSTRUMENTS
36.56%
28.08%
25.43%
8.11%1.82% CBLO / Reverse Repo
Investments
BONDS & NCDs
CENTRALGOVERNMENTSECURITIES
STATE GOVERNMENTSECURITIES
Cash & CashEquivalents
$ The Bonus Option in the Schemes has been discontinued effective June 08, 2015 # For performance of the Scheme and other funds managed by the said Fund manager, either individually or jointly, please refer page no 19 - 22
An Open Ended Income Scheme
15

31st August, 2017
BARODA PIONEER MUTUAL FUND
Baroda Pioneer Short Term Bond Fund
Investors understand that their principal will be at Moderately Low risk
This product is suitable for investors who are seeking*• Regular Income over short term• Investment predominantly in Money Market Instruments
(i.e. CP/CD) and Short Term Debt Market Instruments* Investors should consult their financial advisers if in doubt about whether the product is suitable for them.
INVESTMENT OBJECTIVE
The objective of the Scheme is to generate income from a portfolio constituted of short term debt and money market securities.
FUND DETAILS
Type of Scheme An Open Ended Income Scheme
Date of Allotment June 30, 2010
Fund Manager Mr. Alok Sahoo# (Experience 17 yrs), Ms. Hetal Shah# (Experience 15 yrs)
Benchmark CRISIL Short Term Bond Fund Index
Monthly Average AUM (`) 638.45 Crs
Month end AUM (`) 616.52 Crs
Minimum Investment ` 5,000/- & in multiples of ` 1/- thereafter
Entry Load NA
Exit Load 0.25% if redeemed on or before 15 days from the date of allotment of units. Nil if redeemed after 15 days from the date of allotment of units
Plans Plan A and Plan B (Direct)
Options • Growth (default option in case no option specified by investor);• Monthly Dividend^ 1. Payout 2. Reinvestment (default sub-option in case no option specified by investor)• Quarterly Dividend^ 1. Payout 2. Reinvestment (default sub-option in case no option specified by investor)
SIP (Minimum) ` 500/month - 12 Installments` 1500/quarter - 4 Installments
NAV AS ON 31 AUGUST 2017
NAV (Per Unit) `Plan AGrowth 17.8381Dividend 10.0869Plan B - DirectGrowth 18.3418Dividend 10.0591
PORTFOLIO CHARACTERISTIC
Average Maturity (Days) 442.05Modified Duration (Years) 1.05Portfolio Yield (%) 7.87
TOTAL EXPENSE RATIO
Plan A 1.25%
Plan B (Direct) 0.57%
PORTFOLIO
Name of Instruments Ratings / Industries
% to Net Assets
MONEY MARkET INSTRUMENT
Certificate of Deposit**
Axis Bank Ltd. CRISIL A1+ 7.83%
Kotak Mahindra Bank Ltd. CRISIL A1+ 3.98%
HDFC Bank Ltd. IND A1+ 2.37%
Total 14.18%
Commercial Paper**
Export-Import Bank of India
CRISIL A1+ 7.80%
Piramal Enterprises Ltd. [ICRA]A1+ 4.83%
Adani Enterprises Ltd. BWR A1+ 4.81%
IIFL Facilities Services Ltd. CRISIL A1+ 3.86%
Peninsula Land Ltd. [ICRA]A1 2.40%
Edelweiss Agri Value Chain Ltd.
[ICRA]A1+ 2.33%
Total 26.03%
BONDS & NCDs
Listed / awaiting listing on the stock exchanges
Piramal Enterprises Ltd. [ICRA]AA 5.67%
Edelweiss Commodities Services Ltd.
CARE AA 5.28%
Manappuram Finance Ltd. CRISIL AA- 4.62%
Dewan Housing Finance Corporation Ltd.
CARE AAA 4.14%
Tata Capital Financial Services Ltd.
[ICRA]AA+ 4.06%
Indiabulls Housing Finance Ltd.
CARE AAA 3.32%
Edelweiss Commodities Services Ltd.
[ICRA]AA 2.43%
Edelweiss Asset Reconstruction Company Ltd.
[ICRA]AA (so) 2.14%
Aspire Home Finance Corporation Ltd.
CRISIL A+ 1.48%
Janalakshmi Financial Services Ltd.
[ICRA]A 1.16%
India Infoline Finance Ltd. [ICRA]AA 1.03%
JSW Steel Ltd. CARE AA- 0.83%
Power Grid Corporation of India Ltd.
[ICRA] AAA 0.82%
Power Finance Corporation Ltd.
[ICRA] AAA 0.82%
Aspire Home Finance Corporation Ltd.
[ICRA]AA- 0.67%
India Infoline Housing Finance Ltd.
CRISIL AA 0.42%
Vedanta Ltd. CRISIL AA 0.16%
Rural Electrification Corporation Ltd.
CRISIL AAA 0.10%
Power Grid Corporation of India Ltd.
CRISIL AAA 0.08%
Total 39.23%
Unlisted
IIFL Wealth Finance Ltd. [ICRA]AA 5.70%
ARM Infra & Utilities Private Ltd.
BWR A1+ (so) 5.65%
Cyquator Media Services Private Ltd.
BWR A1+ (so) 2.43%
Janalakshmi Financial Services Ltd.
[ICRA]A 1.12%
Total 14.90%
PORTFOLIO
Name of Instruments Ratings / Industries
% to Net Assets
CBLO / Reverse Repo Investments 4.74%
Total 4.74%
Cash & Cash Equivalents
Net Receivable/Payable 0.92%
Total 0.92%
Grand Total 100.00%
All corporate ratings are assigned by rating agencies like CRISIL; CARE; ICRA; IND.**Thinly traded / Non traded securities and illiquid securities as defined in SEBI Regulations and Guidelines.
RATING PROFILE
23.47%14.83%
8.08%7.46%7.16%
5.66%5.28%4.81%4.62%4.06%
2.40%2.37%2.28%2.14%1.64%1.48%0.83%0.67%0.58%0.18%
CRISIL A1+[ICRA]AA
BWR A1+ (so)CARE AAA[ICRA]A1+
Cash & EquivalentCARE AABWR A1+
CRISIL AA-[ICRA]AA+
[ICRA]A1IND A1+[ICRA]A
[ICRA]AA (so)[ICRA] AAA
CRISIL A+CARE AA-[ICRA]AA-CRISIL AA
CRISIL AAA
INSTRUMENTS
39.23%
26.03%
14.90%
14.18%
4.74% 0.92% BONDS & NCDs
Commercial Paper
Unlisted
MONEY MARKETINSTRUMENT
CBLO / Reverse RepoInvestments
Cash & CashEquivalents
An Open Ended Income Scheme
^ The Dividend Option has been renamed as Monthly Dividend Option and a Quarterly Dividend Option has been introduced effective December 23, 2016.$ The Bonus Option in the Schemes has been discontinued effective June 08, 2015 # For performance of the Scheme and other funds managed by the said Fund manager, either individually or jointly, please refer page no 19 - 22
16

31st August, 2017
BARODA PIONEER MUTUAL FUND
[ICRA] A1+ mfs*Baroda Pioneer Treasury Advantage Fund
$ The Bonus Option in the Schemes has been discontinued effective June 08, 2015 Effective November 01, 2012, dividends declared under the Regular Plan (which has been discontinued from October 01, 2012) will be reinvested in Baroda Pioneer Treasury Advantage Fund (earlier called Institutional Plan) *For Disclaimer please refer page no 22# For performance of the Scheme and other funds managed by the said Fund manager, either individually or jointly, please refer page no 19 - 22
Investors understand that their principal will be at Moderately Low risk
This product is suitable for investors who are seeking*• Regular income over short term with maintaining a
balance between returns and liquidity• Investment predominantly in Money Market (i.e. CP/
CDs) and Debt Market Instruments* Investors should consult their financial advisers if in doubt about whether the product is suitable for them.
INVESTMENT OBJECTIVE
The main objective of the scheme is to provide optimal returns and liquidity through a portfolio comprising of debt securities and money market instruments
FUND DETAILS
Type of Scheme An Open Ended Debt Scheme
Date of Allotment June 24, 2009
Fund Manager Mr. Alok Sahoo#
(Experience 17 yrs), Ms. Hetal Shah#
(Experience 15 yrs)
Benchmark CRISIL Liquid Fund Index
Monthly Average AUM (`)
3,000.93 Crs
Month end AUM (`) 2,800.84 Crs
Minimum Investment ` 5,000/- & in multiples of ` 1/- thereafter
Entry Load NA
Exit Load Nil
Plans Plan A and Plan B (Direct)
Options
• Growth (default option in case no option specified by investor); • Daily Dividend 1 .Reinvestment • Weekly Dividend 1 .Reinvestment • Monthly Dividend 1 .Payout 2 . Reinvestment (default sub-option in case no option specified by investor)• Quarterly Dividend 1.Payout 2 . Reinvestment (default sub-option in case no option specified by investor)• Bonus Option$
SIP (Minimum) ` 500/month - 12 Instalments` 1500/quarter - 4 Instalments
PORTFOLIO CHARACTERISTIC
Average Maturity (Days) 388.04Modified Duration (Years) 0.90Portfolio Yield (%) 7.33
TOTAL EXPENSE RATIO
Plan A 0.81%
Plan B (Direct) 0.52%
PORTFOLIOName of Instruments Ratings /
Industries% to
Net Assets
MONEY MARkET INSTRUMENTCertificate of Deposit**HDFC Bank Ltd. IND A1+ 6.37%Credit Suisse Ag CRISIL A1+ 0.88%Total 7.25%Commercial Paper**Export-Import Bank of India CRISIL A1+ 8.60%IIFL Wealth Finance Ltd. [ICRA]A1+ 4.12%Piramal Enterprises Ltd. [ICRA]A1+ 3.68%Larsen & Toubro Ltd. CRISIL A1+ 3.50%Reliance Jio Infocomm Ltd. CARE A1+ 3.33%Adani Enterprises Ltd. BWR A1+ 3.14%Edelweiss Commodities Services Ltd.
[ICRA]A1+ 2.53%
Edelweiss Agri Value Chain Ltd. [ICRA]A1+ 2.03%Housing Development Finance Corporation Ltd.
CARE A1+ 1.73%
IIFL Facilities Services Ltd. CRISIL A1+ 1.26%Godrej Properties Ltd. [ICRA]A1+ 0.87%Kotak Commodity Services Private Ltd.
[ICRA]A1+ 0.86%
Peninsula Land Ltd. [ICRA]A1 0.52%Total 36.17%Fixed DepositIDFC Bank Ltd. Unrated 0.98%Total 0.98%BONDS & NCDsListed / awaiting listing on the stock exchangesIndiabulls Housing Finance Ltd. CARE AAA 7.35%Dewan Housing Finance Corporation Ltd.
CARE AAA 5.10%
Piramal Enterprises Ltd. [ICRA]AA 4.59%Power Finance Corporation Ltd. [ICRA]AAA 3.55%Apollo Hospitals Enterprise Ltd. CRISIL AA 2.50%India Infoline Housing Finance Ltd.
CRISIL AA 2.14%
Bank of Baroda CARE AA 1.75%Manappuram Finance Ltd. CRISIL AA- 1.69%Aspire Home Finance Corporation Ltd.
[ICRA]AA- 1.67%
Edelweiss Commodities Services Ltd.
CARE AA 1.54%
HDFC Bank Ltd. CRISIL AA+ 1.44%Janalakshmi Financial Services Ltd.
[ICRA]A 1.23%
Power Finance Corporation Ltd. [ICRA] AAA 0.91%L&T Finance Ltd. [ICRA]AA+ 0.89%Aspire Home Finance Corporation Ltd.
CRISIL A+ 0.57%
Edelweiss Asset Reconstruction Company Ltd.
[ICRA]AA (so)
0.43%
ICICI Bank Ltd. [ICRA]AA+ 0.36%India Infoline Finance Ltd. [ICRA]AA 0.34%Rural Electrification Corporation Ltd.
CRISIL AAA 0.30%
Steel Authority of India Ltd. IND AA- 0.18%Power Grid Corporation of India Ltd.
CRISIL AAA 0.16%
Power Grid Corporation of India Ltd.
[ICRA] AAA 0.10%
Edelweiss Commodities Services Ltd.
[ICRA]AA 0.07%
Total 38.86%Unlisted
ARM Infra & Utilities Private Ltd.BWR A1+ (so)
3.51%
Cyquator Media Services Private Ltd.
BWR A1+ (so)
0.70%
Powergrid Vizag Transmission Ltd. [ICRA]AAA 0.37%
Total 4.58%CBLO / Reverse Repo Investments 11.23%Total 11.23%Cash & Cash Equivalents
PORTFOLIOName of Instruments Ratings /
Industries% to
Net Assets
Net Receivable/Payable 0.93%Total 0.93%Grand Total 100.00%
All corporate ratings are assigned by rating agencies like CRISIL; CARE; ICRA; IND.**Thinly traded / Non traded securities and illiquid securities as defined in SEBI Regulations and Guidelines.
RATING PROFILE
14.24%14.09%
12.45%12.16%
6.37%5.06%5.00%
4.64%4.21%3.92%
3.29%3.14%
1.69%1.67%1.44%1.25%1.23%1.01%0.98%
0.57%0.52%0.46%0.43%0.18%
CRISIL A1+[ICRA]A1+CARE AAA
Cash & EquivalentIND A1+
CARE A1+[ICRA]AACRISIL AA
BWR A1+ (so)[ICRA]AAA
CARE AABWR A1+
CRISIL AA-[ICRA]AA-
CRISIL AA+[ICRA]AA+
[ICRA]A[ICRA] AAA
UnratedCRISIL A+[ICRA]A1
CRISIL AAA[ICRA]AA (so)
IND AA-
INSTRUMENTS
38.86%
36.17%
11.23%
7.25%4.58%
0.98%0.93%
BONDS & NCDs
Commercial Paper
CBLO / Reverse RepoInvestments
MONEY MARKETINSTRUMENT
Unlisted
Fixed Deposit
Cash & CashEquivalents
NAV AS ON 31 AUGUST 2017
NAV (Per Unit) `RegularGrowth 1909.0916Dividend - Daily 1006.5930Dividend - Weekly 1006.4350Dividend - Monthly 1007.5256Dividend - Quarterly NAPlan ABonus 1943.4416Growth 1957.5998Dividend - Daily 1030.7119Dividend - Weekly 1006.4535Dividend - Monthly 1007.5256Dividend - Quarterly 1042.9260Plan B - DirectBonus NAGrowth 1987.5877Dividend - Daily 1008.8997Dividend - Weekly 1006.4774Dividend - Monthly 1007.5951Dividend - Quarterly 1049.3932
An Open Ended Debt Scheme
17

31st August, 2017
BARODA PIONEER MUTUAL FUND
[ICRA] A1+ mfs*Baroda Pioneer Liquid Fund
$ The Bonus Option in the Schemes has been discontinued effective June 08, 2015 Effective November 01, 2012, dividends declared under the Regular Plan (which has been discontinued from October 01, 2012) will be reinvested in Baroda Pioneer Liquid Fund (earlier called Institutional Plan) *For Disclaimer please refer page no 22# For performance of the Scheme and other funds managed by the said Fund manager, either individually or jointly, please refer page no 19 - 22 & Aggregate investments made by other schemes of Baroda Pioneer Mutual Fund – Rs.25 crores
Investors understand that their principal will be atLow risk
This product is suitable for investors who are seeking*
• Regular income over short term with high level of liquidity
• Investment predominantly in Money Market (i.e. CP / CDs) Instruments* Investors should consult their financial advisers if in doubt about whether the product is suitable for them.
INVESTMENT OBJECTIVE
To generate income with a high level of liquidity by investing in a portfolio of money market and debt securities.
FUND DETAILS
Type of Scheme An Open Ended Liquid Scheme
Date of Allotment February 5, 2009
Fund Manager Mr. Alok Sahoo#
(Experience 17 yrs), Ms. Hetal Shah#
(Experience 15 yrs)
Benchmark CRISIL Liquid Fund Index
Monthly Average AUM (`)&
5,765.91 Crs
Month end AUM (`) 5,373.09 Crs
Minimum Investment ` 5,000/- & in multiples of ` 1/- thereafter
Entry Load NA
Exit Load Nil
Plans Plan A and Plan B (Direct)
Options • Growth (default option in case no option specified by investor);• Daily Dividend 1.Reinvestment• Weekly Dividend 1.Reinvestment• Bonus Option$
SIP (Minimum) ` 500/month - 12 Instalments` 1500/quarter - 4 Instalments
PORTFOLIO CHARACTERISTIC
Average Maturity (Days) 20.59Modified Duration (Years) 0.05Portfolio Yield (%) 6.18
TOTAL EXPENSE RATIOPlan A 0.28%
Plan B (Direct) 0.16%
PORTFOLIO
Name of Instruments Ratings / Industries
% to Net
Assets
MONEY MARkET INSTRUMENT
Certificate of Deposit**
HDFC Bank Ltd. IND A1+ 7.05%
Total 7.05%
Commercial Paper**
Edelweiss Commodities Services Ltd. [ICRA]A1+ 6.21%
India Infoline Housing Finance Ltd. [ICRA]A1+ 5.47%
Piramal Enterprises Ltd. [ICRA]A1+ 4.92%
Rural Electrification Corporation Ltd. CRISIL A1+ 4.69%
Reliance Jio Infocomm Ltd. CARE A1+ 3.21%
PNB Housing Finance Ltd. CRISIL A1+ 3.13%
India Infoline Finance Ltd. [ICRA]A1+ 3.12%
Gruh Finance Ltd. CRISIL A1+ 2.34%
Piramal Finance Ltd. [ICRA]A1+ 2.34%
ICICI Home Finance Company Ltd. [ICRA]A1+ 1.96%
Indian Railway Finance Corporation Ltd. CRISIL A1+ 1.56%
Adani Enterprises Ltd. BWR A1+ 0.39%
Total 39.34%
Treasury Bills
TBILL 91 DAY 21 Sep 2017 Sovereign 3.43%
TBILL 91 DAY 18 Sep 2017 Sovereign 2.32%
TBILL 91 DAY 28 Sep 2017 Sovereign 1.56%
Total 7.31%
Fixed Deposit
IDFC Bank Ltd. Unrated 4.55%
RBL Bank Ltd. Unrated 3.14%
Bandhan Bank Ltd. Unrated 2.75%
Total 10.44%
BONDS & NCDs
Unlisted
Ultratech Cement Ltd. CRISIL AAA 3.92%
Total 3.92%
CBLO /Reverse Repo investments 31.73%
Total 31.73%
Cash & Cash Equivalents
Net Receivable/Payable 0.21%
Total 0.21%
Grand Total 100.00%
All corporate ratings are assigned by rating agencies like CRISIL; CARE; ICRA; IND.**Thinly traded / Non traded securities and illiquid securities as defined in SEBI Regulations and Guidelines.
RATING PROFILE
31.94%
24.02%
11.72%
10.44%
7.31%
7.05%
3.92%
3.21%
0.39%
Cash & Equivalent
[ICRA]A1+
CRISIL A1+
Unrated
Sovereign
IND A1+
CRISIL AAA
CARE A1+
BWR A1+
INSTRUMENTS
39.34%
31.73%
10.44%
7.31%
7.05%
3.92%0.21%
Commercial Paper
CBLO / Reverse RepoInvestments
Fixed Deposit
Treasury Bills
MONEY MARKETINSTRUMENT
BONDS & NCDs
Cash & CashEquivalents
NAV AS ON 31 AUGUST 2017
NAV (Per Unit) `RegularGrowth 2816.2047
Dividend 2412.7998Dividend - Daily 1006.0602Plan AGrowth 1913.8380Dividend - Daily 1001.1191Dividend - Weekly 1000.5078Plan B - DirectBonus 1922.4845Growth 1922.1565Dividend - Daily 1001.8422Dividend - Weekly 1219.5819
An Open Ended Liquid Scheme
18

31st August, 2017
BARODA PIONEER MUTUAL FUND
Investment Performance
Funds Managed by Mr. Sanjay Chawla & Mr. Dipak Acharya
Date Of Inception: 12/09/20031 Year 3 Years 5 Years
Since InceptionScheme Name & Benchmark
Baroda Pioneer Growth Fund (in %)^ 14.01 11.99 16.86 17.56
S&P BSE 200 (Scheme Benchmark) (in %)* 15.02 10.22 15.32 15.72
Nifty 50 (Standard Benchmark) (in %)$ 12.88 7.60 13.52 15.20
` 10,000, if invested in BPGF, would have become `11,401 `14,063 `21,802 `95,950
` 10,000, if invested in S&P BSE 200, would have become `11,502 `13,405 `20,407 `76,948
` 10,000, if invested in Nifty 50, would have become `11,288 `12,469 `18,861 `72,283
^Past performance may or may not be sustained in the future.Data is for Plan A - Growth Option. Plan A and Plan B (Direct) have different expense structures. The last working day of August has been considered in all cases. Returns are Compounded Annualised and are calculated on the basis of `10 invested at inception. $Standard benchmark as prescribed by SEBI for comparison purposes. Returns on `10,000 are point-to-point returns for the specific time period, invested at the start of the period. * with effect from 2nd May 2016 the benchmark has been changed to S&P BSE 200. Mr. Sanjay Chawla is managing the Scheme along with Mr. Dipak Acharya effective November 1, 2015.
Date Of Inception: 31/03/19961 Year 3 Years 5 Years
Since InceptionScheme Name & Benchmark
Baroda Pioneer ELSS’ 96 Fund (in %)^ 14.68 11.32 16.83 13.00
S&P BSE 200 (Scheme Benchmark) (in %)* 15.02 10.22 15.32 12.53
Nifty 50 (Standard Benchmark) (in %)$ 12.88 7.60 13.52 11.38
`10,000, if invested in BPELSS’96F, would have become `11,468 `13,811 `21,777 `1,37,271
`10,000, if invested in S&P BSE 200, would have become `11,502 `13,405 `20,407 `1,25,494
`10,000, if invested in Nifty 50, would have become `11,288 `12,469 `18,861 `1,00,659
^Past performance may or may not be sustained in the future.Data is for Dividend Option and the last working day of August has been considered in all cases. Returns have been computed assuming that all payouts during the period have been reinvested in the units of the Scheme at the respective prevailing NAVs. Returns are Compounded Annualised and are calculated on the basis of `10 invested at inception. $Standard benchmark as prescribed by SEBI for comparison purposes. Returns on `10,000 are point-to-point returns for the specific time period, invested at the start of the period. * with effect from 2nd May 2016 the benchmark has been changed to S&P BSE 200. Mr. Sanjay Chawla is managing the Scheme along with Mr. Dipak Acharya effective November 1, 2015.
Date Of Inception: 12/09/20031 Year 3 Years 5 Years
Since InceptionScheme Name & Benchmark
Baroda Pioneer Balance Fund (in %)^ 14.39 11.01 14.97 12.83
CRISIL Balanced Fund - Aggressive index& (Scheme Benchmark) (in %) 11.78 9.02 12.38 12.62
Nifty 50 (Standard Benchmark) (in %)$ 12.88 7.60 13.52 15.20
`10,000, if invested in BPBF, would have become `11,439 `13,695 `20,097 `54,040
`10,000, if invested in CRISIL Balanced Fund - Aggressive index (effective April 4, 2016), would have become `11,178 `12,970 `17,933 `52,682
`10,000, if invested in Nifty 50, would have become `11,288 `12,469 `18,861 `72,283
^Past performance may or may not be sustained in the future.Data is for Plan A - Growth Option. Plan A and Plan B (Direct) have different expense structures. The last working day of August has been considered in all cases. Returns are Compounded Annualised and are calculated on the basis of `10 invested at inception. $Standard benchmark as prescribed by SEBI for comparison purposes. Returns on `10,000 are point-to-point returns for the specific time period, invested at the start of the period. Mr. Sanjay Chawla is managing the Scheme along with Mr. Dipak Acharya effective November 1, 2015. &(Benchmark has been renamed effective April 4, 2016)
Date Of Inception: 04/10/20101 Year 3 Years 5 Years
Since InceptionScheme Name & Benchmark
Baroda Pioneer Mid-Cap Fund (in %)^ 14.94 1.60 5.64 -1.51
S&P BSE MidCap (Scheme Benchmark)& (in %) 17.57 18.60 20.93 9.55
Nifty 50 (Standard Benchmark) (in %)$ 12.88 7.60 13.52 7.13
`10,000, if invested in BPMCF, would have become `11,494 `10,490 `13,158 `9,000
`10,000, if invested in S&P BSE MidCap, would have become `11,757 `16,711 `25,878 `18,790
`10,000, if invested in Nifty 50, would have become `11,288 `12,469 `18,861 `16,102
^Past performance may or may not be sustained in the future.Data is for Plan A - Growth Option. Plan A and Plan B (Direct) have different expense structures. The last working day of August has been considered in all cases. Returns are Compounded Annualised and are calculated on the basis of `10 invested at inception. $Standard benchmark as prescribed by SEBI for comparison purposes. Returns on `10,000 are point-to-point returns for the specific time period, invested at the start of the period. Mr. Sanjay Chawla is managing the Scheme with Mr. Dipak Acharya effective October 3, 2016. & (Scheme Benchmark has been changed to S&B BSE Mid-cap Index effective October 3, 2016)
19

31st August, 2017
BARODA PIONEER MUTUAL FUND
Investment Performance
Funds Managed by Mr. Sanjay Chawla & Mr. Dipak Acharya
Date Of Inception: 22/06/20101 Year 3 Years 5 Years
Since InceptionScheme Name & Benchmark
Baroda Pioneer Large Cap Fund (in %)^ 11.44 7.96 13.49 4.30
Nifty 100 (Scheme Benchmark)& (in %) 14.29 9.25 14.94 9.73
Nifty 50 (Standard Benchmark) (in %)$ 12.88 7.60 13.52 9.05
`10,000, if invested in BPLCF, would have become `11,144 `12,595 `18,832 `13,540
`10,000, if invested in Nifty 100 would have become `11,429 `13,053 `20,066 `19,511
`10,000, if invested in Nifty 50, would have become `11,288 `12,469 `18,861 `18,655
^Past performance may or may not be sustained in the future.Data is for Plan A - Growth Option. Plan A and Plan B (Direct) have different expense structures. The last working day of August has been considered in all cases. Returns are Compounded Annualised and are calculated on the basis of `10 invested at inception. $Standard benchmark as prescribed by SEBI for comparison purposes. Returns on `10,000 are point-to-point returns for the specific time period, invested at the start of the period. Mr. Sanjay Chawla is managing the Scheme with Mr. Dipak Acharya effective October 3, 2016. &(Scheme Benchmark has been changed to Nifty 100 effective October 3, 2016)
Funds Managed by Mr. Dipak AcharyaDate Of Inception: 22/06/2012
1 Year 3 Years 5 YearsSince
InceptionScheme Name & Benchmark
Baroda Pioneer Banking and Financial Services Fund (in %)^ 17.88 13.74 16.36 14.75
Nifty Bank Index (Scheme Benchmark) (in %) 22.90 15.54 19.46 18.57
Nifty 50 (Standard Benchmark) (in %)$ 12.88 7.60 13.52 13.46
`10,000, if invested in BPBFSF, would have become `11,788 `14,737 `21,336 `20,440
`10,000, if invested in Nifty Bank Index, would have become `12,290 `15,450 `24,342 `24,225
`10,000, if invested in Nifty 50, would have become `11,288 `12,469 `18,861 `19,273
^Past performance may or may not be sustained in the future.Data is for Plan A - Growth Option. Plan A and Plan B (Direct) have different expense structures. The last working day of August has been considered in all cases. Returns are Compounded Annualised and are calculated on the basis of `10 invested at inception. $Standard benchmark as prescribed by SEBI for comparison purposes. Returns on `10,000 are point-to-point returns for the specific time period, invested at the start of the period.
Date Of Inception: 30/06/20101 Year 3 Years 5 Years
Since InceptionScheme Name & Benchmark
Baroda Pioneer Short Term Bond Fund (in %)^ 8.86 9.05 8.96 8.40
CRISIL Short Term Bond Fund Index (Scheme Benchmark) (in %) 8.16 9.10 9.04 8.54
CRISIL 1 year T-Bill (Standard Benchmark) (in %)$ 6.24 7.48 7.30 6.97
`10,000, if invested in BPSTBF, would have become `10,886 `12,982 `15,358 `17,838
`10,000, if invested in CRISIL Short Term Bond Fund Index, would have become `10,816 `13,000 `15,418 `18,005
`10,000, if invested in CRISIL 1 year T-Bill, would have become `10,624 `12,426 `14,229 `16,213
^Past performance may or may not be sustained in the future.Data is for Plan A - Growth Option. Plan A and Plan B (Direct) have different expense structures. The last working day of August has been considered in all cases. Returns are Compounded Annualised and are calculated on the basis of `10 invested at inception. $Standard benchmark as prescribed by SEBI for comparison purposes. Returns on `10,000 are point-to-point returns for the specific time period, invested at the start of the period.
Funds Managed by Mr. Alok Sahoo and Ms Hetal Shah
20
Date Of Inception: 05/02/2009 1 Year 3 Years 5 Years
Since InceptionScheme Name & Benchmark
Baroda Pioneer Liquid Fund (in %)^ 6.81 7.86 8.38 7.87
CRISIL Liquid Fund Index (Scheme Benchmark) (in %) 6.76 7.74 8.21 7.47
CRISIL 1 year T-Bill (Standard Benchmark) (in%)$ 6.24 7.50 7.30 6.22
`10,000, if invested in BPLF, would have become `10,681 `12,550 `14,958 `19,138
`10,000, if invested in CRISIL Liquid Fund Index, would have become `10,676 `12,508 `14,838 `18,550
`10,000, if invested in CRISIL 1 year T-Bill, would have become `10,624 `12,426 `14,229 `16,770
^Past performance may or may not be sustained in the future.Data is for Plan A - Growth Option. Plan A and Plan B (Direct) have different expense structures. The last working day of August has been considered in all cases. Returns are Compounded Annualised and are calculated on the basis of `1000 invested at inception. $Standard benchmark as prescribed by SEBI for comparison purposes. Returns on `10,000 are point-to-point returns for the specific time period, invested at the start of the period.

31st August, 2017
BARODA PIONEER MUTUAL FUND
Investment Performance
Funds Managed by Mr. Alok Sahoo and Ms. Hetal Shah
Date Of Inception: 24/06/2009 1 Year 3 Years 5 Years
Since InceptionScheme Name & Benchmark
Baroda Pioneer Treasury Advantage Fund (in %)^ 8.36 8.98 9.10 8.55
CRISIL Liquid Fund Index (Scheme Benchmark) (in %) 6.76 7.72 8.21 7.51
CRISIL 1 year T-Bill (Standard Benchmark) (in %)$ 6.24 7.48 7.30 6.34
`10,000, if invested in BPTAF, would have become `10,836 `12,957 `15,461 `19,576
`10,000, if invested in CRISIL Liquid Fund Index, would have become `10,676 `12,508 `14,838 `18,102
`10,000, if invested CRISIL 1 year T-Bill, would have become `10,624 `12,426 `14,229 `16,547
^Past performance may or may not be sustained in the future.Data is for Plan A - Growth Option. Plan A and Plan B (Direct) have different expense structures. The last working day of August has been considered in all cases. Returns are Compounded Annualised and are calculated on the basis of `1000 invested at inception. $Standard benchmark as prescribed by SEBI for comparison purposes. Returns on `10,000 are point-to-point returns for the specific time period, invested at the start of the period.
Date of Inception: 23/01/20151 Year Since Inception
Scheme Name & Benchmark
Baroda Pioneer Credit Opportunities Fund (in %)^ 10.42 10.71
CRISIL Short Term Bond Fund Index (Scheme Benchmark) (in %) 8.16 8.72
CRISIL 1 year T-Bill (Standard Benchmark) (in %)$ 6.24 7.20
`10,000, if invested in BPCOF, would have become `11,042 `13,035
`10,000, if invested in CRISIL Short Term Bond Fund Index, would have become `10,816 `12,433
`10,000, if invested CRISIL 1 year T-Bill, would have become `10,624 `11,985
^Past performance may or may not be sustained in the future.Data is for Plan A - Growth Option. Plan A and Plan B (Direct) have different expense structures. The last working day of August has been considered in all cases. Returns are Compounded Annualised and are calculated on the basis of `10 invested at inception. $Standard benchmark as prescribed by SEBI for comparison purposes. Returns on `10,000 are point-to-point returns for the specific time period, invested at the start of the period. The Scheme has been in existence for less than 3 years.Mr. Karn Kumar is managing the scheme along with Mr. Alok Sahoo since July 24, 2017.
Date Of Inception: 08/09/2004 1 Year 3 Years 5 Years
Since InceptionScheme Name & Benchmark
Baroda Pioneer Monthly Income Plan (MIP) Fund (in %)^* 8.00 8.83 9.46 6.26
CRISIL MIP Blended Index (Scheme Benchmark) (in %) 9.93 10.63 10.30 8.70
CRISIL 10 Year Gilt Index (Standard Benchmark) (in %)$ 8.97 11.03 8.47 6.26
`10,000, if invested in BPMIPF, would have become `10,800 `12,901 `15,715 `22,003
`10,000, if invested in CRISIL MIP Blended Index, would have become `10,993 `13,554 `16,334 `29,529
`10,000, if invested in CRISIL 10 Year Gilt Index, would have become `10,897 `13,703 `15,021 `22,001
^Past performance may or may not be sustained in the future.Data is for for Plan A - Growth Option. Plan A and Plan B (Direct) have different expense structures. The last working day of August has been considered in all cases. Returns are Compounded Annualised and are calculated on the basis of `10 invested at inception. $Standard benchmark as prescribed by SEBI for comparison purposes. Returns on `10,000 are point-to-point returns for the specific time period, invested at the start of the period.
Funds Managed by Ms. Hetal Shah
21
*Monthly income is not assured and is subject to the availability of distributable surplus.
Date of Inception: 30/06/20121 Year 3 Years 5 Years
Since InceptionScheme Name & Benchmark
Baroda Pioneer Dynamic Bond Fund (in %)^ 8.69 11.06 9.61 9.67
CRISIL Composite Bond Fund Index (Scheme Benchmark) (in %) 9.31 11.01 9.58 9.58
CRISIL 1 year T-Bill (Standard Benchmark) (in %)$ 6.24 7.48 7.30 7.32
`10,000, if invested in BPDBF, would have become `10,869 `13,714 `15,825 `16,117
`10,000, if invested in CRISIL Composite Bond Fund Index, would have become `10,931 `13,696 `15,805 `16,051
`10,000, if invested CRISIL 1 year T-Bill, would have become `10,624 `12,426 `14,229 `14,412
^Past performance may or may not be sustained in the future.Data is for for Plan A - Growth Option. Plan A and Plan B (Direct) have different expense structures. The last working day of August has been considered in all cases. Returns are Compounded Annualised and are calculated on the basis of `10 invested at inception. $Standard benchmark as prescribed by SEBI for comparison purposes. Returns on `10,000 are point-to-point returns for the specific time period, invested at the start of the period.
Funds Managed by Mr. Alok Sahoo and Mr. karn kumar

31st August, 2017
BARODA PIONEER MUTUAL FUND
Investment Performance
Funds Managed by Ms. Hetal Shah
Date Of Inception: 21/03/20021 Year 3 Years 5 Years
Since InceptionScheme Name & Benchmark
Baroda Pioneer Income Fund (in %)^ 7.36 9.49 8.45 6.44
CRISIL Composite Bond Fund Index (Scheme Benchmark) (in %) 9.31 11.01 9.58 7.24
CRISIL 10 Year Gilt Index (Standard Benchmark) (in %)$ 8.97 11.03 8.47 6.91
`10,000, if invested in BPIF, would have become `10,736 `13,140 `15,007 `26,258
`10,000, if invested in CRISIL Composite Bond Fund Index, would have become `10,931 `13,696 `15,805 `29,444
`10,000, if invested in CRISIL 10 Year Gilt Index, would have become `10,897 `13,703 `15,021 `28,094
^Past performance may or may not be sustained in the future.Data is for Plan A - Growth Option. Plan A and Plan B (Direct) have different expense structures. The last working day of August has been considered in all cases. Returns are Compounded Annualised and are calculated on the basis of `10 invested at inception. $Standard benchmark as prescribed by SEBI for comparison purposes. Returns on `10,000 are point-to-point returns for the specific time period, invested at the start of the period.
Disclaimers: Nifty Bank Index and Nifty 100: Baroda Pioneer Large Cap Fund and Baroda Pioneer Banking and Financial Services Fund (“said Schemes”) offered by Baroda Pioneer Mutual Fund are not sponsored, endorsed, sold or promoted by India Index Services & Products Limited (“IISL”). IISL does not make any representation or warranty, express or implied (including warranties of merchantability or fitness for particular purpose or use) and disclaims all liability to the owners of the said Schemes or any member of the public regarding the advisability of investing in securities generally or in the said Schemes linked to Nifty 100 and Nifty Bank Index or particularly in the ability of the Nifty Bank Index to track general stock market performance in India. Please read the full disclaimers in relation to the Nifty 100 and Nifty Bank Index in the Offer Document / Prospectus / Information Statement.
S&P BSE 200: Baroda Pioneer Growth Fund and Baroda Pioneer ELSS’ 96 Fund (“said Schemes”) offered by Baroda Pioneer Mutual Fund are not sponsored, endorsed, sold or promoted by India Index Services & Products Limited (“IISL”). IISL does not make any representation or warranty, express or implied (including warranties of merchantability or fitness for particular purpose or use) and disclaims all liability to the owners of the said Schemes or any member of the public regarding the advisability of investing in securities generally or in the said Schemes linked to S&P BSE 200 or particularly in the ability of the S&P BSE 200 and to track general stock market performance in India. Please read the full disclaimers in relation to the S&P BSE 200 in the Offer Document / Prospectus / Information Statement.
S&P BSE Midcap Index is a product of AIPL, a joint venture among affiliates of S&P Dow Jones Indices LLC (“SPDJI”) and BSE Limited (“BSE”), and has been licensed for use by Baroda Pioneer Asset Management Company Ltd. Standard & Poor’s® and S&P® are registered trademarks of Standard & Poor’s Financial Services LLC (“S&P”); BSE® is registered trademarks of BSE Limited; Dow Jones® is a registered trademark of Dow Jones Trademark Holdings LLC (“Dow Jones”); and these trademarks have been licensed for use by AIPL and sublicensed for certain purposes by Baroda Pioneer Asset Management Company Ltd. Baroda Pioneer Mid-Cap Fund is not sponsored, endorsed, sold or promoted by SPDJI, BSE, Dow Jones, S&P or their respective affiliates and none of such parties make any representation regarding the advisability of investing in such product(s) nor do they have any liability for any errors, omissions, or interruptions of the S&P BSE Midcap Index.
*ICRA Credit Ratings: The rating indicates highest-credit quality rating assigned by ICRA Ltd. to debt funds. Schemes with this rating are considered to have very strong degree of safety regarding timely receipt of payments from the investments that they have made. This rating should however not be construed as an indication of the performance of the Mutual Fund scheme or of volatility in its returns. The rating should not be treated as a recommendation to buy, sell or hold the units issued by the Mutual Fund.
22
Date Of Inception: 21/03/20021 Year 3 Years 5 Years
Since InceptionScheme Name & Benchmark
Baroda Pioneer Gilt Fund (in %)^ 7.07 10.28 9.03 6.57
I-Sec Mi-BEX (Scheme Benchmark) (in %) 8.93 10.93 9.83 7.92
CRISIL 10 Year Gilt Index (Standard Benchmark)$ 8.97 11.03 8.47 6.91
`10,000, if invested in BPGF, would have become `10,707 `13,426 `15,408 `26,751
`10,000, if invested in I-Sec Mi-BEX, would have become `10,893 `13,668 `15,984 `32,498
`10,000, if invested in CRISIL 10 Year Gilt Index, would have become `10,897 `13,703 `15,021 `28,094
^Past performance may or may not be sustained in the future.Data is for for Plan A - Growth Option. Plan A and Plan B (Direct) have different expense structures. The last working day of August has been considered in all cases. Returns are Compounded Annualised and are calculated on the basis of `10 invested at inception. $Standard benchmark as prescribed by SEBI for comparison purposes. Returns on `10,000 are point-to-point returns for the specific time period, invested at the start of the period.

31st August, 2017
BARODA PIONEER MUTUAL FUND
SIP Returns
23
Baroda Pioneer Growth Fund 1 Year 3 Years 5 Years 7 Years 10 Years Since Inception
Total Amount Invested (Rs) 1,20,000 3,60,000 6,00,000 8,40,000 12,00,000 16,80,000
Total Value as on Aug 31, 2017(Rs) 1,32,954 4,37,991 8,92,176 13,69,412 22,70,496 48,87,267
Returns (%) 20.65 13.16 15.87 13.72 12.25 14.10
Total Values of S&P BSE 200* (Rs) 1,33,747 4,38,107 8,61,466 13,31,312 22,14,645 43,59,737
S&P BSE 200* Returns (%) 21.95 13.18 14.45 12.93 11.78 12.67
Total Value of Nifty 50 (Rs) 1,32,665 4,24,278 8,14,230 12,55,250 20,78,573 41,15,266
Nifty 50 Returns (%) 20.18 10.96 12.16 11.28 10.59 11.93
Baroda Pioneer ELSS’ 96 1 Year 3 Years 5 Years 7 Years 10 Years Since Inception
Total Amount Invested (Rs) 1,20,000 3,60,000 6,00,000 8,40,000 12,00,000 25,60,000
Total Value as on Aug 31, 2017(Rs) 1,32,670 4,35,528 8,88,317 13,79,601 22,65,796 1,41,31,164
Returns (%) 20.18 12.77 15.69 13.92 12.21 13.99
Total Values of S&P BSE 200* (Rs) 1,33,747 4,38,107 8,61,466 13,31,312 22,14,645 1,43,54,553
S&P BSE 200* Returns (%) 21.95 13.18 14.45 12.93 11.78 14.10
Total Value of Nifty 50 (Rs) 1,32,665 4,24,278 8,14,230 12,55,250 20,78,573 1,20,95,433
Nifty 50 Returns (%) 20.18 10.96 12.16 11.28 10.59 12.81
Baroda Pioneer Mid-Cap Fund 1 Year 3 Years 5 Years Since Inception
Total Amount Invested (Rs) 1,20,000 3,60,000 6,00,000 8,30,000
Total Value as on Aug 31, 2017(Rs) 1,32,455 4,10,350 7,35,066 9,95,651
Returns (%) 19.83 8.69 8.05 5.18
Total Values of S&P BSE MidCap^^ (Rs) 1,36,136 4,84,210 10,47,628 15,92,064
S&P BSE MidCap^^ Returns (%) 25.90 20.23 22.47 18.51
Total Value of Nifty 50 (Rs) 1,32,665 4,24,278 8,14,230 12,37,082
Nifty 50 Returns (%) 20.18 10.96 12.16 11.35
Baroda Pioneer Large CapFund
1 Year 3 Years 5 Years 7 Years Since Inception
Total Amount Invested (Rs) 1,20,000 3,60,000 6,00,000 8,40,000 8,70,000
Total Value as on Aug 31, 2017(Rs) 1,29,038 4,21,459 8,48,283 1,23,2586 1,27,3032
Returns (%) 14.28 10.51 13.82 10.77 10.31
Total Values of Nifty 100^^ (Rs) 1,33,508 4,33,313 8,44,326 1,31,0008 1,36,8205
Nifty 100^^ Returns (%) 21.56 12.41 13.63 12.47 12.25
Total Value of Nifty 50 (Rs) 1,32,665 424278 8,14,230 1,25,5250 1,31,1050
Nifty 50 Returns (%) 20.18 10.96 12.16 11.28 11.10
Baroda Pioneer Banking andFinancial Services Fund
1 Year 3 Years 5 Years Since Inception
Total Amount Invested (Rs) 1,20,000 3,60,000 6,00,000 6,30,000
Total Value as on Aug 31, 2017(Rs) 1,34,724 4,57,879 9,14,638 9,75,980
Returns (%) 23.56 16.26 16.88 16.66
Total Values of Nifty Bank Index (Rs) 1,40,510 4,75,578 9,75,253 10,46,173
Nifty Bank Index Returns (%) 33.22 18.94 19.51 19.36
Total Value of Nifty 50 (Rs) 1,32,665 4,24,278 8,14,230 8,71,217
Nifty 50 Returns (%) 20.18 10.96 12.16 12.29
Baroda Pioneer Balance Fund 1 Year 3 Years 5 Years 7 Years 10 Years Since Inception
Total Amount Invested (Rs) 1,20,000 3,60,000 6,00,000 8,40,000 12,00,000 16,80,000
Total Value as on Aug 31, 2017(Rs) 1,32,371 4,38,008 8,56,280 13,23,845 21,38,445 37,58,965
Returns (%) 19.70 13.16 14.20 12.77 11.12 10.78
Total Values of CRISIL Balanced Fund – Aggressive Index (Rs)
1,30,188 4,23,762 8,04,547 12,41,334 20,50,203 37,85,829
CRISIL Balanced Fund – Aggressive Index Returns (%)
16.14 10.88 11.68 10.97 10.33 10.87
Total Value of Nifty 50 (Rs) 1,32,665 4,24,278 8,14,230 12,55,250 20,78,573 41,15,484
Nifty 50 Returns (%) 20.18 10.96 12.16 11.28 10.59 11.93
Baroda Pioneer Monthly Income Plan (MIP) Fund*
1 Year 3 Years 5 Years 7 Years 10 Years Since Inception
Total Amount Invested (Rs) 1,20,000 3,60,000 6,00,000 8,40,000 12,00,000 15,60,000
Total Value as on Aug 31, 2017(Rs) 1,25,189 4,07,343 7,54,803 11,50,361 17,97,245 25,14,961
Returns (%) 8.13 8.19 9.12 8.84 7.84 7.04
Total Values of CRISIL MIP Blended Index (Rs)
1,26,644 4,21,122 7,83,411 12,03,105 19,47,619 28,85,301
CRISIL MIP Blended Index Returns 10.45 10.46 10.61 10.09 9.36 8.99
Total Value of CRISIL 10 Year Gilt Index Returns (%) (Rs)
1,24,295 4,16,930 7,58,667 11,43,869 17,89,478 25,76,610
CRISIL 10 Year Gilt Index Returns (%) 6.72 9.77 9.32 8.68 7.75 7.39
* Monthly income is not assured and is subject to the availability of distributable surplus.^Past performance may or may not be sustained in the future.For SIP calculations above, the data assumes the investment of ` 10000/- on 1st day of every month or the subsequent working day. Load & Taxes are not considered for computation of returns. Performance for dividend option would assume reinvestment of tax free dividends declared at the then prevailing NAV.CAGR returns are computed after accounting for the cash flow by using XIRR method (investment internal rate of return). Where Benchmark returns are not available, they have not been shown.
* with effect from 2nd May 2016 the benchmark has been changed to S&P BSE 200.
* with effect from 2nd May 2016 the benchmark has been changed to S&P BSE 200.
^^Scheme benchmark has been changed to Nifty 100 effective October 3, 2016.
^^Scheme benchmark has been changed to S&P BSE Mid-cap index effective October 3, 2016.

31st August, 2017
BARODA PIONEER MUTUAL FUND
Record Date Ex-Dividend NAV (Rs) Per Unit$ (Rs)
Baroda Pioneer Growth Fund - Plan A - Dividend23-Mar-17 35.86 2.50
24-Jun-16 33.72 2.80
24-Jul-15 39.49 3.50
Baroda Pioneer Growth Fund - Plan B - Direct - Dividend23-Mar-17 35.33 2.50
24-Jun-16 33.05 2.80
24-Jul-15 38.61 3.50
Baroda Pioneer ELSS 96 - Plan A - Dividend23-Mar-17 32.07 2.50
23-Mar-16 28.50 2.50
23-Feb-15 32.32 2.25
Baroda Pioneer ELSS 96 - Plan B - Direct - Dividend23-Mar-17 36.88 2.50
23-Feb-15 33.19 2.25
14-Mar-14 23.15 2.00
Baroda Pioneer Large Cap Fund - Plan A - Dividend09-Jan-15 10.38 0.90
Baroda Pioneer Large Cap Fund - Plan B - Direct - Dividend09-Jan-15 10.54 0.90
Baroda Pioneer Banking and Financial Services Fund - Plan A - Dividend23-Mar-17 17.44 1.50
Baroda Pioneer Banking and Financial Services Fund - Plan B - Direct - Dividend23-Mar-17 18.04 1.50
Baroda Pioneer Balance Fund - Plan A - Dividend30-Jun-17 18.34 0.40
23-Mar-17 17.82 0.40
30-Dec-16 16.58 0.50
Baroda Pioneer Balance Fund - Plan B - Direct - Dividend30-Jun-17 19.80 0.40
23-Mar-17 19.14 0.40
30-Dec-16 17.69 0.50
Baroda Pioneer MIP Fund - Plan A - Monthly Dividend*24-Aug-17 13.75 0.05
28-Jul-17 13.74 0.05
30-Jun-17 13.72 0.05
Baroda Pioneer MIP Fund - Plan B - Direct - Monthly Dividend*24-Aug-17 14.06 0.05
28-Jul-17 14.05 0.05
30-Jun-17 14.01 0.05
Baroda Pioneer MIP Fund - Plan A - Quarterly Dividend*30-Jun-17 13.48 0.14
23-Mar-17 13.29 0.14
30-Dec-16 13.34 0.12
Baroda Pioneer MIP Fund - Plan B - Direct - Quarterly Dividend*30-Jun-17 13.81 0.14
23-Mar-17 13.58 0.14
30-Dec-16 13.60 0.12
Baroda Pioneer Credit Opportunities Fund - - Plan A - Quarterly Dividend30-Jun-17 10.9728 0.15
23-Mar-17 10.8996 0.15
30-Dec-16 10.8246 0.13
Baroda Pioneer Credit Opportunities Fund - Plan B - Direct - Quarterly Dividend30-Jun-17 11.2964 0.15
23-Mar-17 11.1790 0.15
30-Dec-16 11.0916 0.15
Baroda Pioneer Credit Opportunities Fund - - Plan A - Monthly Dividend24-Aug-17 10.9722 0.05
28-Jul-17 10.9119 0.05
30-Jun-17 10.9569 0.05
Baroda Pioneer Credit Opportunities Fund - Plan B - Direct - Monthly Dividend24-Aug-17 11.3781 0.05
28-Jul-17 11.3044 0.05
30-Jun-17 11.3345 0.05
Record Date Ex-Dividend NAV (Rs) Per Unit$ (Rs)
Baroda Pioneer Dynamic Bond Fund - Plan A - Dividend27-Jun-16 12.1528 0.29
23-Mar-16 12.5843 0.51
25-Jun-13 10.0000 0.30
Baroda Pioneer Dynamic Bond Fund - Plan B - Direct - Dividend27-Jun-16 12.5981 0.29
23-Mar-16 13.0024 0.51
25-Jun-13 10.0000 0.31
Baroda Pioneer Gilt Fund - Plan A - Dividend24-Jun-16 19.49 0.87
22-Mar-16 20.31 0.87
21-Mar-14 16.42 1.95
Baroda Pioneer Gilt Fund - Plan B - Direct - Dividend21-Mar-14 16.55 1.95
Baroda Pioneer Liquid Fund - Plan A - Dividend04-Mar-05 1016.27 35.00
06-Jan-04 1004.32 95.00
13-May-02 1002.43 7.50
Baroda Pioneer Short Term Bond Fund - Plan A - Monthly Dividend24-Aug-17 10.13 0.04
28-Jul-17 10.08 0.04
30-Jun-17 10.13 0.05
Baroda Pioneer Short Term Bond Fund - Plan B - Direct - Monthly Dividend24-Aug-17 10.11 0.04
28-Jul-17 10.04 0.05
30-Jun-17 10.11 0.05
Baroda Pioneer Treasury Advantage Fund Reg - Monthly Dividend24-Aug-17 1010.46 3.27
28-Apr-17 1012.42 6.13
31-Mar-17 1012.31 4.17
Baroda Pioneer Treasury Advantage Fund - Plan A - Monthly Dividend24-Aug-17 1010.46 3.27
28-Jul-17 1005.22 4.99
30-Jun-17 1011.04 4.09
Baroda Pioneer Treasury Advantage Fund - Plan B - Direct - Monthly Dividend24-Aug-17 1010.68 3.43
28-Jul-17 1005.23 5.16
30-Jun-17 1011.34 4.29
Baroda Pioneer Treasury Advantage Fund Reg - Quarterly Dividend27-Jun-14 1006.66 23.38
21-Mar-14 1011.22 7.79
24-Jun-16 1036.72 14.45
Baroda Pioneer Treasury Advantage Fund - Plan A - Quarterly Dividend30-Jun-17 1044.84 17.00
23-Mar-17 1041.25 12.28
30-Dec-16 1041.01 14.45
Baroda Pioneer Treasury Advantage Fund - Plan B - Direct - Quarterly Dividend30-Jun-17 1051.84 12.28
23-Mar-17 1046.20 12.28
30-Dec-16 1045.09 14.45
Baroda Pioneer Income Fund - Plan A - Dividend24-Jun-16 22.13 1.01
23-Mar-16 23.14 1.01
Baroda Pioneer Income Fund - Plan B - Direct - Dividend24-Jun-16 22.16 1.01
23-Mar-16 23.15 1.01
Dividend History
24
$ Face value is Rs. 10/- in all schemes other than Baroda Pioneer Liquid Fund and Baroda Pioneer Treasury Advantage Fund where the face value is Rs. 1,000/- per unit.
* Monthly income is not assured and is subject to the availability of distributable surplus.# Pursuant to payment of dividend, the NAVs of the schemes would fall to the extent of payout and statutory levy (if applicable).

31st August, 2017
BARODA PIONEER MUTUAL FUND25
karvy Computershare Private LimitedAddress and Contact detailsMFS Branches
• Bangalore [email protected] 080-26600785 • Belgaum [email protected] 0831 2402544 • Bellary [email protected] 08392 – 254750 • Davangere [email protected] 0819-2258714 • Dharwad [email protected] 0836- 2744207• Gulbarga [email protected] 0847-2310040 • Hassan [email protected] 08172 262065 • Hubli [email protected] 0836-2252444 • Mangalore [email protected] 0824-2496289 • Margoa [email protected] 0832-2731823 • Mysore [email protected] 0821-2438006 • Panjim [email protected] 0832-2426873 • Shimoga [email protected] 08182-228799 • Ahmedabad [email protected] 079-65445550 • Anand [email protected] 9662020623 • Ankleshwar [email protected] 02646 645326 • Baroda [email protected] 0265-6640870 • Bharuch [email protected] 02642-225022 • Bhavnagar [email protected] 278-3003149 • Gandhidham [email protected] 02836 651296 • Gandhinagar [email protected] 079-23244955 • Jamnagar [email protected] 0288-2558887 • Junagadh [email protected] 0285-2652220 • Mehsana [email protected] 02762-242950 • Nadiad [email protected] 0268-2563245 • Navsari [email protected] 02637-280367 • Rajkot [email protected] 2816545888 • Surat [email protected] 0261-3042170 • Valsad [email protected] 02632-258481 • Vapi [email protected] 9228012909 • Chennai [email protected] 044-42028512 • Alleppy [email protected] 0477 2263055 • Calicut [email protected] 0495-4022480 • Cochin [email protected] 0484 3000232 • Kannur [email protected] 0497-2764190 • Kollam [email protected] 0474-2747055 • Kottayam [email protected] 0481-2300868 • Malappuram [email protected] 0483-2731480 • Palghat [email protected] 491 6061110 • Thodupuzha [email protected] 0486-2211209 • Tiruvalla [email protected] 0469-3205676 • Trichur [email protected] 0487-3246231 • Trivandrum [email protected] 0471-2725728 • Coimbatore [email protected] 0422 - 4388011 • Dindigul [email protected] 0451- 6451043 • Erode [email protected] 0424-4021212 • Karaikudi [email protected] 04565-237192 • Karur [email protected] 04324-241755 • Madurai [email protected] 0452-2605856 • Nagerkoil [email protected] 04652 - 233552 • Namakkal [email protected] 04286- 23480 • Pollachi [email protected] 04259- 235111 • Pondicherry [email protected] 0413 2220640 • Pudukottai [email protected] 04322 - 220050 • Rajapalayam [email protected] 04563 - 232952 • Salem [email protected] 0427-4020300 • Sivakasi [email protected] 04562 228816 • Thanjavur [email protected] 04362-275415 • Tirunelveli [email protected] 0462 2335137 • Tirupur [email protected] 0421-2214221 • Trichy [email protected] 0431-4020227 • Tuticorin [email protected] 0461-2334603 • Vellore [email protected] 0416 2215007 • Agartala [email protected] 0381-2317519 • Guwahati [email protected] 8811036746 • Shillong [email protected] 0364 2506106 • Silchar [email protected] 03842 261714 • Ananthapur [email protected] 08554-244449 • Eluru [email protected] 08812-227851 • Guntur [email protected] 0863-2339094 •Hyderabad [email protected] 040-44677075/ 44677076/44677077/44677348 • Karimnagar [email protected] 0878-2261779 • Kurnool [email protected] 08158-228550 • Nanded [email protected] 02462-237885 • Nellore [email protected] 0861-2349940 • Nizamabad [email protected] 08462-224366 • Proddatur [email protected] 08564 - 242898 • Rajahmundry [email protected] 0883-2434468 • Solapur [email protected] 0217-2300021 • Srikakulam [email protected] 08942-225384 • Tirupathi [email protected] 0877-6544567 • Vijayanagaram [email protected] 08922-236962 • Vijayawada [email protected] 0866-2475126 • Visakhapatnam [email protected] 0891-2714125 • Warangal [email protected] 0870-2501664 • Akola [email protected] 0724-2451874 • Amaravathi [email protected] 0721-3291081 • Aurangabad [email protected] 0240-2343414 • Betul [email protected] 07141 - 231301 • Bhopal [email protected] 0755-4092712 • Chandrapur [email protected] 07172-270262 • Dewas [email protected] 07272-426010 • Dhule [email protected] 02562-282823 • Indore [email protected] 0731-4266828 • Jabalpur [email protected] 0761-3204376 • Jalgaon [email protected] 0257-2226761 • Nagpur [email protected] 0712-2533040 • Nasik nasikmfs@karvy.

31st August, 2017
BARODA PIONEER MUTUAL FUND
com 0253-6611395 • Ratlam [email protected] 07412-402007 • Sagar [email protected] 07582-402404 • Ujjain [email protected] 0734-4250007 • Asansol [email protected] 0341-3266507 • Balasore [email protected] 06782-260503 • Bankura [email protected] 03242-255964 • Barhampore (Wb) [email protected] 03482 274494 • Berhampur (Or) [email protected] 0680-2228106 • Bhilai [email protected] 0788-2295999 • Bhubaneswar [email protected] 0674-6534585 • Bilaspur [email protected] 07752-408436• Bokaro [email protected] 9204061959 • Burdwan [email protected] 0342-2665140 • Chinsura [email protected] 033-26810164 • Cuttack [email protected] 0-9238102118 • Dhanbad [email protected] 0326-6452027, 0326- 2301045 • Durgapur [email protected] 0343-6512111 • Gaya [email protected] 0631-2220065 • Jalpaiguri [email protected] 03561-222136 • Jamshedpur [email protected] 0657-6655000 • Kharagpur [email protected] 03222-253380 • Kolkata [email protected] ; [email protected] 033-40611135/ 36; 033-24659263/9267, 24635432, 24669450, 24196462 • Malda [email protected] 03512-223763 • Patna [email protected] 0612-6453098 • Raipur [email protected] 0771-4052620 • Ranchi [email protected] 0651-2331320 • Rourkela [email protected] 0661-2500005 • Sambalpur [email protected] 0663-2522105 • Siliguri [email protected] 0353-2526393, 0353-2522579 • Agra [email protected] 9369918603 • Aligarh [email protected] 9369918604 • Allahabad [email protected] 9369918605 • Ambala [email protected] 9315017301 • Azamgarh [email protected] 9307910001 • Bareilly [email protected] 9369918607 • Begusarai [email protected] 9308793949 • Bhagalpur [email protected] 9386256100 • Darbhanga [email protected] 06272-220145 • Dehradun [email protected] 9369918608 • Deoria [email protected] 7499496134 • Faridabad [email protected] 9310448851 • Ghaziabad [email protected] 9310448804 • Ghazipur [email protected] 7499496131 •Gonda [email protected] 7499496127 • Gorakhpur [email protected] 9369918610 • Gurgaon [email protected] 9310448806 • Gwalior [email protected] 9300004262 • Haldwani [email protected] 9369918611 • Haridwar [email protected] 9369918612 • Hissar [email protected] 9315017303 • Jaunpur [email protected] 9369918613 • Jhansi [email protected] 9369918614 • Kanpur [email protected] 9369918615/6 • Korba [email protected] 9300155683 • Lucknow [email protected] 9369918600 • Mandi [email protected] 9318873501• Mathura [email protected] 9369918618 • Meerut [email protected] 9369918619 •Mirzapur [email protected] 7499496133 • Moradabad [email protected] 9369918620 •Morena [email protected] 7489361265 • [email protected] 9386256101 •Noida [email protected] 9310448805 • Panipat [email protected] 9315017304 • Renukoot [email protected] 7499495854 • Rewa [email protected] 7489755878 • Rohtak [email protected] 9315017305 • Roorkee [email protected] 9369918621 • Saharanpur [email protected] 9369918622 • Satna [email protected] 9300004263 • Shaktinagar [email protected] 7499496129 • Shimla [email protected] 9318644501 • Shivpuri [email protected] 9303028921 • Sitapur [email protected] 9369918623 • Solan [email protected] 9318991871 • Sonepat [email protected] 9315457164 • Sultanpur [email protected] 9369918624 • Varanasi [email protected] 9369918626 • Yamuna Nagar [email protected] 9315017306 • Kolhapur [email protected] 0231 2653656 • Mumbai [email protected] 022-66235353 • Pune [email protected] 020-25533795 • Ajmer [email protected] 0145-5120725 • Alwar [email protected] 0144-3291200 • Amritsar [email protected] 0183-5053802 •Bhatinda [email protected] 0164-5006725 • Bhilwara [email protected] 01482-246362 •Bikaner [email protected] 0151-2200014 •Chandigarh [email protected] 0172-5101342 •Ferozpur [email protected] 01632-241814 •Hoshiarpur [email protected] 01882-500143 •Jaipur [email protected] 0141-4167714 • Jalandhar [email protected] 0181-5094410 • Jammu [email protected] 0191-2458820 • Jodhpur [email protected] 0291-6454590 • Karnal [email protected] 0184-2252524 •Kota [email protected] 0744-5100964 • Ludhiana [email protected] 0161-4648747 • Moga [email protected] 01636-230792 • New Delhi [email protected] 011-43681700 • Pathankot [email protected] 0186-5080188 • Patiala [email protected] 0175-5004349 • Sikar [email protected] 01572-250398 • Sri Ganganagar [email protected] 0154-2470177 • Udaipur [email protected] 0294-2429370 • Chembur 022-662215536 • Vashi 022-27802684 • Borivali 022- 28916319
26

31st August, 2017
BARODA PIONEER MUTUAL FUND
Contact Points:Toll Free Number: 1-800-267 0189 | Email: [email protected] | Website:www.barodapioneer.inRegistered OfficeBaroda Pioneer Asset Management Company Ltd.CIN : U65991MH1992PLC069414501 Titanium, 5th Floor, Western Express Highway, Goregaon (E), Mumbai - 400063.Phone: +91 22 3074 1000 / 4219 7999. Fax: +91 22 3074 1001.Branch OfficeBaroda Pioneer Asset Management Company Ltd.Flat No. 103 & 104, First Floor,Prakash Deep Building, 7 Tolstoy Marg, New Delhi - 110001. Phone: 011-43514662Branch OfficeBaroda Pioneer Asset Management Company Ltd. HP Complex, Flat No.12, 3rd Floor, Door No. 124/1,2&3 New No. 14, G N Chetty Road,T.Nagar, Chennai - 600017 Phone: 044 - 2834 3530, Fax: 044 - 2834 3539Mutual fund investments are subject to market risks,read all scheme related documents carefully.
• Thane 022 25428475 • Agartala [email protected] 0381-2317519 • Amaravathi [email protected] 0721-3291081 • Anand [email protected] 9662020623 • Bangalore [email protected] 080-26600785 • Berhampur (Or) [email protected] 0680-2228106 • Bhavnagar [email protected] 0278-3004116 • Bhubaneswar [email protected] 0674-6534585 • Chandigarh [email protected] 0172-5042279 • Dhule [email protected] 02562-282823 • Ferozepur [email protected] 01632-241814 • Gwalior [email protected] 9300004262 • Hubli [email protected] 0836-2252444 • Hyderabad [email protected] 040-44677075/ 44677076/44677077/44677348 • Indore [email protected] 0731-4266828 • Jalgaon [email protected] 0257-2226761 • Jalpaiguri [email protected] 03561-222136 • Jamshedpur [email protected] 0657-6655000 • Kollam [email protected] 0474-2747055 • Mirzapur [email protected] 7499496133 • Moga [email protected] 01636-230792 • Nellore [email protected] 0861-2349940 • Noida [email protected] 9310448805 • Panipat [email protected] 9315017304 • F C Road, Pune [email protected] 020-25533795 • Rajapalayam [email protected] 04563 - 232952 • Shimoga [email protected] 08182-228799 • Solapur [email protected] 0217-2300021 • Tirupathi [email protected] 0877-6544567 • Visakhapatnam [email protected] 0891-2714125