invest in ghana a stable springboard into west africa invest in ana eecutive summary after yet...
TRANSCRIPT
Invest in GhanaA stable springboard into West AfricaSeptember 2017

03
Invest in Ghana | Endnotes
“Ghana continues to hold up its reputation as one of Africa’s few politically stable democracies and provides foreign investors with the most predictable entry point into West Africa.”
04
Invest in Ghana | Table of contents
Table of contents
Executive summary 3
A peaceful democratic transition renews investor confidence 5
Betting on fiscal prudence and the oil sector rebound 8
Pro-business reforms bolster the trade and investment outlook 16
Investment opportunities 30
Endnotes 34
Contacts 36

Proposal title goes here | Table of contents
2

3
Invest in Ghana | Executive summary
After yet another peaceful election, Ghana continues to hold up its reputation in Africa as one of the continent’s few strong and politically stable democracies. Ghana’s recent peaceful democratic transition has reignited investor confidence in the country, more especially with the new government’s pro-business stance.
Nana Akufo-Addo’s government kicked off its first quarter in office with tax reforms in the 2017 National Budget to reduce various business tax rates, signalling efforts to improve the business environment.
Nevertheless, the country’s renewed positive atmosphere is undermined by the poor state of its infrastructure with businesses facing high operating costs due to frequent power shortages and delays caused by a dilapidating transport network.
To add on, rising inequality and youth unemployment is already putting pressure on government to deliver on social needs and maintain popular support ahead of the next elections.
All this is happening while the new regime struggles to find funds to balance fiscal austerity, social welfare and key business environment improvement projects due to a sizeable fiscal overhang inherited from its predecessor.
Accordingly, most analysts predict that fiscal austerity measures are likely to prevail over spending pressure from other sectors of the economy as authorities prioritise funds towards meeting the International Monetary Fund Extended Credit Facility agreement. However, austerity measures are expected to ease off in the short
term with a much anticipated recovery in the oil sector and some improvement in commodity prices.
With an uptick in commodity revenue, growth is expected to rise from an annual low of 3.5% to an annual average of 5% between 2017 and 2021, with strong growth expected in industries including financial services, telecommunications, construction, and fast-moving consumer goods (FMCG) as household consumption levels improve. As Ghana seeks to reduce inequality and alleviate poverty, its government will increasingly seek strong partnerships with the private sector presenting an array of opportunities to prospective investors.
.
Executive summary

4
Invest in Ghana | A peaceful democratic transition renews investor confidence

5
Invest in Ghana | A peaceful democratic transition renews investor confidence
0
20
40
60
80
100
Inde
x (0
-100
, 100
= B
est)
79.9 79.573.7
86.7
73 71.9 69.866.7 69.4
38.6
65.4
19.0
63.9
50.0
62.3
44.3
60.8
40.0
58.8
51.4
Mau
riti
us
Bots
wan
a
Cabo
Ver
de
Nam
ibia
Sout
h Af
rica
Tuni
sia
Gha
na
Rwan
da
Sene
gal
Zam
bia
IIAG 2016 WGI Political stability score 2015
Figure 1
Ghana has continued to consolidate democratic rule, and now enjoys a more open society, with a vibrant media and strong public dialogue. As a result of these and other political achievements, Ghana outperforms most countries
in West Africa and in the continent on measures of civil liberty, political rights and political stability.
The country ranks 8th out of 54 countries on the 2016 Ibrahim Index of African
Governance (IIAG) and 7th out of 48 countries in Africa on the Worldwide Governance Indicators (WGI). Ghana has a solid democratic tradition, completing its seventh consecutive peaceful democratic election in December 2016.
A peaceful democratic transition renews investor confidence
Figure 1. Top 10 best governed and politically stable African states
Ghana’s political stability indicators are testament to the country being one of the most stable and predictable political environments for investors in Africa.
Source: IIAG, 2016, WGI 2016

6
Invest in Ghana | A peaceful democratic transition renews investor confidence
While the recently elected New Patriotic Party (NPP) government under President Nana Akufo-Addo will enjoy a period of strong popular support over the coming months, it is expected that failure to quickly deliver on substantial election promises due to a tight fiscal budget will start to see support diminish.
The current government has inherited a large budget deficit from the previous regime and in efforts to maintain the terms of their current International Monetary Fund Extended Credit Facility (IMF ECF) will be poised for fiscal consolidation irrespective of Akufo-Addo’s campaign promises. By limiting spending government will maintain IMF and investor confidence.
Though Ghana’s growth reached its lowest point in a decade in 2016 (3.5% as reported by GSS1), its growth performance over the past 20 years appears to have been somewhat inclusive. In this view, IMF research2 shows a strong positive relationship between economic growth and household consumption in Ghana over the period 1995-2010, with the poorest quartile of the consumption distribution showing fairly high final consumption growth.
In view of that and based on its national poverty line statistics, its robust economic growth performance over the past 20 years helped to halve the country’s poverty rate, from 52.6% to 21.4% between 1991 and 2012. This was largely achieved through structural transformation under Ghana’s Growth and Poverty Reduction Strategy and as a result, the country reached a new level of development achieving a lower middle income status as per World Bank classification after rebasing its economy in 2010.
This positive trend is however, overshadowed by rising unemployment levels especially among the youth. World Bank data shows unemployment rose from a low of 4% to 5.8% between 2012 and 2016 and according to the latest Ghana Living Standard Survey only about 12%3 of the working population is in formal employment. Ghana will need faster growth through structural reforms, including diversification and business environment improvement to increase job creation and curb unemployment.
Now Ghana’s main socio-economic challenge is to reduce income inequality across its population. For instance, between 1991 and 2012, Ghana’s Gini index rose by 3.3% from 37.5 to 40.8. In recent years poverty has intensified in northern parts of the country and in rural areas, with a third of all people living under poverty line located in rural areas. Inequality is expected to worsen especially after GDP growth dropped by more than half over the past five years to 3.5% in 2016.
However, with an imminent recovery in the oil sector and renewed focus by government on industrialisation, infrastructure development, fiscal prudence and improving the business environment the prospects for investors remain positive as Ghana’s middle-class population is resultantly anticipated to grow considerably over the medium term. Prospects are especially bright for the private sector as government acknowledges it cannot turn the economy around alone and that it needs strong partnerships with the private sector to meet its economic development targets.

7
Invest in Ghana | A peaceful democratic transition renews investor confidence

Invest in Ghana | Betting on fiscal prudence and the oil sector rebound
8
0
3
6
9
12
15
Real
GD
P gr
owth
7.9 7.6
14.0
8.29.3
8.6
7.36.6
3.94.0 3.8 4.03.5
4.9
Real GDP growth Non-oil real GDP growth
Figure 2
2010
2011
2012
2013
2014
2015
2016
*
Economic backgroundAfter a prolonged period of serious economic deterioration due to excessive government intervention, hyperinflation and loose fiscal management, in 1983 Ghana launched an economic recovery programme (ERP), as proposed by the IMF and the World Bank. The ERP entailed liberalisation of the external sector and market-oriented policies, transpiring in a drop in inflation from over 100% in 1983 to 10% by 1991 and an average GDP growth of 5% per year over that period.
Fiscal imbalances reappeared in 1992. Driven mainly by an excessive public sector wage bill and further fiscal indiscipline, the
country slipped back into high inflation. However, later in 1993-94, supported by increased tax revenue from cocoa exports, authorities managed to reduce fiscal and external imbalances.
The country continued to face macroeconomic instability until 1997 when authorities, motivated by the need to meet ambitious growth targets under the country’s then Vision 2020 programme, launched a fiscal adjustment plan. The plan succeeded in cutting the overall budget deficit to 8.6% of GDP from 10.4% of GDP in 1996, with the primary balance improving to a 3.3% of GDP surplus from 0.3%.
By the early 2000s, after two decades of economic recovery and structural reforms, though macroeconomic fundamentals were still weak, the economy took off rapidly, with annual growth rates of between 3% and 6%. This progression was not coincidental as there was continuous improvement of the economy across all dimensions, with notable advancement in manufacturing and the commodity trade, rising public and private investment and an increasingly favourable business environment.
Betting on fiscal prudence and the oil sector rebound
Though growth dropped substantially after the 2014 oil price collapse and the country has had its fair share of economic challenges since, with a looming recovery in its oil sector and renewed commitment to maintaining fiscal prudence Ghana remains among the most promising growth hotspots on the continent.
Figure 2. Ghana’s GDP growth performance (%), 2010-16
Source: GSS,2017

9
Invest in Ghana | Betting on fiscal prudence and the oil sector rebound
Recent growth performanceFollowing a slowdown in growth in 2009, and with the dawn of oil production from the Jubilee oil fields, as shown in Figure 2 Ghana’s economy gained momentum in 20104 recording real GDP growth of 7.9%. After officially commencing oil production in December 2010, supported by new oil export revenues and strong export performance of gold and cocoa exports, as well as the rebasing of its GDP, Ghana in 2011 became the fastest-growing economy in the world. GDP growth soared to 14% that year (8.2% excluding oil).
Though growth slowed from its peak in 2011, Ghana strongly outperformed the West African and sub-Saharan African (SSA) regional growth rate since. Yet, the
strong growth performance plummeted to below both country groupings’ average performance after the 2014 oil price collapse. Later in 2015, based on IMF data in Figure 3, Ghana reported its lowest growth rate in a decade at 3.5%, down from 4% in 2014.
In addition to the 2014 global oil price collapse, the 2015 slump in growth stemmed from a number of economic challenges. These include rising public debt levels, a growing fiscal deficit and substantial external sector deficit, a deepening energy crisis, and low commodity prices affecting not just the country’s oil but also gold and cocoa exports.
With better performance of the mining and retail sectors after peaceful elections the country’s GDP growth improved to 4.5% in 2016 from 3.5% in 2015.5 The non-oil GDP growth rose from 4.0% in 2015 to 4.9% in 2016.6
Ghana is also among the few countries that recorded a pickup in economic activity in 2016 (4.5%) which is expected to strengthen further into 2017 (7.7%). While this recovery means that Ghana is again expected to outperform its regional peers, achieving this also partially depends on the quick resolution of the ongoing power crisis, as well as new oil wells coming on-stream, improved cocoa and gold production, and continued adherence to fiscal consolidation measures.
2000
2001
2002
2003
2004
2005
2006
2007
2008
2009
2010
2011
2012
2013
2014
2015
2016
2017
f
2018
f
2019
f
2020
f
2021
f
Ghana SSA
16
14
12
10
8
6
4
2
0
-2
-4
Real
GD
P gr
owth
Figure 3
West Africa World
Figure 3. Comparison of Ghana’s GDP growth forecast and performance (%), 2000-21f
Source: IMF,2017

Invest in Ghana | Betting on fiscal prudence and the oil sector rebound
10
Oil & Gas Mining & Quarrying Industry
Shar
e of
GD
P
0
20
40
60
80
100
2006
2007
2008
2009
2010
2011
2012
2013
2014
2015
2016
48.8 50.2 48.6 49.2 51.1 49.1 49.1 49.8 51.9 54.6 56.9
48.8 50.2 30.4 29.1 31.0 31.8 29.825.3 22.9 22.4 21.5 20.3 18.9
15.718.0
11.410.210.710.5
16.416.918.018.018.02.8 2.8 2.4 2.1 2.3
0.4
8.46.7
9.57.7
9.48.2
8.07.2
4.14.22.1
5.3
Agriculture Services
Figure 4
Source: GSS, 2007, Industry includes: manufacturing, electricity, construction, and water & sewerage. Agriculture includes: crops, cocoa, livestock, fishing, and forestry. Services includes: trade & repair, tourism, transport & storage, information & communication, financial & insurance activities, real estate, professional, administrative & support service activities, public administration & defence, social security, education, and health & social work.
Figure 4. Share of GDP by economic activity (%), 2006-16
Key growth driversGhana is currently experiencing its second oil boom in the course of a few years. Though the economic benefits are only likely to be felt in 2017-18 as production increases, in August 2016 the first oil from the TEN oilfields came on stream. The Sankofa fields are also expected to increase Ghana’s oil and gas output in 2017-18. On top of this, production from Ghana’s first oilfield, Jubilee, is scheduled to pick up from 2018 after a series of technical problems in 2016 and development work in 2017. Although oil is expected to drive growth in 2017–18, non-oil activity is likely to continue accounting for over 90% of Ghana’s economic output. A number of non-oil sectors are in fact driving growth, with the services sector likely to be the main thrust behind non-oil growth in the years to come.
The services sector recorded the highest growth rate, averaging 5.7% per year over 2015-16, followed by agriculture at 3.0%. With its share of GDP rising from 54.6% to 56.9% between 2015 and 2016, the services sector remains the largest sector in Ghana.7 Most of the period’s growth in the sector came from the information and communication, and the health and social works subsectors. Both sectors reported double-digit growth at 21.7% and 16.8% respectively.
In contrast, the industry sector contracted from -0.3% to -1.4% in 2015 and 2016 respectively. Although the sector accounted for the second largest share of GDP at 24.2% in 2016, it is the worst-performing sector. Of all the industrial activities the electricity subsector recorded
the highest growth at 11.7% in 2016. Taking oil out of the equation, GDP for industry grew by 3.6% in 2016 after shrinking by -0.7% in the previous year.
While the agricultural sector growth rate marginally improved from 2.8% in 2015 to 3.0% in 2016, the sector’s share of GDP declined from 20.3% to 18.9% between 2015 and 2016. Crop farming maintained its position as the largest agricultural sector activity with a share of 14.5% of GDP.
On the other hand, long-term sector growth data from the Ghana Statistical Service shows that over the last decade (2006 16) non-oil GDP expanded by 83% in real terms. Farming, fishing and forestry grew by only 44%. Industry grew by 80%, with one subsector – construction,
outperforming the total economy average and increasing by 199% – tripling in size over the period. The best performance came from the services sector which more than doubled over the period, with most subsectors also ahead of the total non-oil economy average. The top growth performers of the services subsectors included information and communication which grew by 578% and finance and insurance by 234% – both coming from a low base; while transport and storage grew by 63%.
Ghana Statistical Service data show that the main sectors that thrusted the country’s long-term growth forward between 2006 and 2016 were the services and industry sectors.

11
Invest in Ghana | Betting on fiscal prudence and the oil sector rebound
The services sectorThe main outperformers in the services sector include healthcare, education, mobile communication, and trade and repairs services. The healthcare sector grew by 131% over the 2006-16 period. The subsector could perform even better if inefficiencies in the national insurance scheme that result in payment delays are resolved.
With an increasing number of children, particularly girls, enrolled in school, education grew by 118% over the decade. This growth in education is expected to accelerate if government succeeds in making public secondary education free.
Underlying the rapid growth in the information and communication, and in the finance and insurance subsectors is mobile communications. On the back of increasing internet literacy, and mobile finance, rising mobile data usage is propelling the sector. With constant technological advancement, such as cross-network mobile banking interoperability and various digitised services applications, the mobile boom is still in its infancy in Ghana. As a result, continued rapid growth is expected in information and communication, as well as in retail banking and insurance in the long term.
The increase in quantity of goods being sold and rising sophistication in retailing is reflected by the recorded 124% growth in trade and repairs services in the past 10 years leading to 2016. Trade is expanding away from street vending towards shops and markets, and also from high streets to more upmarket shopping malls.
The industrial sectorGhana’s construction industry boomed over the last decade, and was the main subsector underpinning strong expansion in the industrial sector. The construction boom was largely driven by major airport, road and sea infrastructure projects, new retail and office space construction for the growing services sector and an extensive housing deficit induced demand. Facing a significant housing shortage of roughly 1.7 million units, according to various industry estimates – projected to rise to 2 million by 2018 – the construction sector is expected to continue performing well in the long term.
The sector’s strong performance is further emphasised by its resilient growth regardless of the country’s persistently complicated and inefficient land ownership system. Even in the midst of both public and private project financing constraints and major payment delays from
government – the industry’s main client – the construction sector continues to perform. With such robust growth, Ghana’s currently underdeveloped mortgage market presents an opportunity for further growth, especially if land ownership and collateral challenges can be overcome.
Besides construction, although manufacturing and mining are perceived as key subsectors that should be contributing significantly towards economic growth, both showed poor growth performance, expanding at 31% and 35% respectively over the past decade.
The manufacturing sector particularly offers much wider economic potential, for example by value addition of output from sectors such as mining and agriculture but capacity remains weak due to structural weaknesses in the country’s logistics network, labour risks, and high import reliance for critical inputs. However, government has recognised these hindrances and should proposed plans to improve the business environment materialise, the broader manufacturing sector could become one of the country’s main growth drivers.
Real
GD
P gr
owth
0
20
40
60
80
100
120
44%
80%
116%
83%
48.8
Figure 5
Agri
cult
ure
Indu
stry
Serv
ices
Tota
l non
-oil
Figure 5. 10-year non-oil real GDP growth by sector (%), 2006-16
Source: GSS,2017

Invest in Ghana | Betting on fiscal prudence and the oil sector rebound
12
Figure 7. Public debt burden (%), 2000-16
0
50
100
150
200
% o
f GD
P
182.2
142.2133.3
121.4
94.2
78.1
26.331.0
46.333.6
42.636.1
60.350.1
70.8 68.072.2
Figure 7
2000
2001
2002
2003
2004
2005
2006
2007
2008
2009
2010
2011
2012
2013
2014
2015
2016
-12
-10
-8
-6
-4
-2
0
% o
f GD
P
-8.6
-7.4
-9.0
-4.1
-11.7 -11.5 -11.9
-10.1-9.4-9.6
-7.7
-6.7 -6.4
-9.1
Current account balance Fiscal balance
2010
2011
2012
2013
2014
2015
2016
2017
f
2018
f
2019
f
2020
f
2021
f
-6.0
-4.9
-6.1
-7.4
-4.6 -4.6-4.3
-6.3
-4.3
-5.9
Figure 6
Source: IMF, BMI8 2017
Figure 6. Current account and budget balance (%), 2010-21f
Fiscal and monetary positionFiscal positionFor over a decade now, Ghana has faced persistent twin deficits due to fiscal mismanagement. After the outgoing administration built up a fiscal deficit of 9% of GDP in 2016, the new government is faced with the task of balancing between
staying true to its ambitious manifesto commitments and implementing fiscal consolidation.
Following some considerable progress with fiscal consolidation under the previous regime, the fiscal deficit dropped to 6.7% of GDP in 2015 from 9.4% in 2014.
However, efforts to narrow it to 5.3% of GDP in 2016 failed with the deficit rising to 9.1% of GDP. Despite this, in a show of the country’s economic resilience, Ghana’s GDP still rose from 3.6% to 4.5% between 2015 and 2016 against the IMF’s negative forecast of a slowdown to 3.4% in 2016.
Source: BMI,2017

13
Invest in Ghana | Betting on fiscal prudence and the oil sector rebound
Ghana’s external balance also improved in 2016 in spite of weak commodity prices, indicating increased exports and a fall in imports. The current account deficit contracted from 7.7% to 6.4% of GDP between 2015 and 2016.
The country is likely to face continued high domestic and external financing costs as its debt expands and global interest rates rise. With these financing constraints in mind, President Akufo-Addo’s government faces a number of major challenges from a fiscal perspective including rising youth unemployment and continued delays in resolving outstanding debt obligations of Ghana’s energy state-owned enterprise (SOE) the ECG.9 Besides this, high electricity costs persist as the energy SOE’s generation capacity remains erratic in the midst of rising electricity demand.
Considering the required balancing act, the government is putting in place measures to boost its revenue through increased tax compliance and collection. These efforts are expected to be supported by stronger royalty payments from new oil production and a strengthening of the wider economy. However, Ghana’s 2017 budget contained a number of corporate tax cuts that will limit expansion of its fiscal revenue.
In terms of expenditure plans, government has signalled its intention to contain recurring spending, mainly compensation of civil servants, to enable spending growth on infrastructure, education and its proposed industrialisation programme. Given the NPP’s fiscal plan, government is expected to only slightly miss its 6.5% fiscal deficit target for 2017,10 yet it is unlikely that current fiscal consolidation efforts will see government achieve the 2019 fiscal deficit target of 3%.
In view of this, the rate of decline in the fiscal deficit is unlikely to have a significant impact on lessening the public debt burden, which will likely remain above 70% of GDP throughout 2017-21. This means for Ghana to maintain long-term debt sustainability and consecutively investor confidence it will need a period of continued fiscal discipline together with sustained robust GDP growth levels.
Ghana has been struggling with double-digit inflation rates for most of the past decade. After remaining intractably above 17%, inflation fell slightly to 15.4% in December 2016 and then fell further to 13.3% in January 2017, closer to the Bank of Ghana’s (BoG) target range of 6-10%. Year-on-year inflation is expected to come down markedly in 2017, but mainly owing to base effects. However, inflation is expected to remain at double-digit levels until mid-2018,
given marginally higher global commodity prices, high chances of further utility price hikes and marginal chances of fiscal consolidation and monetary policy easing.
Beyond 2018, inflation is expected to average 8.7% in 2019 and then pick up to 9.4% towards 2020 as fiscal policy is loosened further ahead of elections, before dropping again to 8.7% in 2021 as fiscal policy tightens after elections.
The BoG will face constraints in trying to curb inflation due to political and business pressure to lower interest rates in order to boost economic growth. As observed historically, political pressure is expected to prevail against monetary policy targets and a slight bias towards boosting growth is likely, but not to the extent of destabilising the economy.
Though at a slower pace than anticipated by government and the business community, the interest rate will likely fall while inflation is expected to remain above the upper-bound target of 10% in the short term. A loser monetary policy stance in 2019 is probable, especially should global economic conditions not improve to the extent anticipated. Thereafter, some tightening to counteract inflationary pressure from election linked spending is anticipated in 2020.
Figure 8
2000
2001
2002
2003
2004
2005
2006
2007
2008
2009
2010
2011
2012
2013
2014
2015
2016
2017
f
2018
f
2019
f
2020
f
2021
f
35
30
25
20
15
10
5
0
Rate
s (%
)
Inflation rate (Consumer prices) Central bank interest rate
Figure 8. Current account and budget balance (%), 2010-21f
Source: BMI,2017

Invest in Ghana | Betting on fiscal prudence and the oil sector rebound
14
Figure 9
Jul-1
2
Sep-
12
Nov
-12
Jan-
13
Mar
-13
May
-13
Jul-1
3
Sep-
13
Nov
-13
Jan-
14
Mar
-14
May
-14
Jul-1
4
Sep-
14
Nov
-14
Jan-
15
Mar
-15
May
-15
Jul-1
5
Sep-
15
Nov
-15
Jan-
16
Mar
-16
May
-16
Jul-1
6
Sep-
16
Nov
-16
Jan-
17
Mar
-1
May
-17
Jul-1
7
5
4
3
2
1
0
GH
¢/U
S$
In recent years, due to cedi weakness, intermittent attempts to control capital outflows have created difficulties for foreign firms looking to move capital out of Ghana.11 Accordingly, investors should be cautious of foreign payment settlement issues due to unpredictable regulations surrounding outbound foreign currency payments.
The cedi, trading at GH¢4.39:US$1 in July 2017, was volatile in the first half of the year, but this volatility is likely to recede as the political environment stabilises and the economy starts to pick up pace over the course of 2017. In particular, the cedi will be supported by new foreign currency revenue from the TEN oil field.12
It is also expected that the cedi will weaken upon renewed political uncertainty ahead of Ghana’s 2020 elections before it returns to greater stability in 2021, as local and global sentiment improves. The Economist Intelligence Unit N.A. Incorporation forecasts show the cedi weakening to an average of GH¢5.9:US$1 in 2021 from an average of GH¢3.91:US$1 in 2016.13
Growth prospectsIts near-term economic prospects are favourable, should the government manage to maintain fiscal discipline. Besides fiscal prudence, a possible recovery in short-term commodity prices is also expected to support growth and exports, and in turn restore exchange rate stability and help create employment.
However, short-term challenges and downside risks remain, emphasising the importance for government to build credibility through fiscal discipline. Moreover, global economic uncertainties, including fears about the sustainability of the emerging recovery in commodity prices, bear a downside risk on foreign direct investment (FDI) flows to Ghana. Even so, according to BMI14 GDP growth is anticipated to accelerate 6.3% in 2017 and 6.2% in 2018, from a decade-long low of 3.5% in 2016 on the back of gains in both the oil and non-oil sectors.
As the TEN oil field reaches its full capacity and repairs in the Jubilee oil field are completed, the country’s oil production and revenue is expected to increase in the short term. Non-oil sector growth, is also expected to remain robust. The services sector is expected to show the strongest growth and is set to surpass 60% of GDP in the coming years. Meanwhile growth prospects in other non-oil sectors such as manufacturing and agriculture, will largely depend on the vision and success of government support.
The second oil boom has the potential to yield enough activity in other sectors through positive externalities to maintain robust economic growth in the long term. Accordingly, falling inflation, stronger economic growth and improved power supply will all contribute to greater private sector participation and improve the investment climate in Ghana.
Figure 9. Exchange rate (cedi to US dollar), July 2012 – July 2017
Source: BMI,2017

15
Invest in Ghana | A peaceful democratic transition renews investor confidence

16
Invest in Ghana | Pro-business reforms bolster the trade and investment outlook
1st Pillar: Institutions
2nd Pillar: Infrastructure
4th Pillar: Health and primary education
5th Pillar: Higher education and training
6th Pillar: Goods market efficiency7th Pillar:
Labour market efficiency
8th Pillar:Financial market
development
9th Pillar:Technological
readiness
10th Pillar:Market size
11th Pillar:Business
sophistication
12th Pillar:Innovation
3rd Pillar:Macroeconomic environment
01
5
7
4
Ghana Sub-Saharan Africa
Figure 10
6
2
3
The business environmentUnderscored by limited legal and security risks, Ghana provides a relatively more competitive operating environment compared to other key economies in the region. Though it boasts a much smaller market than Nigeria, a lower likelihood of terrorism and much fewer incidences of violent assault are reported in Ghana. What’s more, the country provides a more clearly regulated and open market system when compared to regional peers such as Nigeria, Côte d’Ivoire and Senegal. The country’s predictable operating environment sets it apart as a suitable point of entry for businesses looking to invest in West Africa.
Besides providing a predictable environment, located less than 10 hours by plane from Europe, South Africa, the US and the UAE, and holding two of West Africa’s major sea ports, Ghana is also well-positioned geographically for trade into the region. Ghana’s ports do not only handle over 80% of the country’s trade, but also serve as a traffic junction for exports and imports with landlocked countries in West Africa including Mali, Niger and Burkina Faso.
Over the past decade, economic policy reforms have seen barriers to trade and investment decrease in Ghana and yielded significant growth in trade and inward FDI flows.
The country offers investors a relatively peaceful business environment compared to the rest of the region with limited discrimination against foreign-owned businesses, a variety of investment incentives, a stable and predictable political environment, a free-floating exchange rate regime, a large population and vast natural resources.
Global investment climate assessments such as the EODB15 indicate that Ghana moved up three places to rank 108th in 2016 from 111th in 2015 out of 190 countries. Overall, the report showed that three areas of business improved, including getting electricity, trading across borders and resolving insolvency.
The biggest area of improvement was trading across borders (up 13 places) while starting a business showed the largest deterioration (down 7 places). Ghana performed above the SSA regional average in all the EODB indicators, apart from those relating to protecting minority investors, getting credit, the time required to deal with construction permits and trading across borders.
Ghana also ranked 114th out of 138 countries in the WEF GCI 201716 and remains, relatively speaking, globally uncompetitive. Within the continent, however, Ghana ranked 16th in Africa and 1st in West Africa, making it the most competitive business destination in West Africa. The WEF GCI 2017 also showed that Ghana outperformed the average SSA score17 in all 12 competitiveness pillars except the macroeconomic environment pillar, which can be explained by recent years of twin deficits, and the country’s debt overhang.
Figure 10. WEF global competitiveness performance
Pro-business reforms bolster the trade and investment outlook
Despite facing macroeconomic challenges in recent years, Ghana remains one of the most promising business destinations on the continent.
Source: WEF GCI,2017

17
Invest in Ghana | Pro-business reforms bolster the trade and investment outlook
Source: WEF, Executive Opinion Survey 2016. Note: From the list of factors, respondents to the World Economic Forum’s Executive Opinion Survey were asked to select the five most problematic factors for doing business in their country and to rank them between 1 (most problematic) and 5. The score corresponds to the responses weighted according to their rankings.
Figure 11. Most problematic factors to doing business
Figure 11
0 5 10 15 20
Access to financingCorruption
Tax ratesForeign currency regulations
InflationTax regulations
Inadequate supply of infrustructurePolicy instability
Poor work ethic in national labour forceInsufficient capacity to innovate
Inefficient government bureaucracyCrime and theft
Poor public healthInadequately educated workforce
Restrictive lobour regulationsGovernment instability
1814.4
148.8
76.5
6.35.5
4.94.5
3.71.9
1.71.6
0.70.5
As part of the British Business Enabling Environment (BEEP) programme,18 in 2016 the number of formal firms registered increased by 1.5% with 60,230 registered compared to 59,372 in 2015, indicating better private sector response to business environment reforms and ease of regulations.
Backing the favourable investment climate and boasting low labour costs, a high literacy rate (76.6%), high urbanisation (54.7%), flexible employment conditions and a large migrant worker community sustained by the gradual relaxation of work visa-restrictions, Ghana has a relatively attractive labour market compared to most SSA countries. The country offers limited labour market risks compared
to the rest of the region. However, poor access to its underfunded higher education system coupled with low life expectancy have kept the size of its skilled labour force considerably low.
Ghana has also performed fairly well on Transparency International’s (TI) corruption perception index, where it ranked 56th out of 168 countries on a significant improvement from 64th place in 2012. According to the index Ghana was the seventh least corrupt country in Africa. Ghana was also the eighth best-governed country in Africa as per the 2016 Mo Ibrahim Index. However, of concern is that Ghana registered some of the continent’s biggest deteriorations in overall governance over the last ten years.
While Ghana boasts a number of advantages for manufacturers, including access to 300 million consumers in the ECOWAS19 market, competitive labour costs and a host of raw material inputs, 2014-16 was a particularly challenging period for the industrial sector, in large part due to power shortages, limited credit and high overhead costs.
Furthermore, according to results from the WEF GCI 2017 Executive Opinion Survey20 the most pressing challenges for firms operating in the country include weak access to competitive financing, high tax rates and corruption, intermittent foreign exchange withdrawal limits and high inflation, which pointedly raise operating costs.

18
Invest in Ghana | Pro-business reforms bolster the trade and investment outlook
Although there have been recent improvements, another major business environment concern in Ghana remains intermittent power shortages. As government aims to achieve universal access by 2020, access to electricity in Ghana has improved over the last few years from 64% in 2012 to 78% in 2016 and is much higher than the SSA average of 35%. However, despite progress in access levels, improvement in generation capacity has been quite slow. Power shortages have plagued the country since the 1980s and in the past five years the country experienced its most severe shortages, now infamously known locally as “dumsor”.
The country’s power supply disruptions arose due to damage to the West African Gas Pipeline (WAGP), higher than usual seasonal drops in dam water levels, and increased demand as electricity access improved. According to a 2015 report by Ghana Statistical Service, power outages saw the country lose on average US$2.2m in output per day.21 Growing at 10-15% per year, peak demand for electricity rose to 1,757MW in 2015 from 1,658MW in 2012 and to keep pace with demand, the Ghanaian Energy Commission predicts the country will need an additional 4,000-4,200MW from the current generation capacity of about 3,600MW.
The problem is not unique to Ghana, and many countries in SSA face similar challenges. However, Ghana is among the most advanced in its strategies to boost capacity. Authorities have recognised the negative impact the country’s power shortages had on businesses during the crisis and are now taking steps to ensure a stable power supply.
Consequently, the 2017 budget includes plans to generate 3% of total power supply to the national grid from renewable energy in addition to delivery of off-grid solar power to 38,000 households. Though
faced with opposition from the public utility trade union, government is also developing a new electricity masterplan, which entails possible listing of state-owned power companies on the stock exchange. Such asset sales would not only move the underperforming utilities off the government’s books, but private ownership may also make them more efficient.
While the government is working to further streamline the sector and increase installed capacity to improve efficiency and ensure supply, it is also looking for private partners to assist with securing funding and reforming a number of its core power projects and institutions. Ghana’s Independent Power Producer (IPP) programme and continued liberalisation of the energy market have led to improvements in generation capacity in recent years and with several long-term projects in place, government is counting on IPP projects, such as the 350MW Cenpower plant in Kpone and the 360MW Jacobsen plant in Inchaban, to help manage short-term power shortages.
With a range of power projects underway, particularly gas-to-power projects supported by a domestic natural gas feedstock, Ghana’s electricity troubles are highly likely to dissipate in the long term. Ghana’s power supply challenges are seen as the main obstacle to its business environment and once resolved will likely be a major game changer, resulting in a significant uptick in economic output.
In conjunction with improving power supply, authorities are focused on improving the business environment through a variety of policies and national infrastructure projects with particular priority on boosting exports and attracting investment as an integral part of the country’s economic development strategy.
With trade and investment prominently featured in Ghana’s economic policy, as seen in GSGDA,22 the policy reforms implemented over the past decade have and continue to position Ghana as one of the most competitive investment hotspots on the continent. In view of this, continued political stability and an improving business environment, coupled with a bright growth outlook, is expected to help Ghana maintain increasing levels of foreign investment over the long term.
Trade trendsComplementing its advantageous geographical location, Ghana has had a number of trade policy reforms that have particularly focused on improving the competitiveness of exporting companies, helping them to diversify their exports and penetrate new markets. Ghana has negotiated preferential access to various regional and western markets through trade agreements including the ACP-EU Partnership Agreement, the European Union’s Economic Partnership Agreement (EPA), the US African Growth and Opportunity Act (AGOA) and the ECOWAS Trade Liberalisation Scheme (ETLS).23
As a member of ECOWAS, since February 2016, Ghana has been implementing the Common External Tariffs (CET) to harmonise trade tariffs within the regional community.24 Furthermore, under its World Trade Organisation membership (WTO) Ghana recently ratified the Trade Facilitation Agreement (TFA) which is expected to boost trade by doing away with red tape and bureaucratic delays and expediting the movement, release and clearance of goods in the country.25 Given its geographical endowment and strategic trade agreements, it comes as no surprise that Ghana is the third largest total exporter and importer in SSA after South Africa and Nigeria.26

19
Invest in Ghana | Pro-business reforms bolster the trade and investment outlook
Table 1. Ghana’s trade agreements
Agreements Status Positive effect on businesses
EU-EPA Active High – Under the EPA, Ghana is allowed to have 100% access to the EU market for all goods except rice and sugar, while EU countries will have around 75% access to the Ghanaian market duty free and quota free. The large production capacity of firms in EU countries allows the EU to benefit considerably. However, local manufacturers would struggle to compete with EU imports under the prevailing operating conditions.
ACP-EU Active High – Duty and quota-free access for exports to the EU. Free access to the EU market of half a billion people for all ACP products, providing plenty of scope for economies of scale.
US AGOA Active High – AGOA provides quota and duty free access for Ghanaian exports to the US. In addition, many US companies operate freely in the country, which may provide numerous trade opportunities in the long run. However, this does not entail total tariff free access.
ETLS Active Moderate – Ghana is a key member of ECOWAS which seeks to foster regional cooperation in several areas, including removal of barriers to the movement of people and goods, harmonisation of agricultural policies, improvements in infrastructure, and renewed commitment to democratic political processes and non-aggression against member states. However, conflicts, weak institutions and poor infrastructure have thwarted many of the group’s goals and regional progress has been slow. Furthermore, the free movement of people and goods has been impeded by the lack of a common language, varying customs rules and differing currencies. Trade between members has been below 10% of total regional trade volumes, despite having a total population of over 300 million. ECOWAS members tend to trade more with other countries than among themselves.
Despite the free trade agreements with various markets, foreign firms importing goods into Ghana should still expect significant tariffs to raise the cost of their products. Importers are confronted by a variety of fees and charges in addition to tariffs, which have contributed to the high inflation in the country.
Source: BMI,2017

20
Invest in Ghana | Pro-business reforms bolster the trade and investment outlook
Table 2. Ghana’s tariff and non-tariff trade barriers to trade
Measure Type Business Impact
Customs and non-tariffbarriers
Moderate
• Destination inspection companies (DICs) are licensed by the Ghanaian government, and inspection by the DICs accounts for the longest delays in import clearance. This presents supply chain delays and disruptions, exposing businesses to increased market risks and costs associated with obsolete and damaged goods.
• Businesses in the food and drink sector are exposed to more supply chain and trade risks due to the fact that between May and October each year, there is a temporary ban on the importation of fish, except on imports of canned fish, to protect local fishermen during their peak season.
• Certificates are required for imports of food, cosmetics, and agricultural and pharmaceutical goods. Permits are required for poultry and poultry product imports. At the time the permit is issued, a quantity limit is imposed.
• In 2013 Ghana introduced regulations on the importation of cotton and textiles into Ghana by limiting the entry points for imports. Only three checkpoints remain open for cotton imports, namely: Kotoka Airport and the ports of Tema and Takoradi.
• According to the World Bank, it takes 10 procedures and 72 days to establish a foreign-owned limited liability company that wants to engage in international trade, in Ghana. Foreign investors must obtain a certificate of capital importation, which can take 14 days. The local authorised dealer must confirm the import of capital with the Bank of Ghana, which will then confirm the transaction to the Ghana Investment Promotion Centre (GIPC) for investment registration purposes.
Import tariffs
High
• Importers are confronted by a variety of fees and charges in addition to tariffs which have contributed to the high inflation in the country. Ghana levies a 15% value-added tax (VAT) (increased from 12.5% in 2014) plus a 2.5% National Health Insurance levy on the duty-inclusive value of all imports as well as on locally-produced goods, with a few selected exemptions.
• The average tariff in Ghana is 10%, positioning it around the average (9.5%) in the West Africa region.
• The highest tariff is around 20% and applies to products mainly in the agricultural and textiles industries as well as mobile phones.
• In addition, Ghana imposes a 0.5% Economic Community of West African States (ECOWAS) surcharge on all goods originating in non-ECOWAS countries and charges 0.4% of the free-on-board value of goods (including VAT) for the use of the automated clearing system, the Ghana Community Network.
• Under the Export Development and Agricultural Investment Fund (EDAIF) Act, Ghana imposes a 0.5% duty on all non-petroleum products imported in commercial quantities, a 1% processing fee on all duty-free imports, and an inspection fee of 1% of the landed value of the goods. The local automotive sector enjoys some protection from cheap imports as a separate examination fee is applied to imported vehicles.
Export taxes orrestrictions
Moderate
• Since 2014, the harvesting and exportation of Rosewood timber is banned. The country also prohibits the exportation of scrap metal in order to support the operations of local steel manufacturing companies.
Source: BMI,201727

21
Invest in Ghana | Pro-business reforms bolster the trade and investment outlook
Figure 13
Crude oil and pertoleum
Motor vehicles for the
transport of persons
Ships, boats &
floating structures
Motor vehicle for
transport of goods
Civil engineering plant
& equipment
Other
7%6%
4%
4%
4%
75%
Ghana imports 2016
Gold (excluding ores
& concentrates)
Cocoa
Crude oil and petroleum
Fruits and nuts
(excluding oil nuts)
Ores and concentrates
of base metals, n.e.s.
Other
16%
2%4%
14%
23%
41%
Ghana exports 2016
Though Ghana is one of Africa’s largest trading nations, Ghana’s export revenue remains dominated and heavily dependent on commodities including gold, cocoa, and oil which together account for 78% of exports. Consequently, after the 2014 commodity price collapse, combined oil exports revenue dropped to US$1.4bn in 2016 from a high of US$3.3bn in 2012 and the country recorded a 22% drop in total merchandise exports revenue between 2014 and 2015.Figure 12
0 20 40 60 80 100 0 20 40 60 80 100
89.8
38.4
16.7
11.7
10.5
10.3
10.0
7.8
7.4
6.7
89.3
47.6
19.8
19.1
18.2
12.6
11.3
10.8
10.8
9.9
Total exports (US$ billion) Total imports (US$ billion)
South Africa
Nigeria
Ghana
Côte d’Ivoire
D.R Congo
Kenya
Tanzania
Botswana
Zambia
Cameroon
South Africa
Nigeria
Ghana
Kenya
Ethiopia
D.R Congo
Côte d’Ivoire
Tanzania
Congo
Sudan
Top 10 exporters Top 10 importers
Figure 12. Top 10 SSA exporters and importers (US$bn), 2016
Figure 13. Trade by product (%), 2016
Source: UNCTAD,2017
Source: UNCTAD,2017

22
Invest in Ghana | Pro-business reforms bolster the trade and investment outlook
Ghana’s largest export in 2016 was gold at 41% of total exports. Switzerland, Netherlands and China accounted for the bulk of its gold, cocoa and oil exports at 41%, 25% and 33% of total exports respectively. Switzerland was also Ghana’s largest export destination at 17% of total exports.
In terms of imports, in recent years, capital equipment, machinery, and intermediate goods have represented about 70% of total imports, and account for a large part of Ghana’s strong import growth. The sharp rise in the machinery and metal products sub-sector imports is due to the growth of heavy industries and the local manufacturing sector particularly the automotive sector, as the country looks towards producing its own vehicles and ramping up industrial output.
Imports of crude petroleum products decreased sizeably in the past three years and were replaced by imports of refined
products following serious production disruptions at the country’s only oil refinery, Tema Oil Refinery.
Ghana’s imports and exports doubled between 2006 and 2016 with an oil driven peak in exports at US$13.6bn in 2012. In 2016, most of the country’s imports consisting of mainly capital goods, oil and foodstuffs came from China and the US who accounted for 21% and 8% of imports respectively.
The country has been a net importer and in a trade deficit for over ten years, and after oil and gold prices fell in 2014, the deficit worsened as exports fell to their lowest point in five years in 2015. In 2016 the trade deficit improved from US$4bn in 2015 to US$3bn as exports rose by 9% while imports dropped by 5.3%. Though Ghana has the third highest volume of imports in SSA, import demand in Ghana has slowed in 2012-16 owing to high inflation, cuts to fuel subsidies, a relatively
weak cedi and concomitantly higher utility rates and reduced consumer confidence.
According to more recent data from the BoG, export revenue between January and April 2017 overtook imports by 30.2%, resulting in a US$1.12bn balance of trade surplus for the first quarter of the year compared to a deficit of US$935.7m in the same period last year. This recent surplus is a result of cumulative drops in oil and non-oil imports as gold and oil exports strengthen.
BoG data showed gold and oil export earnings to be US$2.2bn and US$845.3m respectively at end of the first quarter, compared to US$1.3bn and US$212.3m in Q1 of 2016. The surplus, is the best the country has seen in over a decade and strengthens optimism of the country’s balance of trade recovery after decades of persistent deficits.
Figure 15
0
5
10
15
20
US$
bn
2.91.7 1.7
2.7
4.9
3.1
6.8
3.6
7.3
4.2
10.3
5.3
8.0
10.9
15.8
17.8
12.6
14.613.5 13.4
Imports Exports
2000
2001
2002
2003
2004
2005
2006
2007
2008
2009
2010
2011
2012
2013
2014
2015
2016
3.21.9
3.22.3
4.1
2.5
5.8
8.0
12.813.6
17.6
12.2
9.510.4
Figure 15. Merchandise export and import trend, 2000-16
Figure 14. Trade by partner (%), 2016
Source: UNCTAD, 2017
Figure 14
Switzerland
India
China
UAE
Netherlands
Other
China
US
Netherlands
Nigeria
Côte d’Ivoire
Other
17%
14%
9%
9%8%
43%
21%
8%
5%
5%5%
56%
Top 5 export partners 2016 Top 5 import partners 2016
Source: UNCTAD, 2017

23
Invest in Ghana | Pro-business reforms bolster the trade and investment outlook
No. Parties Status Date signed Date enforced
1 Burkina Faso In force 18-May-01 18-Aug-03
2 Serbia In force 25-Apr-00 7-Jul-00
3 Germany In force 24-Feb-95 23-Nov-98
4 Malaysia In force 8-Nov-96 18-Apr-97
5 Denmark In force 13-Jan-92 6-Jan-95
6 Switzerland In force 8-Oct-91 16-Jun-93
7 UK In force 22-Mar-89 25-Oct-91
8 Netherlands In force 31-Mar-89 1-Jul-91
9 China In force 12-Oct-89 22-Nov-90
10 Benin Signed 18-May-01 Not enforced
11 Botswana Signed 4-Jul-03 Not enforced
12 Bulgaria Signed 20-Oct-89 Not enforced
13 Côte d’Ivoire Signed 4-Nov-97 Not enforced
14 Cuba Signed 2-Nov-99 Not enforced
15 Egypt Signed 11-Mar-98 Not enforced
16 France Signed 26-Mar-99 Not enforced
17 Guinea Signed 18-May-01 Not enforced
18 India Signed 5-Aug-02 Not enforced
19 Italy Signed 25-Jun-98 Not enforced
20 Mauritania Signed 18-May-01 Not enforced
21 Mauritius Signed 18-May-01 Not enforced
22 Romania Signed 14-Sep-89 Not enforced
23 South Africa Signed 9-Jul-98 Not enforced
24 Spain Signed 6-Oct-06 Not enforced
25 Turkey Signed 1-Mar-16 Not enforced
26 Zambia Signed 18-May-01 Not enforced
27 Zimbabwe Signed 30-Jun-03 Not enforced
Investment trendsAs FDI continues to play an important part of Ghana’s economic development, authorities have placed emphasis on public-private partnerships (PPPs) and multilateral and bilateral investment agreements for the development of key infrastructure projects. In this regard, as of July 2017, Ghana has signed Bilateral Investment Treaties (BIT) with 27 countries in total, 19 of which are awaiting enforcement. Agreements are also currently being discussed with the United States, Pakistan, South Korea, North Korea, and Belgium.
Table 3. Ghana’s bilateral investment treaties, 2017
Source: UNCTAD Investment Policy Hub, 2017
As a result of its oil discoveries, supported by sustained political stability and improving macroeconomic management, FDI inflows into Ghana shot up from around US$100m in 2005 to over US$3bn per year between 2011 and 2016 and continues to grow at a steady pace.

24
Invest in Ghana | Pro-business reforms bolster the trade and investment outlook
Figure 16. FDI inflows into Ghana, 2000-16
Source: UNCTAD, 2017
Figure 16
0.0
0.5
1.0
1.5
2.0
2.5
3.0
3.5
US$
bn
0.1
2.9
2.5
3.23.3 3.4
2000
2001
2002
2003
2004
2005
2006
2007
2008
2009
2010
2011
2012
2013
2014
2015
2016
0.6
3.5
0.1 0.1 0.1 0.1 0.1
0.9
1.2
3.2 3.2
Accordingly, at an amount of US$29.8bn (70% of GDP), in 2016 Ghana had the fifth highest FDI stock in SSA, after South Africa, Nigeria, Angola and Mozambique. The country was also the 4th largest recipient of FDI in Africa in 2016 after Angola, Egypt and Nigeria, recording US$3.5bn in FDI inflows.
In the first quarter of 2017, policies and programmes such as ‘One District One Factory’, ‘Planting for Food and Jobs’, the ‘Accra Marine Drive’ and tax reforms in the 2017 Budget Statement have bolstered investor confidence, leading to an influx of potential investors visiting the country.
Data from the GIPC28 show that in just the first quarter of the year inward FDI amounted to US$2.9bn compared to US$157.57m in the previous year leaving the GIPC confident that Ghana will achieve its target to attract US$5bn in foreign investment in 2017.
The bulk of inward FDI is reportedly flowing to the oil and gas industry. This includes recent major investments such as the 20-year contract worth US$7bn signed by Vitol Group (Netherlands) and Eni (Italy) in 2015,29 in partnership with Ghana’s National Petroleum Corporation (GNPC) for oil production in the Sankofa-Gye Nyame oil field; and American Kosmos Energy’s planned US$1.5bn investment for the period 2014-17.30 As the oil sector takes off in Ghana, the GNPC expects up to US$20bn in investment by 2020.31
Two other major sectors driving FDI inflows include the mining and the services sectors. Largely dominated by foreign firms, a lot of investment in the mining sector is linked to South African, British and increasingly to Chinese firms. For example, in 2012 China-based Bosai Minerals Group acquired an 80% stake in the Awaso bauxite mine, making it the largest bauxite producer in the country.
Gold, which accounts for over 90% of total mining revenues, has attracted global mining juniors and majors alike in recent years. However, global gold price volatility has negatively affected Ghana’s gold mining sector growth since 2014, leading to a contraction of about 16.8% in the country’s total gold output in 2015 with a number of miners restructuring their operations and cutting on capital expenditure to offset lower prices.
To worsen the situation, changes in government regulations increased corporate income tax for mining companies from 20% to 35% in 2015. The measures have somewhat soured sentiment among miners.
However, with many firms having successfully cut operating costs, the country’s mining sector is now well-placed to benefit from rising gold prices, which rebounded in 2016. A case in point is South African gold mining giant Gold Fields’ reported strong cash flows and lowering of
its net debt in the last quarter of 2016. The firm consequently plans to invest a further US$1.4bn at its Damang mine in Ghana from 2017 to 2024.32
Outside the mining and oil sector, inward FDI goes mainly to the service sector and light manufacturing, in line with the government push towards expanding manufacturing capacity and output diversification of the country. Hence, FDI flows to Ghana are gradually becoming more diversified, presenting opportunities to businesses in non-mining sectors.
In the services sector, Ghana has managed to attract significant amounts of investment mainly into telecommunications and financial services while in manufacturing this has been predominantly focused on agro-processing, textiles, steel, aluminium, timber and pharmaceutical products.
Ghana has also been successfully building its reputation as a reliable investment partner and is likely going to continue attracting foreign capital at a greater extent than similarly positioned neighbours in SSA. While FDI inflows have slowed in the past five years, as Ghana continues to pass its reviews under its IMF ECF,33 investor confidence is improving. The country’s investment climate outlook is therefore positive with investment expected to strengthen as the growth outlook for the country improves.

25
Invest in Ghana | Pro-business reforms bolster the trade and investment outlook
Tax/levy type Rate/levy prior 2017 Proposed rate/levy 2017
Gains from realisation of securities listed on GSE 25% Exempt
Stamp duty on equity capital 0.5% Exempt for 2 years for financial institutions
VAT on financial services 17.5% Abolish
VAT on real estate sales 5% Abolish
VAT on domestic airline ticket 17.5% Abolish
VAT for retailers and wholesalers 17.5% 3%
Special Import Levy 1% Abolish
Special petroleum tax 17.5% 15%
VAT on selected imported medicines, that are not produced locally (list yet to be determined)
17.5% Abolish
Import duty on raw materials and production machinery 5% Abolish
Import duty on spare parts No exemption Abolish
Trade and investment incentivesTax reformsIn efforts to boost foreign investment, in 2017 the government of Ghana proposed various tax reforms to the benefit of the private sector.34 These notably included, the removal of a 17.5% VAT on financial services, lifting of import duties on building materials, and lifting of similar levies on machinery imports to bolster industry. The 2017 budget also included the removal of a 5% VAT on property transactions to reduce real estate transaction costs.
Table 4. Summary of Ghana’s proposed 2017 tax reforms
Source: Deloitte, 2017
Beyond the 2017 budget provisions, a number of investment incentives are provided under the Ghana Investment Promotion Centre (GIPC) Act35 and the Free Zones Act.36
Incentives under the GIPC ActThe GIPC governs investment in all sectors of the economy except oil and gas, minerals and mining, and within the Free Trade Zones.
The Act outlines incentives and assurances in relation to transfer of capital, taxation, profits and dividends, and guarantees against expropriation. It also specifies sectors that are reserved for Ghanaians but these encompass relatively small industries with limited risks of restriction to mainstream investment. Tax incentives vary depending upon the sector and location in which the investor is operating.
Sector No. of years
Real estate (certified low-cost housing) 5
Rural banks 10
Cattle ranching 10
Tree cropping (e.g. coffee, oil palm, shea-butter and coconut) 10
Livestock excluding cattle and poultry 5
Fish farming, poultry and cash crops 5
Agro-processing – converting fish, livestock into edible canned products 5
Waste processing (including plastics and polythene) 7
Free zones enterprise/development 10
Table 5. Investment incentives and tax holidays under the Income Tax Act
Source: GIPC, 2017, 1% tax is applicable during holiday period except Free zones enterprises.
26
Invest in Ghana | Pro-business reforms bolster the trade and investment outlook
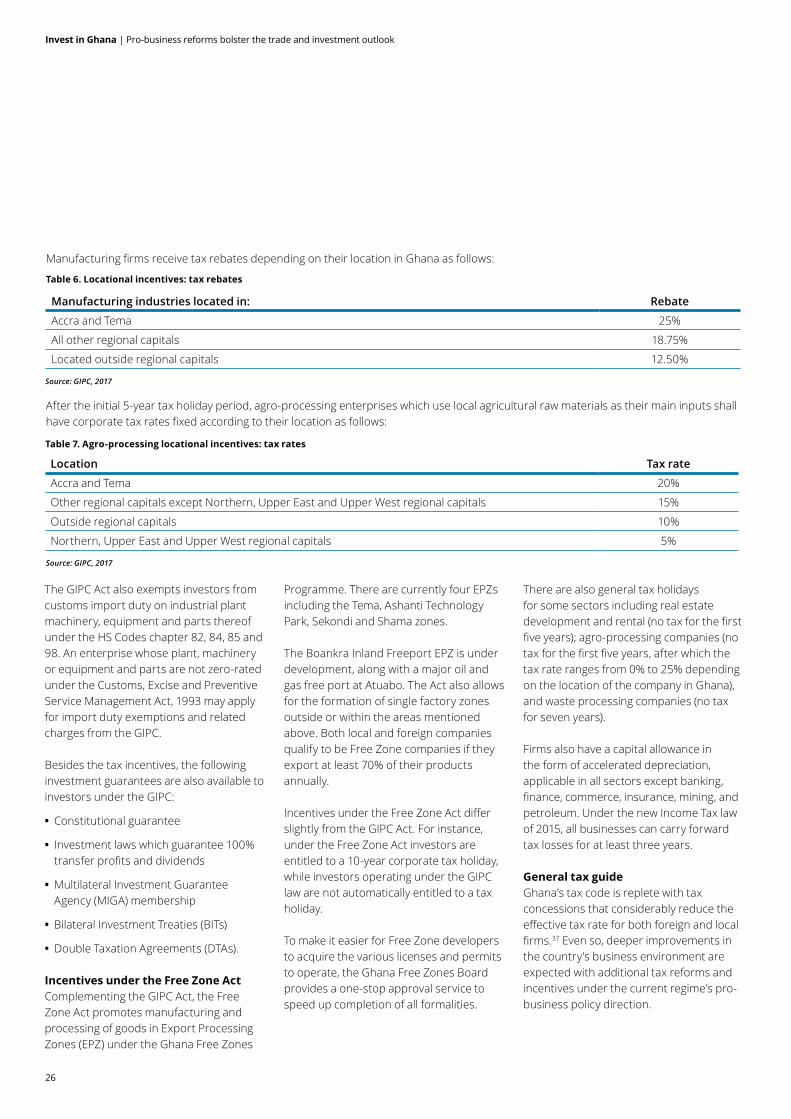
Manufacturing firms receive tax rebates depending on their location in Ghana as follows:
Manufacturing industries located in: Rebate
Accra and Tema 25%
All other regional capitals 18.75%
Located outside regional capitals 12.50%
Table 6. Locational incentives: tax rebates
Source: GIPC, 2017
Table 7. Agro-processing locational incentives: tax rates
Source: GIPC, 2017
After the initial 5-year tax holiday period, agro-processing enterprises which use local agricultural raw materials as their main inputs shall have corporate tax rates fixed according to their location as follows:
Location Tax rate
Accra and Tema 20%
Other regional capitals except Northern, Upper East and Upper West regional capitals 15%
Outside regional capitals 10%
Northern, Upper East and Upper West regional capitals 5%
The GIPC Act also exempts investors from customs import duty on industrial plant machinery, equipment and parts thereof under the HS Codes chapter 82, 84, 85 and 98. An enterprise whose plant, machinery or equipment and parts are not zero-rated under the Customs, Excise and Preventive Service Management Act, 1993 may apply for import duty exemptions and related charges from the GIPC.
Besides the tax incentives, the following investment guarantees are also available to investors under the GIPC:
• Constitutional guarantee
• Investment laws which guarantee 100% transfer profits and dividends
• Multilateral Investment Guarantee Agency (MIGA) membership
• Bilateral Investment Treaties (BITs)
• Double Taxation Agreements (DTAs).
Incentives under the Free Zone ActComplementing the GIPC Act, the Free Zone Act promotes manufacturing and processing of goods in Export Processing Zones (EPZ) under the Ghana Free Zones
Programme. There are currently four EPZs including the Tema, Ashanti Technology Park, Sekondi and Shama zones.
The Boankra Inland Freeport EPZ is under development, along with a major oil and gas free port at Atuabo. The Act also allows for the formation of single factory zones outside or within the areas mentioned above. Both local and foreign companies qualify to be Free Zone companies if they export at least 70% of their products annually.
Incentives under the Free Zone Act differ slightly from the GIPC Act. For instance, under the Free Zone Act investors are entitled to a 10-year corporate tax holiday, while investors operating under the GIPC law are not automatically entitled to a tax holiday.
To make it easier for Free Zone developers to acquire the various licenses and permits to operate, the Ghana Free Zones Board provides a one-stop approval service to speed up completion of all formalities.
There are also general tax holidays for some sectors including real estate development and rental (no tax for the first five years); agro-processing companies (no tax for the first five years, after which the tax rate ranges from 0% to 25% depending on the location of the company in Ghana), and waste processing companies (no tax for seven years).
Firms also have a capital allowance in the form of accelerated depreciation, applicable in all sectors except banking, finance, commerce, insurance, mining, and petroleum. Under the new Income Tax law of 2015, all businesses can carry forward tax losses for at least three years.
General tax guideGhana’s tax code is replete with tax concessions that considerably reduce the effective tax rate for both foreign and local firms.37 Even so, deeper improvements in the country’s business environment are expected with additional tax reforms and incentives under the current regime’s pro-business policy direction.
27
Invest in Ghana | Pro-business reforms bolster the trade and investment outlook
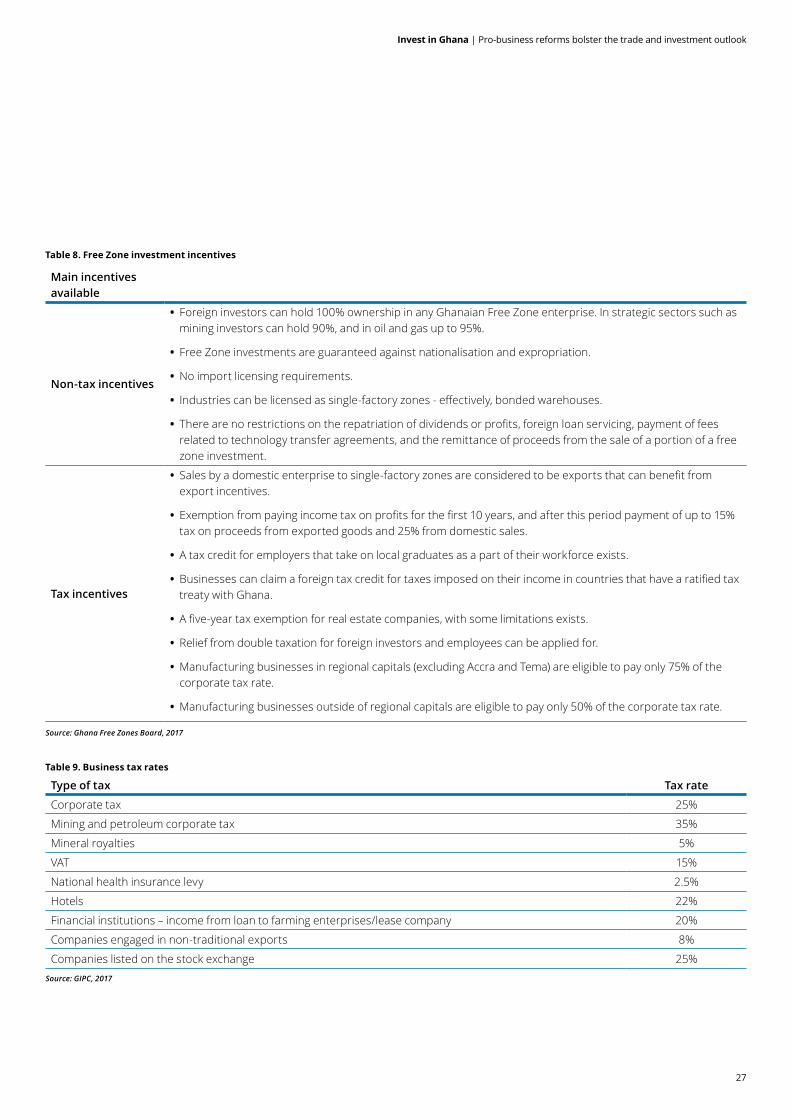
Type of tax Tax rate
Corporate tax 25%
Mining and petroleum corporate tax 35%
Mineral royalties 5%
VAT 15%
National health insurance levy 2.5%
Hotels 22%
Financial institutions – income from loan to farming enterprises/lease company 20%
Companies engaged in non-traditional exports 8%
Companies listed on the stock exchange 25%
Main incentives available
Non-tax incentives
• Foreign investors can hold 100% ownership in any Ghanaian Free Zone enterprise. In strategic sectors such as mining investors can hold 90%, and in oil and gas up to 95%.
• Free Zone investments are guaranteed against nationalisation and expropriation.
• No import licensing requirements.
• Industries can be licensed as single-factory zones - effectively, bonded warehouses.
• There are no restrictions on the repatriation of dividends or profits, foreign loan servicing, payment of fees related to technology transfer agreements, and the remittance of proceeds from the sale of a portion of a free zone investment.
Tax incentives
• Sales by a domestic enterprise to single-factory zones are considered to be exports that can benefit from export incentives.
• Exemption from paying income tax on profits for the first 10 years, and after this period payment of up to 15% tax on proceeds from exported goods and 25% from domestic sales.
• A tax credit for employers that take on local graduates as a part of their workforce exists.
• Businesses can claim a foreign tax credit for taxes imposed on their income in countries that have a ratified tax treaty with Ghana.
• A five-year tax exemption for real estate companies, with some limitations exists.
• Relief from double taxation for foreign investors and employees can be applied for.
• Manufacturing businesses in regional capitals (excluding Accra and Tema) are eligible to pay only 75% of the corporate tax rate.
• Manufacturing businesses outside of regional capitals are eligible to pay only 50% of the corporate tax rate.
Table 8. Free Zone investment incentives
Table 9. Business tax rates
Source: GIPC, 2017
Source: Ghana Free Zones Board, 2017

28
Invest in Ghana | Pro-business reforms bolster the trade and investment outlook
Taxable income of residents annual (GHS) (Cumulative Chargeable Income) Tax rate
0 to 2.592 0%
2.593 to 3.888 5%
3.889 to 5.700 10%
5.701 to 38.880 17.5%
38.881 and above 25%
Table 10. Income tax for individuals
Source: Deloitte, 2017
The withholding tax on various types of payments are as follows (the tax is a final tax for non-residents and the rate may be reduced under an applicable tax treaty):
Residents Non-residents
Dividends 8% 8%
Interest 0%-8% 8%
Royalties 15% 15%
Management/professional fees
7.5% 20%
Rental payments 8%-15% 15%
Table 11. Withholding tax
Source: Deloitte, 2017
Ghana has also concluded tax treaties with the following countries:
Treaty Dividends Interest Royalties
Management or technical service fees
Belgium 5%-15% 10% 10% 10%
Denmark 5%-15% 8% 8% 8%
France 7.5%-15% 10% 10% 10%
Germany 5%-15% 10% 8% 8%
Italy 5%-15% 10% 10% 10%
Netherlands 5%-10% 8% 8% 8%
South Africa 5%-15% 10% 10% 10%
Switzerland 5%-8% 10% 8% *8%
United Kingdom
7.5%-15% 12.5% 12.5% 10%
Table 12. Tax treaties
Source: Deloitte, 2017, *Rate applicable to individuals only

29
Invest in Ghana | A peaceful democratic transition renews investor confidence

30
Invest in Ghana | Investment opportunities
Project Industry Sector Value Status Estimated close date
Accra-Tema motorway Road US$200m to US$300m
Late stage, construction has just started
The project is part of the Tema Port expansion project which is due to be fully completed by the end of 2019
Accra-Kumasi road Road US$400m Late stage, construction ongoing
Due to be completed by early 2018
Accra-Takoradi road Road US$600m Early stage Unknown
Tema Port expansion project
Port US$1.5bn The project commenced at the beginning of October 2016
Completion anticipated by 2019
Takoradi Port expansion project
Port US$197m Late stage, construction ongoing
The project is due to be completed by end of 2019
Boankra Inland Port and Eastern railway line
Port, Rail US$900m to US$1.5bn
Early stage, construction ongoing
Unknown
Investment opportunities
Ghana’s clearly regulated and open market offers opportunities for investors in a variety of sectors.
Though there are currently no formal privatisation programmes in the country, under the 2011 Ghana PPP Programme, the current government is aiming to create PPPs to restructure and privatise non-performing state-owned enterprises, particularly the debt ridden Electricity Company of Ghana (ECG). Going forward, various investment opportunities are expected to unfold under the government’s ‘One District, One Factory’ programme.
General investment opportunitiesIn 2014, Ghana’s Ministry of Finance and Economic Planning38 published a pipeline of PPP project opportunities in which foreign and local investors can participate with the following projects earmarked as a priority:
Table 13: MOFEP Public Investment Division: priority projects
Source: Adopted from Norton Rose Fullbright,39 2016, MOFEP, 2014

31
Invest in Ghana | Investment opportunities
Table 14. GIPC priority sectors for investment
The GIPC highlights eight sectors as priority sectors in line with the country’s current needs. These include the following opportunities for investors:
Sector Opportunity
1. Oil & Gas
• Hydrocarbon Exploration & Development
• Crude Oil Refinery
• Bulk Petroleum Products Pipeline & Storage
• LNG Deployment Opportunities
• Construction of a dedicated pipeline from Takoradi to Tema
• Ancillary Services (e.g. on-shore logistics support, air transport, diving vessels)
2. Energy
• Energy services companies to provide services such as tariff analysis, energy audits, compressed air systems, kilns and furnaces, fuel substitution etc.
• Energy manufacturing companies to supply energy-monitoring equipment to better meet the increased requests for power monitoring and tariff analysis from industry in the country
• Companies to provide an alternative decentralised sustainable energy system that can easily be deployed in remote and deprived communities into the overall national energy mix
• Companies to provide solar vaccine refrigerators for the preservation of vaccines for child immunisation programmes in remote and off-grid parts of the country
• Provision of solar energy systems to schools in off-grid communities
• New, higher quality and cost competitive energy services to the poor, for cooking, transport, water heating and other home appliances
• Investment opportunities in the demand sector to meet governments’ 100% electricity access target by 2020. To fill in the gap, government is encouraging Independent Power Producers (IPPs)
3. Manufacturing
• Electronic Design & Development
• Manufacturing of spare parts for the oil & gas industry
• Food & cocoa processing establishments aimed at transforming 70% of raw cocoa locally
• Pharmaceuticals
• Development and use of alternative inputs for the furniture industry
4. Property Development (Real Estate)
• Residential (low-cost housing, high-rise luxury apartments, retirement villages)
• Industrial (light industrial parks, warehousing facilities)
• Commercial (regional shopping centres/malls, office accommodation, storage)
• Production and marketing of construction equipment and building materials
5. Agriculture and Agribusiness
• Crop Production
• Poultry Production
• Aquaculture
• Agro-processing – Livestock feeds & fishmeal – Packaging – Cocoa beans and waste processing into liquor, beverages, fertiliser etc. – Vegetable oil plants
• Agri-business – Irrigation and storage facilities – Mechanised equipment for leasing – Marketing of agricultural produce

32
Invest in Ghana | Investment opportunities
Source: GIPC, 2017
Sector Opportunity
6. Tourism
• Hospitality, Food and Beverage, Transport, Travel, Financial Services, Medical Services
• Entertainment, Leisure and Sports
• Shopping, Meeting Facilities
• Information Shops, Cultural Centres
• Training institutions for the Tourism sector
7. Services: ICT
• Development of 2 Science and Technology Parks (STPs) in Ghana; areas of focus are ICT, Biotechnology and Precision & Engineering
• Education: software development, networking, VSAT, telecom and IT Engineering
• Business Processing Outsourcing
• Back Office
• Telephony – rural and fixed lines
8. Infrastructure
• General railway projects – Rehabilitating the mainline locomotives, the mainline inter-city coaches, mineral wagons – Acquisition of mineral wagons
• Boankra Inland Port – Development of primary infrastructure namely roads, drains, water supply, sewage, electricity and telecommunications
– inland clearance depot – custom bonded and unbonded estates – vehicle and car parking lots – commercial estates, light industrial estates – social/civic estates and other port facilities – the completion of the administrative complex
• The Eastern Railway Line Project – the construction of a new line with required specifications
• Korle-Bu Teaching Hospital – Diagnostic Services – the design, construction/refurbishment, financing and operation of the facility for a period of around 15 years (2 years’ construction plus 13 years’ operation), after which the facility would be handed back to KBTH
– the delivery of all laboratory and imaging services across the hospital (with the exception of the Cardiothoracic Unit, which operates independently to the hospital), including maintaining and operating the new facility
– maintain and operate the existing “satellite” laboratory and imaging services currently within some of the hospital departments

33
Invest in Ghana | Investment opportunities

34
Invest in Ghana | Endnotes
Endnotes
1 Ghana Statistical Service
2 Garcia-Verdu, R., Selasse, A. A., & Thomas, A. (2011). How inclusive has Africa’s recent high-growth episode been. Regional economic outlook: Sub-Saharan Africa. International Monetary Fund. Retrieved 21 July 2017, from https://editorialexpress.com/cgi-bin/conference/download.cgi?db_name=CSAE2012&paper_id=681
3 GSS. (2014). Ghana Living Standards Survey. Ghana. Statistical Service. Retrieved 21 July 2017, from http://www.statsghana.gov.gh/docfiles/glss6/GLSS6_Labour%20Force%20Report.pdf
4 Grail Research. (2015). Fuelling Ghana’s Growth: Oil and gas industry. Integreon. Retrieved 21 July 2017, from http://www.integreon.com/BlogDetails?BGID=509
5 IMF. (2017). World Economic Outlook Database. International Monetary Fund. Retrieved 21 July 2017, from http://www.imf.org 6 Ghana Statistical Service
7 GSS. (2017). Provisional Annual GDP (2016) April 2017 Edition. Ghana Statistical Service. Retrieved 21 July 2017, from http://www.statsghana.gov.gh/ 8 Business Monitor International. (2017). Data Tool. BMI Research. Retrieved 21 July 2017, from http://www.bmiresearch.com
9 Electrical Company of Ghana
10 EIU. (2017). Ghana Country Report. The Economist Intelligence Unit N.A. Incorporated. Retrieved 21 July 2017, from http://country.eiu.com/Ghana
11 U.S. Department of Commerce. (2017). Ghana Country Commercial Guide. Retrieved 21 July 2017, from https://www.export.gov/article?series=a0pt0000000PAtrAAG&type=Country_Commercial__kav
12 Tweneboa-Enyenra-Ntomme
13 EIU. (2017). Ghana Country Report. The Economist Intelligence Unit N.A. Incorporated. Retrieved 21 July 2017, from http://country.eiu.com/Ghana
14 Business Monitor International. (2017). Ghana Country Risk Report. BMI Research. Retrieved 21 July 2017, from http://www.bmiresearch.com
15 World Bank Group. (2017). World Bank Ease of Doing Business report 2016-17. Retrieved 21 July 2017, from http://databank.worldbank.org/ddp/home.do?
16 World Economic Forum. (2017). The global competitiveness report 2016-2017. World Economic Forum. Retrieved 21 July 2017, from http://www3.weforum.org/docs/GCR2016-2017/05FullReport/TheGlobalCompetitivenessReport2016-2017_FINAL.pdf 17 The Global Competitiveness Index score ranges from 1-7 where 7 is the best score
18 DFID UK. (2017). Ghana Business Enabling Environment Programme: Annual Review 2016. Department for International Development. Retrieved from https://devtracker.dfid.gov.uk/projects/GB-1-202455/documents
19 Economic Community of West African States
20 World Economic Forum. (2017). The global competitiveness report 2016-2017. World Economic Forum. Retrieved 21 July 2017, from http://www3.weforum.org/docs/GCR2016-2017/05FullReport/TheGlobalCompetitivenessReport2016-2017_FINAL.pdf
21 Oxford Business Group. (2017). The Report: Ghana 2017. Retrieved July 21, 2017, from http://www.oxfordbusinessgroup.com/ghana-2017
22 National Development Planning Commission. (2014). Ghana shared growth and development agenda (GSGDA) II 2014-2017. Retrieved 21 July 2017, from https://s3.amazonaws.com/ndpc-static/pubication/GSGDA+II+2014-2017.pdf
23 Rabobank Wereldwijd. (2017). Ghana Economic and Political Analysis. Retrieved 21 July 2017, from https://rabowereldwijd.nl/ghana-economic-and-political-outline/c/2211
24 Nordea Trade. (2017). Ghana: Trade Profile. Retrieved 21 July 2017, from https://www.nordeatrade.com/en/explore-new-market/ghana/trade-profile 25 WTO. (2014). Trade Policy Review Report by the Secretariat Ghana. World Trade Organization. Retrieved from https://www.wto.org/english/tratop_e/tpr_e/tp398_e.htm
26 UNCTAD. (2017). UNCTADStat. United Nations Conference on trade and Development. Retrieved 21 July 2017, from http://unctadstat.unctad.org/EN/Index.html 27 Business Monitor International. (2017). Ghana Country Risk Report. BMI Research. Retrieved 21 July 2017, from http://www.bmiresearch.com 28 Ghana Investment Promotion Centre
29 Ambrose, J., & Marlow, B. (2016). Eni and Vitol invest in West African oil field. Retrieved 21 July 2017, from http://www.telegraph.co.uk/business/2016/10/22/eni-and-vitol-invest-in-west-african-oil-field/
30 Grail Research. (2015). Fuelling Ghana’s Growth: Oil and gas industry. Integreon. Retrieved from http://www.integreon.com/BlogDetails?BGID=509
31 Reuters UK. (2014). Ghana says expects at least $20bn in oil investment over five yrs. Retrieved 21 July 2017, from http://uk.reuters.com/article/ghana-oil-idUKL5N0KV25W20140121
32 Ryan, B. (2016). Gold Fields to Invest $1.4 Billion in Ghana’s Damang Mine. Miningmx. Retrieved July 21, 2017, from http://www.miningmx.com/news/gold/28276-gold-fields-invest-1-4-billion-ghanas-damang-mine/
33 African Development Bank. (2017). Africa Economic Outlook 2017. Retrieved 21 July 2017, from https://www.afdb.org/
34 Deloitte. (2017). Sowing the seeds for growth & jobs: Ghana 2017 budget commentary and tax highlights. Deloitte Touche Tohmatsu Services, Inc. Retrieved 21 July 2017, from https://www2.deloitte.com/content/dam/Deloitte/gh/Documents/tax/gh-ghana-2017-budget-commentary-and-tax-highlights.pdf
35 GIPC Ghana. (2017). Ghana Investment Promotion Centre. Retrieved 21 July 2017, from http://www.gipcghana.com/about.html
36 GFZB. (2017). Ghana Free Zones Board Retrieved 21 July 2017, from http://www.gfzb.gov.gh/index.php 37 Deloitte. (2017). Guide to fiscal information: Key economies in Africa 2017. Deloitte Touche Tohmatsu Services, Inc. Retrieved 21 July 2017, from https://www2.deloitte.com/za/en/pages/tax/articles/guide-to-fiscal-information-key-economies-in-africa-2017.html
38 MOFEP. (2014). Pipeline projects: Ghana Public Private Partnership (PPP) Programme. Ghana Ministry of Finance and Economic Planning. Retrieved 21 July 2017, from http://www.mofep.gov.gh/sites/default/files/docs/pid/Pipeline-Projects-Ghana-PPP-11-08-14.pdf
39 Norton Rose Fulbright. (2016). A new wave of projects in Ghana. Retrieved 21 July 2017, from http://www.insideafricalaw.com/publications/a-new-wave-of-projects-in-ghana

35
Invest in Ghana | Endnotes

36
Invest in Ghana | Contacts
Contacts
Dr Martyn Davies Managing Director Emerging Markets & AfricaDeloitte [email protected]
Charles Larbi-OdamCountry Managing ExecutiveDeloitte Africa - [email protected]
Martin Atta-FynnConsulting LeaderDeloitte Africa - [email protected]
Hannah EdingerAssociate DirectorDeloitte Africa [email protected]
Jean-Baptiste NkumeConsultantDeloitte Africa
Author

Deloitte refers to one or more of Deloitte Touche Tohmatsu Limited, a UK private company limited by guarantee (“DTTL”), its network of member firms, and their related entities. DTTL and each of its member firms are legally separate and independent entities. DTTL (also referred to as “Deloitte Global”) does not provide services to clients. Please see www.deloitte.com/about to learn more about our global network of member firms.
Deloitte provides audit, consulting, financial advisory, risk advisory, tax and related services to public and private clients spanning multiple industries. Deloitte serves four out of five Fortune Global 500® companies through a globally connected network of member firms in more than 150 countries and territories bringing world-class capabilities, insights, and high-quality service to address clients’ most complex business challenges. To learn more about how Deloitte’s approximately 245 000 professionals make an impact that matters, please connect with us on Facebook, LinkedIn, or Twitter.
This communication contains general information only, and none of Deloitte Touche Tohmatsu Limited, its member firms, or their related entities (collectively, the “Deloitte network”) is, by means of this communication, rendering professional advice or services. Before making any decision or taking any action that may affect your finances or your business, you should consult a qualified professional adviser. No entity in the Deloitte network shall be responsible for any loss whatsoever sustained by any person who relies on this communication.
© 2017. For information, contact Deloitte Touche Tohmatsu Limited (813951/mar)