inverse modelling of hydraulic testing to revise the...
TRANSCRIPT

Originally published as:
Kempka, T., Norden, B. (2017): Inverse modelling of hydraulic testing to revise the static reservoir
model of the Stuttgart Formation at the Ketzin pilot site. ‐ Energy Procedia, 125, pp. 640—649.
DOI: http://doi.org/10.1016/j.egypro.2017.08.264
ScienceDirect
Available online at www.sciencedirect.comAvailable online at www.sciencedirect.com
ScienceDirectEnergy Procedia 00 (2017) 000–000
www.elsevier.com/locate/procedia
1876-6102 © 2017 The Authors. Published by Elsevier Ltd.Peer-review under responsibility of the Scientific Committee of The 15th International Symposium on District Heating and Cooling.
The 15th International Symposium on District Heating and Cooling
Assessing the feasibility of using the heat demand-outdoor temperature function for a long-term district heat demand forecast
I. Andrića,b,c*, A. Pinaa, P. Ferrãoa, J. Fournierb., B. Lacarrièrec, O. Le Correc
aIN+ Center for Innovation, Technology and Policy Research - Instituto Superior Técnico, Av. Rovisco Pais 1, 1049-001 Lisbon, PortugalbVeolia Recherche & Innovation, 291 Avenue Dreyfous Daniel, 78520 Limay, France
cDépartement Systèmes Énergétiques et Environnement - IMT Atlantique, 4 rue Alfred Kastler, 44300 Nantes, France
Abstract
District heating networks are commonly addressed in the literature as one of the most effective solutions for decreasing the greenhouse gas emissions from the building sector. These systems require high investments which are returned through the heatsales. Due to the changed climate conditions and building renovation policies, heat demand in the future could decrease, prolonging the investment return period. The main scope of this paper is to assess the feasibility of using the heat demand – outdoor temperature function for heat demand forecast. The district of Alvalade, located in Lisbon (Portugal), was used as a case study. The district is consisted of 665 buildings that vary in both construction period and typology. Three weather scenarios (low, medium, high) and three district renovation scenarios were developed (shallow, intermediate, deep). To estimate the error, obtained heat demand values were compared with results from a dynamic heat demand model, previously developed and validated by the authors.The results showed that when only weather change is considered, the margin of error could be acceptable for some applications(the error in annual demand was lower than 20% for all weather scenarios considered). However, after introducing renovation scenarios, the error value increased up to 59.5% (depending on the weather and renovation scenarios combination considered). The value of slope coefficient increased on average within the range of 3.8% up to 8% per decade, that corresponds to the decrease in the number of heating hours of 22-139h during the heating season (depending on the combination of weather and renovation scenarios considered). On the other hand, function intercept increased for 7.8-12.7% per decade (depending on the coupled scenarios). The values suggested could be used to modify the function parameters for the scenarios considered, and improve the accuracy of heat demand estimations.
© 2017 The Authors. Published by Elsevier Ltd.Peer-review under responsibility of the Scientific Committee of The 15th International Symposium on District Heating and Cooling.
Keywords: Heat demand; Forecast; Climate change
Energy Procedia 125 (2017) 640–649
1876-6102 © 2017 The Authors. Published by Elsevier Ltd.Peer-review under responsibility of the scientific committee of the European Geosciences Union (EGU) General Assembly 2017 – Division Energy, Resources and the Environment (ERE).10.1016/j.egypro.2017.08.264
1876-6102 © 2017 The Authors. Published by Elsevier Ltd.Peer-review under responsibility of the scientific committee of the European Geosciences Union (EGU) General Assembly 2017 – Division Energy, Resources and the Environment (ERE).10.1016/j.egypro.2017.08.264
10.1016/j.egypro.2017.08.264 1876-6102
© 2017 The Authors. Published by Elsevier Ltd.Peer-review under responsibility of the scientific committee of the European Geosciences Union (EGU) General Assembly 2017 – Division Energy, Resources and the Environment (ERE).
Available online at www.sciencedirect.com
Energy Procedia 00 (2017) 000–000www.elsevier.com/locate/procedia
European Geosciences Union General Assembly 2017, EGUDivision Energy, Resources & Environment, ERE
Inverse modelling of hydraulic testing to revise the static reservoirmodel of the Stuttgart Formation at the Ketzin pilot site
Thomas Kempkaa,∗, Ben Nordenb
aGFZ German Research Centre for Geosciences, Fluid Systems Modelling, Telegrafenberg, 14473 Potsdam, GermanybGFZ German Research Centre for Geosciences, Geothermal Energy Systems, Telegrafenberg, 14473 Potsdam, Germany
Abstract
Pilot-scale CO2 storage has been performed at the Ketzin pilot site in Germany from 2007 to 2013 with about 67 kt of CO2 injectedinto the Upper Triassic Stuttgart Formation, focussing on efficient monitoring and long-term prediction strategies. We employedinverse modelling to revise the latest static geological reservoir model, considering bottomhole well pressures observed duringhydraulic testing. Simulation results exhibit very good agreement with the observations, providing one reasonable permeabilityrealization for the Ketzin pilot site near-well area. Furthermore, an existing hypothesis on the presence of a low-thickness sandstonechannel between two wells is supported by our findings.
c© 2017 The Authors. Published by Elsevier Ltd.Peer-review under responsibility of the scientific committee of the European Geosciences Union (EGU) General Assembly 2017 –Division Energy, Resources and the Environment (ERE).
Keywords: Geological model revision; Inverse modelling; Hydraulic testing; Bottomhole pressure; Ketzin pilot site; CO2 storage
1. Introduction
CO2 storage has been performed at the Ketzin pilot site in Germany from 2007 to 2013 with about 67 kt ofCO2 injected into the Upper Triassic Stuttgart Formation at 620-650 m depth to investigate efficient strategies tomonitor and predict long-term CO2 behaviour in the storage reservoir [1–6]. Static geological modelling and numericalsimulations accompany these efforts since their very beginning [7–15], with a static geological reservoir model thathas been developed, revised and matched against field observations to allow for predictions over short- to long-termperiods [12, 16–19]. In this context, the static geological model has been continuously further developed and updatedwith the availability of new field data. Furthermore, many efforts have been undertaken to integrate field observationsand laboratory experiments with numerical simulations [10, 12, 17, 18, 20–29], especially considering the four 3Dseismic campaigns carried out at the Ketzin pilot site [30–35].
∗ Corresponding author. Tel.:+49-331-288-1865 ; fax: +49-331-288-1529.E-mail address: [email protected]
1876-6102 c© 2017 The Authors. Published by Elsevier Ltd.Peer-review under responsibility of the scientific committee of the European Geosciences Union (EGU) General Assembly 2017 – Division Energy,Resources and the Environment (ERE).
2 Kempka and Norden / Energy Procedia 00 (2017) 000–000
The present study aims at validation of the latest revised reservoir model [11, 13] against bottomhole pressure datarecorded during hydraulic testing of the Stuttgart Formation, undertaken after drilling the wells Ktzi 200, Ktzi 201 andKtzi 202. Further, we employ high-performance inverse modelling to revise the static reservoir model by calibratingthe spatial permeability distribution by means of the field observations made during the hydraulic tests. Our simulationresults are then discussed in the context of previous findings [36–39].
2. Numerical forward model implementation
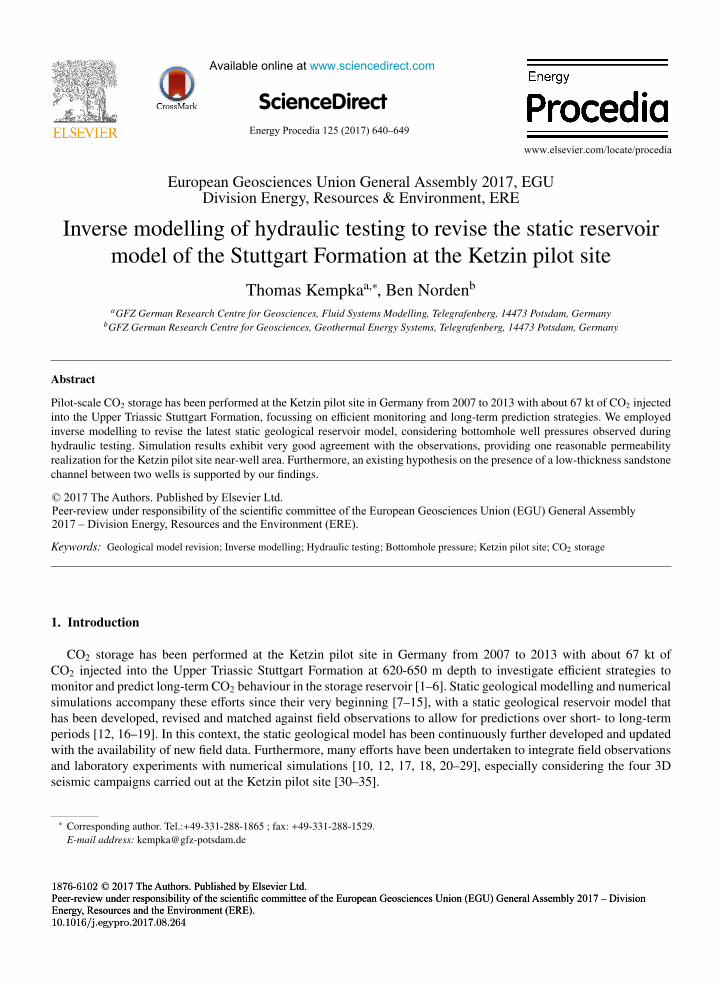
Implementation of the numerical model is based on the latest revised static geological model [11, 13], with para-meters upscaled to a new simulation grid using the Petrel software package [40]. Local grid refinements (LGRs) areintroduced to increase the resolution in the near-well area (6-8 m element edge lengths in horizontal direction), whilethe remaining grid is relatively coarse (about 90 m element edge lengths in horizontal direction, Fig. 1). Introducingnested LGRs allowed us to reduce the number of grid elements to 102,336, resulting in acceptable computationalefforts in view of inverse modelling and meeting the required accuracy of the simulation results.
Near-well area
5 km
5 km
a)
Ktzi 201 Ktzi 200
Ktzi 202
Near-well area
b)N N
Fig. 1. Revised reservoir model grid with 102,366 elements and LGRs (a). Close-up view of near-well area, showing well locations and nestedLGR structure (b). Distance between Ktzi 201 and Ktzi 200 is 50 m.
The BLACKOIL module of the scientific numerical simulator MUFITS [41, 42] is used in the present study, whe-reby previously undertaken benchmark simulations demonstrate that simulation results, absolutely identical to thoseproduced with a standard industry simulator, can be achieved even over a long-period simulation of CO2 injection atthe Ketzin pilot site [42]. The interested reader is kindly referred to Kempka et al. [9, 11], Kempka and Kuhn [10] andClass et al. [43] for detailed information on the numerical multiphase flow model parametrization and its impacts onthe simulation results.
3. Static reservoir model validation against hydraulic testing data
We employed the bottomhole pressures and fluid flow rates recorded during hydraulic testing at the Ketzin pilotsite [36, 38] to investigate the response of the static reservoir model revision presented by Kempka et al. [11]. Flowrates as well as observed and simulated bottomhole pressures are shown in Fig. 2.
Simulated pressure drawdown in any of the wells is about one order in magnitude below the observed bottomholedata, indicating that reservoir permeabilities assigned in the static reservoir model are not representing those in theStuttgart Formation. This is confirmed by a hydraulic testing interpretation [36], previous simulations using the hy-draulic testing data [37, 38], and the permeability multipliers required to match the bottomhole pressure history usingthe revised model [10, 11, 43]. The authors of the latter studies found that permeability reductions by factors of 0.05
Thomas Kempka et al. / Energy Procedia 125 (2017) 640–649 641
Available online at www.sciencedirect.com
Energy Procedia 00 (2017) 000–000www.elsevier.com/locate/procedia
European Geosciences Union General Assembly 2017, EGUDivision Energy, Resources & Environment, ERE
Inverse modelling of hydraulic testing to revise the static reservoirmodel of the Stuttgart Formation at the Ketzin pilot site
Thomas Kempkaa,∗, Ben Nordenb
aGFZ German Research Centre for Geosciences, Fluid Systems Modelling, Telegrafenberg, 14473 Potsdam, GermanybGFZ German Research Centre for Geosciences, Geothermal Energy Systems, Telegrafenberg, 14473 Potsdam, Germany
Abstract
Pilot-scale CO2 storage has been performed at the Ketzin pilot site in Germany from 2007 to 2013 with about 67 kt of CO2 injectedinto the Upper Triassic Stuttgart Formation, focussing on efficient monitoring and long-term prediction strategies. We employedinverse modelling to revise the latest static geological reservoir model, considering bottomhole well pressures observed duringhydraulic testing. Simulation results exhibit very good agreement with the observations, providing one reasonable permeabilityrealization for the Ketzin pilot site near-well area. Furthermore, an existing hypothesis on the presence of a low-thickness sandstonechannel between two wells is supported by our findings.
c© 2017 The Authors. Published by Elsevier Ltd.Peer-review under responsibility of the scientific committee of the European Geosciences Union (EGU) General Assembly 2017 –Division Energy, Resources and the Environment (ERE).
Keywords: Geological model revision; Inverse modelling; Hydraulic testing; Bottomhole pressure; Ketzin pilot site; CO2 storage
1. Introduction
CO2 storage has been performed at the Ketzin pilot site in Germany from 2007 to 2013 with about 67 kt ofCO2 injected into the Upper Triassic Stuttgart Formation at 620-650 m depth to investigate efficient strategies tomonitor and predict long-term CO2 behaviour in the storage reservoir [1–6]. Static geological modelling and numericalsimulations accompany these efforts since their very beginning [7–15], with a static geological reservoir model thathas been developed, revised and matched against field observations to allow for predictions over short- to long-termperiods [12, 16–19]. In this context, the static geological model has been continuously further developed and updatedwith the availability of new field data. Furthermore, many efforts have been undertaken to integrate field observationsand laboratory experiments with numerical simulations [10, 12, 17, 18, 20–29], especially considering the four 3Dseismic campaigns carried out at the Ketzin pilot site [30–35].
∗ Corresponding author. Tel.:+49-331-288-1865 ; fax: +49-331-288-1529.E-mail address: [email protected]
1876-6102 c© 2017 The Authors. Published by Elsevier Ltd.Peer-review under responsibility of the scientific committee of the European Geosciences Union (EGU) General Assembly 2017 – Division Energy,Resources and the Environment (ERE).
2 Kempka and Norden / Energy Procedia 00 (2017) 000–000
The present study aims at validation of the latest revised reservoir model [11, 13] against bottomhole pressure datarecorded during hydraulic testing of the Stuttgart Formation, undertaken after drilling the wells Ktzi 200, Ktzi 201 andKtzi 202. Further, we employ high-performance inverse modelling to revise the static reservoir model by calibratingthe spatial permeability distribution by means of the field observations made during the hydraulic tests. Our simulationresults are then discussed in the context of previous findings [36–39].
2. Numerical forward model implementation
Implementation of the numerical model is based on the latest revised static geological model [11, 13], with para-meters upscaled to a new simulation grid using the Petrel software package [40]. Local grid refinements (LGRs) areintroduced to increase the resolution in the near-well area (6-8 m element edge lengths in horizontal direction), whilethe remaining grid is relatively coarse (about 90 m element edge lengths in horizontal direction, Fig. 1). Introducingnested LGRs allowed us to reduce the number of grid elements to 102,336, resulting in acceptable computationalefforts in view of inverse modelling and meeting the required accuracy of the simulation results.
Near-well area
5 km
5 km
a)
Ktzi 201 Ktzi 200
Ktzi 202
Near-well area
b)N N
Fig. 1. Revised reservoir model grid with 102,366 elements and LGRs (a). Close-up view of near-well area, showing well locations and nestedLGR structure (b). Distance between Ktzi 201 and Ktzi 200 is 50 m.
The BLACKOIL module of the scientific numerical simulator MUFITS [41, 42] is used in the present study, whe-reby previously undertaken benchmark simulations demonstrate that simulation results, absolutely identical to thoseproduced with a standard industry simulator, can be achieved even over a long-period simulation of CO2 injection atthe Ketzin pilot site [42]. The interested reader is kindly referred to Kempka et al. [9, 11], Kempka and Kuhn [10] andClass et al. [43] for detailed information on the numerical multiphase flow model parametrization and its impacts onthe simulation results.
3. Static reservoir model validation against hydraulic testing data
We employed the bottomhole pressures and fluid flow rates recorded during hydraulic testing at the Ketzin pilotsite [36, 38] to investigate the response of the static reservoir model revision presented by Kempka et al. [11]. Flowrates as well as observed and simulated bottomhole pressures are shown in Fig. 2.
Simulated pressure drawdown in any of the wells is about one order in magnitude below the observed bottomholedata, indicating that reservoir permeabilities assigned in the static reservoir model are not representing those in theStuttgart Formation. This is confirmed by a hydraulic testing interpretation [36], previous simulations using the hy-draulic testing data [37, 38], and the permeability multipliers required to match the bottomhole pressure history usingthe revised model [10, 11, 43]. The authors of the latter studies found that permeability reductions by factors of 0.05

642 Thomas Kempka et al. / Energy Procedia 125 (2017) 640–649Kempka and Norden / Energy Procedia 00 (2017) 000–000 3
to 0.25 are required in the near-well area to successfully simulate the pressure response of the Stuttgart Formationduring the first three years of CO2 injection. Further, a diverging far-field permeability multiplier has to be employedfor that purpose, ranging between 0.10 and 0.38 [43]. Consequently, the next step in the revision of the static geo-logical model is the integration of the hydraulic testing data by means of inverse simulations to calibrate the spatialdistribution of reservoir permeability, whereby the near-well area is specifically focussed due to the relatively shortdistances between the three wells (112 m in maximum).
Ktzi 201
Ktzi 200
Ktzi 202
Flo
w r
ate
(sm
3/d
ay)
0
10
20
30
40
50
Pre
ssu
re
dra
wd
ow
n (
bar)
−5
−4
−3
−2
−1
0
Time (days)
0 5 10 15 20 25 110 115 120 125 130 135
Pre
ssu
re
dra
wd
ow
n (
bar)
−15
−10
−5
Fig. 2. Flow rates as well as observed and simulated bottomhole pressure drawdown in the three wells Ktzi 200, Ktzi 201 and Ktzi 202. Solidlines indicate applied flow rates and dashed lines the observed pressure drawdown, while circles represent the flow rates applied in the reservoirsimulator and diamonds the simulated pressure response of the initial static reservoir model.
4. High-performance inverse modelling to revise permeability in static reservoir model
For calibration of the spatial reservoir permeability distribution, we integrated the MUFITS simulator with theparameter estimation tool PEST++ [44] in our flexible simulation framework [45]. High-performance inverse model-ling is achieved by running PEST++ in parallel mode on multiple computational nodes, which in turn execute theMUFITS simulator in parallel with up to ten processes, determined by the grid element count. The PLPROC softwarepackage [46] is used to carry out 2D interpolation of pilot-point data onto the numerical simulation grid, with 52 pilotpoints applied in total (cf. Fig. 5).
Inverse simulations are run in the PEST++ regularization mode with 157 parameters, of which 53 are set adjustable:52 permeability multipliers tied in the three principle directions at the pilot points, allowed to vary over a range of1 × 10−4 to 3 × 100, while one global vertical permeability multiplier is used with an allowed variation bandwidthof 1 × 10⁻² to 1 × 100. Further, 32 time-dependent data on pressure drawdown, observed during hydraulic testingare considered in our simulation runs. Pilot points are grouped into super parameters during specific iterations of theinverse simulation run, resulting in a significant reduction of total computational time.
Following a total number of 622 forward model runs within 13 inverse modelling iterations, the pre-defined ter-mination criterion, i.e., reduction of the relative objective function over a specific number of successive iterations
4 Kempka and Norden / Energy Procedia 00 (2017) 000–000
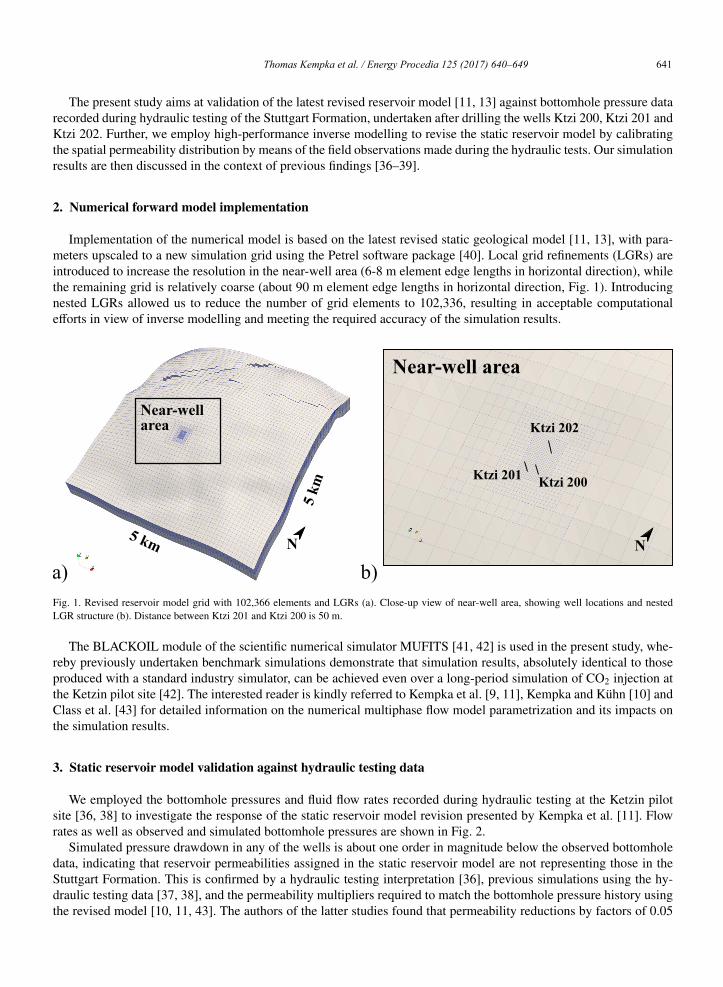
is met. Fig. 3 shows the simulated pressure drawdown based on the revised spatial distribution of permeability (cf.Figs. 6 and 7). A very good agreement with the observed pressure drawdown is achieved with the static reservoirmodel, revised by the inverse simulation procedure: pressure responses of the pumping wells exhibit identical values,indicating that local permeabilities in the close vicinities of the respective wells are properly represented; and further,also the pressure drawdown simulated in the observation wells shows an excellent agreement with the observations,emphasizing that the hydraulic connections between all three wells are reasonably quantified by the calibrated spatialdistribution of permeability. Minor deviations between simulated and field data are observed (Fig. 4), i.e., the localresponse of the Ktzi 201 well on pumping during the first week may result from errors in flow rate and pressuremeasurements, minor time shifts between both data and local near-well permeabilities that may not be representedby the near-well grid discretization chosen in our model [38]. Nevertheless, a correlation coefficient of R2 = 0.981emphasizes the high quality of the achieved calibration results.
Ktzi 201
Ktzi 200
Ktzi 202
Flo
w r
ate
(sm
3/d
ay)
0
10
20
30
40
50
Pre
ssu
re
dra
wd
ow
n (
bar)
−5
−4
−3
−2
−1
0
Time (days)
0 5 10 15 20 25 110 115 120 125 130 135
Pre
ssu
re
dra
wd
ow
n (
bar)
−15
−10
−5
Fig. 3. Flow rates as well as observed and simulated bottomhole pressure drawdown in the three wells Ktzi 200, Ktzi 201 and Ktzi 202. Solidlines indicate applied flow rates and dashed lines the observed pressure drawdown, while circles represent the flow rates applied in the reservoirsimulator and diamonds the simulated pressure response of the static reservoir model, revised by inverse simulations.
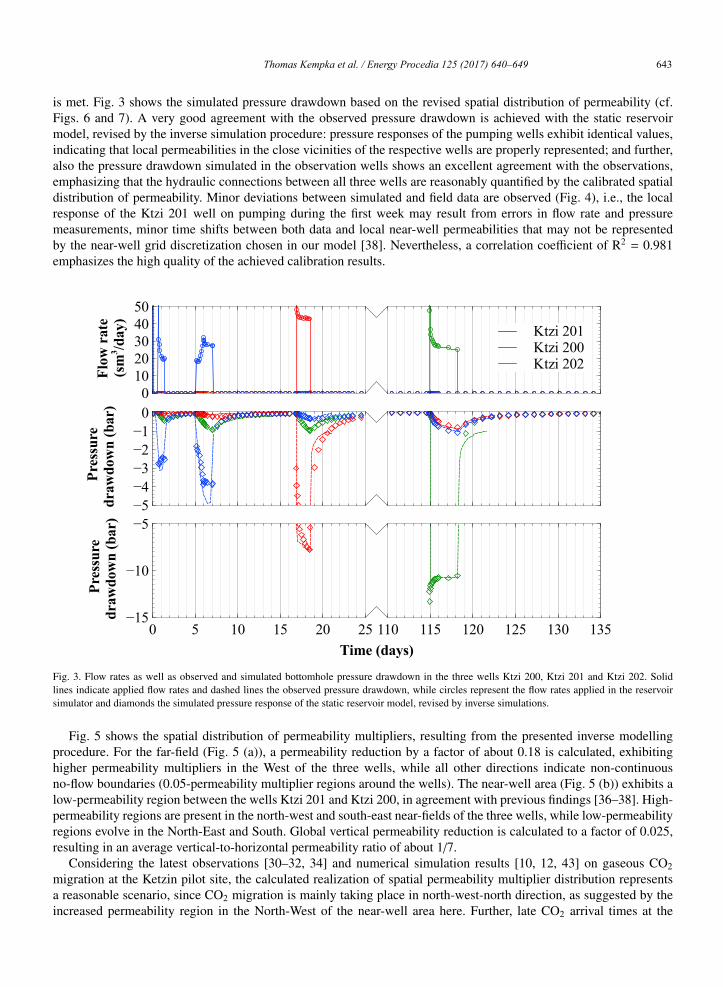
Fig. 5 shows the spatial distribution of permeability multipliers, resulting from the presented inverse modellingprocedure. For the far-field (Fig. 5 (a)), a permeability reduction by a factor of about 0.18 is calculated, exhibitinghigher permeability multipliers in the West of the three wells, while all other directions indicate non-continuousno-flow boundaries (0.05-permeability multiplier regions around the wells). The near-well area (Fig. 5 (b)) exhibits alow-permeability region between the wells Ktzi 201 and Ktzi 200, in agreement with previous findings [36–38]. High-permeability regions are present in the north-west and south-east near-fields of the three wells, while low-permeabilityregions evolve in the North-East and South. Global vertical permeability reduction is calculated to a factor of 0.025,resulting in an average vertical-to-horizontal permeability ratio of about 1/7.
Considering the latest observations [30–32, 34] and numerical simulation results [10, 12, 43] on gaseous CO2migration at the Ketzin pilot site, the calculated realization of spatial permeability multiplier distribution representsa reasonable scenario, since CO2 migration is mainly taking place in north-west-north direction, as suggested by theincreased permeability region in the North-West of the near-well area here. Further, late CO2 arrival times at the
Thomas Kempka et al. / Energy Procedia 125 (2017) 640–649 643Kempka and Norden / Energy Procedia 00 (2017) 000–000 3
to 0.25 are required in the near-well area to successfully simulate the pressure response of the Stuttgart Formationduring the first three years of CO2 injection. Further, a diverging far-field permeability multiplier has to be employedfor that purpose, ranging between 0.10 and 0.38 [43]. Consequently, the next step in the revision of the static geo-logical model is the integration of the hydraulic testing data by means of inverse simulations to calibrate the spatialdistribution of reservoir permeability, whereby the near-well area is specifically focussed due to the relatively shortdistances between the three wells (112 m in maximum).
Ktzi 201
Ktzi 200
Ktzi 202
Flo
w r
ate
(sm
3/d
ay)
0
10
20
30
40
50
Pre
ssu
re
dra
wd
ow
n (
bar)
−5
−4
−3
−2
−1
0
Time (days)
0 5 10 15 20 25 110 115 120 125 130 135
Pre
ssu
re
dra
wd
ow
n (
bar)
−15
−10
−5
Fig. 2. Flow rates as well as observed and simulated bottomhole pressure drawdown in the three wells Ktzi 200, Ktzi 201 and Ktzi 202. Solidlines indicate applied flow rates and dashed lines the observed pressure drawdown, while circles represent the flow rates applied in the reservoirsimulator and diamonds the simulated pressure response of the initial static reservoir model.
4. High-performance inverse modelling to revise permeability in static reservoir model
For calibration of the spatial reservoir permeability distribution, we integrated the MUFITS simulator with theparameter estimation tool PEST++ [44] in our flexible simulation framework [45]. High-performance inverse model-ling is achieved by running PEST++ in parallel mode on multiple computational nodes, which in turn execute theMUFITS simulator in parallel with up to ten processes, determined by the grid element count. The PLPROC softwarepackage [46] is used to carry out 2D interpolation of pilot-point data onto the numerical simulation grid, with 52 pilotpoints applied in total (cf. Fig. 5).
Inverse simulations are run in the PEST++ regularization mode with 157 parameters, of which 53 are set adjustable:52 permeability multipliers tied in the three principle directions at the pilot points, allowed to vary over a range of1 × 10−4 to 3 × 100, while one global vertical permeability multiplier is used with an allowed variation bandwidthof 1 × 10⁻² to 1 × 100. Further, 32 time-dependent data on pressure drawdown, observed during hydraulic testingare considered in our simulation runs. Pilot points are grouped into super parameters during specific iterations of theinverse simulation run, resulting in a significant reduction of total computational time.
Following a total number of 622 forward model runs within 13 inverse modelling iterations, the pre-defined ter-mination criterion, i.e., reduction of the relative objective function over a specific number of successive iterations
4 Kempka and Norden / Energy Procedia 00 (2017) 000–000
is met. Fig. 3 shows the simulated pressure drawdown based on the revised spatial distribution of permeability (cf.Figs. 6 and 7). A very good agreement with the observed pressure drawdown is achieved with the static reservoirmodel, revised by the inverse simulation procedure: pressure responses of the pumping wells exhibit identical values,indicating that local permeabilities in the close vicinities of the respective wells are properly represented; and further,also the pressure drawdown simulated in the observation wells shows an excellent agreement with the observations,emphasizing that the hydraulic connections between all three wells are reasonably quantified by the calibrated spatialdistribution of permeability. Minor deviations between simulated and field data are observed (Fig. 4), i.e., the localresponse of the Ktzi 201 well on pumping during the first week may result from errors in flow rate and pressuremeasurements, minor time shifts between both data and local near-well permeabilities that may not be representedby the near-well grid discretization chosen in our model [38]. Nevertheless, a correlation coefficient of R2 = 0.981emphasizes the high quality of the achieved calibration results.
Ktzi 201
Ktzi 200
Ktzi 202
Flo
w r
ate
(sm
3/d
ay)
0
10
20
30
40
50
Pre
ssu
re
dra
wd
ow
n (
bar)
−5
−4
−3
−2
−1
0
Time (days)
0 5 10 15 20 25 110 115 120 125 130 135
Pre
ssu
re
dra
wd
ow
n (
bar)
−15
−10
−5
Fig. 3. Flow rates as well as observed and simulated bottomhole pressure drawdown in the three wells Ktzi 200, Ktzi 201 and Ktzi 202. Solidlines indicate applied flow rates and dashed lines the observed pressure drawdown, while circles represent the flow rates applied in the reservoirsimulator and diamonds the simulated pressure response of the static reservoir model, revised by inverse simulations.
Fig. 5 shows the spatial distribution of permeability multipliers, resulting from the presented inverse modellingprocedure. For the far-field (Fig. 5 (a)), a permeability reduction by a factor of about 0.18 is calculated, exhibitinghigher permeability multipliers in the West of the three wells, while all other directions indicate non-continuousno-flow boundaries (0.05-permeability multiplier regions around the wells). The near-well area (Fig. 5 (b)) exhibits alow-permeability region between the wells Ktzi 201 and Ktzi 200, in agreement with previous findings [36–38]. High-permeability regions are present in the north-west and south-east near-fields of the three wells, while low-permeabilityregions evolve in the North-East and South. Global vertical permeability reduction is calculated to a factor of 0.025,resulting in an average vertical-to-horizontal permeability ratio of about 1/7.
Considering the latest observations [30–32, 34] and numerical simulation results [10, 12, 43] on gaseous CO2migration at the Ketzin pilot site, the calculated realization of spatial permeability multiplier distribution representsa reasonable scenario, since CO2 migration is mainly taking place in north-west-north direction, as suggested by theincreased permeability region in the North-West of the near-well area here. Further, late CO2 arrival times at the

644 Thomas Kempka et al. / Energy Procedia 125 (2017) 640–649Kempka and Norden / Energy Procedia 00 (2017) 000–000 5
Ktzi 202 well can be also explained by this realization, since only a low-permeable direct connection between theinjection well (Ktzi 201) and the first observation well (Ktzi 200) exists. Simulation results in view of CO2 arrivaltimes at the Ktzi 200 well [9, 10, 43] further support the hypothesis on the likely presence of a low-thickness sandchannel or low-permeability anhydrite-filled fracture between the wells Ktzi 201 and Ktzi 200, introduced by Chen etal. [38], since this is one reasonable explanation for the weak hydraulic connectivity between both wells and the fastCO2 arrival at the Ktzi 200 well.
Sim
ula
ted
bott
om
hole
pre
ssu
re (
bar)
50.0
52.5
55.0
57.5
60.0
62.5
65.0
Observed bottomhole pressure (bar)
50.0 52.5 55.0 57.5 60.0 62.5 65.0
Time (days)
0 515114118122
Res
idu
als
(b
ar)
−2
−1
0
1
2
3
Ktzi 201Ktzi 200Ktzi 202
Correlation coefficientR2 = 0.981
Fig. 4. Observed versus simulated bottomhole pressures exhibit a correlation coefficient of R2 = 0.981. Residuals versus time are plotted in theinset.
×103
0.05
0.05
0.05
0.180.18
0.41
Nort
hin
g
5817
5818
5819
5820
5821
Easting
354 355 356 357 358
×103
a) b)×10
3
0.05
0.05
0.05
0.180.18
0.41
0.41
0.41
0.72
0.72
1.13
1.13
1.62
1.62
2.89
5817.7
5817.8
5817.9
5818
Easting
355.1 355.2 355.3 355.4
×103
Ktzi 203
Ktzi 200
Ktzi 202
Ktzi 201
Fig. 5. Calculated permeability multipliers for the far-field (a) and near-well model areas (b). Pilot point locations are depicted by empty circlesand well locations by circles with white filling, isolines represent permeability multiplier contours (UTM-WGS84 projection).
6 Kempka and Norden / Energy Procedia 00 (2017) 000–000
A comparison between the initial and revised spatial distributions of permeability in the static reservoir modelat the Stuttgart Formation top is plotted in Figs. 6 and 7, illustrating the previously addressed overall permeabilityreduction in the calibrated model. Increased permeabilities apply for the sandstone channels, located about 500 mwest of the wells, in addition to the regions in the near well-area as discussed before. The low-permeability regionstriking in north-south direction in the near-well area is also well depicted (Fig. 7 (b)), complemented by differentlocalized regions of reduced permeability.
a) b)N
Fig. 6. Plane view of initial model far-field permeability distribution (a) and of that revised by inverse modelling (b) in the fourth upper grid layerof the reservoir model (Stuttgart Formation). Dotted circles indicate the location of the near-well area (cf. Fig. 7). Lateral model dimensions are5 km × 5 km.
a) b)
Ktzi 201 Ktzi 200
Ktzi 202
Ktzi 201 Ktzi 200
Ktzi 202
NFig. 7. 3D view of initial model near-well permeability distribution (a) and of that revised by inverse modelling (b) in the fourth upper grid layer ofthe reservoir model (Stuttgart Formation). Distance between Ktzi 201 and Ktzi 200 wells is 50 m.
Fig. 8 illustrates the standard deviations in the far-field and near-well area to provide a measure for the parameteruncertainty in the calibrated model. Near-well standard deviations (Fig. 8 (b)) are notably below those of the far-field,indicating the achieved uncertainty reduction close to the wells. Since the hydraulic tests undertaken at the Ketzinpilot site mainly account for the near-well are due to their implementation and design, far-field uncertainties are onlyinsignificantly reduced by the calibration process (Fig. 8 (a)), taking into account the applied initial standard deviationof log10(σ) = 1.1193 at all 52 pilot points. Standard deviation (log10(σ)) of the vertical-to-horizontal permeabilityratio was reduced from 0.5 to 0.4626 in the calibrated model.

Thomas Kempka et al. / Energy Procedia 125 (2017) 640–649 645Kempka and Norden / Energy Procedia 00 (2017) 000–000 5
Ktzi 202 well can be also explained by this realization, since only a low-permeable direct connection between theinjection well (Ktzi 201) and the first observation well (Ktzi 200) exists. Simulation results in view of CO2 arrivaltimes at the Ktzi 200 well [9, 10, 43] further support the hypothesis on the likely presence of a low-thickness sandchannel or low-permeability anhydrite-filled fracture between the wells Ktzi 201 and Ktzi 200, introduced by Chen etal. [38], since this is one reasonable explanation for the weak hydraulic connectivity between both wells and the fastCO2 arrival at the Ktzi 200 well.
Sim
ula
ted
bott
om
hole
pre
ssu
re (
bar)
50.0
52.5
55.0
57.5
60.0
62.5
65.0
Observed bottomhole pressure (bar)
50.0 52.5 55.0 57.5 60.0 62.5 65.0
Time (days)
0 515114118122
Res
idu
als
(b
ar)
−2
−1
0
1
2
3
Ktzi 201Ktzi 200Ktzi 202
Correlation coefficientR2 = 0.981
Fig. 4. Observed versus simulated bottomhole pressures exhibit a correlation coefficient of R2 = 0.981. Residuals versus time are plotted in theinset.
×103
0.05
0.05
0.05
0.180.18
0.41
Nort
hin
g
5817
5818
5819
5820
5821
Easting
354 355 356 357 358
×103
a) b)×10
3
0.05
0.05
0.05
0.180.18
0.41
0.41
0.41
0.72
0.72
1.13
1.13
1.62
1.62
2.89
5817.7
5817.8
5817.9
5818
Easting
355.1 355.2 355.3 355.4
×103
Ktzi 203
Ktzi 200
Ktzi 202
Ktzi 201
Fig. 5. Calculated permeability multipliers for the far-field (a) and near-well model areas (b). Pilot point locations are depicted by empty circlesand well locations by circles with white filling, isolines represent permeability multiplier contours (UTM-WGS84 projection).
6 Kempka and Norden / Energy Procedia 00 (2017) 000–000
A comparison between the initial and revised spatial distributions of permeability in the static reservoir modelat the Stuttgart Formation top is plotted in Figs. 6 and 7, illustrating the previously addressed overall permeabilityreduction in the calibrated model. Increased permeabilities apply for the sandstone channels, located about 500 mwest of the wells, in addition to the regions in the near well-area as discussed before. The low-permeability regionstriking in north-south direction in the near-well area is also well depicted (Fig. 7 (b)), complemented by differentlocalized regions of reduced permeability.
a) b)N
Fig. 6. Plane view of initial model far-field permeability distribution (a) and of that revised by inverse modelling (b) in the fourth upper grid layerof the reservoir model (Stuttgart Formation). Dotted circles indicate the location of the near-well area (cf. Fig. 7). Lateral model dimensions are5 km × 5 km.
a) b)
Ktzi 201 Ktzi 200
Ktzi 202
Ktzi 201 Ktzi 200
Ktzi 202
NFig. 7. 3D view of initial model near-well permeability distribution (a) and of that revised by inverse modelling (b) in the fourth upper grid layer ofthe reservoir model (Stuttgart Formation). Distance between Ktzi 201 and Ktzi 200 wells is 50 m.
Fig. 8 illustrates the standard deviations in the far-field and near-well area to provide a measure for the parameteruncertainty in the calibrated model. Near-well standard deviations (Fig. 8 (b)) are notably below those of the far-field,indicating the achieved uncertainty reduction close to the wells. Since the hydraulic tests undertaken at the Ketzinpilot site mainly account for the near-well are due to their implementation and design, far-field uncertainties are onlyinsignificantly reduced by the calibration process (Fig. 8 (a)), taking into account the applied initial standard deviationof log10(σ) = 1.1193 at all 52 pilot points. Standard deviation (log10(σ)) of the vertical-to-horizontal permeabilityratio was reduced from 0.5 to 0.4626 in the calibrated model.

646 Thomas Kempka et al. / Energy Procedia 125 (2017) 640–649Kempka and Norden / Energy Procedia 00 (2017) 000–000 7
b)a)Standard deviation log10(σ)
0.1 1.2
Nort
hin
g
5816
5817
5818
5819
5820
5821
Easting
353 354 355 356 357 358
×103
×103
×103
×103
Ktzi201Ktzi200
Ktzi202
Ktzi203
5817.70
5817.75
5817.80
5817.85
5817.90
5817.95
5818.00
Easting
355.1 355.2 355.3 355.4
Fig. 8. Parameter uncertainty at pilot points of the calibrated model for the far-field (a) and the near-well area (b), expressed by standard deviation(log10(σ)). Initial standard deviations were defined to log10(σ) = 1.1193 at all 52 pilot points. Empty circles represent well locations. Other circlesizes correlate with calculated standard deviation values (UTM-WGS84 projection).
5. Discussion and conclusions
We validated the latest revised static reservoir model of the Stuttgart Formation at the Ketzin pilot site againstobservations made during hydraulic testing after drilling of the first three wells. Simulation results emphasize thatreservoir permeabilities are significantly below those in the static reservoir model. This is in agreement with previousfindings, analysing the observations made during hydraulic testing by analytical and numerical modelling [36–39] aswell as numerical simulations of CO2 injection into the storage reservoir [10–12, 43]. Consequently, we calibrated thespatial distribution of reservoir permeability in a first step of a thorough model revision by high-performance inversemodelling based on the hydraulic testing data. Our results clearly demonstrate that reservoir permeabilities, requiredto match the pressure response to the hydraulic testing observations, are more than 80% below those in the initialstatic reservoir model, with a vertical-to-horizontal permeability anisotropy of about 1/7. Permeabilities, increased bya factor of up to three in the maximum were determined in the western region of the wells, while a region of lowpermeability was found in between the three wells. Considering these revisions in spatial permeability distribution,simulated and observed pressure responses to the hydraulic tests are in very good agreement.
As previously discussed by Wiese et al. [36] and Chen et al. [37, 38], a region of low permeability likely existsin between the wells, e.g., in form of a low-thickness sandstone channel or anhydrite-filled low-permeable fracturestriking in north-south direction. This theory supports the late CO2 arrival, observed at the Ktzi 202 well, delayed bya factor of three compared to former model predictions [9, 10, 43]. Further, this theory can also explain the reducedhydraulic conductivity between the Ktzi 201 and Ktzi 200 wells, derived from the hydraulic testing pressure response,while CO2 is able to migrate across this low-permeability region to arrive at the Ktzi 200 well according to initialnumerical model predictions [9, 10]. Our simulation results support these findings, when only the hydraulic testingdata is considered.
The next steps in static model revision will include validation of the new spatial permeability distribution elaboratedin the present study against data of the operational phase at the Ketzin pilot site [47–54], comprising at least threeyears of CO2 injection. Integrated inverse simulations of hydraulic testing and CO2 injection operation will be very
8 Kempka and Norden / Energy Procedia 00 (2017) 000–000
likely required due to the fact that inverse modelling of hydraulic testing mainly adjusts permeabilities in the near-well area, while previous studies show that specific permeability multipliers for the far-well area are of paramountimportance to fit the long-term bottomhole pressure development in the injection well [10, 43].
Acknowledgments
The authors gratefully acknowledge the funding for the Ketzin project received from the European Commission(6th and 7th Framework Program), two German ministries - the Federal Ministry of Economics and Technology andthe Federal Ministry of Education and Research - and industry since 2004. The ongoing R&D activities are fundedwithin the project COMPLETE by the Federal Ministry of Education and Research within the GEOTECHNOLOGIENprogram. Further funding is received by VGS, RWE, Vattenfall, Statoil, OMV and the Norwegian CLIMIT program.We are also very grateful to the two anonymous reviewers for their valuable comments that supported us in improvingthe manuscript’s quality.
References
[1] Schilling F, Borm G, Wurdemann H, Moller F, Kuhn M, and CO2SINK Group. (2009) “Status Report on the First European on-shore CO2Storage Site at Ketzin (Germany).” Energy Procedia 1 (2009): 2029–2035.
[2] Wurdemann H, Moller F, Kuhn M, Heidug W, Christensen NP, Borm G. et al. (2010) “CO2SINK - From site characterisation and risk asses-sment to monitoring and verification: One year of operational experience with the field laboratory for CO2 storage at Ketzin, Germany.” Int JGreenh Gas Con 4.6 (2010): 938–951.
[3] Martens S, Liebscher A, Moller F, Wurdemann H, Schilling F, Kuhn M. et al. (2011) “Progress Report on the First European on-shore CO2Storage Site at Ketzin (Germany) - Second Year of Injection.” Energy Procedia 4 (2011): 3246–3253.
[4] Martens S, Kempka T, Liebscher A, Luth S, Moller F, Myrttinen A. et al. (2012) “Europe’s longest-operating on-shore CO2 storage site atKetzin, Germany: A progress report after three years of injection.” Environ Earth Sci 67 (2012): 323–334.
[5] Martens S, Liebscher A, Moller F, Henninges J, Kempka T, Luth S. et al. (2013) “CO2 storage at the Ketzin pilot site: Fourth year of injection,monitoring, modelling and verification.” Energy Procedia 37 (2013): 6434–6443.
[6] Martens S, Moller F, Streibel M, Liebscher A, and the Ketzin Group. (2014) “Completion of five years of safe CO2 injection and transition tothe post-closure phase at the Ketzin pilot site.” Energy Procedia 59 (2014): 190–197.
[7] Bielinski A. (2007) “Numerical Simulation of CO2 Sequestration in Geological Formations.” Mitteilungsheft Nr. 155, Ph.D. thesis, Departmentof Hydraulic Engineering, University of Stuttgart, Germany.
[8] Probst P. (2008) “Numerical Simulations of CO2 Injection into Saline Aquifers: Estimation of Storage Capacity and Arrival Times usingMultiple Realizations of Heterogeneous Permeability Fields.” Master Thesis, Department of Hydraulic Engineering, University of Stuttgart,Germany.
[9] Kempka T, Kuhn M, Class H, Frykman P, Kopp A, Nielsen CM. et al. (2010) “Modelling of CO2 arrival time at Ketzin - Part I.” Int J GreenhGas Con 4.6 (2010): 1007–1015.
[10] Kempka T, and Kuhn M. (2013) “Numerical simulations of CO2 arrival times and reservoir pressure coincide with observations from the Ketzinpilot site, Germany.” Environ Earth Sci 70.8 (2013): 3675–3685.
[11] Kempka T, Class H., Gorke UJ, Norden B, Kolditz O, Kuhn M. et al. (2013) “A Dynamic Flow Simulation Code Intercomparison based on theRevised Static Model of the Ketzin Pilot Site.” Energy Procedia 40 (2013): 418–427.
[12] Kempka T, De Lucia M, and Kuhn M. (2014) “Geomechanical integrity verification and mineral trapping quantification for the Ketzin CO2storage pilot site by coupled numerical simulations.” Energy Procedia 63 (2014): 3330–3338.
[13] Norden B, and Frykman P. (2013) “Geological modelling of the Triassic Stuttgart Formation at the Ketzin CO2 storage site, Germany.” Int JGreenh Gas Con 19 (2013): 756–774.
[14] Norden B. (2011) “Modelling of the near-surface groundwater flow system at the CO2SINK site Ketzin, Germany.” Z Dtsch Ges Geowiss 162.1(2011): 63–77.
[15] Ouellet A, Berard T, Frykman P, Welsh P, Minton J, Pamucku Y. et al. (2010) “Reservoir geomechanics case study of seal integrity under CO2storage conditions at Ketzin, Germany.” Ninth Annual Conference on Carbon Capture and Sequestration. May 1013 2010.
[16] Kempka T, Klein E, De Lucia M, Tillner E, and Kuhn M. (2013) “Assessment of Long-term CO2 Trapping Mechanisms at the Ketzin PilotSite (Germany) by Coupled Numerical Modelling.” Energy Procedia 37 (2013): 5419–5426.
[17] Klein E, De Lucia M, Kempka T, and Kuhn M. (2013) “Evaluation of long-term mineral trapping at the Ketzin pilot site for CO2 storage: Anintegrative approach using geochemical modelling and reservoir simulation.” Int J Greenh Gas Con 19 (2013): 720–730.
[18] De Lucia M, Kempka T, and Kuhn M. (2015) “A coupling alternative to reactive transport simulations for long-term prediction of chemicalreactions in heterogeneous CO2 storage systems.” Geosci Model Dev 8 (2015): 279–294.
[19] Govindan R, Babaei M, Korre A, Shi JQ, Durucan S, Norden B. et al. (2014) “CO2 Storage Uncertainty and Risk Assessment for the Post-closure Period at the Ketzin Pilot Site in Germany.” Energy Procedia 63 (2014): 4758–4765.

Thomas Kempka et al. / Energy Procedia 125 (2017) 640–649 647Kempka and Norden / Energy Procedia 00 (2017) 000–000 7
b)a)Standard deviation log10(σ)
0.1 1.2
Nort
hin
g
5816
5817
5818
5819
5820
5821
Easting
353 354 355 356 357 358
×103
×103
×103
×103
Ktzi201Ktzi200
Ktzi202
Ktzi203
5817.70
5817.75
5817.80
5817.85
5817.90
5817.95
5818.00
Easting
355.1 355.2 355.3 355.4
Fig. 8. Parameter uncertainty at pilot points of the calibrated model for the far-field (a) and the near-well area (b), expressed by standard deviation(log10(σ)). Initial standard deviations were defined to log10(σ) = 1.1193 at all 52 pilot points. Empty circles represent well locations. Other circlesizes correlate with calculated standard deviation values (UTM-WGS84 projection).
5. Discussion and conclusions
We validated the latest revised static reservoir model of the Stuttgart Formation at the Ketzin pilot site againstobservations made during hydraulic testing after drilling of the first three wells. Simulation results emphasize thatreservoir permeabilities are significantly below those in the static reservoir model. This is in agreement with previousfindings, analysing the observations made during hydraulic testing by analytical and numerical modelling [36–39] aswell as numerical simulations of CO2 injection into the storage reservoir [10–12, 43]. Consequently, we calibrated thespatial distribution of reservoir permeability in a first step of a thorough model revision by high-performance inversemodelling based on the hydraulic testing data. Our results clearly demonstrate that reservoir permeabilities, requiredto match the pressure response to the hydraulic testing observations, are more than 80% below those in the initialstatic reservoir model, with a vertical-to-horizontal permeability anisotropy of about 1/7. Permeabilities, increased bya factor of up to three in the maximum were determined in the western region of the wells, while a region of lowpermeability was found in between the three wells. Considering these revisions in spatial permeability distribution,simulated and observed pressure responses to the hydraulic tests are in very good agreement.
As previously discussed by Wiese et al. [36] and Chen et al. [37, 38], a region of low permeability likely existsin between the wells, e.g., in form of a low-thickness sandstone channel or anhydrite-filled low-permeable fracturestriking in north-south direction. This theory supports the late CO2 arrival, observed at the Ktzi 202 well, delayed bya factor of three compared to former model predictions [9, 10, 43]. Further, this theory can also explain the reducedhydraulic conductivity between the Ktzi 201 and Ktzi 200 wells, derived from the hydraulic testing pressure response,while CO2 is able to migrate across this low-permeability region to arrive at the Ktzi 200 well according to initialnumerical model predictions [9, 10]. Our simulation results support these findings, when only the hydraulic testingdata is considered.
The next steps in static model revision will include validation of the new spatial permeability distribution elaboratedin the present study against data of the operational phase at the Ketzin pilot site [47–54], comprising at least threeyears of CO2 injection. Integrated inverse simulations of hydraulic testing and CO2 injection operation will be very
8 Kempka and Norden / Energy Procedia 00 (2017) 000–000
likely required due to the fact that inverse modelling of hydraulic testing mainly adjusts permeabilities in the near-well area, while previous studies show that specific permeability multipliers for the far-well area are of paramountimportance to fit the long-term bottomhole pressure development in the injection well [10, 43].
Acknowledgments
The authors gratefully acknowledge the funding for the Ketzin project received from the European Commission(6th and 7th Framework Program), two German ministries - the Federal Ministry of Economics and Technology andthe Federal Ministry of Education and Research - and industry since 2004. The ongoing R&D activities are fundedwithin the project COMPLETE by the Federal Ministry of Education and Research within the GEOTECHNOLOGIENprogram. Further funding is received by VGS, RWE, Vattenfall, Statoil, OMV and the Norwegian CLIMIT program.We are also very grateful to the two anonymous reviewers for their valuable comments that supported us in improvingthe manuscript’s quality.
References
[1] Schilling F, Borm G, Wurdemann H, Moller F, Kuhn M, and CO2SINK Group. (2009) “Status Report on the First European on-shore CO2Storage Site at Ketzin (Germany).” Energy Procedia 1 (2009): 2029–2035.
[2] Wurdemann H, Moller F, Kuhn M, Heidug W, Christensen NP, Borm G. et al. (2010) “CO2SINK - From site characterisation and risk asses-sment to monitoring and verification: One year of operational experience with the field laboratory for CO2 storage at Ketzin, Germany.” Int JGreenh Gas Con 4.6 (2010): 938–951.
[3] Martens S, Liebscher A, Moller F, Wurdemann H, Schilling F, Kuhn M. et al. (2011) “Progress Report on the First European on-shore CO2Storage Site at Ketzin (Germany) - Second Year of Injection.” Energy Procedia 4 (2011): 3246–3253.
[4] Martens S, Kempka T, Liebscher A, Luth S, Moller F, Myrttinen A. et al. (2012) “Europe’s longest-operating on-shore CO2 storage site atKetzin, Germany: A progress report after three years of injection.” Environ Earth Sci 67 (2012): 323–334.
[5] Martens S, Liebscher A, Moller F, Henninges J, Kempka T, Luth S. et al. (2013) “CO2 storage at the Ketzin pilot site: Fourth year of injection,monitoring, modelling and verification.” Energy Procedia 37 (2013): 6434–6443.
[6] Martens S, Moller F, Streibel M, Liebscher A, and the Ketzin Group. (2014) “Completion of five years of safe CO2 injection and transition tothe post-closure phase at the Ketzin pilot site.” Energy Procedia 59 (2014): 190–197.
[7] Bielinski A. (2007) “Numerical Simulation of CO2 Sequestration in Geological Formations.” Mitteilungsheft Nr. 155, Ph.D. thesis, Departmentof Hydraulic Engineering, University of Stuttgart, Germany.
[8] Probst P. (2008) “Numerical Simulations of CO2 Injection into Saline Aquifers: Estimation of Storage Capacity and Arrival Times usingMultiple Realizations of Heterogeneous Permeability Fields.” Master Thesis, Department of Hydraulic Engineering, University of Stuttgart,Germany.
[9] Kempka T, Kuhn M, Class H, Frykman P, Kopp A, Nielsen CM. et al. (2010) “Modelling of CO2 arrival time at Ketzin - Part I.” Int J GreenhGas Con 4.6 (2010): 1007–1015.
[10] Kempka T, and Kuhn M. (2013) “Numerical simulations of CO2 arrival times and reservoir pressure coincide with observations from the Ketzinpilot site, Germany.” Environ Earth Sci 70.8 (2013): 3675–3685.
[11] Kempka T, Class H., Gorke UJ, Norden B, Kolditz O, Kuhn M. et al. (2013) “A Dynamic Flow Simulation Code Intercomparison based on theRevised Static Model of the Ketzin Pilot Site.” Energy Procedia 40 (2013): 418–427.
[12] Kempka T, De Lucia M, and Kuhn M. (2014) “Geomechanical integrity verification and mineral trapping quantification for the Ketzin CO2storage pilot site by coupled numerical simulations.” Energy Procedia 63 (2014): 3330–3338.
[13] Norden B, and Frykman P. (2013) “Geological modelling of the Triassic Stuttgart Formation at the Ketzin CO2 storage site, Germany.” Int JGreenh Gas Con 19 (2013): 756–774.
[14] Norden B. (2011) “Modelling of the near-surface groundwater flow system at the CO2SINK site Ketzin, Germany.” Z Dtsch Ges Geowiss 162.1(2011): 63–77.
[15] Ouellet A, Berard T, Frykman P, Welsh P, Minton J, Pamucku Y. et al. (2010) “Reservoir geomechanics case study of seal integrity under CO2storage conditions at Ketzin, Germany.” Ninth Annual Conference on Carbon Capture and Sequestration. May 1013 2010.
[16] Kempka T, Klein E, De Lucia M, Tillner E, and Kuhn M. (2013) “Assessment of Long-term CO2 Trapping Mechanisms at the Ketzin PilotSite (Germany) by Coupled Numerical Modelling.” Energy Procedia 37 (2013): 5419–5426.
[17] Klein E, De Lucia M, Kempka T, and Kuhn M. (2013) “Evaluation of long-term mineral trapping at the Ketzin pilot site for CO2 storage: Anintegrative approach using geochemical modelling and reservoir simulation.” Int J Greenh Gas Con 19 (2013): 720–730.
[18] De Lucia M, Kempka T, and Kuhn M. (2015) “A coupling alternative to reactive transport simulations for long-term prediction of chemicalreactions in heterogeneous CO2 storage systems.” Geosci Model Dev 8 (2015): 279–294.
[19] Govindan R, Babaei M, Korre A, Shi JQ, Durucan S, Norden B. et al. (2014) “CO2 Storage Uncertainty and Risk Assessment for the Post-closure Period at the Ketzin Pilot Site in Germany.” Energy Procedia 63 (2014): 4758–4765.

648 Thomas Kempka et al. / Energy Procedia 125 (2017) 640–649Kempka and Norden / Energy Procedia 00 (2017) 000–000 9
[20] Kempka T, Klapperer S, and Norden B. (2014) “Coupled hydro-mechanical simulations demonstrate system integrity at the Ketzin pilot sitefor CO2 storage, Germany.” Rock Engineering and Rock Mechanics: Structures in and on Rock Masses. Proceedings of EUROCK 2014, ISRMEuropean Regional Symposium 2014.
[21] Baumann G, Henninges J, and De Lucia M. (2014) “Monitoring of saturation changes and salt precipitation during CO2 injection using pulsedneutron-gamma logging at the Ketzin pilot site.” Int J Greenh Gas Con 28 (2014): 134–146.
[22] Fischer S, De Lucia M, and Liebscher A. (2014) “Kinetic modeling of laboratory CO2-exposure experiments performed on whole rock reservoirsamples.” Greenh Gases 4.2 (2014): 244–256.
[23] Fischer S, Liebscher A, Zemke K, De Lucia M, and the Ketzin Team (2013) “Does Injected CO2 Affect (Chemical) Reservoir System Integrity?- A Comprehensive Experimental Approach.” Energy Procedia 37 (2013): 4473–4482.
[24] Fischer S, Liebscher A, De Lucia M, Hecht L, and the Ketzin Team (2013) “Reactivity of sandstone and siltstone samples from the Ketzin pilotCO2 storage site-Laboratory experiments and reactive geochemical modeling.” Environ Earth Sci 70.8 (2013): 3687–3708.
[25] Lengler U, De Lucia M, and Kuhn M. (2010) “The impact of heterogeneity on the distribution of CO2: Numerical simulation of CO2 storageat Ketzin.” Int J Greenh Gas Con 4.6 (2010): 1016–1025.
[26] Bergmann P, Lengler U, Schmidt-Hattenberger C, Giese R, and Norden B. (2010) “Modelling the geoelectric and seismic reservoir responsecaused by carbon dioxide injection based on multiphase flow simulation: Results from the CO2SINK project.” Chem Erde Geochem 70.3(2010): 173–183.
[27] Martens S, Kempka T, Liebscher A, Moller F, Schmidt-Hattenberger C, Streibel M. et al. (2015) “Field Experiment on CO2 Back-productionat the Ketzin Pilot Site.” Energy Procedia 76 (2015): 519–527.
[28] Unger V, and Kempka T. (2015) “Hydro-mechanical Simulations of Well Abandonment at the Ketzin Pilot Site for CO2 Storage Verify WellboreSystem Integrity.” Energy Procedia 76 (2015): 592–599.
[29] Wagner FM. (2016) “New developments in electrical resistivity imaging with applications to geological CO2 storage”. Ph.D. thesis. ETHZurich, The Switzerland.
[30] Huang F, Juhlin C, Han L, Sopher D, Ivandic M, Norden B. et al. (2017) “Feasibility of utilizing wavelet phase to map the CO2 plume at theKetzin pilot site, Germany.” Geophys Prospect 65.2 (2017): 523–543.
[31] Huang F, Bergmann P, Juhlin C, Ivandic M, Luth S, Ivanova A. et al. (2016) “The First Post-injection Seismic Monitor Survey at the KetzinPilot CO2 Storage Site: Results from Time-lapse Analysis.” Geophys Prospect, in press. doi:10.1111/1365–2478.12497
[32] Huang F, Juhlin C, Han L, Kempka T, Luth, and Zhang F. (2016) “Quantitative evaluation of thin-layer thickness and CO2 mass utilizingseismic complex decomposition at the Ketzin CO2 storage site, Germany.” Geophys J Int 207.1 (2016): 160–173.
[33] Huang F, Juhlin C, Kempka T, Norden B, and Zhang, F. (2015) “Modeling 3D time-lapse seismic response induced by CO2 by integratingborehole and 3D seismic data A case study at the Ketzin pilot site, Germany.” Int J Greenh Gas Con 36 (2015): 66–77.
[34] Luth S, Ivanova A, and Kempka T. (2015) “Conformity assessment of monitoring and simulation of CO2 storage: A case study from the Ketzinpilot site.” Int J Greenh Gas Con 42 (2015): 329–339.
[35] Ivanova A, Juhlin C, Lengler U, Bergmann P, Luth S, and Kempka T. (2013) “Impact of temperature on CO2 storage at the Ketzin site basedon fluid flow simulations and seismic data.” Int J Greenh Gas Con 19 (2013): 775–784.
[36] Wiese B, Bohner J, Enachescu C, Wurdemann H, and Zimmermann G. (2010) “Hydraulic characterisation of the Stuttgart formation at thepilot test site for CO2 storage, Ketzin, Germany.” Int J Greenh Gas Con 4.6 (2010): 960-971.
[37] Chen F, Zhou Q, Birkholzer JT, Wiese B, Norden B, and Kempka T. (2012) “TOUGH2 simulation of the pumping tests at Ketzin site: hetero-geneity effects and model calibration.” Proceedings, TOUGH Symposium, Lawrence Berkeley NationalLaboratory, Berkeley, CA, September17-19 2012.
[38] Chen F, Wiese B, Zhou Q, Kowalsky MB, Norden B, Kempka T. et al. (2014) “Numerical modelling of the pumping tests at the Ketzin pilotsite for CO2 injection: Model calibration and heterogeinity effects.” Int J Greenh Gas Con 22 (2014): 200–212.
[39] Otto C. (2013) “Hydraulische Characterisierung der Stuttgart Formation mittels Auswertung von Crosshole-Pumpversuchen und inverserModellierung.” Diploma Thesis, University of Potsdam, Potsdam, Germany (in German).
[40] Schlumberger (2011) “Petrel Seismic-to-Evaluation Software, Version 2011.2.”[41] Afanasyev A. (2015) “Hydrodynamic modelling of petroleum reservoirs using simulator MUFITS.” Energy Procedia 76 (2015): 427–435.[42] Afanasyev A, Kempka T, Kuhn M, and Melnik O. (2016) “Validation of the MUFITS Reservoir Simulator Against Standard CO2 Storage
Benchmarks and History-matched Models of the Ketzin Pilot Site.” Energy Procedia 97 (2016): 395–402.[43] Class H, Mahl L, Ahmed W, Norden B, Kuhn M, and Kempka T. (2015) “Matching Pressure Measurements and Observed CO2 Arrival Times
with Static and Dynamic Modelling at the Ketzin Storage site.” Energy Procedia 76 (2015): 623–632.[44] Welter DE, White JT, Hunt RJ, and Doherty JE. (2015) “Approaches in highly parameterized inversion: PEST++ Version 3, a Parameter ESTi-
mation and uncertainty analysis software suite optimized for large environmental models: U.S. Geological Survey Techniques and Methods.”Book 7, Section C12.
[45] Kempka T, Nakaten B, De Lucia M, Nakaten N, Otto C, Pohl M. et al. (2016) “Flexible Simulation Framework to Couple Processes in Complex3D Models for Subsurface Utilization Assessment.” Energy Procedia 97 (2016): 494–501.
[46] PLPROC (2017) “PLPROC - A Powerful Parameter List Processor.” Available online: http://www.pesthomepage.org/PLPROC.php (last acces-sed: 31 May 2017).
[47] Moller F, Liebscher A, Martens S, Schmidt-Hattenberger C, and Kuhn M. (2012) “Supplement 2008 to: Moller F, Liebscher A, Martens S,Schmidt-Hattenberger C, and Kuhn M.: Yearly Operational Datasets of the CO2 Storage Pilot Site Ketzin, Germany.” doi:10.5880/GFZ.b103-12066.2008.
[48] Moller F, Liebscher A, Martens S, Schmidt-Hattenberger C, and Kuhn M. (2012) “Supplement 2009 to: Moller F, Liebscher A, Martens S,Schmidt-Hattenberger C, and Kuhn M.: Yearly Operational Datasets of the CO2 Storage Pilot Site Ketzin, Germany.” doi:10.5880/GFZ.b103-12066.2009.

Thomas Kempka et al. / Energy Procedia 125 (2017) 640–649 649Kempka and Norden / Energy Procedia 00 (2017) 000–000 9
[20] Kempka T, Klapperer S, and Norden B. (2014) “Coupled hydro-mechanical simulations demonstrate system integrity at the Ketzin pilot sitefor CO2 storage, Germany.” Rock Engineering and Rock Mechanics: Structures in and on Rock Masses. Proceedings of EUROCK 2014, ISRMEuropean Regional Symposium 2014.
[21] Baumann G, Henninges J, and De Lucia M. (2014) “Monitoring of saturation changes and salt precipitation during CO2 injection using pulsedneutron-gamma logging at the Ketzin pilot site.” Int J Greenh Gas Con 28 (2014): 134–146.
[22] Fischer S, De Lucia M, and Liebscher A. (2014) “Kinetic modeling of laboratory CO2-exposure experiments performed on whole rock reservoirsamples.” Greenh Gases 4.2 (2014): 244–256.
[23] Fischer S, Liebscher A, Zemke K, De Lucia M, and the Ketzin Team (2013) “Does Injected CO2 Affect (Chemical) Reservoir System Integrity?- A Comprehensive Experimental Approach.” Energy Procedia 37 (2013): 4473–4482.
[24] Fischer S, Liebscher A, De Lucia M, Hecht L, and the Ketzin Team (2013) “Reactivity of sandstone and siltstone samples from the Ketzin pilotCO2 storage site-Laboratory experiments and reactive geochemical modeling.” Environ Earth Sci 70.8 (2013): 3687–3708.
[25] Lengler U, De Lucia M, and Kuhn M. (2010) “The impact of heterogeneity on the distribution of CO2: Numerical simulation of CO2 storageat Ketzin.” Int J Greenh Gas Con 4.6 (2010): 1016–1025.
[26] Bergmann P, Lengler U, Schmidt-Hattenberger C, Giese R, and Norden B. (2010) “Modelling the geoelectric and seismic reservoir responsecaused by carbon dioxide injection based on multiphase flow simulation: Results from the CO2SINK project.” Chem Erde Geochem 70.3(2010): 173–183.
[27] Martens S, Kempka T, Liebscher A, Moller F, Schmidt-Hattenberger C, Streibel M. et al. (2015) “Field Experiment on CO2 Back-productionat the Ketzin Pilot Site.” Energy Procedia 76 (2015): 519–527.
[28] Unger V, and Kempka T. (2015) “Hydro-mechanical Simulations of Well Abandonment at the Ketzin Pilot Site for CO2 Storage Verify WellboreSystem Integrity.” Energy Procedia 76 (2015): 592–599.
[29] Wagner FM. (2016) “New developments in electrical resistivity imaging with applications to geological CO2 storage”. Ph.D. thesis. ETHZurich, The Switzerland.
[30] Huang F, Juhlin C, Han L, Sopher D, Ivandic M, Norden B. et al. (2017) “Feasibility of utilizing wavelet phase to map the CO2 plume at theKetzin pilot site, Germany.” Geophys Prospect 65.2 (2017): 523–543.
[31] Huang F, Bergmann P, Juhlin C, Ivandic M, Luth S, Ivanova A. et al. (2016) “The First Post-injection Seismic Monitor Survey at the KetzinPilot CO2 Storage Site: Results from Time-lapse Analysis.” Geophys Prospect, in press. doi:10.1111/1365–2478.12497
[32] Huang F, Juhlin C, Han L, Kempka T, Luth, and Zhang F. (2016) “Quantitative evaluation of thin-layer thickness and CO2 mass utilizingseismic complex decomposition at the Ketzin CO2 storage site, Germany.” Geophys J Int 207.1 (2016): 160–173.
[33] Huang F, Juhlin C, Kempka T, Norden B, and Zhang, F. (2015) “Modeling 3D time-lapse seismic response induced by CO2 by integratingborehole and 3D seismic data A case study at the Ketzin pilot site, Germany.” Int J Greenh Gas Con 36 (2015): 66–77.
[34] Luth S, Ivanova A, and Kempka T. (2015) “Conformity assessment of monitoring and simulation of CO2 storage: A case study from the Ketzinpilot site.” Int J Greenh Gas Con 42 (2015): 329–339.
[35] Ivanova A, Juhlin C, Lengler U, Bergmann P, Luth S, and Kempka T. (2013) “Impact of temperature on CO2 storage at the Ketzin site basedon fluid flow simulations and seismic data.” Int J Greenh Gas Con 19 (2013): 775–784.
[36] Wiese B, Bohner J, Enachescu C, Wurdemann H, and Zimmermann G. (2010) “Hydraulic characterisation of the Stuttgart formation at thepilot test site for CO2 storage, Ketzin, Germany.” Int J Greenh Gas Con 4.6 (2010): 960-971.
[37] Chen F, Zhou Q, Birkholzer JT, Wiese B, Norden B, and Kempka T. (2012) “TOUGH2 simulation of the pumping tests at Ketzin site: hetero-geneity effects and model calibration.” Proceedings, TOUGH Symposium, Lawrence Berkeley NationalLaboratory, Berkeley, CA, September17-19 2012.
[38] Chen F, Wiese B, Zhou Q, Kowalsky MB, Norden B, Kempka T. et al. (2014) “Numerical modelling of the pumping tests at the Ketzin pilotsite for CO2 injection: Model calibration and heterogeinity effects.” Int J Greenh Gas Con 22 (2014): 200–212.
[39] Otto C. (2013) “Hydraulische Characterisierung der Stuttgart Formation mittels Auswertung von Crosshole-Pumpversuchen und inverserModellierung.” Diploma Thesis, University of Potsdam, Potsdam, Germany (in German).
[40] Schlumberger (2011) “Petrel Seismic-to-Evaluation Software, Version 2011.2.”[41] Afanasyev A. (2015) “Hydrodynamic modelling of petroleum reservoirs using simulator MUFITS.” Energy Procedia 76 (2015): 427–435.[42] Afanasyev A, Kempka T, Kuhn M, and Melnik O. (2016) “Validation of the MUFITS Reservoir Simulator Against Standard CO2 Storage
Benchmarks and History-matched Models of the Ketzin Pilot Site.” Energy Procedia 97 (2016): 395–402.[43] Class H, Mahl L, Ahmed W, Norden B, Kuhn M, and Kempka T. (2015) “Matching Pressure Measurements and Observed CO2 Arrival Times
with Static and Dynamic Modelling at the Ketzin Storage site.” Energy Procedia 76 (2015): 623–632.[44] Welter DE, White JT, Hunt RJ, and Doherty JE. (2015) “Approaches in highly parameterized inversion: PEST++ Version 3, a Parameter ESTi-
mation and uncertainty analysis software suite optimized for large environmental models: U.S. Geological Survey Techniques and Methods.”Book 7, Section C12.
[45] Kempka T, Nakaten B, De Lucia M, Nakaten N, Otto C, Pohl M. et al. (2016) “Flexible Simulation Framework to Couple Processes in Complex3D Models for Subsurface Utilization Assessment.” Energy Procedia 97 (2016): 494–501.
[46] PLPROC (2017) “PLPROC - A Powerful Parameter List Processor.” Available online: http://www.pesthomepage.org/PLPROC.php (last acces-sed: 31 May 2017).
[47] Moller F, Liebscher A, Martens S, Schmidt-Hattenberger C, and Kuhn M. (2012) “Supplement 2008 to: Moller F, Liebscher A, Martens S,Schmidt-Hattenberger C, and Kuhn M.: Yearly Operational Datasets of the CO2 Storage Pilot Site Ketzin, Germany.” doi:10.5880/GFZ.b103-12066.2008.
[48] Moller F, Liebscher A, Martens S, Schmidt-Hattenberger C, and Kuhn M. (2012) “Supplement 2009 to: Moller F, Liebscher A, Martens S,Schmidt-Hattenberger C, and Kuhn M.: Yearly Operational Datasets of the CO2 Storage Pilot Site Ketzin, Germany.” doi:10.5880/GFZ.b103-12066.2009.
10 Kempka and Norden / Energy Procedia 00 (2017) 000–000
[49] Moller F, Liebscher, A., Martens, S., Schmidt-Hattenberger, C., Kuhn, M. (2012) “Supplement 2010 to: Moller F, Liebscher A, Martens S,Schmidt-Hattenberger C, and Kuhn M.: Yearly Operational Datasets of the CO2 Storage Pilot Site Ketzin, Germany.” doi:10.5880/GFZ.b103-12066.2010.
[50] Moller F, Liebscher A, Martens S, Schmidt-Hattenberger C, and Kuhn M. (2012) “Supplement 2011 to: Moller F, Liebscher A, Martens S,Schmidt-Hattenberger C, and Kuhn M.: Yearly Operational Datasets of the CO2 Storage Pilot Site Ketzin, Germany.” doi:10.5880/GFZ.b103-12066.2011.
[51] Moller F, Liebscher A, Martens S, Schmidt-Hattenberger C, and Kuhn M.(2013) “Supplement 2012 to: Moller F, Liebscher A, MartensS, Schmidt-Hattenberger C, and Kuhn M.: Yearly Operational Datasets of the CO2 Storage Pilot Site Ketzin, Germany.” Deutsches Geo-ForschungsZentrum GFZ. doi:10.5880/GFZ.b103-12066.2012.
[52] Moller F, Liebscher A, Martens S, Schmidt-Hattenberger C, and Kuhn M.(2015) “Supplement 2013 to: Moller F, Liebscher A, MartensS, Schmidt-Hattenberger C, and Kuhn M.: Yearly Operational Datasets of the CO2 Storage Pilot Site Ketzin, Germany.” Deutsches Geo-ForschungsZentrum GFZ. doi:10.5880/GFZ.b103-12066.2013
[53] Moller F, Martens S, Liebscher A, and Streibel M. (2015) “Supplement to: Dataset of the Back-production Test at the CO2 Storage Pilot SiteKetzin, Germany.” doi:10.5880/GFZ.CGS.2015.001.
[54] Moller F, Liebscher A, and Schmidt-Hattenberger C. (2016) “Dataset of the Brine Injection at the CO2 Storage Pilot Site Ketzin, Germany.”doi:10.5880/GFZ.6.3.2016.001.