inventory planning & control
TRANSCRIPT

Inventory Planning
&
Control


Inventory Planning
• The process of determining the optimal quantity and timing of Inventory for the purpose of aligning it with sales and production capacity .
•Inventory planning has direct impact a company's cash flow and profit margins especially for smaller businesses that rely upon a quick turnover of goods or materials.

Objectives of Inventory Planning Customer Satisfaction
Forecasting Needs
Controlling Costs
Successful Storage
Objectives of Inventory Planning
Forecasting Needs
Controlling Costs
Successful Storage
Customer Satisfaction

Advantages of inventory planning
You know your stock levels
You can conduct stock rotation
You can optimize and reduce stock of items that don’t move that quickly
You can move you quick moving items to the front thereby speeding up picking
You can quick identify items that are not moving that you can remove from your inventory

Disadvantages of inventory planning
It doesn’t stop staff stealing stock
It can waste a lot of effort if not implemented and maintained correctly
It doesn’t replace incompetent management
It can be very expensive and the return on investment can take a long time
It requires a lot of staff training and you may loose some staff on the way


Material Requirement Planning Material requirements
planning (MRP) is a production planning and inventory control system used to manage manufacturing processes. Most MRP systems are software-based, while it is possible to conduct MRP by hand as well.

What can MRP do ? Reduce Inventory Levels
Reduce Component shortages
Improve Shipping Performance
Improve Customer Service
Improve Productivity
Simplified and Accurate Scheduling
Reduce Purchasing Cost
Improve Production Schedules

Conti…. Reduce Manufacturing Cost
Reduce Lead Times
Less Scrap and Rework
Higher Production Quality
Improve Communication
Improve Plant Efficiency
Reduce Fright Cost
Reduction in Excess Inventory
Reduce Overtime

Three Basic Steps Of MRP
Identifying Requirements
Running MRP – Creating the Suggestions
Framing the Suggestions

Step 1: Identifying the Requirements Quantity on Hand
Quantity on Open Purchase Order
Quantity in/or Planned for Manufacturing
Quantity Committed to Existing Orders
Quantity Forecasted

Step 2: Running MRP – Creating the Suggestions Critical Items
Expedite Items
Delay Items

Step 3: Framing the suggestions Manufacturing Orders
Purchasing Orders
Various Reports

Types Of MRP Reports
Primary MRP Reports
Secondary MRP Reports

Primary MRP Reports Planned orders to be released at a future time. Order release notices to execute the planned orders. Changes in due dates of open orders due to
rescheduling. Cancellations or suspensions of open orders due to
cancellation or suspension of orders on the master production schedule.
Inventory status data.
Secondary MRP Reports Planning reports, for example, forecasting inventory
requirements over a period of time. Performance reports used to determine agreement
between actual and programmed usage and costs. Exception reports used to point out serious
discrepancies, such as late or overdue orders.

What is Master Production Schedule ? A Master Production Schedule or MPS is the plan that
a company has developed for production, inventory, staffing, etc. It sets the quantity of each end item to be completed in each week of a short-range planning horizon. A Master Production Schedule is the master of all schedules. It is a plan for future production of end items.

The Master Production Schedule gives production, planning, purchasing, and top management the information needed to plan and control the manufacturing operation. The application ties overall business planning and forecasting to detail operations through the Master Production Schedule.

Bill of Materials (BOM)
A listing of all the subassemblies, intermediates, parts, and raw materials that go into a parent assembly showing the quantity of each required to make an assembly.
Basically, a bill of material (BOM) is a complete list of the components making up an object or assembly.
Bills of materials come in different types specific to engineering (used in the design process), manufacturing (used in the manufacturing process), and so on. A manufacturing BOM is of vital importance in materials requirement planning (MRP) and enterprise resource planning (ERP) systems.

Benefits of a BOM Improve material management by responding to changes
in production.
Reduce inventory levels and obsolete parts.
Reduce manufacturing costs.
Minimize clerical and engineering efforts by optimizing the tasks of maintaining and changing multi-level bills.
Supports variable length part numbers and unlimited descriptive text.
Easy methods for accessing part information

Inventory Control is the supervision of supply, storage and accessibility of items in order to ensure an adequate supply without excessive oversupply
Objectives of inventory control Protection against fluctuations in demand
Better use of men, material & machines
Protection against fluctuations in output
Control of stock volume
Control of stock distribution
Major activities of inventory control Planning the inventories
Procurement of inventories
Receiving and inspecting the inventories
Storing and issuing the inventory
Recording the receipt and issues of inventories
Physical verification of inventories
Follow-up function
Material standardisation and substitution

Steps in Inventory Control Deciding the maximum-minimum limits of
inventory
Determination of Reorder point
Determination of Reorder quantity
ABC Analysis

ABC analysis (Inventory) ABC analysis is an inventory categorization
method which consists in dividing items into three categories, A, B and C: A being the most valuable items, C being the least valuable ones. This method aims to draw managers’ attention on the critical few (A-items) and not on the trivial many (C-items).

The ABC approach states that, when reviewing inventory, a company should rate items from A to C, basing its ratings on the following rules:
A-items are goods which annual consumption value is the highest. The top 70-80% of the annual consumption value of the company typically accounts for only 10-20% of total inventory items.
B-items are the interclass items, with a medium consumption value. Those 15-25% of annual consumption value typically accounts for 30% of total inventory items.
C-items are, on the contrary, items with the lowest consumption value. The lower 5% of the annual consumption value typically accounts for 50% of total inventory items.

Purpose of inventory To maintain independency of operation
To meet variation in product demand
To allow flexibility in product scheduling
To provide a safeguard for variation in raw material delivery time
To take advantages of economic purchase order size

Types of inventory
control
Independent Demand
Dependent Demand
Independent Demand
An inventory of an item is said to be falling into the category of independent demand when the demand for such an item is not dependant upon the demand for another item.
Finished goods Items, which are ordered by External Customers or manufactured for stock and sale, are called independent demand items.
Independent demands for inventories are based on confirmed Customer orders, forecasts, estimates and past historical data.

Dependant Demand
If the demand for inventory of an item is dependant upon another item, such demands are categorized as dependant demand.
Raw materials and component inventories are dependant upon the demand for Finished Goods and hence can be called as Dependant demand inventories.

Difference between independent demand & dependent demand:
One of the biggest differences in inventory is between dependent and independent demand. Understanding this difference is important as the entire inventory policy for an item is based on this.
Independent demand is demand for a finished product, such as a computer, a bicycle, or a pizza. Dependent demand, on the other hand, is demand for component parts or subassemblies.
For example, this would be the microchips in the computer, the wheels on the bicycle, or the amount of cheese on the pizza.

Inventory System
A set of policies and controls that monitors levels of inventory and determines what levels should be maintained, when stock should be replenished, and how large orders should be

Single Period Inventory Models A single period inventory model is used to identify the
amount of inventory to purchase given a perishable good or single opportunity to purchase.
The amount of the single order is based on balancing the cost of over- and under-estimating demand. This is a very common problem in areas such as:
Overbooking of airline seats or hotel rooms
Ordering of fashion items
Any type of one-time order (t-shirts for a sporting event)

Multi period inventory system Demand for the product is constant and uniform throughout the period
Lead time (time from ordering to receipt) is constant
Price per unit of product is constant
Inventory holding cost is based on average inventory
Ordering or setup costs are constant
All demands for the product will be satisfied (No back orders are allowed)

Fixed- time periods
models/p-model
Fixed- order quantity models/ EOQ(Economic Order Quantity)
multi period inventory
system

Economic Order Quantity(EOQ) Economic order quantity is the order quantity that
minimizes total inventory holding costs and ordering costs.
The framework used to determine this order quantity is also known as Wilson EOQ Model or Wilson Formula
The model was developed by Ford W. Harris in 1913

Fixed-time periods models/p-model
This is similar to the fixed–order quantity model;it is used when the item should be in-stock and ready to use.In this case, rather than monitoring the inventory level and ordering when the level gets down to a critical quantity, the item is ordered at certain intervals of time,
for example, every Friday morning. This is often convenient when a group of items is ordered together. An example is the delivery of different types of bread to a grocery store. The bakery supplier may have 10 or more products stocked in a store, and rather than delivering each product individually at different times, it is much more efficient to deliver all 10 together at the same time and on the same schedule.

Assumptions
The ordering cost is constant.
The rate of demand is known, and spread evenly throughout the year.
The lead time is fixed.
The purchase price of the item is constant i.e. no discount is available
Only one product is involved.

To find EOQ
TC=DC+D/S
Basic Fixed-Order Quantity (EOQ) Model Formula
H 2
Q + S
Q
D + DC = TC
Total Annual =Cost
AnnualPurchaseCost
AnnualOrderingCost
AnnualHoldingCost
+ +
TC=Total annual
cost
D =Demand
C =Cost per unit
Q =Order quantity
S =Cost of placing
an order or setup
cost
R =Reorder point
L =Lead time
H=Annual holding
and storage cost
per unit of inventory
17-40

Deriving the EOQ
Using calculus, we take the first derivative of the total cost function with respect to Q, and set the derivative (slope) equal to zero, solving for the optimized (cost minimized) value of Qopt
Q = 2DS
H =
2(Annual D em and)(Order or Setup Cost)
Annual Holding CostO PT
R eorder point, R = d L_
d = average daily demand (constant)
L = Lead time (constant)
_
We also need a
reorder point to
tell us when to
place an order
17-41

EOQ Example (1) Problem Data
Annual Demand = 1,000 unitsDays per year considered in average
daily demand = 365Cost to place an order = $10Holding cost per unit per year = $2.50Lead time = 7 daysCost per unit = $15
Given the information below, what are the EOQ and
reorder point?
17-42
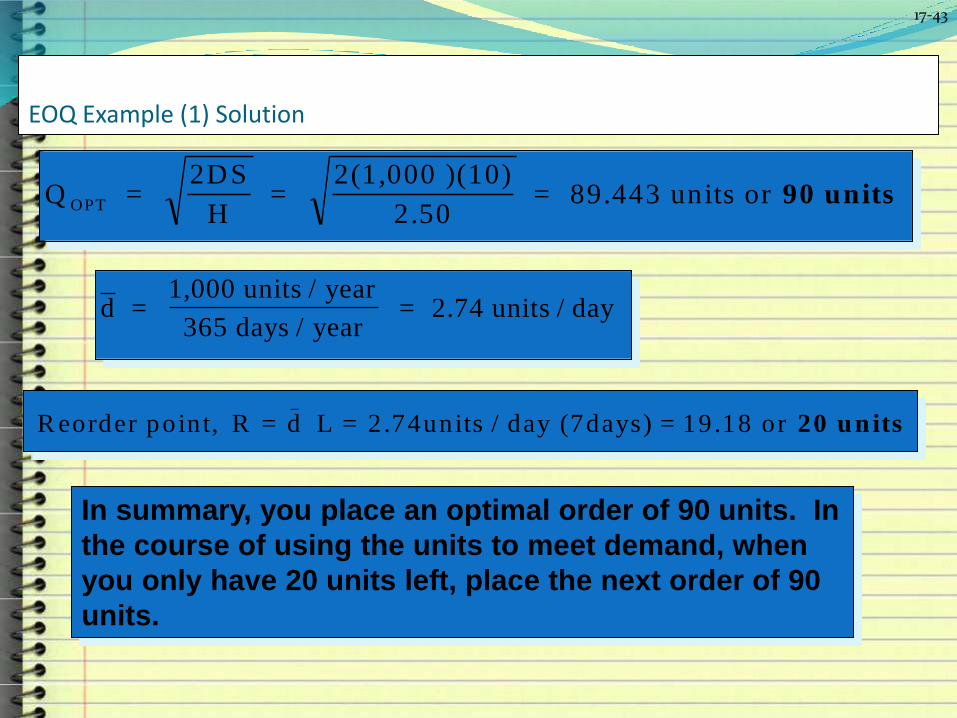
EOQ Example (1) Solution
Q = 2DS
H =
2(1,000 )(10)
2.50 = 89.443 units or OPT 90 units
d = 1,000 units / year
365 days / year = 2.74 units / day
R eorder point, R = d L = 2.74units / day (7days) = 19.18 or _
20 units
In summary, you place an optimal order of 90 units. In
the course of using the units to meet demand, when
you only have 20 units left, place the next order of 90
units.
17-43

Carrying Cost Of Inventory
This is the cost a business incurs over a certain period of time, to hold and store its inventory
Businesses use this figure to help them determine how much profit can be made on current inventory.
It also helps them find out if there is a need to produce more or less, in order to keep up with expenses or maintain the same income stream.
Different Types of Inventory Costs1. Holding\Carrying cost
2. Ordering costs:
3. Storage costs:
4. Setup/production change costs :

Holding\Carrying cost They are expenses such as storage, handling, insurance,
taxes, obsolescence, and interest on funds financing the goods.
These charges increase as inventory levels rise. To minimize carrying costs, management makes frequent orders of small quantities.
Holding costs are commonly assessed as a percentage of unit value, rather than attempting to derive monetary value for each of these costs individually.
This practice is a reflection of the difficulty inherent in deriving a specific per unit cost, for example, obsolescence or theft.

Ordering costs: Ordering costs are those fees associated with placing
an order, including expenses related to personnel in purchasing department, communications, and the handling of related paper work.
Lowering these costs would be accomplished by placing small number of orders, each for a large quantity.
Unlike carrying costs, ordering expenses are generally expressed as a monetary value per order.

Storage costs: When the stock of the item is depleted, an order for
that item must wait until the stock is replenished or be cancelled
There is a trade off between carrying stock to satisfy demand and the cost resulting from stock out
Setup/production change costs To make each different product involves obtaining the
necessary material, arranging specific equipment setup, filling out the required papers, appropriately charging time and materials, and moving out the previous stock of material
If there were no cost or loss of time in changing from one product to another, many small lots would be produced.
These would reduce inventory levels, with a resulting saving in cost.

Thank you