inventory management strategies for local farm supply cooperatives
TRANSCRIPT


Abstract
Inventory Management Strategiesfor Local Farm Supply Cooperatives
James J. WadsworthAgricultural Economist
This report presents fundamental yet important strategies for farm supplycooperatives to use during the everyday management of the inventory they pur-chase and carry for sale to patrons. Basic elements and concepts associatedwith strategies are described within the framework of a management plan. Thegoal is effective inventory management. This material is intended to providefarm supply cooperative managers and employees with information that willenhance inventory management in their cooperatives.
Key Words: Inventory management, merchandise, strategies, plan.
Service Report 41
July 1994

Preface
Effective inventory management is imperative for successful operation of farmsupply cooperatives. Inventory management requires continuous decisionmak-ing. Cooperative managers can increase the probability of making good inven-tory management decisions by using fundamental inventory managementstrategies implemented as part of an organized plan.
The strategies and concepts described in this report do not include all theapproaches that farm supply cooperative managers can use in developing orenhancing inventory management. Rather, this report selects and focuses on10 fundamental strategies or concepts. These strategies or concepts shouldbe included in cooperative plans for the everyday management of the mer-chandise ordered and held for sale and clearly understood by employees.

Contents
Highlights . . . . . . . . . . . . . . . . . . . . . . . . . . . . . . . . . . . . . . . . . . . . . . . . . . . . . . . . . . . . . . . . . . . . . . . . . . . . . . . . . . . . . . . . . . . . . . . . . . . . . V
Planning for Effective Inventory Management . . . . . . . . . . . . . . . . . . . . . . . . . . . . . . . . . . . . . . . . . . . . . . 1
Inventory Management Strategies ............................................................... 2(1) Attain Proper inventory Mix ................................................................ 2(2) Maintain Efficient Inventory Levels ..................................................... 4
Inventory Level by Type of Inventory .............................................. 4(3) Minimize Costs of Inventory ............................................................... 5(4) Order Efficiently .................................................................................. 7
Economic Order Quantity ............................................................... 7Inventory Reorder Point ................................................................. 9Automated Inventory Systems ....................................................... 11Vendors/suppliers ........................................................................... 11
(5) Understand Pricing, Markup, and Margin Concepts .......................... 11(6) Track Inventory Performance ............................................................. 12
Inventory Turnover Ratio ................................................................ 12Inventory Management Index.. ........................................................ 13
(7) Make Physical Inventory Counts ........................................................ 15(8) Handle Inventory Like Dollars ............................................................ 15
Inventory Shrinkage ....................................................................... 15Warehousing .................................................................................. 16
Proper Warehousing Techniques ......................................... 16(9) Merchandise and Promote ................................................................. 16
Store Layout and Inventory Display ............................................ 16Showroom Layout and Display Techniques ......................... 17Signs .................................................................................... 17Color and Lighting ................................................................ 18
Product Promotion ...................................................................... 18(10) Coordinate Inventory Between Multiple Branches ........................... 18Summary ................................................................................................. 18
Strategic Considerations .............................................................................. 19Competitive Forces and Current Strategy ............................................... 19Is the Cooperative Completely in the Business? ..................................... 19Differentiate as a Cooperative.. ................................................................ 19Specialization Among Multiple Branches ................................................ 20
Conclusion . . . . . . . . . . . . . . . . . . . . . . . . . . . . . . . . . . . . . . . . . . . . . . . . . . . . . . . . . . . . . . . . . . . . . . . . . . . . . . . . . . . . . . . . . . . . . . . . . . . . 20
References . . . . . . . . . . . . . . . . . . . . . . . . . . . . . . . . . . . . . . . . . . . . . . . . . . . . . . . . . . . . . . . . . . . . . . . . . . . . . . . . . . . . . . . . . . . . . . . . . . . 21. . .III

Highlights
Incorporating a well-organized inventory management plan will increasethe probability of achieving effective results in managing the required inventoryinvestment. Fundamental strategies should be implemented in a plan to reachthe cooperative’s clearly defined goals.
Strategies for an effective inventory management plan include:(1) Attain proper inventory mix-provide the goods and services that
members (patrons) demand, the market reveals, contribute financially to thecooperative, and coincide with the cooperative’s defined strategic direction.
(2) Maintain efficient inventory levels-minimize the costs of having too lit-tle or too much inventory. Types of merchandise have different efficient levels,so understand them and work to attain the “correct” levels.
(3) Minimize costs of inventory-make sure that all employees know thecosts associated with maintaining (or not maintaining) inventory. Balance thecost of being out of stock with the cost of maintaining inventory at the leasttotal inventory cost.
(4) Order efficiently-balance the higher ordering costs associated withmore frequent orders with the higher inventory maintenance costs associatedwith less frequent orders; use tools-economic order quantity, inventoryreorder point, automated inventory systems, wholesale supplier programs, etc.
(5) Understand pricing, markup, and margin concepts-make sure that allemployees involved with the functions of selling merchandise understand theformulas and basic principles of price, markup, and margin.
(6) Analyze inventory performance-examine the cooperative’s financialperformance relative to inventory. Analyze data and determine sales, grossmargins, inventory turnover, and inventory management index.
(7) Make physical inventory counts-carry out a count and report regularly.(8) Handle inventory like dollars-carefully handle inventory. Work to
decrease shrinkage and follow correct handling procedures.(9) Merchandise and promote-take pride in the merchandising of inven-
tory (display, showroom, warehouse) and develop product promotion pro-grams.
(10) Coordinate inventory among multiple branches-coordinate both pur-chases and sales among the different store and warehouse locations of thecooperative.
As part of the inventory plan, cooperatives need to regularly assess theeffectiveness of their overall inventory strategy design. The resulting implica-tions of employing their current inventory management strategies relative toserving members and achieving the cooperative’s financial goals must be eval-uated, given competitor presence and strategic behavior.
Build an inventory management plan-broad inventory management andspecific performance goals should be developed and strategies employed toreach the goals. All cooperative employees involved with inventory mustunderstand the plan, the components within it, and their responsibilities. Planfeedback is critical-goals and strategies must be monitored and then modifiedto achieve expected results.
V

Inventory Management Strategiesfor Local Farm Supply Cooperatives
James J. Wadsworth
In farm supply cooperatives, as in all retailestablishments, inventory designates merchandisecarried for sale. Merchandise includes the physicalitems being moved from their primary source (thewholesale supplier) to their final destination (themember/patron).
Farm supply cooperatives serve their mem-bers/patrons by continuously buying and sellingmerchandise. The cooperatives derive their princi-pal income from the sale of that merchandise.
The typical farm supply cooperative has alarge investment in inventory. Data from a sampleof U.S. cooperatives (table 1) indicate that the aver-age local farm supply cooperative had $521,000invested in inventory at year end 1990. This invest-ment made up a significant proportion of the sam-ple cooperatives’ assets-about 49 percent of cur-rent assets and 25 percent of total assets. As withother assets, farm supply cooperatives must strivefor high returns on their inventory investments.
Cooperative managers must take inventorymanagement seriously. The ability they demon-strate in managing inventory often translates intobusiness success or failure. Inventory managementinvolves constant decisionmaking that in turnrequires astute planning. Planning for effective
inventory management involves understandingbasic inventory management concepts and strate-gies and implementing them in an organized man-ner to reach defined goals.
This report addresses strategies and conceptsrelated to the inventory management decisionmak-ing process. It provides information to help man-agers and employees prepare a plan for their coop-eratives.
PLANNING FOR EFFECTIVE INVENTORYMANAGEMENT
Like most management functions, effectiveinventory management does not just happen-ittakes a lot of work. This can be simplified by takingan organized planning approach. Planninginvolves defining inventory management goals andincorporating strategies to meet those goals.
Figure 1 shows what an inventory manage-ment plan might entail for farm supply coopera-tives. This plan involves defining a mission, broadgoals and specific performance goals, implement-ing an array of inventory management strategies,and monitoring the plans (feedback).
The mission of effective inventory manage-
Table l--Selected financial data from sample of U.S. local farm supply cooperatives, 1990’Variable Mean Minimum Maximum Standard Deviation
Inventory $520,773 $8,558 $4,435,349 $548,630
Inventory/current assets 49.4% 14.9% 81.3% 14%
Inventory/total assets 25.2% 5.4% 57.7% 9%
1 Source: U.S. Department of Agriculture, ACS farmer cooperative supplies and services data base. Number of cooperatives in sample = 139.See appendix table 1 for more data on U.S. local farm supply cooperatives.
1

ment is defined in the top box of the diagram.Broad goals are listed below the mission statement:service-to members (patrons) by providing mer-chandise that meets their needs and demands; effi-ciency-of inventory operations; cost contain-ment-of costs associated with maintaininginventory; and competitiveness-with pricing andproducts. These broad goals, essentially providingthe definition of effective inventory management infarm supply cooperatives, define specific perfor-mance goals, and incorporate strategies to meet thegoals.
Management must define specific perfor-mance goals-in line with broader goals-relatedto inventory management. Figure 1 shows exam-ples of specific performance goals: sales goals-rel-ative to the cooperative’s budget, set specific tar-gets for gross sales of merchandise; capitalinvestment goal-prescribe upper and lower limitsfor dollar inventory investment; gross margingoals-specify targets for gross margins attainedon different classes of inventory and for inventoryoverall; turnover-seek to reach specific levels (i.e.,past performance levels, industry averages, etc.) ofturnover relative to inventory type and gross mar-gin percent; and management index-strive toachieve high inventory management indexes (i.e.,past performance levels, industry averages, etc.).
Once specific performance goals are in place,upper management and line personnel should takeresponsibility for implementing specific strategiesand concepts.
Ten inventory management strategies are list-ed in the bottom box in figure 1. (Their numberscorrespond to those in the text.) These fundamentalstrategies need to be well understood so they canbe effectively implemented. There is an inherentneed for strategy cohesion during their implemen-tation. In other words, strategies should be imple-mented within an organized framework because nosingle strategy can achieve all the goals of effectiveinventory management.
Strategies listed in figure 1 are:(1) attain proper inventory mix;(2) maintain efficient inventory levels;(3) minimize costs of inventory;
(4) order efficiently;(5) understand pricing, markup, and margin con-cep ts;(6) track inventory performance;(7) make physical inventory counts;(8) handle inventory like dollars;(9) merchandise and promote; and(10) coordinate inventory between multiplebranches.
The feedback loop included in figure 1 indi-cates the need for assessing whether strategies areachieving the cooperative’s goals. As in all strategicplanning, feedback is critical to a plan’s success.Plan initiators, developers, and implementors needto periodically assess goals and strategies. If goalsare not correctly identified and strategies don’tachieve desired results, modifications must bemade to get the plan working correctly.
INVENTORY MANAGEMENT STRATEGIES
The ten strategies listed earlier are explainedin this section. Examples are included where possi-ble to help clarify explanations and the conceptsassociated with the strategies.
(1) Attain Proper Inventory Mix
A good inventory mix is paramount to effec-tive inventory management. For farm supply coop-erative operations, inventory mix is maintainingthe types of merchandise and providing relatedservices that best serve the needs of patrons. Anumber of factors relate to a good inventory mix-the cooperative’s strategic direction, needs anddemands of patrons, financial performance, andmarket trends.
The cooperative’s inventory mix reflects thestrategic direction being followed. In other words,the types of inventory handled indicate what acooperative is to its members and where it is going.
Cooperative management must continuallyanalyze inventory to gauge whether it is consistentwith the cooperative’s intended strategic direction.Does the inventory mix indicate the direction thecooperative wishes to go? Do all inventory items
2

Figure l- Planning Inventory Management
MissionEffective inventory management
I
Broad GoalsServiceEfficiencyCost containmentCompetitiveness
Performance GoalsSalesCapital investmentGross marginsTurnoverManagement index
Strategies(1) attain proper inventory mix;(2) maintain efficient inventory levels;(3) minimize costs of inventory;(4) order efficiently;(5) understand pricing, markup, and margin concepts;(6) track inventory performance;(7) make physical inventory counts;(8) handle inventory like dollars;(9) merchandise and promote; and(IO) coordinate inventory between multiple branches.
Achieving goals?If not, examine/modifystrategies and/or goals
3

have an adequate market demand, or are someobsolete and unprofitable? Inventory in lowdemand and not reflecting strategic directionshould be removed and such products or servicesdiscontinued.
Needs of patrons must be understood andanticipated, either by using a formalinterview/survey approach or by frequently visit-ing with them. Management will then be able tobetter plan inventory to meet their needs. In specialcircumstances-when members are active patronsfor some products and services and want theircooperative to maintain inventories of infrequentlydemanded products-high cost elements of aninventory mix can be a part of a strategic planwhen its total costs are fully explained to the entiremembership.
Financial analysis (e.g., sales and margin sta-tistics) of merchandise provides a record of pastperformance and is a key factor in determining aninventory mix and evaluating a cooperative’sstrategic direction.
For instance, what are the sales and margindollars for particular merchandise items and class-es of inventory and what products or classes con-tribute the most margin dollars to the operation?
This type of analysis identifies the types ofinventory contributing most to the cooperative’sfinancial viability. Knowledge of these statistics andthe trends they show help determine what inven-tory to carry and what to promote more heavily.
Trends and unexpected events in a coopera-tive’s environment must be factored into the inven-tory mix. For this reason, regular market outlookmust include a review of what competitors aredoing-what their products are, services they offer,etc. Regular market outlook allows management tokeep inventory mix current-to make adjustmentssuch as increasing or decreasing certain merchan-dise lines, and eliminating or creating lines.
(2) Maintain Efficient Inventory Levels
Inventory mix involves strategic planning todefine the type of cooperative members want,while inventory levels involve operating decisions
to achieve efficiency and cost control. Inventorylevels vary by product or service. Some merchan-dise requires high inventory levels while othersrequire lower levels. The required inventory levelis tied to the demand for the merchandise. An effi-cient level minimizes the costs of having too littleor too much inventory. A balance must be main-tained. Inventory level can be affected by productpromotions, supplier performance, and deliverylogistics.
For cooperatives, maintaining efficient inven-tory levels can pose a dilemma. As a service tomembers, cooperatives may not only include infre-quent demand items in their inventory mix, but alsomaintain some popular products at higher levels toreduce the risk of depleting the stock. While thispractice may be desirable to members, they mustunderstand the costs associated with maintaininghigher inventories and their adverse affect on prof-itability. Again, such decisions that entail highercosts must be made within an explicit strategic plan.
Inventory Level by Type of Inventory There arethree types of inventories: fast turnover, slowturnover, and seasonal. Fast turnover productsshould be stocked at high levels, slow turnoverinventory should be stocked at low levels, andseasonal inventory should be stocked at levels thatwill enable the cooperative to meet demand but notbe left with excess inventory at the end of theseason.
Inventories of popular merchandise must bewell stocked to meet patron demand. Examples offast turnover products include animal feed, clean-ing supplies, petroleum products, etc. The strategyis to maintain levels dependent on supplier anddelivery logistics, sales history, and promotionalactivities.
Slow turnover inventories have low or unbal-anced demand. Products are often large ticketitems such as farm machinery, livestock equipment,household appliances, etc. The strategy is to main-tain inventory levels dependent on demonstratedneed, sales history, and promotions. Membersshould be encouraged to order this merchandise inadvance to keep inventory costs low.
4

Seasonal inventories are determined by a fixedperiod when products are in high demand. Whenthat season arrives, patrons usually won’t wait forthis merchandise because of their immediate opera-tional needs related to the planting or harvestingseason. The strategy is to build supplies in anticipa-tion of the season; encourage pre-orders by patronsand maintain a suitable inventory; supply productsknown to be needed, and assess inventory levelbased on past sales and perceived demand.
(3) Minimize Costs of Inventory
Inventory is costly. There are order and main-tenance or holding costs associated with inventory.Costs include transportation, ordering, and physi-cally placing merchandise in storage. Maintenanceor holding costs include finance, storage, fire insur-ance, property taxes, and obsolescence (damageand deterioration). There is also an opportunitycost-the return that capital resources could earn ifinvested elsewhere-associated with the capitalresources tied up in inventory.
Table 2 provides estimates on the value ofinventory associated with maintenance costs. As ageneral rule of thumb, these costs range from 20 to30 percent of the value of a cooperative’s inventoryannually. The cost of capital used for inventoryranges from 8 to 12 percent while obsolescencecosts range from 4 to 6 percent. Deterioration anddamage is also a major cost. Estimates range from 4to 5 percent of inventory value.
Table 2- Inventory maintenance cost breakdownType of Cost Percent of Inventory Value
TransportationHandlingStorage facilitiesInsuranceTaxesObsolescenceDeterioration/damageCost of capital
112-l2 - 3
112-l
112-l1/2-l4 - 64 - 58 - 1 2
While these are costs of doing business-hold-ing merchandise to turn into receivables-inven-tory level has a direct bearing on how high or lowthese costs will be.
The major cost of an inventory level that is toohigh is inefficient use of capital. For example, if thecost of capital is 8 percent, each $1,000 of excessinventory has the effect of reducing net income by$80. Excess inventory reduces asset turnover, inturn reducing return on assets.
Carrying costs such as insurance, taxes, depre-ciation, and overhead (e.g., utilities, rent, andadministration) increase with excess inventory.Obsolescence and shrinkage costs also increase dueto spoilage, damage, and disappearance.
There are also difficult to measure costs due toinsufficient inventory:
l Sales lost from depleted stock. The loss ingross margins is the volume lost multiplied timesthe gross margin usually attained from the sale ofthe item.
. Cost of losing disgruntled patrons (whohave also purchased other merchandise).
*Cost of acquiring a poor service image.Some tangible costs associated with low
inventory levels include special delivery and pick-up costs to satisfy patrons, added order costs, andtime lost by employees.
Many wholesale suppliers offer booking orincentive programs to cooperatives that ofteninclude reduced wholesale prices for volume pur-chases. These programs must be carefully ana-lyzed. If the merchandise isn’t likely to be soldquickly, then it’s probably not an advantage to pur-chase in large quantities.
With inventory maintenance costs averaging20 and 30 percent of inventory value per year, thebenefit derived from volume discounts quicklydiminishes if sales are relatively slow. Volume dis-counts are only beneficial if the merchandise is inrelatively high demand and can be sold quickly sothat additional inventory maintenance costs areless than the discount.
Example l-Purchase of merchandise at adiscount. This illustrates the effect maintenance
Total cost 2 0 - 3 0
5

costs have on margins when merchandise is pur-chased at a discount but remains in inventorybecause of slow sales. The normal cost of the mer-chandise is $5,000 ($10 per unit, thus 500 units) buta 10 percent discount lowers the cost by $500 to$4,500 ($9 unit cost). Maintenance costs are estimat-ed at 20 percent of the wholesale inventory valueper year (1.66 percent per month).
The cooperative sells 25 units per month andeach unit retails for $12. Table 3 shows the impactof maintenance costs that accrue at 1.67 percent permonth on the value of inventory not sold. Becausesales are relatively slow at 25 units per month, theentire inventory volume is not sold in 12 months.Relatively high maintenance costs reduce marginssubstantially in the early months and have less ofan impact in later months.
Inventory maintenance costs accrue to more
than $500 by month 9 and thus eliminates all of thediscount gained on the volume purchase. At thissales level and margin opportunity, this coopera-tive would have had better results if it had orderedthis merchandise on a monthly basis (e.g., 30 unitsor so a month), even at the higher $10 cost per unit.
Cooperatives need to carefully analyze vol-ume incentive programs offered by suppliers. Ifsales, margins, and the discount are relatively highon a particular type of merchandise volume dis-count purchases can be of significant benefit. Thesepurchases can provide extra margin and lessen therisk of running low on stock. But managementmust calculate maintenance costs to ensure thattheir levels do not counter the net positive effectassociated with this strategy.
Cooperatives must balance the cost of main-taining inventory with the cost of being out of
Table 3- Purchase of merchandise at discount, example 1 I
Monthly Monthlyinventory sales sales
Time Units value (units) (6)
Monthly Accruedmaint. maint.cost costs
Accruedmargindollars
Accruedmarginafter maint.costs
Month 1
Month 2
Month 3
Month 4
Month 5
Month 6
Month 7
Month 8
Month 9
Month 10
Month 11
Month 12
500 $4,500 25
475 $4,275 25
450 $4,050 25
425 $3,825 25
400 $3,600 25
375 $3,375 25
350 $3,150 25
325 $2,925 25
300 $2,700 25
275 $2,475 25
250 $2,250 25
225 $2,025 25
$300
$300
$300
$300
$300
$300
$300
$300
$300
$300
$300
$300
$71
$68
$64
$60
$56
$53
$49
$45
$41
$38
$34
$30
$71
$139
$203
$263
$319
$371
$420
$465
$506
$544
$578
$608
$75
$150
$225
$300
$375
$450
$525
$600
$675
$750
$825
$900
$4
$11
$23
$38
$56
$79
$105
$135
$169
$206
$248
$293
1 Assumptions for example 1:Total units purchased = 500.Normal cost = $10 per unit = $5,000 total.Discount = 10 percent = $500 total discount.Discounted cost = 55,000 - 5500 = $4,500 total discounted cost.Retail price = $12 per unit.Sales per month = 25 units.Gross margin percent per unit = 25 percent.Maintenance cost percent = 20 percent per year or 1.67 percent per month.* Maintenance cost = inventory value ($4,500) less value of sales times monthly maintenance cost (1.66 percent).
6

stock to achieve minimum total inventory cost. Outof stock costs decrease as inventory level increases,but maintenance costs increase and vice versa.
(4) Order Efficiently
Ordering is a major part of inventory manage-ment. Efficient ordering keeps inventory levels atcorrect levels. Inventory should be purchased in anorganized manner. Inventory levels and quantitiesdemanded must be carefully monitored. Selectedindividuals should be responsible for orderinginventory. Cooperatives with a broad line of mer-chandise may select individuals to be responsiblefor different classes of inventory.
There are two major variable costs associatedwith ordering a quantity of inventory: (a) the orderprocessing cost and (b) the cost of maintaining theinventory.
A cooperative might place a few large quanti-ty orders each year or many small ones based oncertain factors. Placing a few orders will lowerorder processing costs, but increase inventorymaintenance costs because the average inventorylevel will be large. Placing many orders willincrease order processing costs, but lower inven-tory maintenance costs because the average inven-tory level will be small. The next example showshow order processing and maintenance costs varyby order size for a highly demanded item.
Example 2-Costs associated with different ordersizes. A cooperative sells 100 tons of hog feed a yearin 50 pound bags (4,000 units). The order process-ing cost is $6, the wholesale price per bag is $6, andthe annual inventory maintenance cost is 20 per-cent of the wholesale inventory value. Table 4shows that as order size increases, the annual costof ordering decreases while the inventory mainte-nance cost increases, and vice versa. The 200-unitorder quantity provides for the least total annualcosts ($240). The 175- and 225-unit quantities are inthe general vicinity ($242 total annual costs).
This example shows that the best order strate-gy balances the higher ordering costs associatedwith more frequent orders with those associatedwith less frequent orders.
Figure 2 graphically illustrates inventorycosts. The total cost curve is the sum of the mainte-nance and ordering costs at various inventoryquantity levels. The cost of maintaining inventoryincreases steadily as order quantity increases whileordering costs decrease. The minimum point on thetotal cost curve is where the cost of maintaininginventory equals the cost of ordering inventory.This is the goal to seek when ordering particularmerchandise items. This quantity is commonlyknown as the economic order quantity (EOQ).
Economic Order Quantity EOQ is a usefulinventory management concept for finding the
Table 4-Costs associated with different order sizes, example 2 lOrder size (quantity) 50 loo 150 175 200 225 250 300 400 500
Average inventory 2 5 5 0 75 87 .5 100 112.5 125 150 2 0 0 250
Number of times to order 8 0 4 0 2 7 2 3 2 0 18 16 13 10 8
Annual ordering costs $480 $240 $160 $137 $120 $107 $96 $ 8 0 $60 $48
Annual maintenance cost $ 3 0 $ 6 0 $90 $105 $120 $135 $150 $180 $240 $300
Total annual costs $510 $300 $250 $242 $240 $242 $246 $260 $300 $348
1 Assumptions for example 2:4,000 units sold per year, wholesale value $6 per unit.Order cost $6 per order.Maintenance cost is 20 percent of inventory value ($1.20 per unit).Annual ordering cost = $6 x number of orders.Annual maintenance cost = $1.20 per unit x average inventory.
7

Figure 2- Basic Cost Curves of InventoryManagement
Total costs
Order quantity EOQ
EOQ = economic order quantity: minimum total costquantity
efficient quantity of select inventory items to order.The EOQ quantity corresponds with the minimumtotal inventory cost (ordering and maintenancecosts are equal). The concept is most adaptable tomerchandise regularly in high demand (fastturnover). Using this tool requires knowing howmuch of an item is needed during a given period(usually a year), the cost of processing an order,maintaining inventory, and the per-unit price.
Some fundamental mechanics must be fol-lowed to successfully meet these requirements:
l Keep accurate inventory figures.l Record sale rates of individual items that
account for seasonal variations and ranges of unex-pected variations in sales (i.e., management shouldanalyze within year trends, year to year trends, 3-to-5 year moving averages, etc.).
. Record costs associated with processingorders, purchase prices, and maintaining inventory.
The EQQ minimizes total costs calculated by
knowing the units of merchandise needed during agiven period, the cost of processing an order, theper-unit purchase price of merchandise, and theannual cost of maintaining the inventory.
This tool determines the amount of inventoryto order, but to be pragmatic, managers should usethe derived quantity to determine the order range.Using a range around the optimal point usuallywill not significantly increase total costs.
The economic order quantity is calculatedusing this formula:
Economic order quantity (EOQ) = 2 x u x cPxMC
where:U = units of merchandise needed during period,C = cost of processing an order (employee time,
paperwork, phone calls, etc.),P = price per unit of merchandise being pur-
chased, andMC = annual inventory maintenance cost as a per-
cent of annual inventory value.
These two examples provide an analysis ofEOQ for a high- and a low-demand item.
Example 3-EOQ of high-demand merchandise.Using the same merchandise example as in exam-ple 2, the EOQ is calculated for a cooperative’ssales of bagged hog feed:
U = units of feed= 4,000 units (200,000 lbs. + 50 lbs./bag),
C = cost of processing order = $6,P = price per unit
= $6,MC = annual maintenance cost (inventory value)
= 20 percent.
(EOQJ = 2x4,000x66 x .2
= +@Z= 200 units
For the lowest total cost, the cooperative shouldorder 200 units 20 times (4,000 units + 200 units) ayear (corresponds to the fifth column of table 4from example 2).

Example 4-EOQ of low-demand merchandise. Acooperative sells 50 electric fence control units ayear. The per-unit price is $100 (the processing andmaintenance costs same as above). The economicorder quantity would be:
U = 50 unitsc = $5P = $100MC = 20 percent
CEOQ) = 2x50~5100 x .2
= $Z = 5 units
The cooperative should make 10 orders of 5 fencecontroller units each during the year.
inventory Reorder Point Another tool is theInventory Reorder Point (IRP). This conceptrequires setting a safety stock level of inventory,knowing the lead time it takes to deliver an order,and knowing how many units (average) of an itemare sold,during a given time period (usually a day).To use this concept, cooperative management must:
l Establish a safety stock level for individualitems. This is the lowest acceptable level thatinventory should reach by the time the next ship-ment arrives. This level allows the cooperative tomeet patron needs during periods of unusuallyhigh demand.
l For individual items determine the “ordertime” between the date the order is placed andexpected delivery. Add the safety stock level to theamount of inventory required during the lead time.Here’s the formula:
Reorder point = safe level + required invent0 y
Required inventory is calculated by multiply-ing the order time in days by the average sales perday.
Example 5-1RP. This example also usesbagged hog feed. The cooperative has average salesof about 13 units a day (4,000 units + an assumed310 business days a year), sets a safety stock level
of 10 units, and has an order lead time of 3 days forbagged feed. The EOQ is 200 units (see examples 2and 3). The inventory required for the 3 days leadtime is 39 units (13 units/day x 3 days) so the IRPis 49 units (39 units required + 10 units safety stocklevel). Thus, the cooperative would order 200 unitswhen inventory level drops to 49 units (aboutevery 11 to 12 days).
An IRP is calculated by determining a safetystock level and an accurate estimate of order time.The safety stock level is a sufficient inventory tocover the maximum expected sales of inventorybetween the order and delivery. The order or leadtime is the period between ordering and inventoryarrival. To ensure enough inventory is available tocover sales during this period, it is critical to haveprior knowledge of order time. Past experience anduse of accurate sales and delivery data usually pro-vide accurate data on safety stock levels and ordertime.
Figure 3 illustrates inventory management ofmerchandise with stable demand. This inventoryfrequently turns so a constant quantity of 350 units(the EOQ) is ordered at regular intervals. This iscommonly referred to as the fixed order quantitymethod. Figure 3 illustrates that the EOQ of 350units is ordered when the IRP of 150 units isreached. Under this scenario, the time periodbetween orders is the same. During the lo-dayorder time, sales continue at the rate of 10 units perday, thus a total of 100 units. Inventory reaches thesafety level of 50 units before the new merchandiseis received. The 350-unit order brings the level ofinventory back up to 400 units.
Figure 4 illustrates inventory management ofmerchandise that has varied demand-slowturnover. Order timing depends on when theinventory reaches the reorder point.
In the first two trend lines, strong demandcauses a rapid depletion of inventory stock afterorders are made at the reorder point. The third lineshows that the order Q2 does not bring the inven-tory level above the reorder point, making it neces-sary to reorder Q3 at the same time inventory Q2 isreceived.
The lower demand indicated by the third
9

Figure 3- Inventory Level Management Given Stable Demand
Quantity of inventory ordered
500
400
150
50
0
Maximuminventory level
P--------------I____
Safetv level__-_L-----*
’ 6-r ’ I n-r ’
1 0 2 0 3 0 4 0 5 0 6 0 7 0 8 0 9 0 1 0 0 1 1 0 1 2 0 1 3 0 1 4 0Time in days
Ql , Q2, Q3, and Q4 = quantity ordered = 350 units when inventory level drops to 150 units.OT = order time = 10 days.Thick line denotes inventory level.
Figure A Inventory Level Management Given Unbalanced Demand
Quantity of inventory ordered Maximum inventorv level
Time
IAT-I - + - -f -)~=l+----- T ~~1
OT = order time.T = time between orders.
10

trend line allows inventory level to recoup wellabove the reorder point only to have demand dra-matically increase. In this scenario, the timebetween orders varies depending on the rate ofsales. Sales of this merchandise are not predictable,so the safety level may or may not be reached.
Automated Inventory Systems Automatedinventory systems aid in their systematic control.Through computerized systems (e.g., point ofsale-POS), cooperatives can track sales ofmerchandise on an individual item basis as well asby inventory class. Perpetual inventory
Vendors/Suppliers L o c a l f a r m s u p p l ycooperatives purchase inventory from vendors.Often, local cooperatives are members of a regionalcooperative from whom they purchase most oftheir inventory. In this case, the regional is the localcooperative’s primary supplier. Most regionalsrequire their locals to purchase a significantamount of inventory. On the other hand, someindependent locals develop their own suppliersystem, purchasing their inventory from manyvendors.
Cooperative managers must work to developrelationships with vendors that result in efficientinventory purchasing. For farm supply locals thatare members of regionals, management shouldwork for special deals when purchasing a signifi-cant volume of a given type of inventory throughthe regional.
When the marketplace creates a situation
where a local is having difficulty competing on cer-tain goods or services, the manager should ask theregional for help in alleviating the problem.
For inventory that locals purchase from ven-dors or suppliers other than regionals, local man-agement must shop for a supplier that can give thecooperative the best deal. This is a continuouseffort because suppliers often change their prod-ucts and pricing relative to the circumstances oftheir own competitive market.
The inventory ordering process for farm sup-ply cooperatives often entails attending productpromotion meetings and information conferencesconducted by specific wholesale suppliers, andparticipating in early order conventions wheremany supplier-vendors promote their products,offer order incentives, and book deliveries forfuture dates.
Such programs can be an extremely importantaspect of inventory management. Solid productpromotion and market information programs givemanagers insight into expected future sales andprovide important education on how to successful-ly promote products for greater sales.
Most farm supply cooperatives use an earlybooking strategy for high-demand farm supplies.This involves the use of special programs to urgepatrons to pre-order supplies in advance of whenneeded.
This strategy affords cooperatives the abilityto order inventory contingent on what they knowthey will sell. Cooperatives can take advantage ofspecial programs (early order and bulk discountincentives) presented by wholesale suppliers (ven-dors).
(5) Understand Pricing, Mark-up, and MarginConcepts
Employees must fully understand the pricing,
mis-
11

takes will likely increase and inventory costs willincrease.
Markup is the percentage amount (or actualamount) above cost that merchandise price isincreased for retail sale. The percentage is calculat-ed on a cost basis. Gross margin is the differencebetween retail price and purchase price. Percentgross margin is calculated on a retail price basis.The formulas for calculating the percentages formarkup and gross margin are:
Markup = price - costcost x 100
Gross margin = price -
Example 6-Markup and gross margin.
price of $50 - c o s t o f $ 3 5cost of $35
= $15- x 100 = 42.86%$35
Gross margin price of $50 - cost of $35=cost of $50
$15= - x 100 = 30.00%$50
When merchandise is readied for sale, someitems are priced via market dynamics-ompetitivepressures. Other merchandise is priced based onthe gross margin management wants to attain. Thedesired margin is added to purchase price to setthe retail price. If a certain gross margin percent isneeded, the following formula is used to deriveretail price.
Retail price = cost(1 x 100%) - gross margin (percent)
Example 7-Retail price calculation. A coopera-tive purchases an item at wholesale for $10 andwants a 25-percent gross margin. The retail pricewould be $13.33, calculated by:
Retail price = cost of $10(1 x 100%) - gross margin of 25%
= $10 x 100 = $13.3375
Because $13.33 is an unusual number for theprice of an item, the price would be rounded to$13.29 or $13.39.
(6) Track Inventory Performance
Management must analyze and track thecooperative’s financial performance as it relates toinventory. The analysis should examine data rela-tive to inventory turnover rate, gross margins, andsales. These ratios should be regularly analyzedand tracked in total and by inventory class. Thissection provides information and examples onsome important concepts that should be includedin routine inventory performance examinations.
lnvenfory Turnover Ratio The turnover ratioindicates the liquidity of inventory. It tracks therapidity with which inventory is turned over intoreceivables through sales during the accountingperiod. This ratio is calculated by dividing cost ofgoods sold by average inventory:
Znven tory turnover ratio = cost of goods soldaverage inventory
Average inventory = beginning + ending inventory2
As earlier indicated, types of inventory turn atdifferent rates. Some turn manv times and others
12

only a few times. The turnover ratio aids in inven- Inventory Management Index The inventorytory management. It should be routinely calculated management index measures profitability. Itfor classes of inventory, individual items, and for analyzes inventory turnover related to grossall inventory combined. margin.
Turnover ratios should be judged in relationto past and expected future ratios of the coopera-tive and against ratios of other cooperatives (orfarm supply businesses), and available industryaverages. But be careful when comparing inventoryturnover ratios to industry averages.
The inventory management index relates theturnover of inventory with the gross margin returnthe inventory generates. It is calculated by multi-plying the inventory turnover ratio by gross mar-gin percent. The formula is:
Departures from industry averages do notalways indicate a business is doing especially wellor badly. A high inventory turnover ratio could notonly indicate efficient inventory management, butalso a serious inventory shortage and inefficientmanagement. In many instances, low inventorylevels translate into sales losses.
Inventory management index =
On the other hand, a low ratio implies a largeinvestment in inventories relative to the amountneeded to service sales. This indicates excess inven-tories that tie up capital resources and increasemaintenance costs. Performance has been adverselyaffected.
This index is simple to analyze-the higherthe resulting index, the better inventory manage-ment. Cooperatives should strive for an index of1.0 that usually yields profitable results. For exam-ple, if the gross margin of a class of inventory is 25percent, that inventory should be turned over fourtimes during the year to achieve an index of one(.25 x 4 = 1).
Table 5 provides some inventory turnoverguidelines for product categories commonly car-ried by farm supply cooperatives. Some inventorycategories turnover only a few times while othersturnover more often. A turnover ratio of 7 to 10times is a common guideline for total inventory,
Example 8--Inventory management index. Thisexample calculates the inventory managementindex for an inventory class-hardware. Datainclude:
The average inventory turnover ratio for U.S.local farm supply cooperatives was 7.68 in 1990,according to data in appendix table 1 (same sampleof cooperatives discussed earlier in table 1). In fourdifferent size groupings established by sales vol-ume, the inventory turnover ratio averagedbetween 6.84 and 8.10.
. hardware sales = $25,000l beginning inventory = $4,000. purchases during year = $20,000. ending inventory = $5,000. cost of goods sold = $4,000 + $20,000 - $5,000
= $19,000. average inventory = ($4,000 + $5,000) + 2
= $4,500. gross margin = $25,000 - $19,000
= $6,000
PetroleumHardwareFeedFertilizerTires/batteries/autoMiscellaneous itemsOverall
7-lOtimes2 - 3 times
lo-12times2 - 3 times3 - 4 times7-lOtimes7-lOtimes
. gross margin percent = $6,000 + 25,000= 24 percent
Using these data, the inventory turnover ratiois $19,000 (cost of goods sold) + $4,500 (averageinventory) = 4.2 times and the inventory manage-ment index is 4.2 (inventory turnover) x .24 (grossmargin percent) = 1.01.
This example shows that hardware inventoryis relatively well managed. The turnover ratio isabove the guideline for hardware of 2 to 3 times
13

(table 5) and the inventory management index ismore than one.
Turnover and management index calculationsshould be made regularly on all classes of inven-tory, the cooperative overall, and on individualinventory items. Some classes or types of inventorywill have relatively high indexes while others willhave low ones. This is normal. Some classes or
types will essentially subsidize other parts of theinventory. Strive for an overall high index for totalinventory.
The average U.S. local farm supply coopera-tive in 1990 had an inventory management index of1.37 (table 6). The average gross margin was 18 per-cent and operating margin was 2.7 percent. Basedon this data, the average cooperative managed its
Table 6-Selected financial data from sample of U.S. local farm supply coopeyatives, 1990’Variable Mean Minimum Maximum Standard Deviation
inventory turnover ratio 7.68 2.63 21.46 3.62
Gross margin 18.2% 6.3% 30.7% 3.9%
Inventory management index 1.37 0.45 4.67 0.67
Operating income/sales 2.7% -4.9% 8.6% 2.7%1 Source: U.S. Department of Agriculture, ACS farmer cooperative supplies and services data base. Number of cooperatives in sample = 139.See appendix table 1 for more data on U.S. local farm supply cooperatives.2 Inventory turnover ratio = average inventory + cost of goods sold; average inventory = (beginning inventory + ending inventory) + 2.3 Inventory management index = inventory turnover x gross margin percent.
Table 7-Financial data of a mid-size local farm supply cooperative, example 9Inventory classification
Farm GeneralTotal SuDDlies’ Merchandise* Feed Seed Fertilizer Chemicals
Net salesBeginning inventoryPurchasesEnding inventoryCost of goods soldGross marginAverage inventoryTotal assetsOperating expensesNet incomePerformance measures:Inventory turnover3
Gross margin/net salesManagement index4Return on assets5
Inv./total asset@
$14,820,000
1,540,000
12,380,OOO
1,720,OOO
12,200,000
2,670,OOO
1,620,OOO
8,370,OOO
1,720,OOO
950,000
7.53
18.02%
1.36
11.35%
20.55%
$1,830,000 $2,850,000
370,000 770,000
1,520,OOO 2,210,000
430,000 800,000
1,460,OOO 2,180,OOO
380,000 680,000
400,000 780,000
3.65 2.79
20.77% 23.86%
0.76 0.67
$5,920,000 $1,060,000 $2,300,000 $860,000
180,000 80,000 50,000 90,000
5,130,000 830,000 1,930,000 760,000
230,000 90,000 40,000 130,000
5,080,OOO 820,000 1,940,000 720,000
850,000 250,000 370,000 140,000
210,000 80,000 40,000 110,000
24.19 10.25 48.50 6.55
14.36% 23.58% 16.09% 16.28%
3.47 2.42 7.80 1.07
1 Farm supplies refers to general farm supply merchandise not included in other categories (e.g., cleansers, animal medicine, small farmequipment, fencing, etc.).* General merchandise refers to hardware, lawn and garden, clothing, appliances, etc.3 Inventory turnover = cost of goods sold + average inventory; average inventory = (beginning inventory + ending inventory) + 2.4 Management index = inventory turnover x gross margin percent.5 Return on assets = net income + total assets.s Year-end inventory figure used in calculation.
14

inventories relatively well as suggested by themanagement index over one and relatively prof-itable, as suggested by the operating margin of 2.7percent. (See appendix table 1 for these same fig-ures categorized by cooperative size.)
Example 9-Inventory performance analysis.Table 7 illustrates the type of analysis farm supplycooperatives should regularly conduct to assesstheir performance of operations as related to inven-tory. This table shows an example analysis of acooperative with total merchandise sales of $14.8million. The analysis table includes merchandisesales, beginning and ending inventory, purchases,cost of goods sold, gross margins, total assets,operating expenses, and various measures relatedto the operational and inventory performance. Thetable provides total figures and some breakdownby inventory classification-farm supplies, generalmerchandise, feed, seed, fertilizer, and chemicals.
For the year, the average inventory was $1.6million for the cooperative in table 7. Total inven-tory turnover was 7.5. By merchandise class,turnover fluctuated from 2.8 for general merchan-dise to 48.5 for fertilizer (the general merchandiseratio is relatively low, but all other inventory cate-gories fall within or exceed the turnover guidelinesspecified in table 5). The cooperative’s overallinventory management index was 1.36.
Like the inventory turnover ratio, the manage-ment index fluctuated among the merchandiseclasses, from 0.67 for general merchandise to 7.8 forfertilizer. Other measures include gross margin tonet sales of 18 percent, return on assets of 11.4 per-cent, and inventory to total assets of 20.6 percent.
Regularly conducting an analysis like this(preferably monthly but at least annually) permitsmanagement to identify problem areas and makeadjustments for more effective inventory manage-ment.
(7) Make Physical Inventory Counts
Making physical inventory counts is a basicbut critical inventory management procedure.Regular counts control pilferage, decrease the
potential for excess and redundant inventory, keepinventory insurance premiums at correct levels,and provide information on the cooperative’s stor-age conditions. Counts also identify specific short-age and problem areas so management can thentake corrective measures.
Procedures for effective physical inventorycounts include:
. count on a regularly scheduled basis;0 count accurately;l count in a coordinated, organized manner;l count using easily understood inventory
forms; andl report physical levels accurately for account-
ing and insurance purposes.All employees involved in the process must
recognize the importance of taking a physicalinventory and procedures to follow.
(8) Handle Merchandise Like Dollars
Inventory is a major portion of current assets.They are short-term funds the cooperative hasinvested to earn returns. Therefore, inventories arecomparable to actual dollars and should be han-dled as such. When merchandise is stolen or dam-aged due to improper handling, money is lost.Types of shrinkage and methods for handling mer-chandise should be well understood. Proceduresshould be followed to minimize losses.
lnwentory Shrinkage Inventory shrinkage is aproblem in retail business. Sound inventorymanagement techniques can counter the problem.Shrinkage occurs from merchandise deterioration,damage, and pilferage (both internal or external).Inventory on the books that cannot be solddiminishes turnover and reduces inventorymanagement efficiency. Poor inventory handlingand poor control practices contribute to shrinkage.A number of strategies help control deteriorationand damage:
l rotate inventory-first in, first out;l carefully load and unload inventory and
check invoices and dock receipts;
15

. control pests and maintain equipment andfacilities;
. store inventory in an organized and safemanner; and
. handle inventory carefully.Here are strategies that help guard against pil-
ferage:. take a physical inventory count regularly;l organize warehouse inventory so patron
activity can be monitored;. stock high-value merchandise away from
doors (warehouse and showroom);. maintain inventory at efficient levels;. check patron warehouse docking slips care-
fully;. complete periodic management checks on
incoming inventory against packing slips or receiv-ing invoices;
. organize showroom to allow for full visibili-ty of patrons; and
. use perpetual inventory system or someother automated system that continually accountsfor inventory received and sold.
Warehousing Follow correct inventorywarehousing procedures. Most inventory damageand deterioration occurs in the warehouse. Poorhandling and sloppy organization and storage ofinventory contribute to losses. Warehouseinventory must be stored in an organized,systematic, and efficient manner. Proper handlingand storage help protect against damage, makeinventory more readily available for sale, aid inloading delivery trucks and patron vehicles, andhelp in taking physical counts. Patrons often walkthrough the warehouse, so it is important that theysee a clean inventory environment wheremerchandise is well organized, well kept, andhandled with respect and care.
Proper Warehousing Techniques-* Stack inventory (pallets, boxes, etc.) in neat
rows with sufficient aisle space between rows.. Store inventory in an organized manner.. Rotate inventory so first-arrived product is
sold first.
. Handle products carefully to avoid damage.
. Repair damaged merchandise immediately(e.g., tape a torn bag of fertilizer).
. Keep warehouse clean and inventory cor-rectly placed.
. Monitor loading slips closely so the correctamount of merchandise is given to patrons.
. Check dock receipts against incoming inven-tory to ensure that the right types and amounts ofmerchandise are received.
Personnel should be acquainted with ware-house techniques and understand costs associatedwith techniques that lead to inventory damage-improper rotation, poor storage methods, and inac-curate receiving, counting, and distribution ofinventory. Provide incentives to warehouse person-nel to reduce inventory shrinkage and ensure thatproper warehouse techniques are followed.
(9) Merchandise and Promote
Merchandising showroom inventory is alsoimportant. Well-displayed products enhance sales.Show merchandise relative to the type of merchan-dise carried, promote specific products, and con-sider the size and layout of the showroom. Soundmerchandising practices contribute to more effec-tive inventory management by decreasing inven-tory damage, theft, and loss, making it easier tofind and order inventory (control), and makingpatrons want to own displayed merchandise.
Store Layout and inventory Display Storelayout and inventory displays can boost sales.Effective merchandise displays can turn “justlooking” shoppers into buyers.
To achieve the most productivity from thestore, arrange merchandise in an organized man-ner. Departmentalization-breaking the showroominto specific departments based on type of mer-chandise-effectively organizes inventory, both foruse of space and satisfaction of patrons.
Vary display techniques. Displays should be amixture of both gondolas (shelving units) and floordisplays. Wall displays are suited to particularproducts-long-handled tools and hanging items.
16

Due to the small size of most showrooms comparedwith the size and scope of products carried, it helpsto place large-ticket items (e.g., lawn tractors) in acentralized floor display. Gondolas are best forsmall merchandise that can be separated into com-partments or shelved separately.
Housekeeping is fundamental to properinventory merchandising and promotion. Dustymerchandise, faded labels, and shopworn itemsdetract from sales. Keep showroom aisles clear,lights properly working, and the floors and win-dows clean for shoppers’ convenience and safety.Make regular checks to replace misplaced merchan-dise. Keep bin and wall hanging merchandise cor-rectly sorted.
Showroom Layout and Display Techniques-A number of techniques should be used for
effective showroom layout and merchandise dis-play:
l Carefully arrange merchandise. Plan place-ment so patrons get maximum exposure to themerchandise displayed during their normal move-ments in the showroom. Strategically place specialadvertised displays. For example, put seasonalclearance merchandise in the back of the show-room. Keep sale items in their usual place and usesigns to direct patrons to those areas. Shelf signshelp patrons locate products.
l Departmentalize. Create separate depart-ments for like categories of inventory. For instance,manyfarm supply retail operations include depart-ments such as hardware and hand tools, house-wares, clothing, crop and livestock inputs, pet sup-plies, power equipment, fencing, and seasonalmerchandise. Related items are more likely to sellin quantity when displayed near each other.
l Use open spaces. Create open areas to dis-play floor and bulk merchandise. It allows storepersonnel to spot patrons who might need help,reduces pilferage, allows for effective display ofcertain inventory items, and makes the showroomlook larger and more attractive. Gondolas shouldbe placed on the sides or back of the showroom.The center showroom areas should be left open forfloor and bulk displays. Avoid using unusually
high gondolas because they obscure the view ofpatrons, invite pilferage, darken inventory, andgenerally are unattractive. For openness, gondolaheight should be restricted to about 4 feet.
. Use store fixtures. This includes using com-partmentalized shelving on gondolas, separatingbulk loose commodities into separate containers inneat arrangements, using platforms for floor dis-plays of bulk and big ticket items, and displayingpromotional items on end caps.
. Limit the number of displays. Patrons oftenbuy nothing if given too much to choose from.
. Allowing patrons to handle some productsincreases their will to own them.
. Change displays regularly, especially specialsale displays usually included on end caps.
. Create special holiday displays-Christmas,New Year’s Day, Easter, July 4th, Mother’s Day,Father’s Day, graduation, etc.
. Keep inventory clean and up-to-date.Regularly check expiration dates on inventory suchas animal health products.
Signs-Signs increase sales. Signs should tell a story
and highlight the price of merchandise.Information on signs should be short and specific,describing only the major attributes of the product.Signs also should indicate sale items.
The use of signs can enliven a showroom, butshould not distract from merchandise presenta-tions. They should subtly draw attention andenhance the display with additional product infor-mation.
Signs should indicate if items are on clearance,advertised items, or special buys. Signs should also bedeveloped as follows.
. Include price on signs. Pricing is often moreeffective when odd cents or multiples on clearanceor special buy items are used-two for $9.98 seemsless costly than $5 each.
l Limit the number of signs. Too many signsare worse than none. Sign clutter weakens commu-nication.
l Display major signs at about the same levelthroughout the store (especially department signs).
17

l Use signs on all end caps (tables, etc.) dis-playing seasonal or promotional products. Signsshould provide a brief description of items andtheir price. When an end cap has multiple prod-ucts, a single sign should separately list individualitems and their price.
Color and Lighting-Two important merchandising techniques
often overlooked involve color and lighting. Colorcan help sell products. If the walls of a showroomare painted, the colors should make the store interi-or a showcase for every product carried. Forinstance, a light shade on walls and ceilings createsan illusion of spaciousness. Darker colors helpcamouflage objectionable areas (if there are somethat can’t be corrected). Use of color on certainproduct displays helps draw attention to merchan-dise. Color should be used for promoting sale itemsand for making attractive displays of seasonal orspecial merchandise.
Correct lighting is also essential. If possible,the showroom should not be uniformly illuminat-ed. Lighting should be varied to attract attention tospecific items and areas. Spotlights or colored light-ing on special displays attract extra attention. Butavoid being too extreme with lighting because toomuch bright lighting may cause eye discomfort.
Product Promotion A part of inventorymanagement that can’t be overlooked is productpromotion. Advertising regular merchandise andspecial sales items are effective methods for sellingmerchandise faster than it would normally move.Use of advertising and holding sales are a must.
(10) Coordinate Inventory BetweenMultiple Branches
Coordination of inventory between multiplebranches of the cooperative is a typical problem. Ittakes full coordination of all inventory functions toeffectively manage it. Strong coordination andcommunication among branches must include boththe purchase and sale of inventory and associatedservices. When one branch is low on a particular
product and another has plenty in stock, merchan-dise can be quickly transferred. There is no needfor one branch to reorder products when anotherbranch has them.
That practice results in inefficient inventorymanagement and higher inventory maintenanceand order costs for the entire cooperative. Thesame sale would have been made had the inven-tory been transferred instead of reordered.However, different branches of the cooperativeoften compete with one another on sales.Competition can be healthy because it providesincentive for branch employees to work harder.But, it must never conflict with the ultimate inven-tory goal of the cooperative-overall effectiveinventory management.
Summary
The inventory management plan (figure 1)defines a mission, sets broad goals, defines specificperformance goals, implements strategies to reachgoals, and includes a feedback loop to measureresults. Specific strategies (concepts) make up thecrux of the plan. Ten are described.
In summary, cooperatives must continuallywork to: (1) attain the correct inventory mix for thecooperative’s members and patrons; (2) maintainefficient levels of inventory according to sales andmember (patron) demand; (3) minimize the costs ofinventory; (4) use organized and efficient methodsfor ordering inventory; (5) ensure that all employ-ees with direct contact with inventory or inventorypaperwork understand pricing, markup, and mar-gin concepts; (6) frequently analyze inventory andrelated financial statistics and conduct periodicphysical counts on inventory; (7) handle inventorymerchandise like the actual dollars it represents; (8)merchandise the showroom and warehouse effec-tively and develop product promotion programs;and (10) coordinate inventory between variousbranches of the cooperative.
These interrelated strategies should be imple-mented as a system. For instance, attaining the cor-rect inventory mix and maintaining efficient inven-tory levels are linked to minimizing costs
18

associated with maintaining inventory, orderingefficiently, tracking inventory performance, andmaking physical inventory counts. These strategiesform a solid foundation of an inventory manage-ment plan.
STRATEGIC CONSIDERATIONS
Local farm supply cooperatives need to fullyassess the consequences of using particular inven-tory management strategies to serve members.Members’ view and understanding on the role oftheir cooperative will often place pressure oninventory strategies. Many members expect theircooperative to always have what they need andwhen they need it.
However, competitors’ strategic behavior canmake this expectation unrealistic and costly.Cooperatives often need to alter their inventorystrategies or develop.alternative strategies inresponse to the competitive and financial conse-quences that result from their current plan.
Competitive Forces and Current Strategy
Cooperatives face competitive pressure fromother businesses. Often, farm supply cooperativesfind themselves providing a market yardstick forthe other businesses in their market environment.
In other words, proprietary firms within acooperative’s market will often tailor their inven-tory management strategies (e.g., prices, productlines, and inventory levels) to the cooperative’sstrategies. Cooperatives must be aware of theircompetitors’ inventory management strategies andbe prepared to change their inventory managementplan if necessary.
Faced with a large chain competitor, the coop-erative will likely experience some negative conse-quences if it continues following all of itsemployed inventory management strategies.
Strategies must be assessed as to their effec-tiveness, given the change in competitive environ-ment. This involves evaluating the cooperative’sinventory mix and pricing and promotion strate-gies. Large chain competitors are often able to sell
certain items as cheaply as local cooperatives canpurchase them from their suppliers.
Cooperatives facing these circumstances mustcarefully evaluate their product lines and pricingpractices and make the necessary changes to coun-teract any competitive pressures. Cooperativesmust differentiate themselves from the chain(s) toretain patrons and sales volume.
Is the Cooperative Completely in theBusiness?
If competitor proprietary stores (or othercooperatives) know that a cooperative carries onlycertain items of an inventory line, they can gain acompetitive advantage by carrying the completeline.
The cooperative’s strategic response to this sit-uation should be either to carry and promote acomprehensive inventory line of a specific mer-chandise type or not to carry that line at all. Thecooperative must demonstrate that it is seriously inthe business of selling the particular merchandiseline and fully intends to serve members (patrons)in that regard. Carrying odds and ends of a widearray of merchandise items to meet the randomneeds of select members is inefficient and says thecooperative is not seriously interested in meetingthe needs of other patrons who regularly demandthe entire line of such merchandise.
Differentiate as a Cooperative
Perhaps the best strategy that a cooperativecan use in response to competition is to promote itscooperative identity. This attribute, alone, differen-tiates the cooperative from proprietary firms.Cooperative identity must not only be promoted tomembers and farmer patrons but to other patronsas well. Patrons who are neither farmers nor mem-bers often enjoy the fact that a farm supply cooper-ative is a “farm” store owned by farmer members.
Promoting the farm store and cooperativemessage is particularly fitting when the coopera-tive is in an urban area. Constant attention andeducation are needed to get the full impact of coop-
19

erative differentiation. The concept must be contin-ually promoted in newspapers, flyers, radio, usingoutside and in-store signs, etc. People need to beconstantly reminded that the business is a coopera-tive farm store that provides a wide variety ofneeded merchandise lines and services.
Specialization Among Multiple Branches Afarm supply cooperative with multiple branches inclose proximity may benefit by specializing incertain product lines at different locations. Forexample, a cooperative may handle huntingsupplies at each branch but find poor sales at allbut one location.
Under this scenario, the cooperative wouldbenefit by consolidating all hunting supplies at thelocation of greatest demand. With suitable promo-tion, members and patrons would know where togo for hunting supplies and be ensured of an ade-quate choice and supply of merchandise and assis-tance from a more knowledgeable sales staff.
Product specialization among multiplebranches is an inventory management strategy. Itspotential success hinges on the type of merchan-dise in question and the logistics of supplying var-ied locations. This strategy can benefit cooperativesin certain instances but should be used only aftercareful evaluation of its implications.
CONCLUSION
Many cooperative managers tend to rely onsubjective judgement for inventory managementrather than incorporate an array of specific goalsand strategies in an explicit plan. While judgementhoned from experience is in itself an effectiveinventory management tool, management of thecooperative’s inventory can be enhanced throughthe use of a plan.
Steps to follow include stating a mission,defining broad and specific performance goals,developing and implementing inventory manage-ment strategies, measuring results, and examiningand modifying strategies and/or goals as needed(figure 5). Inherent in plan development is the dele-gation of employee responsibility to carry it out.
Figure 5 - Steps to Planning InventoryManagement
2. Define broad goals
3. Define specific performance goals
4. Develop and implement strategies
5. Measure results-feedback
6. Examine/modify strategies, goals?(Strategic considerations)
An inventory management plan can help coopera-tives.
Once a plan is in place, cooperatives need toregularly assess the effectiveness of their overallinventory strategy design and counteract possiblenegative financial and competitive consequences.The implications that result from using inventorymanagement strategies relative to serving membersand achieving financial goals must be evaluated,given competitor presence and strategic behavior.
Cooperative managers may have developedtheir own inventory management strategies and/orfound others in textbooks and other literature.Concepts in this report can serve as a checklist toidentify features or components of an inventorymanagement system that are lacking or may needimprovement. The key task is to build an organizedframework for working with inventory that fitswithin the cooperative’s operations and providesfor effective inventory management.
20

REFERENCES
Beard, Larry H., Al L. Hargraves, and Fred A.Jacobs. “Managing Inventories in a SmallBusiness,” Business Journal, April 1983.
Brooks, Bruce L. “Inventory Management andControl in Agricultural Marketing and SupplyBusinesses,” University of Illinois at Urbana-Champaign, College of Agriculture, CooperativeExtension Service Circular 1063,1972.
Garrison, Ray H. Managerial Accounting, ThirdEdition, Business Publications, Inc.: Plano, Texas,1982.
Grablowsky, B.J. “Financial Management ofInventory,” Journal of Small Business Management,July 1984.
21
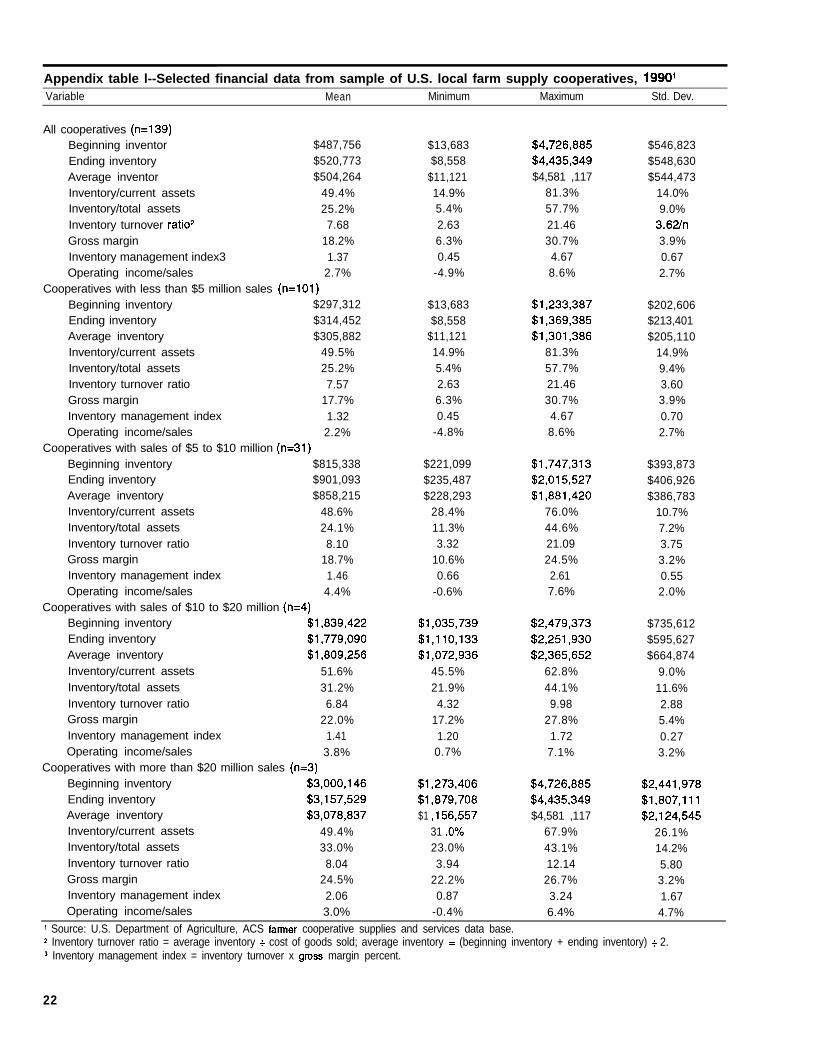
Appendix table l--Selected financial data from sample of U.S. local farm supply cooperatives, 199OlVariable Mean Minimum Maximum Std. Dev.
All cooperatives (n=139)Beginning inventor $487,756Ending inventory $520,773Average inventor $504,264Inventory/current assets 49.4%Inventory/total assets 25.2%Inventory turnover ratio2 7.68Gross margin 18.2%Inventory management index3 1.37Operating income/sales 2.7%
Cooperatives with less than $5 million sales (n=lOl)Beginning inventory $297,312Ending inventory $314,452Average inventory $305,882Inventory/current assets 49.5%Inventory/total assets 25.2%Inventory turnover ratio 7.57Gross margin 17.7%Inventory management index 1.32Operating income/sales 2.2%
Cooperatives with sales of $5 to $10 million (n=31)Beginning inventory $815,338Ending inventory $901,093Average inventory $858,215Inventory/current assets 48.6%Inventory/total assets 24.1%Inventory turnover ratio 8.10Gross margin 18.7%Inventory management index 1.46Operating income/sales 4.4%
Cooperatives with sales of $10 to $20 million (n=4)Beginning inventory $1,839,422Ending inventory $1,779,090Average inventory $1,809,256Inventory/current assets 51.6%Inventory/total assets 31.2%Inventory turnover ratio 6.84Gross margin 22.0%Inventory management index 1.41Operating income/sales 3.8%
Cooperatives with more than $20 million sales (n=3)Beginning inventory $3,000,146Ending inventory $3,157,529Average inventory $3,078,837Inventory/current assets 49.4%Inventory/total assets 33.0%Inventory turnover ratio 8.04Gross margin 24.5%Inventory management index 2.06Operating income/sales 3.0%
$13,683 $4,726,885$8,558 $4,435,349
$11,121 $4,581 ,11714.9% 81.3%5.4% 57.7%2.63 21.466.3% 30.7%0.45 4.67
-4.9% 8.6%
$13,683$8,558
$11,12114.9%5.4%2.636.3%0.45
-4.8%
$1,233,387$1,369,385$1,301,386
81.3%57.7%21.4630.7%4.678.6%
$221,099$235,487$228,293
28.4%11.3%3.32
10.6%0.66
-0.6%
$1,747,313$2,015,527$1,881,420
76.0%44.6%21.0924.5%2.617.6%
$1,035,739$1,110,133$1,072,936
45.5%21.9%4.32
17.2%1.200.7%
$2,479,373$2,251,930$2,365,652
62.8%44.1%9.98
27.8%1.727.1%
$1,273,406$1,879,708$1 ,156,557
31 .O%23.0%3.94
22.2%0.87
-0.4%
$4,726,885$4,435,349$4,581 ,117
67.9%43.1%12.1426.7%3.246.4%
$546,823$548,630$544,473
14.0%9.0%
3.62/n3.9%0.672.7%
$202,606$213,401$205,110
14.9%9.4%3.603.9%0.702.7%
$393,873$406,926$386,783
10.7%7.2%3.753.2%0.552.0%
$735,612$595,627$664,874
9.0%11.6%2.885.4%0.273.2%
$2,441,978$1,807,111$2,124,545
26.1%14.2%5.803.2%1.674.7%
1 Source: U.S. Department of Agriculture, ACS farmer cooperative supplies and services data base.* Inventory turnover ratio = average inventory + cost of goods sold; average inventory = (beginning inventory + ending inventory) + 2.3 Inventory management index = inventory turnover x gross margin percent.
22

U.S. Department of AgricultureRural Development Administration
Cooperative ServicesAg Box 3200
Washington, DC. 20250-3200
RDA Cooperative Services provides research, management, and educational assistanceto cooperatives to strengthen the economic position of farmers and other rural residents.It works directly with cooperative leaders and Federal and State agencies to improveorganization, leadership, and operation of cooperatives and to give guidance to furtherdevelopment.
Cooperative Services (1 ) helps farmers and other rural residents develop cooperativesto obtain supplies and services at lower cost and to get better prices for products theysell; (2) advises rural residents on developing existing resources through cooperativeaction to enhance rural living; (3) helps cooperatives improve services and operatingefficiency; (4) informs members, directors, employees, and the public on howcooperatives work and benefit their members and their communities; and (5)encourages international cooperative programs.
Cooperative Services publishes research and educational materials and issues FarmerCooperatives magazine. The United States Department of Agriculture (USDA) prohibitsdiscrimination in its programs on the basis of race, color, national origin, sex, religion,age, disability, political beliefs and marital or familial status. (Not all prohibited basesapply to all programs). Persons with disabilities who require alternative means forcommunication of program information (braille, large print, audiotape, etc.) shouldcontact the USDA Office of Communications at (202),720-7808 (TDD).
To file a complaint, write the Secretary of Agriculture, U.S. Department of Agriculture,Washington, D.C. 20250, or call (202) 720-7327 (voice) or (202) 720-l 127 (TDD). USDAis an equal employment opportunity employer.
ti U.S. GOVERNMENT PRINTING OFFICE: 1994 300-111/00132