inventory control in closed loop supply chain using system dynamics
TRANSCRIPT

8/2/2019 Inventory Control in Closed Loop Supply Chain Using System Dynamics
http://slidepdf.com/reader/full/inventory-control-in-closed-loop-supply-chain-using-system-dynamics 1/33
Inventory Control in Closed Loop Supply Chain using System
Dynamics
Roberto Poles
RMIT University, School of Business Information Technology239 Bourke Street, Melbourne Vic 3000, Australia
Tel. [email protected]
France Cheong
RMIT University, School of Business Information Technology239 Bourke Street, Melbourne Vic 3000, Australia
Tel. [email protected]
Abstract
Inventory control is a fundamental activity in closed loop supply chains, particularly for
remanufacturing processes. Several models have been developed in the literature where
the aim is mostly to optimize cost or profit and to find the optimal order quantity for an
integrated production and remanufacturing system. In this study, we explore a System
Dynamics approach in order to model an inventory control system for a
remanufacturing process in the context of a Closed Loop Supply Chain. Specifically, thereturn process is modelled using several factors which influence relationships within
the process. The factors considered are residence time of the product with customer,
service agreement with customer and customer behaviour in returning used products.
The findings suggest that a reduction of residence time and an increase in the level of
service agreement with customers, which in turn increases customer behaviour in
returning used product, can lead to efficiency in inventory management for companies
involved in the remanufacturing process. In addition, we provide two simple case
studies to support these findings.
Key words: System Dynamics, Inventory Control, Remanufacturing, Closed Loop
Supply Chain.
1 Introduction
Many companies have realized that reverse logistics is an important competitive andstrategic part of their business mission. The usage of reverse logistics in the businesssector is increasing not only because of the implementation of more stringentenvironmental regulations, but also because of competitive reasons. The results of asurvey, which involved 1,200 logistics managers and more than 150 managers withreverse logistics responsibilities in the U.S., found that 65% of companies believe thatreturns management is an important strategic tool for their business (Rogers and
Tibben-Lembke, 2001). Generally, returns can be classified into three major areas:

8/2/2019 Inventory Control in Closed Loop Supply Chain Using System Dynamics
http://slidepdf.com/reader/full/inventory-control-in-closed-loop-supply-chain-using-system-dynamics 2/33
manufacturing, distribution and market returns (de Brito, Dekker and Flapper, 2004).The first two areas are related to the process of manufacturing and distribution such asreturns from surplus of raw material and quality control as well as product recalls andB2B commercial returns. The last area concerns users of products and involve
warranties, end of product use and end of life returns. A number of studies describe the role of reverse logistics in economic andenvironmental activities during the product development process. Particularly, severalmodels have been developed to support managerial decision making and to optimizeprocesses in different reverse logistics areas. The scope of these models is mostly tooptimize costs or profit through an analysis of the parameters and variables as definedin the modeling method. However, it becomes evident that a concept differentiationbetween Reverse Logistics and Closed Loop Supply Chain is necessary. The closedloop supply chain concept refers to a possible integration between reverse and forwardsupply chain. Traditional activities such as collection and distribution planning,inventory control and production planning have to be scheduled and planned while also
considering the returns flow.Inventory control requires appropriate control mechanisms to integrate the return flowof used products with the material planning for the forward flow (Fleischmann et al.1997). This can vary for different reverse logistics situations. For example, for somecompanies whose business is recycling, returns are the only inventory resource for theforward production process in which used products or materials are the only rawmaterial. Traditional inventory control methods might be satisfactory in these situations.The mechanism is different for remanufacturing or reuse, where used products arereturned for introduction into the main production stream. In this case, returned goodsare an additional inventory source to the usual inventory procured from outside.Moreover, this additional flow is not directly available to the manufacturer because of the unpredictable quantity, time and quality of products that will be returned from thecustomers. Hence, inventory management is complicated particularly byremanufacturing activities since key information such as on hand inventory, lead timeand yield are not clear in this process (Toktay, Wein and Zenios, 2000). Severalinventory models for the remanufacturing process have been developed where returnsare exogenous variables, without any correlation between sales and returns. Manyauthors use simple assumptions regarding the return process such as homogeneousPoisson Process for demand and/or return flow and returns independent from thedemand (de Brito and Dekker, 2003). Thus, in this paper, we try to avoid suchassumptions through the use of particular factors such as residence time of the product
with customer, service agreements or incentives developed by companies for therecovery of used products and customer behaviour. These factors can affect the returnprocess of used products and influence the uncertainty in the returns flow as they canprovide a forecast method for the quantity and timing of returns.In this paper, we use System Dynamics (SD) (Forrester 1958, 1961), a methodology forstudying and managing complex feedback systems, particularly business and socialsystems, to model an inventory control system for a remanufacturing process in whichproduction is integrated with remanufacturing activity. Our objective is to analyse,through the simulation of the SD model, the trend of the total inventory cost influencedby a returns rate which is affected by the external factors previously mentioned. In orderto model this system, we consider a pull inventory control strategy without considering
disposal of recoverables and lead time. Moreover, we model the returns process where

8/2/2019 Inventory Control in Closed Loop Supply Chain Using System Dynamics
http://slidepdf.com/reader/full/inventory-control-in-closed-loop-supply-chain-using-system-dynamics 3/33
demand and returns are correlated. Uncertainty in timing and quantity of returns isspecifically tackled through relationships of parameters which can provide quantity andtime of return for used products with different product characteristics and in differentindustries. We also present the practical implication of our findings through information
collected by two companies directly involved in reverse logistics and remanufacturingactivity.
2 Literature Review
Remanufacturing systems has been increasingly researched by several authors who havedeveloped several models for different industry contexts. A number of these focus onproduction planning and inventory control for product remanufacturing. The objectiveof inventory management is to control external components orders and the internalcomponent recovery process to guarantee a specific service level and to minimizeinventory costs. Additionally, in the case of remanufacturing, if it may actually becheaper to overhaul a return than to produce or to buy a new one (Fleischmann et al.1997).The review has followed two main streams: (1) inventory control in a remanufacturingcontext and (2) application of SD modeling for remanufacturing systems.
2.1 Inventory control models
An inventory control model was developed in order to compare procurement andinventory control strategies and to determine an optimised approach based on costminimization (van der Laan, Dekker and Salomon, 1996). The scope was to comparedifferent procurement and inventory control strategies in order to find the optimal one,based on the minimal costs, through scenarios in which parameters are varied. A similar
model was analysed in order to find the optimal serviceable inventory level andprocurement order that minimized total inventory/production cost (van der Laan et al.1996). In a different way from the previous two models, a production planning andinventory control system was developed tackling more explicitly the push and pullinventory strategy on remanufacturing and disposal activities (van der Laan andSalomon, 1997). A comparison between the push and pull inventory strategy based onthe optimal total system costs is analyzed in their model. The result shows that pull ispreferred to push strategy if recoverable inventory is lower than serviceable inventory.This is generally because holding costs for serviceable inventory are higher thanrecoverable inventory holding costs and the pull strategy keeps remanufacturable itemsin the recoverable inventory.
The effects of leadtime duration and variability on total cost in an hybrid manufacturingand remanufacturing system is the topic of another inventory control model (van derLaan, Salomon and Dekker, 1999). They used the same model and total system costs of van der Laan and Salomon (1997) but without considering disposal of recoverables as apossible inventory strategy. Through their analysis, it follows that an increase of manufacturing and remanufacturing leadtime leads to an increase of total costs for bothpush and pull inventory strategy. This could be due to a common production operationmanagement theory whereby increasing the leadtime, without changing the reorderpoint or the order batch, increases the probability of backorder and consequently alarger amount of safety stock can be used. Moreover, the results point out that for suchinventory systems pull is favoured over push strategy as it lowers serviceable inventoryholding costs. This is the case for systems where the serviceable inventory holding cost
8/2/2019 Inventory Control in Closed Loop Supply Chain Using System Dynamics
http://slidepdf.com/reader/full/inventory-control-in-closed-loop-supply-chain-using-system-dynamics 4/33
is larger than the recoverable inventory holding cost, the leadtime is consideredstochastic and the priority is given to remanufacturing as opposed to manufacturing inorder to reduce recoverable inventory holding cost. The same result is valid for systemswith large return rates.
Another research model is also based on the serviceable inventory level (Kiesmuller andMinner, 2003). This study focuses on an inventory model where the serviceableinventory is fed by production and remanufacturing without considering theprocurement and disposal option and without lingering over a push or pull strategy.Through a stochastic product recovery inventory system, the authors developed a modelwith a news vendor type formula approach. The objective was to find the optimalproduce up to level and remanufacture up to level which minimize the total inventorycosts. A similar model was developed in the same period in which it is pursued a similarobjective (Kiesmuller 2003). However, in this case the push and pull policy strategieswere investigated. A recent study on production planning and inventory control inremanufacturing engines for vehicles considers planned lead time as a decision variable
(Tang, Grubbström and Zanoni, 2007). In this case a different approach was taken bythe previous inventory control models, as this study analyses specific remanufacturingactivities such as disassembly and reassembly without considering remanufacturable orserviceable inventory process.Deterministic Economic Order Quantity (EOQ) model is another approach to inventorycontrol system in the remanufacturing context (Teunter 2001). This model considersgeneral policies as an alternation between manufacturing and remanufacturing batches,the presence of disposal with rate variation and different holding cost rates betweenmanufactured and remanufactured items. Following the same topic, a deterministicmodel for an inventory system was developed where the demand is satisfied byrecovered products and newly purchased products (Koh et al. 2002). Particularly, theyuse a joint EOQ and Economic Production Quantity (EPQ) model where, different fromTeunter (2001), one setup/batch for recovery and many orders for new purchasedproducts, or vice versa, are simultaneously considered.
2.2 System Dynamics and remanufacturing
The complexity of reverse logistics processes has motivated several researchers to useSystem Dynamics modelling techniques in the search for better strategies and policiesfor integrating the forward and reverse supply chains. However, there is still a lack of System Dynamics research for closed loop supply chains (Kumar and Yamaoka, 2007).
A System Dynamics simulation tool was developed to analyse the dynamic behaviour
and the influence of the various activities on the reverse logistics network (Georgiadisand Vlachos, 2004a). In particular, the objective of the research was to simulate aremanufacturing feedback loop to determine the effect of remanufacturing capacitiesand penalties on total costs under various scenarios. Penalties refer to an inappropriatecollection and handling of used products imposed on companies by environmentallegislation. It was found that total cost decreases when higher remanufacturingcapacities are reached. In another similar study using System Dynamics (Georgiadis andVlachos, 2004b), the impact of environmental influences and remanufacturing capacityplanning policies were simulated using the reverse logistics system. They analysed theeffects of customer awareness of a company’s green image on product demand and theenvironmental legislation on the collection rate of returns flow. The activities modelled

8/2/2019 Inventory Control in Closed Loop Supply Chain Using System Dynamics
http://slidepdf.com/reader/full/inventory-control-in-closed-loop-supply-chain-using-system-dynamics 5/33
in their systems included: supply, production, distribution, usage, returns collection,inspection, remanufacturing and waste disposal.A remanufacturing system was modelled using SD to study the impact of productlifecycles on planning optimal collection and remanufacturing capacities for several
kinds of products with different lifecycles and return characteristics (Georgiadis,Vlachos and Tagaras, 2006). Two concepts were introduced in the study: residence
time and residence index. Residence time is defined as the time the product stays withthe customer before it is returned while residence index represents the ratio of theaverage residence time over the length of the product lifecycle. The residence indexrepresents the tendency of the product to stay and be used by the customer during itslifecycle. It can be used to classify different products as to their suitability to beremanufactured or not. Their research focused mainly on the effect of the productlifecycle on capacity planning. Thus, our motivation for this present research is that sofar in reverse logistics literature, no study could be found on the effects of returns rateand uncertainty in quantity of returns on total production.
3 Methodological approach
System Dynamics is a computer aided method for analysing and solving complexproblems, particularly on policy analysis and design with several applications includingcorporate planning and policy design, economic behaviour, public management,biological and medical modeling, energy and environment, social science, dynamicdecision making, complex non linear dynamics, software engineering and supply chainmanagement (Angerhofer and Angelides, 2000). A System Dynamics approach as amodeling and simulation method for dynamic industrial management processes couldbe an excellent tool for those management systems in which new decisions have to be
made and new circumstances appear with the passing of time (Coyle 1996).A causal loop diagram (CLD) assists in the understanding of system structure as itidentifies the important factors and variables influencing a system as well as the causalinfluences among these variables. A CLD consists of variables connected by arrowsdenoting the hypotheses and the mental models of the modeller in order to represent thefeedback structure of systems which are responsible for a problem (Sterman 2000).Positive as well as negative feedback interrelationships can be represented throughfeedback or causal loops. The influence between variables is indicated by the + and –signs which show how the dependent variable changes when the independent variablechanges (Sterman 2000).In order to study the quantitative view of the model, a Stock and Flow Diagram (SFD)
is used to represent the process. Through the SFD, it is possible to analyse the dynamiccharacteristics between rate and level variables and define the relationships among thevariables of the model. These relationships are used to establish mathematical equationsin order to run simulations of the model. Coyle (1996) states that while the causal loopdiagram represents a real system through variables connected by signed links, aquantitative model represents the same system using variables in equations.Before starting the simulation of the model, validation and verification processes mustbe performed. The validity for a System Dynamics model defines its capacity to reflectthe structure and behaviour of a real process model. The tests, which are grouped asdirect structure tests and structure oriented behaviour tests, provide a formal andlogical process for model validation (Barlas 1996). Direct structure tests, for which
simulation is not involved, compare each mathematical equation of the model with the

8/2/2019 Inventory Control in Closed Loop Supply Chain Using System Dynamics
http://slidepdf.com/reader/full/inventory-control-in-closed-loop-supply-chain-using-system-dynamics 6/33
available knowledge from a real system. These tests utilise several comparisonsincluding the form of the equations, conceptual or numerical value for modelparameters, value of the output variable applying extreme conditions values to the inputvariables of the equations and finally, dimensional consistency for both side of each
equation. On the other hand, structure oriented behaviour tests or indirect structure testsinvolve simulation of the entire model and they apply structure model validationthrough a quantitative comparison with the real system. Several comparison tests can beapplied such as extreme condition and behaviour sensitivity tests. The first testcompares the model and the real system behaviour under the same extreme values forselected parameters. In a different way, the second test compares the high sensitivity of particular parameters between a model and the real system.In order to support and clarify some of the findings obtained through the simulationsanalysis, the methodological approach of this study involves two simple case studies.These employ data from companies involved in reverse logistics and remanufacturingprocesses. The data were obtained through interviews with company management and
through existing literature. The companies involved were The Australian MobileTelecommunication Association (AMTA) which through the MobileMuster programhas started the official national recycling program of mobile phones, and Fuji XeroxAustralia which is involved in remanufacturing of assemblies and sub assemblies of printers and copiers. The Fuji Xerox interviews were conducted at the EcoManufacturing Centre located in Sydney.
4 Problem and model formulation
Our study is based on a single product remanufacturing system within the context of Closed Loop Supply Chain which involves several operations such as: production,
collection and inspection of used products, remanufacturing and disposal. Our focus inthis study is on the return of products from customers/products users at the end of theiruseful life, other returns such as product recalls and B2B commercial returns areexcluded in the study. Figure 1 shows the remanufacturing process considered in thispaper. The forward supply chain involves production of new products to fulfil customerdemand. After product use, returns are collected, inspected and either stored asremanufacturable/recoverable inventory or disposed of depending on whether thequality of returns is suitable for remanufacturing according to the company’s qualitystandard policy. The serviceable inventory, used to fulfil external demands, is fed by theproduction of new or remanufactured products which are as good as new. Productionand manufacturing are important components of any remanufacturing system. Equally
important to the process is analysis and decision making regarding inventory,operational and marketing activities.

8/2/2019 Inventory Control in Closed Loop Supply Chain Using System Dynamics
http://slidepdf.com/reader/full/inventory-control-in-closed-loop-supply-chain-using-system-dynamics 7/33
Figure 1: Remanufacturing Process
A number of assumptions have been made throughout this analysis in order to simplifythe system and its interpretation:
• Uncontrollable disposal has not been considered: instead of the productreturning to the remanufacturer, it is disposed of in an uncontrolled manner,sometimes opposing the manufacturer’s instructions or environmentalregulations.
• The planned disposal of recoverable inventory has not been considered.
• The capacity of several activities such as collection, remanufacturing and
production are considered infinite.• Backordering and lead times have not been considered.
In the model, the returns rate incorporates uncertainty in quantity and timing of returnsand a pull inventory control system is applied. This system is obtained through re-orderpoint inventory replenishment policies which are basic features of several industries inthe context of supply chain/inventory planning. The returns rate, which is used tocalculate the number of returns after the time of use, is represented as the ratio betweenthe probable returns flow of sold products and the demand. The probable returns flowand the time of use are calculated through the relationship between the main factorswhich characterize the model of this study - return index and residence time. The latter
is the factor defined in the study of Georgiadis, Vlachos and Tagaras (2006).The ways in which companies manage the return process of the products sold to thecustomers, through service agreements and sale contracts with retailers or the customersthemselves, can influence the returns rate and particularly the quantity of returns. Forexample, leasing contracts make sure that almost all products are returned after theresidence time. In the model, the service agreement with customer factor is used inorder to relate the quantity of returns with the demand for different products in differentindustries. Moreover, customer behaviour is another factor which can influence thisrelationship. The attitude of the customer’s return activity and response to company’sreturns process incentives can affect the returns rate and in particular the likelihood of aparticular product to be returned. Hence, the return index is obtained by considering the
relationship between company incentives/service agreements developed in order to

8/2/2019 Inventory Control in Closed Loop Supply Chain Using System Dynamics
http://slidepdf.com/reader/full/inventory-control-in-closed-loop-supply-chain-using-system-dynamics 8/33
8/2/2019 Inventory Control in Closed Loop Supply Chain Using System Dynamics
http://slidepdf.com/reader/full/inventory-control-in-closed-loop-supply-chain-using-system-dynamics 9/33
Collected
Returns collection
+
inspection / failure
-
Disposal
+
+
N1
PERCENTAGE OF
DISPOSAL
+
INSPECTION
TIME
-
Figure 3: Collection loop N1
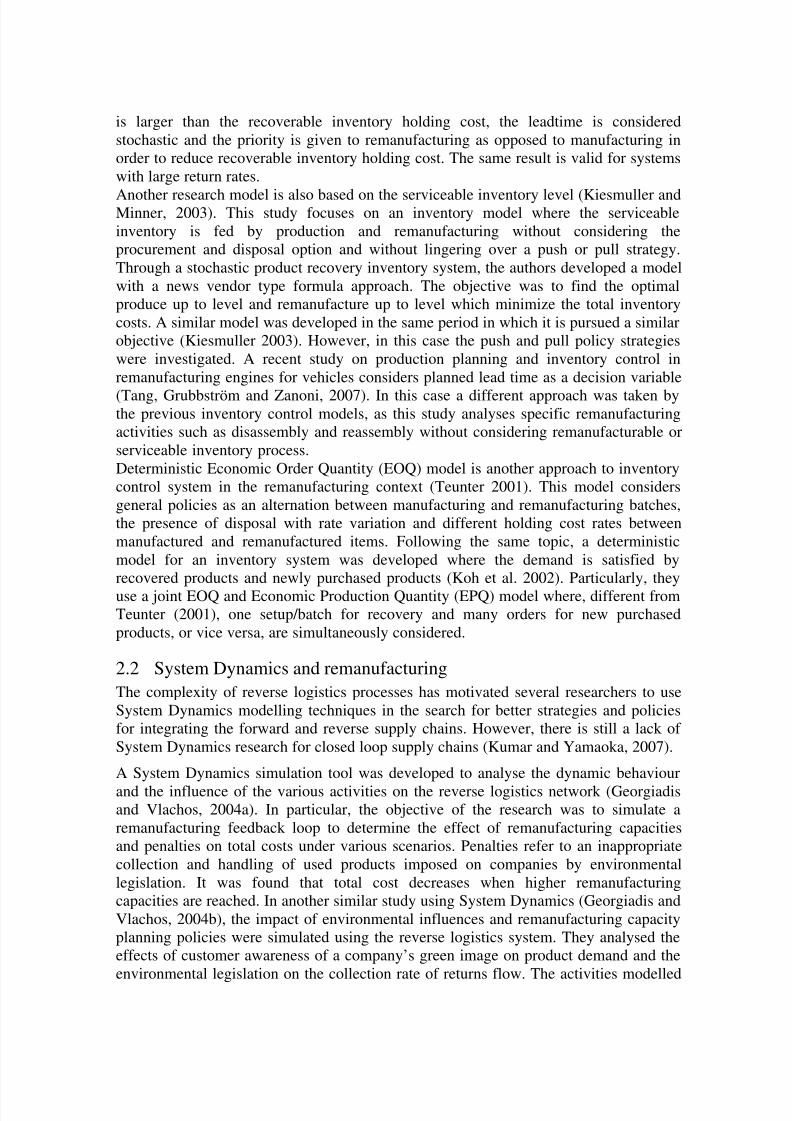
Failed items decrease the level of Collected Returns, through an inspection/failure flowand at the same time increase the level of Disposal which represents the quantity of non-reusable items that are disposed of. The flow rate of failed items depends on thevalue of PERCENTAGE OF DISPOSAL and INSPECTION TIME . The former affects itpositively as its change leads to a similar change in the quantity of failures. Forexample, an increase in the percentage value of disposal leads to an increase in the flowof failed items during the time period. PERCENTAGE OF DISPOSAL represents thequality standards policy of the company and is affected by several parameters andtechniques used to check the returned items. It is defined as an average percentage of collected returns disposed of and differs for different products and different qualitystandard policies used (Vlachos, Georgiadis and Iakovou, 2007). INSPECTION TIME
represents the required period of time to inspect the collected items. This negativelyaffects the inspection flow as a faster/slower inspection leads to an increase/decrease of the flow. Since an increase in Collected Returns causes an increase in inspection/failure and which in turn causes a decrease in Collected Returns, a negative feedback loop (N1)is created.
Recoverable
Inventory
inspection /
acceptance
+
Collected
Returns
-
collection
+
PERCENTAGE OF
DISPOSAL
-
+
N2INSPECTION
TIME
-
Figure 4: Collection loop N2
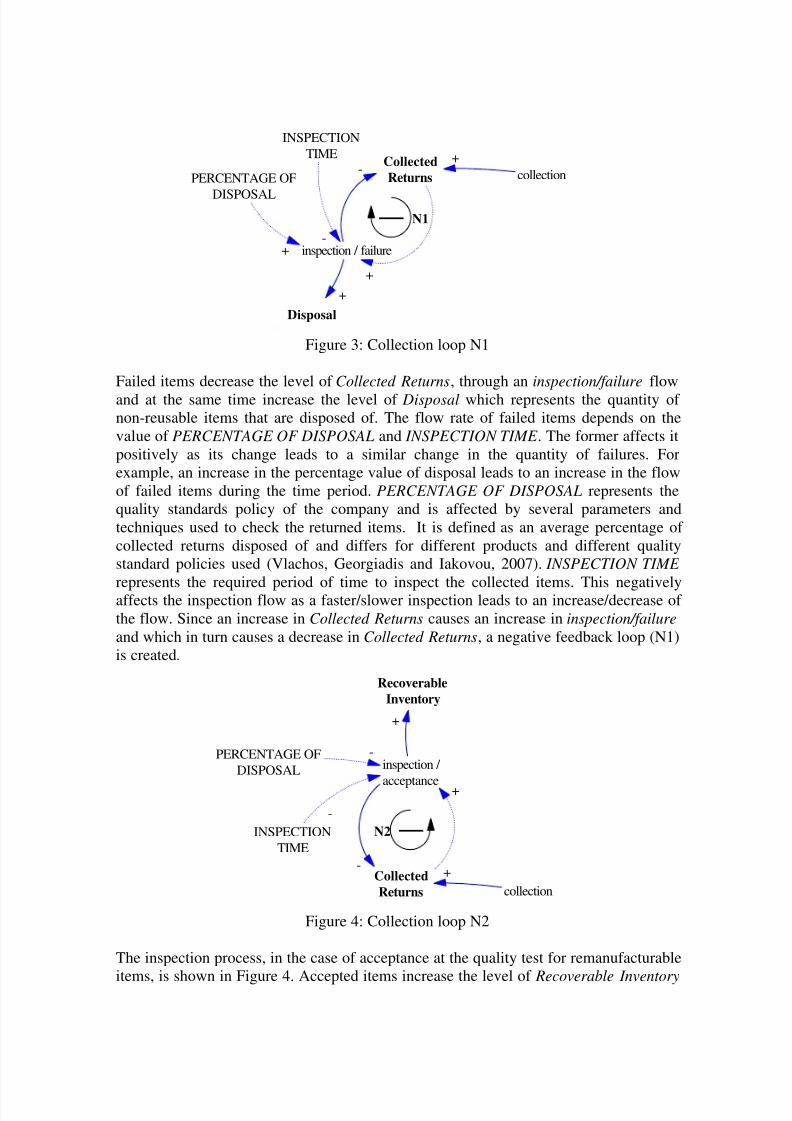
The inspection process, in the case of acceptance at the quality test for remanufacturable
items, is shown in Figure 4. Accepted items increase the level of Recoverable Inventory

8/2/2019 Inventory Control in Closed Loop Supply Chain Using System Dynamics
http://slidepdf.com/reader/full/inventory-control-in-closed-loop-supply-chain-using-system-dynamics 10/33
that are ready to be remanufactured through the inspection/acceptance flow. The flowrate of accepted items depends inversely on the value of PERCENTAGE OF
DISPOSAL, as a lower percentage of disposed items of leads to higher level of remanufacturable items. Thus, an increase in inspection/acceptance rate causes a
decrease in Collected Returns level, which in turn causes a decrease ininspection/acceptance rate, hence forming the negative feedback loop N2.The remanufacturing activity behaviour in the process is represented by two negativefeedback loops, N3 and N4. These are shown in Figure 5.
Serviceable
Inventoryremanufacturing
+Recoverable
Inventory
-
+
N3
LOW LEVEL OFSERVICEABLE FOR
REMANUFACTURING
- -
N4
REMANUFACTURE
UP TO LEVEL
+
REPLENISHMENT
FREQUENCY
-
Figure 5: Remanufacturing loop N3 and N4
Remanufacturable items are stored as Recoverable Inventory from which items are usedfor remanufacturing purposes when necessary and stored as Serviceable Inventory inorder to fulfil customer demand . An increase in the Recoverable Inventory level
increases the remanufacturing rate which in turn decreases the Recoverable Inventory level forming the negative feedback loop N3. Similarly in the negative feedback loopN4, an increase of remanufacturing levels increases the Serviceable Inventory levelwhich in turn decreases the level of remanufacturing activity. Thus, inventory levelshave both positive and negative effects on the remanufacturing rate in order to controlthe flow of remanufacturing items and achieve balance in the inventory system.Moreover, remanufacturing flow is negatively affected by the REPLENISHMENT
FREQUENCY of the inventory. Replenishment frequency represents the time period onwhich is based the replenishment of remanufacturing orders and an increase/decrease of its value generally leads to a decreased/increase of the order size.Remanufacturing occurs when necessary in a pull inventory strategy becauseremanufacturing is preferred to a more expensive production activity. Several models inliterature discuss push and pull inventory strategies in a remanufacturing system(Kiesmuller 2003; van der Laan and Salomon, 1997; van der Laan, Salomon andDekker, 1999). In Figure 5, Sr (REMANUFACTURE UP TO LEVEL) and sr (LOW
LEVEL OF SERVICEABLE FOR REMANUFACTURING) are two variables whichaffect the remanufacturing rate and are used for implementing a pull strategy in thesystem. Sr represents the upper value limit for remanufactured batches while sr represents the lower value for remanufactured batches as well as the level of aServiceable Inventory for which a remanufacturing batch is required. Sr - sr representsthe level of Recoverable Inventory for which it is possible to produce a remanufacturing

8/2/2019 Inventory Control in Closed Loop Supply Chain Using System Dynamics
http://slidepdf.com/reader/full/inventory-control-in-closed-loop-supply-chain-using-system-dynamics 11/33
batch. A more detailed explanation of the inventory pull strategy is given in Figure 6which shows the usage of inventory over time in a remanufacturing system.Figure 6 is similar to van der Laan, Salomon and Dekker’s (1999) who also did notconsider disposal of recoverable inventory. The pull strategy is represented by the
Recoverable Inventory level. When this level exceeds (Sr - sr ) (i.e. the level at which itis possible to make a remanufacturing batch) disposal of items does not occurs.Remanufacturing occurs only when necessary and is represented by sr , the level of Serviceable inventory. This strategy increases the cost of the Recoverable Inventory butreduces the cost of the Serviceable Inventory which is usually more expensive.Remanufacturing is preferred to production, as sm (the Serviceable Inventory level atwhich a production batch is required) is lower than sr .
Figure 6: Usage of inventory in remanufacturing system
Produced items increase the Serviceable Inventory level in order to fulfil customerdemand , as Figure 7 shows. In the system, production is only used to increase theServiceable Inventory level when remanufacturing is below Recoverable Inventory asshown in Figure 6. Two additional variables which affect production flow are used toimplement the pull inventory strategy: Qm (PRODUCTION UP TO LEVEL) is theupper value for production batches and sm ( LOW LEVEL OF SERVICEABLE FOR
PRODUCTION) is the level of serviceable inventory at which a production batch isrequired. However, production flow is mainly affected by Sr and sr , because it is onlywhen the Recoverable Inventory level is lower than Sr - sr and the Serviceable
Inventory level reaches sm that a production batch is manufactured and stored inServiceable Inventory. The negative feedback loop N5 creates a balance between
production flow and Serviceable Inventory level.

8/2/2019 Inventory Control in Closed Loop Supply Chain Using System Dynamics
http://slidepdf.com/reader/full/inventory-control-in-closed-loop-supply-chain-using-system-dynamics 12/33
production
Serviceable
Inventory
+
demand
-
LOW LEVEL OFSERVICEABLE FOR
REMANUFACTURING
-
N5
REMANUFACTUREUP TO LEVEL
PRODUCTION UP
TO LEVEL+
LOW LEVEL OF
SERVICEABLE FORPRODUCTION
-
REPLENISHMENT
FREQUENCY-
Figure 7: Production loop N5
The negative loop N6 involves both the production and remanufacturing flows and boththe Recoverable and Serviceable Inventory level as shown in Figure 8. In thisremanufacturing system a balance among these variables, which involves a controlprocess between inventory levels and flow of items, is required. For example, if thephysical flow of items produced increases, the Serviceable Inventory level increases. Inorder to prevent a continuous accumulation of serviceable items (without consideringdepletion from customer demand), Serviceable Inventory affects negatively theremanufacturing flow which consequently decreases. This leads to an increase of
Recoverable Inventory level and consequently, due to the negative relationship between production and Recoverable Inventory, production flow decreases. In this way thesystem is driven towards a balancing goal.
production
Serviceable
Inventory
+
remanufacturing
Recoverable
Inventory -
-
-
N6
Figure 8: Inventory loop N6
The behaviour of negative feedback loop N7 (Figure 9) is caused mainly by Used
Products and returns as well as several variables representing the influencerelationships between the forward and reverse logistics.
8/2/2019 Inventory Control in Closed Loop Supply Chain Using System Dynamics
http://slidepdf.com/reader/full/inventory-control-in-closed-loop-supply-chain-using-system-dynamics 13/33
Serviceable
Inventory demand
-
collection
Used
Productsdemand inflow
+
returns
-
Returns
Accumulationreturns inflow
+
+
RESIDENCE
TIME
+
N7
RETurns rate
+
+
+return index
+
+
DEMAND
LOOKUP
+
-
RETURN TIME
-
SERVICE
AGREEMENT WITH
CUSTOMER
CUSTOMER
BEHAVIOUR
+
+
Figure 9: Used products loop N7
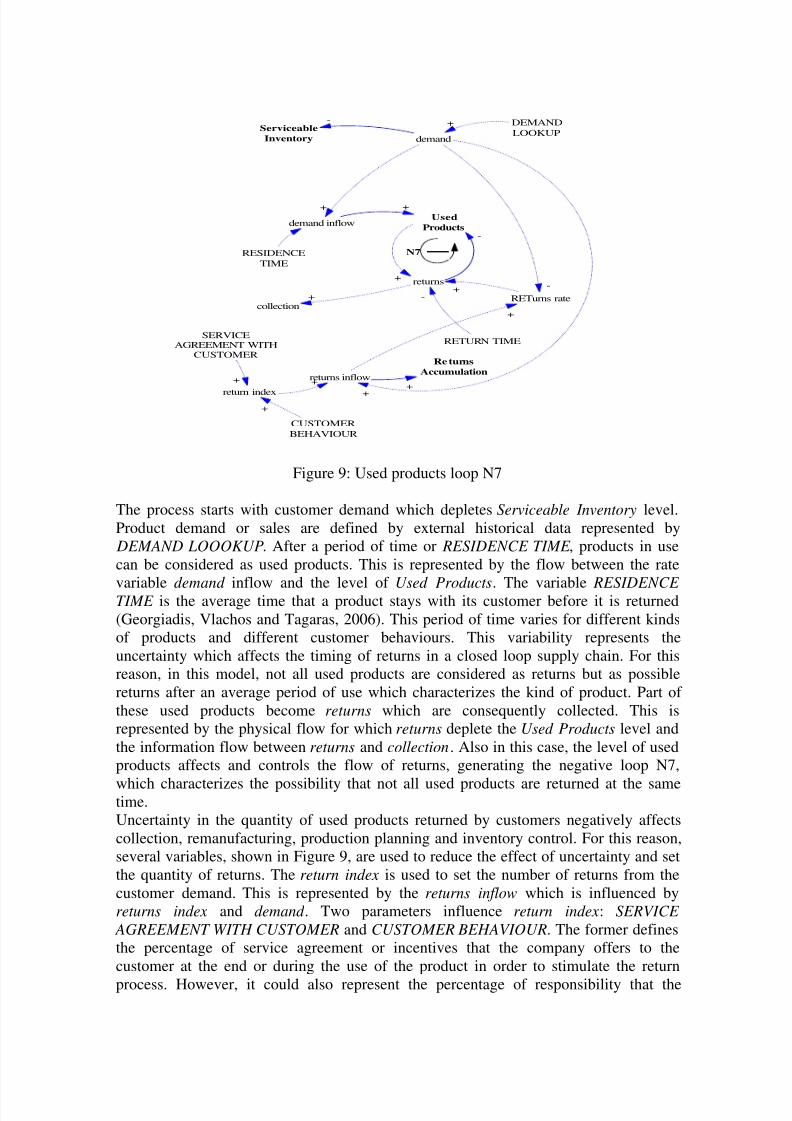
The process starts with customer demand which depletes Serviceable Inventory level.Product demand or sales are defined by external historical data represented by
DEMAND LOOOKUP. After a period of time or RESIDENCE TIME , products in usecan be considered as used products. This is represented by the flow between the rate
variable demand inflow and the level of Used Products. The variable RESIDENCE TIME is the average time that a product stays with its customer before it is returned(Georgiadis, Vlachos and Tagaras, 2006). This period of time varies for different kindsof products and different customer behaviours. This variability represents theuncertainty which affects the timing of returns in a closed loop supply chain. For thisreason, in this model, not all used products are considered as returns but as possiblereturns after an average period of use which characterizes the kind of product. Part of these used products become returns which are consequently collected. This isrepresented by the physical flow for which returns deplete the Used Products level andthe information flow between returns and collection. Also in this case, the level of usedproducts affects and controls the flow of returns, generating the negative loop N7,
which characterizes the possibility that not all used products are returned at the sametime.Uncertainty in the quantity of used products returned by customers negatively affectscollection, remanufacturing, production planning and inventory control. For this reason,several variables, shown in Figure 9, are used to reduce the effect of uncertainty and setthe quantity of returns. The return index is used to set the number of returns from thecustomer demand. This is represented by the returns inflow which is influenced byreturns index and demand . Two parameters influence return index: SERVICE
AGREEMENT WITH CUSTOMER and CUSTOMER BEHAVIOUR. The former definesthe percentage of service agreement or incentives that the company offers to thecustomer at the end or during the use of the product in order to stimulate the return
process. However, it could also represent the percentage of responsibility that the

8/2/2019 Inventory Control in Closed Loop Supply Chain Using System Dynamics
http://slidepdf.com/reader/full/inventory-control-in-closed-loop-supply-chain-using-system-dynamics 14/33
company has towards the recovery of its own products. The latter parameter defines the attitude of the customers in returning used products and their response to the companyincentives in increasing the return process. The relationships among these three factorsare shown in Figure 10. The difficulty in obtaining and documenting real data has led to
the use of a distributional form made on intuitive grounds. However, a similar approachfor an influence analysis is presented by Georgiadis and Vlachos (2004b) who analysedifferent parameters such as market behaviour and the green image factor for productsin different industries.In Figure 10 return index for a particular product is obtained from the percentage of service that the company offers to the customer to take back the product after its use.Therefore, the values of SERVICE AGREEMENT WITH CUSTOMER are between 0and 100% which correspond to 0 and 1 of return index respectively. High values of service agreement are obtained by companies which offer incentives for a full return of the sold products, for example, leasing contracts (e.g., cars and photocopiers) or serviceat the end of the useful life of the product/component (e.g., single use cameras and toner
cartridges). Also included are companies which have full responsibility for recoverydue, for example, to environmental Government regulations. High values of serviceagreement correspond to high values of return index for which it is assumed that almostall the demands or sold products are returned by customers. The minimum valuecorresponds to the kinds of products not involved in reverse logistics activity,particularly remanufacturing, with a zero return index and no efforts from companies inproducts recovery. Regarding the in-between values, the dependency between the indexand service agreement depends on CUSTOMER BEHAVIOUR (CB).
0
0.1
0.2
0.3
0.4
0.5
0.6
0.7
0.8
0.9
1
0 10 20 30 40 50 60 70 80 90 100
SERVICE AGREEMENT WITH CUSTOMER (%)
r e t u r n i n d e x
Figure 10: Relationship between SERVICE AGREEMENT WITH CUSTOMER andreturn index for various CUSTOMER BEHAVIOURS
Several company incentives are used in practice to stimulate a desired behaviour in thecontext of product recovery (de Brito, Dekker and Flapper, 2004). These can be: adeposit fee that has to be paid when purchasing the product, free collection or
repurchase of used products, monetary incentive paid at the return of used products and
CB3
CB2CB1
8/2/2019 Inventory Control in Closed Loop Supply Chain Using System Dynamics
http://slidepdf.com/reader/full/inventory-control-in-closed-loop-supply-chain-using-system-dynamics 15/33
trade-in which involves the possibility of obtaining a newer version of a product only if the original product is returned. Currently, appropriate product designs for easierdisassembly and clear information/advertising about reverse logistics activities andenvironmental responsibilities are being developed by companies in order to assure the
return of used products. However, the sensitivity and reaction to these incentivesdepends on individual customer behaviour. To incorporate differing customerbehaviours into the study, three alternative curves are assumed in Figure 10. CB2corresponds to a proportional relationship between SERVICE AGREEMENT WITH
CUSTOMER and return index. In this case, it is assumed that customers respondproportionally to incentives and services offered by companies attempting to recoverused products. The symmetric curves CB3 and CB1 correspond to a quicker and slowerresponse from customers respectively. Particularly for CB3, it is assumed that theresponse of the customers and consequently the associated return index changes quicklyfor low values of SERVICE AGREEMENT WITH CUSTOMER while is almost the samefor higher values. This is different for CB1 which becomes more acute for higher values
of SERVICE AGREEMENT WITH CUSTOMER. This theoretical influence analysis isused to involve as much as possible the relationship between customer behaviour andquantity of returns.
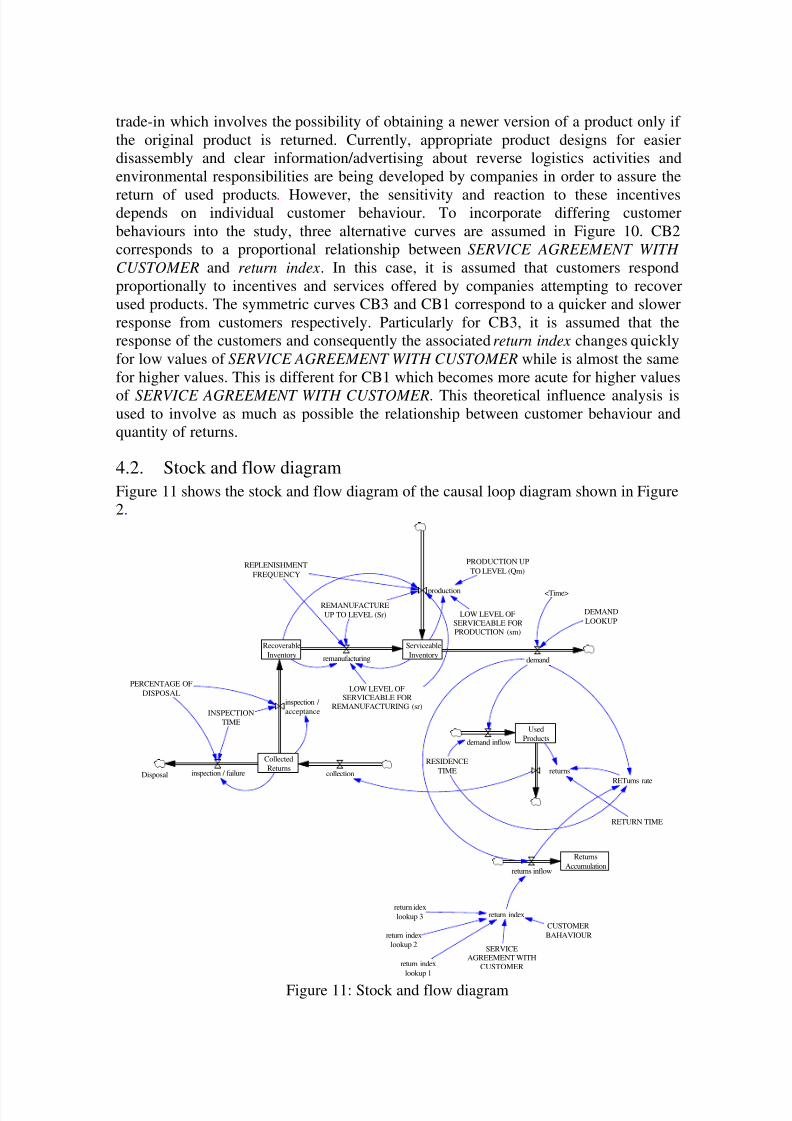
4.2. Stock and flow diagram
Figure 11 shows the stock and flow diagram of the causal loop diagram shown in Figure2.
Serviceable
Inventory
Recoverable
Inventory remanufacturing
Collected
Returnsinspection / failure
inspection /
acceptance
PERCENTAGE OF
DISPOSAL
REMANUFACTURE
UP TO LEVEL (Sr)
production
LOW LEVEL OFSERVICEABLE FOR
REMANUFACTURING (sr)
LOW LEVEL OFSERVICEABLE FORPRODUCTION (sm)
PRODUCTION UP
TO LEVEL (Qm)
demand
RETurns ratecollection
RESIDENCE
TIME
Used
Productsdemand inflow
returns
Returns
Accumulationreturns inflow
return index
DEMAND
LOOKUP
<Time>
INSPECTION
TIME
REPLENISHMENT
FREQUENCY
RETURN TIME
return idex
lookup 3
SERVICEAGREEMENT WITH
CUSTOMER
CUSTOMER
BAHAVIOURreturn index
lookup 2
return index
lookup 1
Disposal
Figure 11: Stock and flow diagram
8/2/2019 Inventory Control in Closed Loop Supply Chain Using System Dynamics
http://slidepdf.com/reader/full/inventory-control-in-closed-loop-supply-chain-using-system-dynamics 16/33
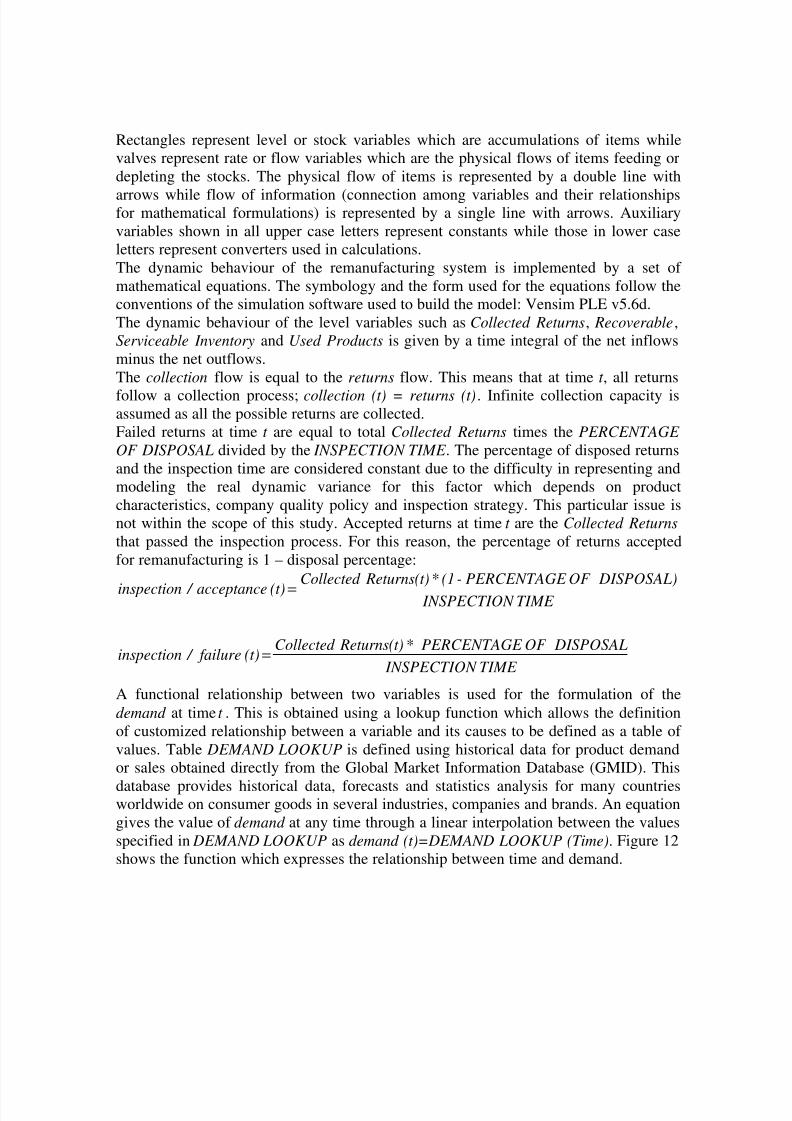
Rectangles represent level or stock variables which are accumulations of items whilevalves represent rate or flow variables which are the physical flows of items feeding ordepleting the stocks. The physical flow of items is represented by a double line with
arrows while flow of information (connection among variables and their relationshipsfor mathematical formulations) is represented by a single line with arrows. Auxiliaryvariables shown in all upper case letters represent constants while those in lower caseletters represent converters used in calculations. The dynamic behaviour of the remanufacturing system is implemented by a set of mathematical equations. The symbology and the form used for the equations follow theconventions of the simulation software used to build the model: Vensim PLE v5.6d.The dynamic behaviour of the level variables such as Collected Returns, Recoverable,Serviceable Inventory and Used Products is given by a time integral of the net inflowsminus the net outflows. The collection flow is equal to the returns flow. This means that at time t , all returns
follow a collection process; collection (t) = returns (t). Infinite collection capacity isassumed as all the possible returns are collected.Failed returns at time t are equal to total Collected Returns times the PERCENTAGE
OF DISPOSAL divided by the INSPECTION TIME . The percentage of disposed returnsand the inspection time are considered constant due to the difficulty in representing andmodeling the real dynamic variance for this factor which depends on productcharacteristics, company quality policy and inspection strategy. This particular issue isnot within the scope of this study. Accepted returns at time t are the Collected Returns
that passed the inspection process. For this reason, the percentage of returns acceptedfor remanufacturing is 1 – disposal percentage:
TIME INSPECTION
DISPOSAL) OF PERCENTAGE -(1* Returns(t)Collected (t)acceptance / inspection =
TIME INSPECTION
DISPOSAL OF PERCENTAGE * Returns(t)Collected (t) failure / inspection =
A functional relationship between two variables is used for the formulation of the
demand at time t . This is obtained using a lookup function which allows the definitionof customized relationship between a variable and its causes to be defined as a table of values. Table DEMAND LOOKUP is defined using historical data for product demandor sales obtained directly from the Global Market Information Database (GMID). This
database provides historical data, forecasts and statistics analysis for many countriesworldwide on consumer goods in several industries, companies and brands. An equationgives the value of demand at any time through a linear interpolation between the valuesspecified in DEMAND LOOKUP as demand (t)=DEMAND LOOKUP (Time). Figure 12shows the function which expresses the relationship between time and demand.

8/2/2019 Inventory Control in Closed Loop Supply Chain Using System Dynamics
http://slidepdf.com/reader/full/inventory-control-in-closed-loop-supply-chain-using-system-dynamics 17/33
Lookup function
596.7
1283.36
359.82
1921.92
2223.3128 2251. 788
0
500
1000
1500
2000
2500
0 12 24 36 48 60
Time
d e m a n d
Figure 12: demand lookup
Demand inflow represents the flow of previously sold products currently in use whichnow are used products and possible returns after the residence time has elapsed. In orderto model this process the function DELAY FIXED is used. This function returns thevalue of the input demand delayed by the delay time which in this case is the residence
time: demand inflow=DELAY FIXED (demand, residence time, 0).
An IF THEN ELSE function and the logical operator AND are used to define theproduction quantity in the process. In particular, they provide the number of productionreorders during the simulation period. The logical expression defines the conditionwhen the Serviceable Inventory level is less than or equal to the LOW LEVEL OF
SERVICEABLE FOR PRODUCTION and also when Recoverable Inventory level is less
than REMANUFACTURE UP TO LEVEL minus LOW LEVEL OF SERVICEABLE FOR REMANUFACTURING. If the condition is true, the expression returns a productionreorder equal to the ratio between PRODUCTION UP TO LEVEL minus the serviceableinventory on hand and the REPLENISHMENT FREQUENCY , otherwise the returnedvalue is zero. A similar equation defines the remanufacturing quantity and the numberof remanufacturing orders in the model. In this case, the condition requires thatServiceable Inventory level is less than or equal to LOW LEVEL OF SERVICEABLE
FOR REMANUFACTURING and that Recoverable Inventory is greater than or equal to REMANUFACTURE UP TO LEVEL minus LOW LEVEL OF SERVICEABLE FOR
REMANUFACTURING. The possible returned values are a remanufacturing order equalto the ratio between REMANUFACTURE UP TO LEVEL minus LOW LEVEL OF
SERVICEABLE FOR REMANUFACTURING and REPLENISHMENT FREQUENCY , if the condition is true, or zero otherwise. The variable return index is formulated through a combination of IF THEN ELSE andlookup functions. This equation represents the tendency of a particular product to bereturned by customers, considering individual customer behaviours and differing levelsof service agreement or company incentives. The constant CUSTOMER BEHAVIOUR can assume three values; 1, 2 or 3 which define the three different curves in Figure 10.In function of value assumed by CUSTOMER BEHAVIOUR, return index is calculatedthrough one of the lookup functions whose table of values identify the curves CB1, CB2 and CB3 respectively. They represent the lookup functions in which return index andSERVICE AGREEMENT WITH CUSTOMER are the dependent and independent
variable respectively.
8/2/2019 Inventory Control in Closed Loop Supply Chain Using System Dynamics
http://slidepdf.com/reader/full/inventory-control-in-closed-loop-supply-chain-using-system-dynamics 18/33
The flow of actual returned items which are collected is represented as dynamic ratiobetween the portion of Used Products through the use of a returns rate and the timerequired to return and collect the items:
TIME RETURN
(t)ratereturns*(t)ProductsUsed returns(t) =
Returns rate represents the portion or percentage of used products which are returnedduring the time period under consideration. Several authors such as Kiesmuller (2003),Kiesmuller and Minner (2003) and Inderfurth (2005) use returns rate in their models. Inorder to define the quantity of returns, they consider a returns rate as the ratio betweenthe average returns and the average demands. Consequently, the returns rate in thismodel is represented as dynamic ratio between returns inflow and demand :
demand(t)
(t)inflowreturns (t)ratereturns =
A function DELAY FIXED is used in order to return the value of the input given by the
previous ratio delayed by the residence time plus one time period. The reason for thisdelay is due to the necessary time equivalence between the variables returns and returns
rate, as the accumulation of used products and the actual returns flow start one timeperiod after the residence time. Returns inflow represents the expected returns of demand or sold products. A forecast of returns is obtained using the return
index: (t)indexreturn*(t)demand (t)inflowreturns =
5. Model validation
The structure of the model was directly validated using extreme condition tests(Sterman 2000). Under extreme condition of the inputs values such as zero or infinity,the model should behave as a realistic system. Validation was performed by means of direct tests for the model equations and particularly for the flow equations. Extremevalues were assigned simultaneously to all the input variables in order to analyse thevalue of the output which should be reasonable for a real system under the sameextreme condition. The Reality Check function of the Vensim simulation was used toachieve this. After a direct structure validation through extreme condition tests, we validatedindirectly the entire structure of the model through sensitivity analysis. This behavioursensitivity test, particularly parameter sensitivity, consists of determining the sensibilityof the model to the values of particular parameters and comparing this sensitivity of areal system to the corresponding parameters (Barlas 1996). Moreover, sensitivity
analysis tests the robustness of the model conclusions to particular assumptions(Sterman 2000). This means that the sensibility of the model due to changes of value forparticular parameters should generate changes in the numerical value of the results or inbehaviour patterns which can be similar for a real system and in line with the purpose of the model. The parameters chosen to run the sensitivity analysis were residence time,SERVICE AGREEMENT WITH CUSTOMER, CUSTOMER BEHAVIOUR,PERCENTAGE OF DISPOSAL, REMANUFACTURE UP TO LEVEL, PRODUCTION
UP TO LEVEL, LOW LEVEL OF SERVICEABLE FOR REMANUFACTURING and LOW LEVEL OF SERVICEABLE FOR PRODUCTION . The choice was due to theirhigh influence on the behaviour of the system and their uncertainty about the suitablevalue to use in the model. The first three parameters characterize the uncertainty in
timing and quantity of returns. Then they have a high influence on the behaviour of the

8/2/2019 Inventory Control in Closed Loop Supply Chain Using System Dynamics
http://slidepdf.com/reader/full/inventory-control-in-closed-loop-supply-chain-using-system-dynamics 19/33
system. The other parameters characterize the company strategy and policy in inventorycontrol and inspection activity. Then, because of the generality of the model, they areaffected by uncertainty in the reasonable value to use in the model.
6. Simulation and resultsIn order to apply scenarios analysis a parameter of study is required. As for mostremanufacturing inventory systems the objective is to minimize the average total cost,the latter will be considered for the analysis. However, this study does not try todetermine the optimal order quantity or reorder inventory level. Rather the objective isto unfold the effects on the system of factors such as residence time and return index which are influenced by customer behaviour, product characteristics and serviceagreements offered by companies. These factors are considered as an event thatintervenes in a remanufacturing system where returns process is characterized byuncertainty in quantity and timing of returns. The considered total cost for the analysisis found by adding a number of operational costs. These are the set-up costs for eachproduction reorder and remanufacturing order, cost of stockout for each out of stock saleand holding costs for recoverable and serviceable inventory. The reason for choosingthese particular costs is due to several observations. Firstly, the system presents adisposal activity due to the inspection process and not to a planned disposal inrecoverable inventory which is usually required because of the limited capacity of thelatter. This means that all accepted returns from the inspection are stored as recoverableinventory and used for the remanufacturing activity. Then, there are not inventorydecisions which affect the remanufacturing and production activity in terms of quantityof items to be remanufactured and produced (van der Laan and Teunter, 2006).Moreover, the mathematical formulation of the model does not consider production and
remanufacturing rate. These observations make the inventory system independent of theremanufacturing and production activity and consequently they exclude the productionand remanufacturing costs. However, in order to potentially consider cheaperremanufacturing rather than production activity, (remembering that the cost of remanufacturing is typically 40% - 60% of the cost of production) different set-up costsare assumed for production reorder and remanufacturing order. However, this analysisfocuses on the total inventory costs which exclude the collection and inspection/disposalcosts.The set-up costs are formulated as the sum product of the fixed set-up costs per reorderor order and the number of production reorder and remanufacturing orders respectively.In this case only the fixed set-up cost is considered while variable set-up costs which
involve activities such as transportation and materials handling are ignored. The cost of stockout is obtained through the multiplication of the unit cost for a lost sale and thenumber of lost sales. The latter are found through the negative values of serviceableinventory which represent unfilled demands and consequently lost sales. Therecoverable and positive serviceable inventory on hand multiplied respectively by therecoverable and serviceable holding cost per item per time unit gives the inventoryholding costs. Unit holding cost for serviceable is considered greater than unit holdingcost for recoverable as several storing factors such as insurance, taxes, deterioration,damage and capital invested can generate lower costs for the recoverable inventory.This analysis focuses particularly on the returns process and is obtained through thecombination of several values of some parameters for which the system has shown to be
sensitive during the sensitivity analysis. The parameters are RESIDENCE TIME ,

8/2/2019 Inventory Control in Closed Loop Supply Chain Using System Dynamics
http://slidepdf.com/reader/full/inventory-control-in-closed-loop-supply-chain-using-system-dynamics 20/33
SERVICE AGREEMENT WITH CUSTOMER and CUSTOMER BAHAVIOUR for whichthe returns process system has shown sensitivity in the quantity of returns to differentcombinations of their values.The base scenario used for this analysis has the same value of parameters considered for
the sensitivity analysis. However, in this case, demand is set to a uniformly distributedrandom number in order to generalize the model to different kinds of products. Therandom values are set between 300 and 2000 items with a fixed noise seed, in order tohave the same sequence of random values for every simulation, equals to 2. Theformulation of demand is so represented: demand = RANDOM UNIFORM (300, 2000,
2). Moreover, RESIDENCE TIME is set to 12 months. Figure 13 shows the costs trendfor the base scenario during the planning horizon set to 60 months.
Figure 13: The costs trend for the base scenario
The evolution of the total cost shows a growing trend during the planning horizon. It isimportant to remember that the increase of the total cost does not cause a negative
aspect in the model. Company costs could increase due to reverse logistics activitiessuch as remanufacturing and disposal with a subsequent need to optimize the total costs(Inderfurth 2005). This analysis does not involve the profit margin of the inventorysystem but it focuses on the effects that the returns process and several involvedparameters have on the average total inventory cost. Figure 13 shows a decreasing trendto the total cost for the time period between the months 30 ($5,342) and 45 ($3,370)which involves high remanufacturing activity as is shown by the reduction of recoverable inventory and the use of cheaper remanufacturing orders. This highremanufacturing activity could be associated with the reduction of the total cost, as theserviceable holding costs have a constant or rather growing trend during the planninghorizon, particularly for the same time period, and stockout costs have two peaks during
the same period.

8/2/2019 Inventory Control in Closed Loop Supply Chain Using System Dynamics
http://slidepdf.com/reader/full/inventory-control-in-closed-loop-supply-chain-using-system-dynamics 21/33
Table 1: Parameter values used for returns process scenarios
Scenarios residence timeSERVICE AGREEMENT
WITH CUSTOMER CUSTOMER
BEHAVIOUR
base scenario 12 50% 22 20%, 40%, 60%, 80%, 100% 1, 2, 3
12 20%, 40%, 60%, 80%, 100% 1, 2, 3Fast used products
18 20%, 40%, 60%, 80%, 100% 1, 2, 3
24 20%, 40%, 60%, 80%, 100% 1, 2, 3
36 20%, 40%, 60%, 80%, 100% 1, 2, 3Slow used products
42 20%, 40%, 60%, 80%, 100% 1, 2, 3
Hence, the analysis focuses on the effect of the three parameters previously mentionedon the average of total inventory costs. The results refer to the effect of various levels of
RESIDENCE TIME , SERVICE AGREEMENT WITH CUSTOMER and CUSTOMER
BAHAVIOUR. Particularly the system was examined using 6 levels of residence time, 5levels of service agreement and the 3 levels of customer behaviour. Table 1 lists theparameter values used for the analysis which involves a total of 90 scenarios.The various scenarios are characterized by low and high residence times which areidentified with Fast used products and Slow used products respectively. The choice of this table structure is due to the relationship between residence time and kind of products. While, with a reference to a kind of product, SERVICE AGREEMENT WITH
CUSTOMER and CUSTOMER BEHAVIOUR are considered as the policies/incentivesthat companies use to have back used products and the customer tendency in returningthem. The parameter values used to set the residence time are realistic as they can be
associated with several remanufacturable products (Georgiadis, Vlachos and Tagaras,2006). The assumed values for SERVICE AGREEMENT WITH CUSTOMER canrepresent a broad range of company policies and incentives types which develop arelationship between companies and customers in the returns process. In the same way,the different levels of CUSTOMER BEHAVIOUR are representative of a broad range of responsive aptitudes.Figure 14 presents the evolution of the average total inventory cost for varioussimultaneously simulated levels of residence time and SERVICE AGREEMENT WITH
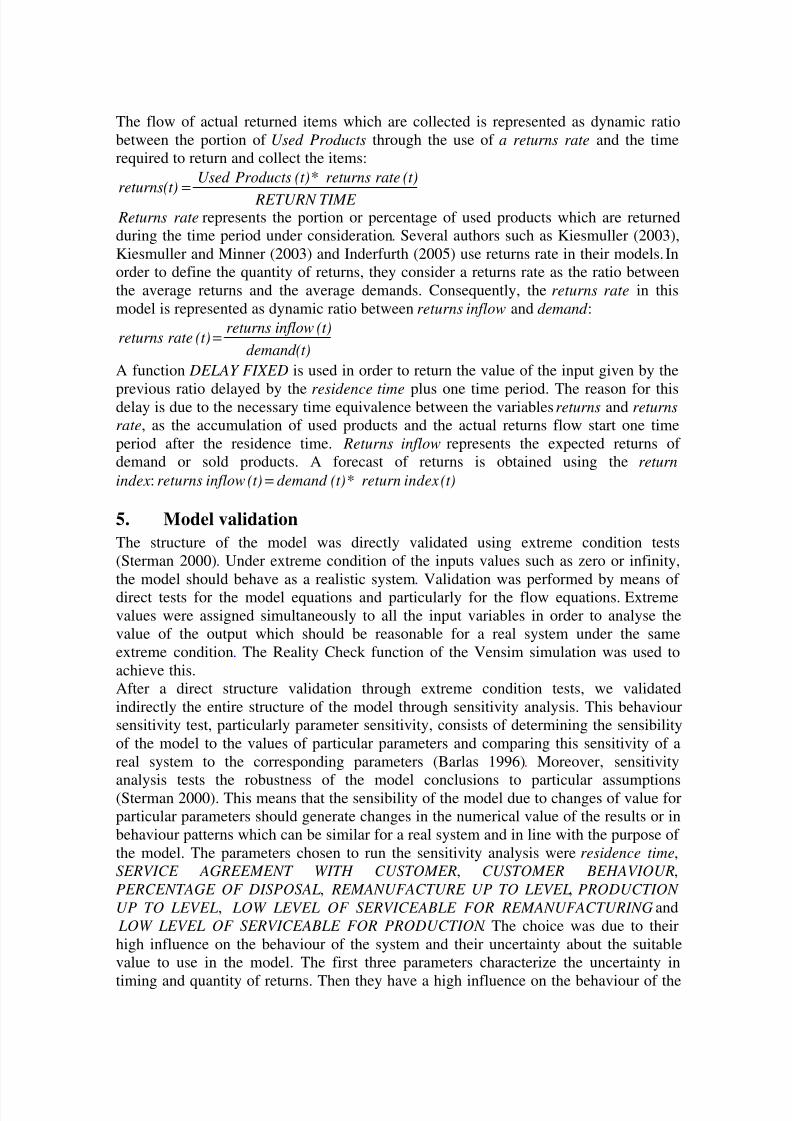
CUSTOMER, referring to a CUSTOMER BEHAVIOUR equal to 3. The numericalresults are presented in Table 2.
Table 2: Average total inventory cost for various combination of RESIDENCE TIME and SERVICE AGREEMENT WITH CUSTOMER, (CB3)
RESIDENCE TIME 2 12 18 24 36 42
SERVICE AGREEMENTWITH CUSTOMER
20 4682.844 4201.623 3950.233 3427.938 2986.571 2635.332
40 4180.362 4466.277 3772.101 3606.984 3104.66 2717.271
60 4048.493 3588.229 3638.265 3245.864 2848.161 2747.953
80 4101.747 3632.09 3675.943 3276.057 2868.204 2762.135
100 4124.429 3650.807 3454.465 3288.989 2876.753 2768.202
8/2/2019 Inventory Control in Closed Loop Supply Chain Using System Dynamics
http://slidepdf.com/reader/full/inventory-control-in-closed-loop-supply-chain-using-system-dynamics 22/33
20
40
60
80
100
2
12
18
24
36
42
2000
2500
3000
3500
4000
4500
5000
Average total
inventory cost
SERVICE
AGREEMENT WITH
CUSTOMERRESIDENCE TIME
Figure 14: The evolution of the average total inventory cost affected by RESIDENCE TIME and SERVICE AGREEMENT WITH CUSTOMER, (CB3)
The first observation shows a decrease of the average total inventory cost for high levelof residence time. Slow used products have a reduced cyclic nature of return as theproducts remain with customers longer. In the model the reduced cyclic nature of returnof a product is represented by the long time period between the product sale and itspossible return.
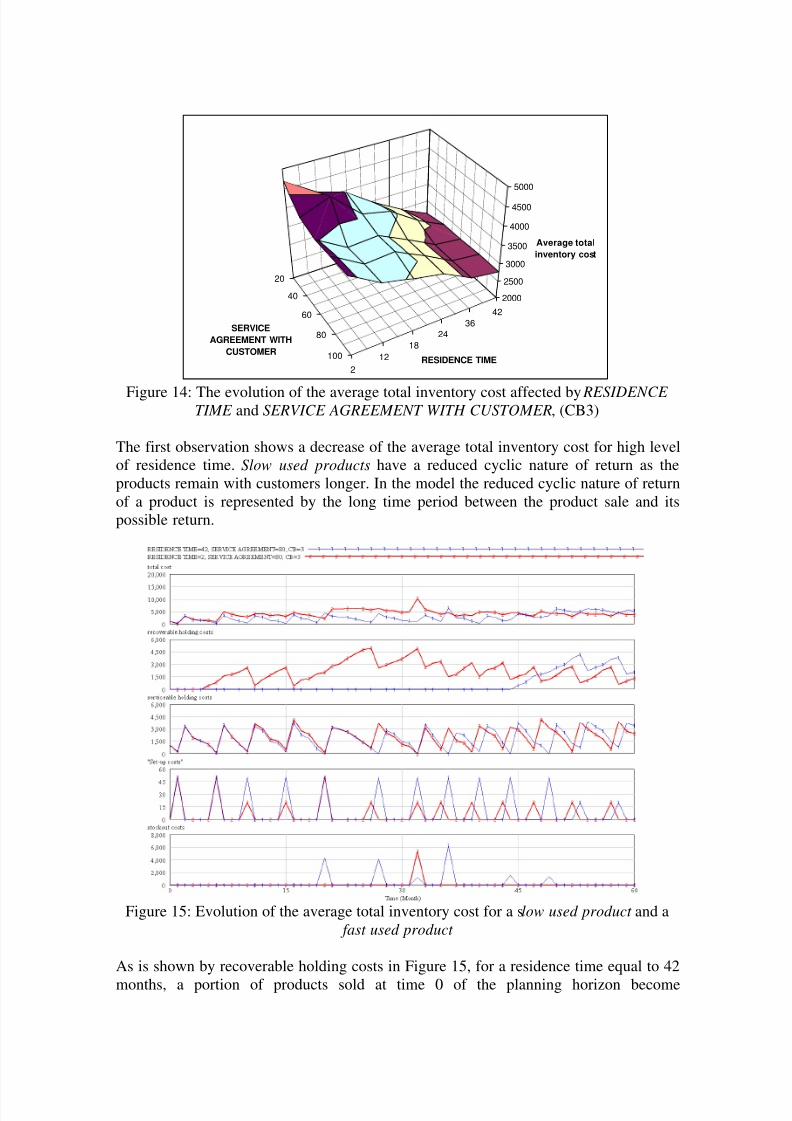
Figure 15: Evolution of the average total inventory cost for a slow used product and a fast used product
As is shown by recoverable holding costs in Figure 15, for a residence time equal to 42
months, a portion of products sold at time 0 of the planning horizon become

8/2/2019 Inventory Control in Closed Loop Supply Chain Using System Dynamics
http://slidepdf.com/reader/full/inventory-control-in-closed-loop-supply-chain-using-system-dynamics 23/33
remanufacturable returns only after the long residence time. Then, during this timeperiod they do not affect the recoverable inventory and its associated cost. In a differentway, products with short resident time have a fast cyclic nature of return and they arequickly involved in recoverable inventory and remanufacturing activity. Therefore in
the short period, slow used products have a reduced use of recoverable inventory andremanufacturing activity with a consequent reduction of the total inventory cost.Considering also that serviceable holding costs are independent of the remanufacturingor production of the product and consequently of the residence time, and that stockoutcost are often special events, as Figure 15 shows.This observation does not prove that slow used products are promising candidates for aprofitable remanufacturing process. On the contrary, in the context of Closed LoopSupply Chain, examples of profitable remanufacturing process include f ast used
products such as single use cameras (Kodak) and assemblies or sub assemblies of copiers/printers (Fuji Xerox). These kinds of products generate high levels of return andrecoverable inventory with a subsequent increase in the total inventory costs. But, at the
same time, cheaper remanufacturing activity is a substitute for more expensiveproduction activity, as is shown by the set-up costs in Figure 15. As the structure of themodel does not involve remanufacturing and production costs then it is not possible tomake any conclusion regarding a profitable remanufacturing. However, severalexamples are given of products with low residence time or short life cycle and highreturns rate for which high stock levels increase inventory costs. However,remanufacturing activity is in the long run economically profitable for reducedproduction costs such as purchasing and service costs (Flapper, Van Nunen and VanWassenhove, 2005).
Figure 16: Evolution of the average total inventory cost for high and low SERVICE
AGREEMENT WITH CUSTOMER

8/2/2019 Inventory Control in Closed Loop Supply Chain Using System Dynamics
http://slidepdf.com/reader/full/inventory-control-in-closed-loop-supply-chain-using-system-dynamics 24/33
The second observation, through the scenarios simulation, reinforces the possibility thathigh returns rate can generate a profitable remanufacturability in closed loop supplychains. From Table 2 and Figure 14 it is possible to observe a decrease of the averagetotal inventory cost for each level of residence time, except for the highest one,
increasing the SERVICE AGREEMENT WITH CUSTOMER from 20% to 100%. Thecost variation is not as significant as increasing the residence times. However it canprove efficiency in managing inventory in the remanufacturing process. High incentivesfor product recovery and consequently high returns rate and quantity of remanufacturable returns can increase the level of recoverable inventory which can beused to generate remanufacturing orders faster as a substitute for production. Thisreduces the average level of recoverable inventory and consequently the average totalinventory cost, as Figure 16 shows in recoverable holding costs. Moreover, the use of more remanufacturing activity does not negatively affect the effectiveness of the systemas is shown in Figure 16 where stockout quantity and costs are reduced for a higherreturns rate.
Table 2 shows a higher reduction of the average total inventory cost, increasing theSERVICE AGREEMENT WITH CUSTOMER from 20% to 100%, for fast used products than slow used products for which an increase of cost characterizes the highestresidence time (42 months). This difference of cost trend is due to the lower influence of the slow used products on recoverable holding costs and recoverable inventory asnoticed in the first observation. In this case, the increase of the service agreement orincentives increases the quantity of recoverable inventory but only after a long residencetime. This surplus of recoverable inventory does not affect remanufacturing as asubstitute for production activity in the short period. Therefore, an increase of serviceagreement for product recovery could have a lower or negative effect on average totalinventory cost for slow used products in a short time period. This is different for fast
used products where an increase in incentives affects the quantity of recoverableinventory in a shorter time period which can then be used sooner in remanufacturingactivity with subsequent benefits in recoverable inventory and production activityreduction. However, in the long term slow used products can be benefited from apercentage increase of the service agreement. Increasing the planning horizon from 60to 120 months, the average total inventory cost for slow used products with residencetime equal to 42 months decreases from $3,834 for 20% of SERVICE AGREEMENT
WITH CUSTOMER to $3,601 for 100% of SERVICE AGREEMENT WITH
CUSTOMER. Examples of closed loop supply chains for slow used products such aswhite goods are presented in literature (Flapper, Van Nunen and Van Wassenhove,
2005). The main drivers for the reverse logistic process of such products areGovernment legislations which include the responsibility of producers in recovery of their end of life products. However, incentives to the customer and several factorsinvolved in the process are given in order to increase the returns rate for economic andenvironmental benefit such as low costs and reduced uncontrolled disposal.Simulations, using the same values for the parameters RESIDENCE TIME andSERVICE AGREEMENT WITH CUSTOMER presented in Table 1, were examinedsetting CUSTOMER BEHAVIOUR equal to 2 and 1. Table 3 and Figure 17 show theevolution of the average total inventory cost for changes in CUSTOMER BEHAVIOUR and percentage of SERVICE AGREEMENT WITH CUSTOMER, with a RESIDENCE
TIME equal to the base value of 12 months.

8/2/2019 Inventory Control in Closed Loop Supply Chain Using System Dynamics
http://slidepdf.com/reader/full/inventory-control-in-closed-loop-supply-chain-using-system-dynamics 25/33
The reduction in the value of CUSTOMER BEHAVIOUR from 3 to 1 decreases thereturns rate and consequently the average number of returns. This applies to everypercentage of SERVICE AGREEMENT WITH CUSTOMER except for 100% for whichreturn index and consequently the returns rate is independent of the customer behaviour.
These simulation results can be realistic and representative as a lower response fromcustomers to the company incentives for the recovery of used products in a closed loopsupply chain process can reduce the quantity of returns. However, usually this shouldnot occur for products for which companies maintain ownership such as products underleasing contracts or for products which companies are responsible for recovering due toenvironmental Government legislations.
Table 3: Average total inventory cost for various combination of SERVICE
AGREEMENT WITH CUSTOMER and CUSTOMER BEHAVIOUR, ( RESIDENCE
TIME = 12)CUSTOMER
BEHAVIOURCB3 CB2 CB1
SERVICE AGREEMENTWITH CUSTOMER
20 4201.623 3534.054 3339.559
40 4466.277 4465.936 3779.627
60 3588.229 4390.815 4230.37
80 3632.09 4380.441 4338.692
100 3650.807 3650.807 3650.807
20
40
60
80
100
CB3
CB2
CB1
2000
2500
3000
3500
4000
4500
Average total
inventory cost
SERVICE
AGREEMENT WITH
CUSTOMER
CUSTOMER
BEHAVIOUR
Figure 17: The evolution of the average total inventory cost affected by CUSTOMER
BEHAVIOUR and SERVICE AGREEMENT WITH CUSTOMER, ( RESIDENCE TIME =12)
This reduction of returns quantity due to changes in customer behaviour has severalconsequences on the inventory system and its average total cost. From Table 3 andFigure 17 it is possible to observe that for higher percentages of SERVICE
AGREEMENT WITH CUSTOMER such as 60% and 80% the average total inventorycost increases if the customer response (and returns rate) is lower. This is due to a lowerlevel of recoverable returns in a shorter period. Higher levels of service agreement or
incentives and at the same time higher response from customers to these incentives

8/2/2019 Inventory Control in Closed Loop Supply Chain Using System Dynamics
http://slidepdf.com/reader/full/inventory-control-in-closed-loop-supply-chain-using-system-dynamics 26/33
increase the level of remanufacturable returns. Therefore, in a shorter period it ispossible to use remanufacturing as a substitute to production activity with subsequenteconomic benefits through reduction of recoverable inventory and holding costs andthrough cheaper manufacturing processes. The same observation has been previously
noted in Figure 16 with an increase of SERVICE AGREEMENT WITH CUSTOMER.Differently way from Table 3 and Figure 17 it is possible to observe that for lowerpercentages of SERVICE AGREEMENT WITH CUSTOMER such as 20% and 40% theaverage total inventory cost decreases if the CUSTOMER BEHAVIOUR valuedecreases. In this case, as the top of Figure 18 shows, the low quantity of returns due tolow incentives and low customer response leads to a low level of recoverable inventorywhich is almost always lower than the level of recoverable inventory for the higherCUSTOMER BEHAVIOUR. The latter involves more remanufacturing activity but notenough in order to have the lower recoverable inventory level. Therefore, in the case of low values for CUSTOMER BEHAVIOUR the level of recoverable inventory involveslower holding costs but at the same time lower remanufacturing activity. This
observation could negatively affect companies involved in remanufacturing activity forclosed loop supply chain process which require enough quantity of returns to increaseremanufacturing as a substitute of production activity. However, the bottom of Figure18 and the data in the right column of Table 3 show that in the case of low customerbehaviour the increased percentage in the service agreement could not have theexpected reduction in cost. As already mentioned, this is due to insufficientremanufacturing activity in order to reduce and lower recoverable holding costs.
Figure 18: Evolution of the recoverable holding costs for high and low CUSTOMER
BEHAVIOUR and increased SERVICE AGREEMENT WITH CUSTOMER
7. DiscussionRemanufacturing activity in the closed loop supply chain process needs enough quantityof remanufacturable returns in order to set a manufacturing process where cheaperremanufacturing can be used as a substitute to production activity. This process leads toeconomic and environmental benefits in reducing more expensive production activity.Remanufacturing uses 85% less energy than production, reduces landfill, pollution andraw material usage (Gray and Charter, 2007). Moreover, the analysis shows that anincrease in remanufacturing activity can optimize the inventory system and its costthrough efficiency in recoverable inventory. Slow used products with a longer residencetime present in the short period a reduced use of recoverable inventory due to theirreduced cyclic nature of return and consequently lower inventory cost than f ast used
products. However, in the short term this could negatively affect remanufacturing as a

8/2/2019 Inventory Control in Closed Loop Supply Chain Using System Dynamics
http://slidepdf.com/reader/full/inventory-control-in-closed-loop-supply-chain-using-system-dynamics 27/33
substitute for production activity for shortage of remanufacturable returns. On the otherhand f ast used products can be used in a shorter period and prompt remanufacturingactivity which reduces the inventory cost through efficiency in recoverable inventory. Aprompt remanufacturing activity depends on the recoverable inventory on hand which,
as the analysis shows, is influenced by SERVICE AGREEMENT WITH CUSTOMER and CUSTOMER BEHAVIOUR. An increase of both parameters leads to a higher levelof recoverable inventory on hand and consequently to the possibility of promptremanufacturing activity.However, uncertainty in returns flow, particularly on timing and quantity of returns, caninfluence the results of the previous analysis on the inventory system. Severalcompanies manage the uncertainty in quantity of remanufacturable returns which arestored in the recoverable inventory without attempting to balance returns with demandsbut they prefer instead to dispose of excess inventories on a periodic basis (Guide2000). In the same way, several authors use a planned disposal of recoverable inventoryin their models and probabilistic returns quantity or all demands as returns (van der
Laan, Dekker and Salomon, 1996; van der Laan and Salomon, 1997; Vlachos,Georgiadis and Iakovou, 2007). In our inventory model, planned disposal of recoverableinventory is not considered, which could add a new inventory cost and be moreprofitable, following the reverse logistics preponement concept (Blackburn et al. 2004),before the stage of inspection. However, uncertainty in timing and quantity of returns isspecifically tackled through the use of parameters such as RESIDENCE TIME ,SERVICE AGREEMENT WITH CUSTOMER and CUSTOMER BEHAVIOUR. Theirrelationships in the returns process provides a forecasted returns rate and a possible timeof return for used products with different product characteristics and in differentindustries. The knowledge of the products residence time coupled with combinations of incentives in product recovery such as trade-in and leasing contracts can assist inforecasting the time and quantity of returns. Moreover incentives, particularly leasingcontracts and changes in product design for easier disassembly and recovery of product/components, can result in a reduction of the residence time with subsequentbenefits as those previously mentioned for f ast used products. For example, theintroduction of leasing contracts or changes in product design, for which customers caneasily disassembly and return used product/components, can help in fixing the residencetime as well as reducing it. In the same way through such incentives, companies caninfluence customer behaviour in returning used products. Through deposit fees, freecollection or repurchase of used products, fees paid at the return of used products andparticularly appropriate product design, clear information/advertising about the reverse
logistics activities and environmental responsibilities can assist in increasing customerbehaviour towards the returns process.
7.1. MobileMuster and incentives to improve customer behaviour
MobileMuster is the official national recycling program of the mobile phone industry inAustralia (KPMG 2008). It is supported by the Australian Mobile TelecommunicationsAssociation (AMTA) which represents the national body of the mobiletelecommunications industry. The program is a free recycling project for mobile phoneusers with environmental and economical benefits through a solution which avoidslandfill activity and recovers material from used mobile phones. Project managers werecontacted in order to obtain data and information, not about the recycling program
(which is not topic of this study), but the influence of incentives on customers to return

8/2/2019 Inventory Control in Closed Loop Supply Chain Using System Dynamics
http://slidepdf.com/reader/full/inventory-control-in-closed-loop-supply-chain-using-system-dynamics 28/33
used products, customer behaviour and returns rate. These data were obtained from theannual report 2007-2008 of the organization (KPMG 2008). Several incentives andservice agreements with customers, retailers and other reverse logistics actors such aslocal councils and recyclers have been developed in order to increase returns/collection
rate and customer behaviour towards the return process. In particular, the focus is onfree used product collection from customers. This is achieved by distributing reply paidrecycling satchels available in selected mobile phones packs and establishing publiccollection points nationwide in retailers and Australian Post outlets. Other incentivesinclude customer communications and environmental campaigns about theMobileMuster program published in catalogues, on websites, through direct marketingand television advertising presented by mobile manufacturers, service centres andretailers. These activities have obtained varying results. Table 4 shows the evolution of particular KPIs for the MobileMuster program from the years 2005 to 2008. It isinteresting to notice that since 2005 the awareness of the recycling program, which canrepresent the consumer behaviour towards the reverse logistics program, has increased
from 46% to 75% and at the same time collection and collection rates have increased.The latter two factors can be representative of the quantity of returns and the returns rateof used mobile phones. Therefore, the incentives have affected the customer behaviourtowards the return process and consequently increased the returns rate and reduced thedisposal to landfill rate.
Table 4: Evolution of KPI for the MobileMuster program
Key Performance Indicators (KPI) 2007/08 2006/07 2005/06
Mobile Phone Collection (tonnes) 97 78 42
Annual Collection Rate 18.9% 18% 15%
Disposal to Landfill Rate 4% 5% 9%
Awareness of Mobile Phone Recycling (Consumer
Behaviour)75% 69% 46%
7.2. Fuji Xerox and incentives to the return process
Fuji Xerox is a leading global corporation which has achieved success through a re-investment of its business for remanufacturing the components of its office equipmentproducts (Benn and Dunphy, 2004). In Australia Fuji Xerox supplies and servicesdigital printing equipment such as printers, fax machines and photocopiers. Fuji Xeroxhas a reputation for market leading research and development and provides quality
colour and black and white printers for organizations of all sizes (EnvironmentProtection Authority 2002; Fuji Xerox Australia Pty Limited 2007b). Productremanufacturing is an integral part of the business for this company. In 2006, 220,000parts were remanufactured, saving Fuji Xerox in the order of $13 million in new partcosts and creating revenue of $5.4 million in exports (Fuji Xerox Australia Pty Limited2007a). Fuji Xerox Eco Manufacturing Centre in Zetland, Sydney, collects,disassembles and remanufactures used products so they can be reused through a processwhich uses less raw material and energy, reducing waste and disposal costs. The Centreremanufactures used parts and components, which are given the same guarantee as newproducts, for the Asia Pacific Region. According to the managers, the EcoManufacturing Centre focuses and deals only with remanufacturing activity. For this
8/2/2019 Inventory Control in Closed Loop Supply Chain Using System Dynamics
http://slidepdf.com/reader/full/inventory-control-in-closed-loop-supply-chain-using-system-dynamics 29/33
reason, predicting the quantity and timing of returns is essential in ensuring an efficientinventory and planning/scheduling of remanufacturing.Another company advantage of remanufacturing activity is the constant evaluation andtesting to which machines and components are subject. This leads to product
improvements and extension of product life which provides the opportunity toremanufacture components several times (Fuji Xerox 2007). Sub assemblies andcomponents are evaluated to identify reasons for failure or to determine the remaininglife of the part, through diagnostics tools which compare the signature of a used part tothat of a new part. Consequently, the latest generation of digital printers and copiers arebuilt in modular format where all modules are capable of being remanufactured. In thisway, remanufacturing activity can focus on modules with shorter residence time andeasier remanufacturability rather than the whole machines. This process leads to fasterrecovery of returns from customers and reduces uncertainty in quality and cycleprocessing time of returned products with a subsequent reduction of operating expenses.Also, customer-driven returns and training for assembly/disassembly of the modules are
services offered to the customers. These activities could lead to a more productive andcost effective system, through the guaranteed faster return of products/componentswhich leads to more simplified remanufacture planning, scheduling and controlling.Service agreements with customers is a company strategy employed by Fuji XeroxAustralia in order to reduce uncertainty in quantity of returns in production andinventory planning/scheduling. In Australia this company is mainly a service provider,supporting this service with its own leasing finance company (Benn and Dunphy, 2004).Following this, the objective of Eco Manufacturing Plant is to produce high qualitymachines and to recover used components for remanufacturing. For this reason, mostmachines are leased to customers. This allows Fuji Xerox to keep track of the quantityand location of equipment and to have control over the remanufacturing process andreturns rate (Fuji Xerox 2007).Moreover, Fuji Xerox managers believe full service agreement with customer is animportant strategy in the remanufacturing process. Fuji Xerox draws up a full serviceand maintenance agreement with customers whose response is usually to lease theproducts. The full service agreement has a number of targets including a marketingstrategy to increase service levels to the customer, a returns process strategy to increasecontrol of the quantity and timing of returns as well as the improvement of remanufacturing activity. The service is conducted by engineering teams that conductbreak down maintenance, when customers find the product is not working satisfactorily,and preventive maintenance of the products. According to Fuji Xerox managers, data
collection of these processes has led to continuous improvement of the basic productdesign and has resulted in a number of improvements. New machines are built for easierand faster disassembly, recovery and remanufacturing process. Durability of mainassemblies and sub assemblies, which are usually measured based on a possiblemaximum number of copies to be completed, is designed so as to replace bothcomponents at the same time. In this way, during preventive maintenance it is possibleto predict when it will be necessary to replace the assemblies for improved productperformance and when it will be necessary to replace them all together.
8. Conclusion
This study and its observations allow us to identify future research needs and provide
directions regarding the issue of uncertainty in quantity and timing of returns which

8/2/2019 Inventory Control in Closed Loop Supply Chain Using System Dynamics
http://slidepdf.com/reader/full/inventory-control-in-closed-loop-supply-chain-using-system-dynamics 30/33
affects the returns rate in Close Loop Supply Chains, particularly for inventory controlsystems in the remanufacturing process.A System Dynamics approach was used to model and simulate an inventory controlsystem for a remanufacturing process in the context of Closed Loop Supply Chain. The
returns rate was formulated using reverse logistics factors such as residence time (thetome period that products stay with customers) and return index (the quantity of possible returns from the customer demand). The return index was obtained by studyingthe relationship between the company incentives or service agreement developed torecover used products and the customer behaviour in returning them. Theremanufacturing system was implemented using a pull inventory strategy.By analysing total inventory costs, several observations were made regarding the effectsof the residence time and changes in the level of company incentives and the resultingcustomer behaviour. The main observation is that companies involved in theremanufacturing process can obtain efficiency in managing inventory through shorterresidence time and an increased level of company incentives and resultant customer
behaviour. This leads to a higher level of recoverable inventory on hand andconsequently the possibility of prompt remanufacturing as a substitute to productionactivity which in turn reduces the recoverable inventory level and its respective holdingcost.Moreover, company incentives for recovery of used products and customer behaviourhave significant influences on the uncertainty of returns rate and ultimately on totalinventory costs. Increasing company incentives or service agreement with customerswhich in turn increases customer behaviour in returning used products can improvecontrol of the returns rate. We employed two company case studies (MobileMuster andFuji Xerox Australia) to support our observation and findings. Specifically, Fuji XeroxAustralia uses incentives such as changes in product characteristics and leasing contractto reduce the residence time and improve control on returns rate. However, furtherinvestigations, particularly surrounding the assumptions considered in order to simplifythe analysis of the system, could be a topic for further research in the remanufacturingsector.
References
Angerhofer, B.J. and Angelides, M.C., 2000, 'System Dynamics Modelling in SupplyChain Management: Research Review', paper presented to 2000 Winter SimulationConference, UK.
Barlas, Y 1996, 'Formal aspects of model validity and validation in system dynamics ',System Dynamics Review vol. 12, no. 3, pp. 183-210.
Benn, S and Dunphy, D., 2004, 'A case study in strategic sustainability: Fuji Xerox EcoManufacturing Centre', Innovation: management, policy & practice vol. 6, no. 2, pp.258 - 68.
Blackburn, J.D., Jr, VDRG, Souza, G.C. and Wassenhove, LNV, 2004, 'Reverse SupplyChains for Commercial Returns', California Management Review vol. 46, no. 2, p. 6.Coyle, R.G. 1996, System dynamics modelling : a practical approach, Chapman &
Hall, London.

8/2/2019 Inventory Control in Closed Loop Supply Chain Using System Dynamics
http://slidepdf.com/reader/full/inventory-control-in-closed-loop-supply-chain-using-system-dynamics 31/33
de Brito, M.P. and Dekker, R. 2003, 'Modelling product returns in inventory control -Exploring the validity of general assumptions', International Journal of Production
Economics, vol. 81/82, p. 225.
de Brito, M.P., Dekker, R. and Flapper, S.D.P., 2004, Reverse Logistics: A Review of
Case Studies, European Commission, TMR project REVELOG.
Environment Protection Authority 2002, Case study: making products better than new,NSW Environment Protection Authority, Sydney,<http://www.p2pays.org/ref/04/03906.pdf>.
Flapper, S.D.P., Van Nunen, J. and Van Wassenhove, L., 2005, Managing closed-loop
supply chains Berlin ; New York : Springer, Heidelberg.
Fleischmann, M., Bloemhof-Ruwaard, J.M., Dekker, R., Van der Laan, E., Nunen, J.V.and Wassenhove, L.V., 1997, 'Quantitative models for reverse logistics: A review',
European Journal of Operational Research, vol. 103, no. 1, p. 1.
Forrester, JW 1958, 'Industrial Dynamics: A Major Breakthrough for Decision Makers', Harvard Business Review, vol. 36, no. 4, pp. 37-66.
---- 1961, Industrial dynamics, Productivity Press, Portland (OR).Department of the Environment and Heritage 2007, Eco-efficiency and cleaner
production case study, Fuji Xerox, Department of Environment and Water Resources.
Fuji Xerox Australia Pty Limited 2007a, 'Fuji Xerox Innovation Makes Business andEnvironmental Sense ', viewed 09 October 2007,<http://www.fujixerox.com.au/about/media/articles/546>.
---- 2007b, Fuji Xerox Overview, Fuji Xerox Australia Pty Limited, viewed 09 October2007, <http://www.fujixerox.com.au/about/>.
Georgiadis, P. and Vlachos, D., 2004a, 'Decision making in reverse logistics usingsystem dynamics', Yugoslav Journal of Operations Research, vol. 14, no. 2, pp. 259-72.
---- 2004b, 'The effect of environmental parameters on product recovery', European Journal of Operational Research vol. 157, no. 2, p. 449.
Georgiadis, P., Vlachos, D. and Tagaras, G., 2006, 'The Impact of Product Lifecycle onCapacity Planning of Closed-Loop Supply Chains with Remanufacturing', Production
and Operations Management , vol. 15, no. 4, p. 514.
Gray, C. and Charter, M., 2007, Remanufacturing and Product Design, Designing for
the 7th Generation The Centre for Sustainable Design, University College for theCreative Arts, Farnham, UK.Guide, VDR 2000, 'Production planning and control for remanufacturing: Industry
practice and research needs', Journal of Operations Management vol. 18, no. 4, p. 467.

8/2/2019 Inventory Control in Closed Loop Supply Chain Using System Dynamics
http://slidepdf.com/reader/full/inventory-control-in-closed-loop-supply-chain-using-system-dynamics 32/33
Inderfurth, K 2005, 'Impact of uncertainties on recovery behaviour in a remanufacturingenvironment: A numerical analysis', International Journal of Physical Distribution &
Logistics Management , vol. 35, no. 5, p. 318.
Kiesmuller, GP 2003, 'A new approach for controlling a hybrid stochasticmanufacturing/remanufacturing system with inventories and different leadtimes',
Journal of Operations Management , vol. 21, no. 3, p. 259.
Kiesmuller, G.P. and Minner, S., 2003, 'Simple expression for finding recovery systeminventory control parameter values', Journal of the Operational Research Society, vol.54, no. 1, pp. 83-8.
Koh, S.G., Hwang, H., Sohn, K.I. and Ko, C.S., 2002, 'An optimal ordering andrecovery policy for reusable items', Computers & Industrial Engineering vol. 43, no.
1,2, p. 59.
KPMG 2008, MobileMuster The official recycling program of the mobile phone
industry 2007-08 Annual Report , Australian Mobile Telecommunications Association,Sydney.
Kumar, S. and Yamaoka, T., 2007, 'System dynamics study of the Japanese automotiveindustry closed loop supply chain', Journal of Manufacturing Technology Management
vol. 18, no. 2, p. 115.
Rogers, D.S. and Tibben-Lembke, R., 2001, 'An examination of reverse logisticspractices', Journal of Business Logistics, vol. 22, no. 2, p. 129.
Sterman, JD 2000, Business dynamics: Systems thinking and modeling for a complex
world , McGraw-Hill, Burr Ridge, Illinois.
Tang, O., Grubbström, R.W. and Zanoni, S., 2007, 'Planned lead time determination in amake-to-order remanutacturing system ', International Journal of Production
Economics, vol. 108, no. 1/2, p. 426.
Teunter, RH 2001, 'Economic Ordering Quantities for Recoverable Item Inventory
Systems', Naval Research Logistics , vol. 48, p. 484.
Toktay, L.B., Wein, L.M. and Zenios, S.A., 2000, 'Inventory management of remanufacturable products', Management Science, vol. 46, no. 11, p. 1412.
van der Laan, E., Dekker, R. and Salomon, M., 1996, 'Product remanufacturing anddisposal: A numerical comparison of alternative control strategies', International
Journal of Production Economics, vol. 45, no. 1-3, p. 489.
van der Laan, E., Dekker, R., Salomon, M. and Ridder, A., 1996, 'An (s, Q) inventorymodel with remanufacturing and disposal', Int. J, Production Economics, vol. 46-47, pp.
339- 50.
8/2/2019 Inventory Control in Closed Loop Supply Chain Using System Dynamics
http://slidepdf.com/reader/full/inventory-control-in-closed-loop-supply-chain-using-system-dynamics 33/33
van der Laan, E. and Salomon, M., 1997, 'Production planning and inventory controlwith remanufacturing and disposal', European Journal of Operational Research, vol.102, no. 2, p. 264.
van der Laan, E., Salomon, M. and Dekker, R., 1999, 'An investigation of lead-timeeffects in manufacturing/remanufacturing systems under simple PUSH and PULLcontrol strategies', European Journal of Operational Research, vol. 115, no. 1, p. 195.
van der Laan, E.A. and Teunter, R.H., 2006, 'Simple heuristics for push and pullremanufacturing policies', European Journal of Operational Research, vol. 175, no. 2,p. 1084.
Vlachos, D., Georgiadis, P. and Iakovou, E., 2007, 'A system dynamics model fordynamic capacity planning of remanufacturing in closed-loop supply chains',
Computers & Operations Research, vol. 34, no. 2, p. 367.