influence of control strategy on fowt global performance by
TRANSCRIPT
Journal of Ocean and Wind Energy (ISSN 2310-3604) http://www.isope.org/publicationsCopyright © by The International Society of Offshore and Polar EngineersVol. 1, No. 1, February 2014, pp. 50–58
Influence of Control Strategy on FOWT Global Performance byAero-Elastic-Control-Floater-Mooring Coupled Dynamic Analysis
Yoon Hyeok Bae* and Moo-Hyun Kim*Department of Civil Engineering, Texas A&M University, College Station, TX, USA
More FOWTs (floating offshore wind turbines) are to be installed in the near future as relevant regulations and technologicalhurdles are reduced. In the present study, a numerical prediction tool has been developed for the fully coupled dynamicanalysis of FOWTs in time domain, including aero-loading, tower elasticity, blade-rotor dynamics and control, mooringdynamics, and platform motions, so that the influence of rotor-control dynamics on the hull-mooring performance and viceversa can be assessed. The developed coupled analysis program is applied to OC3-Hywind spar design with 5 MW turbine. Incase of spar-type floaters, the control strategy may significantly influence the hull, tower/blade, and mooring dynamics due tothe possibility of control-induced instability/resonance causing resonant hull motions. Therefore, it is important to use aproper control strategy without such problems at the penalty of slight overshoot in power outputs. In this regard, the globalperformances of two different control strategies—conventional and modified control strategies—are systematically compared tobetter understand the subtle coupling effects between the blade-pitch angle and shaft controls and hull motions. The developedtechnology and numerical tools are readily applicable to any types of floating wind farms in any combinations of irregularwaves, dynamic winds, and steady currents.
INTRODUCTION
Wind is the fastest-growing clean and renewable energy source.Until recently, most of the wind farm development has been limitedto the land space or shallow-water areas. However, there existseveral concerns regarding on-land or coastal fixed wind farms,such as lack of available space, noise restriction, shade, visualpollution, limited accessibility in mountainous areas, communityopposition, and regulatory problems.
In this regard, several countries started to plan floating offshorewind farms in deeper waters. Although they are considered tobe more difficult to design, wind farms in deeper waters are, ingeneral, less sensitive to space availability, noise restriction, visualpollution, and regulatory problems. They are also exposed to muchstronger and steadier wind field to be more effective. Furthermore,in designing those floating wind farms, the existing technology andexperience of offshore industry used for petroleum production isdirectly applicable.
For floating wind turbines, their natural frequencies of 6 DOFmotions are typically much lower than those rotor-induced or tower-flexibility-induced excitations, so the possibility of such dynamicresonance is small (Jonkman and Sclavounos, 2006; Withee, 2004).One exception is the TLP-type OWT (Bae et al., 2010; Jagdaleand Ma, 2010), which is much stiffer in the vertical-plane modescompared to other floating wind turbines, and thus the effects ofsuch high-frequency excitations from the tower and blades need tobe checked. For spar or semi-submersible floaters (Roddier et al.,2009), the low-frequency excitations related to blade-pitch-anglecontrol may cause large-amplitude slowly-varying resonant floatermotions (Nielsen et al., 2006). Therefore, the accurate estimationof the coupling effects between the floater dynamics and control-
*ISOPE Member.Received September 12, 2012; revised manuscript received by the editors
November 12, 2013. The original version was submitted directly to theJournal.
KEY WORDS: Renewable wind energy, floating offshore wind turbine,aero-elastic-control, floater-mooring coupled dynamics, control-inducedexcitation/resonance.
induced actuation forces is very important in the robust and optimaldesign of such floating OWTs (Bae and Kim, 2011; Karimirad andMoan, 2010).
In this regard, a rotor (aero-elastic-control)-floater-mooringcoupled dynamic analysis computer program is developed bycombining several modules. For the dynamic analysis and controlof wind turbine system, the primary design code of wind turbines,FAST, developed by National Renewable Energy Laboratory(NREL), is employed (Jonkman, 2003; Jonkman, 2007, 2008;Jonkman and Buhl Jr., 2004). The aero-rotor-tower program iscombined with the floater-mooring coupled dynamic analysisprogram, CHARM3D (Kim et al., 2001a; Kim et al., 2001b;Tahar and Kim, 2003; Yang and Kim, 2010). They are combinedand modified so that the whole system can be simultaneouslysolved in time domain by a big combined matrix, including allthe relevant coupling forces and degrees of freedom. As a result,the dynamic time histories of the whole system, including fullcouplings among tower, blade, drive train, floater, and mooring, canbe obtained simultaneously by a single run. The developed computerprogram is applied here to investigate the effects of respective blade-control strategies on the global responses, structural robustness, andgenerated power outputs of a 5 MW spar-type FOWT.
NUMERICAL ANALYSIS OF 5 MW FLOATING WINDTURBINE IN TIME DOMAIN
The time-domain simulation tool for rotor-floater-control-mooringfully coupled dynamic analysis is developed in this study, andit is applied to the 5 MW OC3-Hywind spar-type offshore windturbine system. In order to couple the wind-turbine aero-elastic-control analysis with the mooring/floater dynamics, two differentsimulation modules are combined to solve their coupling effectssimultaneously in a combined matrix of the entire system. Thecombined inertia matrix includes 6 DOF of platform motionsand 18 DOF of tower, rotor, and blade motions. The mooringdynamics are independently solved at each time step based on thefeedback of platform motions by a generalized-coordinate-based

Journal of Ocean and Wind Energy, Vol. 1, No. 1, February 2014, pp. 50–58 51
FEM floater-mooring program (PROG1) using high-order element(Kim et al., 2001b). So, two analysis modules are explicitly coupledat each coupled time step to simulate the dynamics of FOWTs,including a finite element mooring system. The hydrodynamiccoefficients, including added mass, radiation damping, wave forcesand second-order mean drift forces of floaters, are obtained by the3D diffraction/radiation preprocessor WAMIT in frequency domain(Lee et al., 1991). The obtained hydrodynamic and wave-loadingdata are then transformed to the time-domain forms by PROG1and fed into the aero-rotor-tower program (PROG2) as a platformloading input. For instance, the radiation damping part is convertedinto the convolution integral term in PROG1 and transferred toPROG2 at every coupled time step. The added mass matrix atinfinite frequency is also calculated by PROG1 and transferred toPROG2 at the initial step of the simulation.
The equation of floater motion in time domain can be expressedas follows:
6M +Ma4�57� +K� = FI 4t5+ Fc4t1 �5+ Fn4t1 �5+ Fm4t5 (1)
where M is floater mass, Ma4�5 denotes added mass at infinitefrequency, FI4t5 is wave-exciting force, K is hydrostatic restor-ing coefficients, Fn4t1 �5 is nonlinear drag force from Morison’sequation, Fm4t5 is mooring force, and Fc4t1 �5 is radiation force asfollows:
Fc4t1 �5= −
t∫
−�
R4t − �5�4�5d� (2)
�1 � and � represent the six degree-of-freedom displacements,velocities, and accelerations of the floating body. The retardationfunction R4t5 is given by:
R4t5=2�
�∫
0
b4�5 cos4�t5d� (3)
in which b is the linear radiation damping matrix. The completenonlinear aero-elastic equation of motion for the wind turbinemodel is:
M4q1u1 t5q + f 4q1 q1 u1ud1 t5= 0 (4)
where M is the mass matrix, f is the forcing function, u and ud arethe set of wind turbine control inputs and wind inputs, respectively.q, q, and q are the vectors of wind turbine motions, velocities, andaccelerations, respectively, and t is time.
The wind turbine dynamics, including 6 DOF platform dynamics,are computed by PROG2, which was developed by NREL. PROG1calculates all the external forces acting on the platform. At eachtime step, the latter feeds the external forces to the former. Then, theformer fills out the forcing function in Eq. 4, using forces from thelatter. The external forces, which are derived by the floater-mooringcoupled-analysis program, include first-order and second-order (ifapplicable) wave forces, wave radiation damping force, nonlinearviscous drag force from Morison members, and mooring-inducedrestoring forces. The mooring restoring force can be estimated bythe top tension of each mooring line and its directional cosine.Then, PROG2 solves the equations of motions of all the degrees offreedom. Those updated platform kinematic data, which includedisplacements and velocities, are then fed into the floater-mooringcoupled-analysis program to update external forces, which will befed again to PROG2 for the next time step. In this coupling process,
Fig. 1 Basic concept of PROG1-PROG2 hybrid model
the time steps between PROG2 and PROG1 are not necessarily thesame. For the present simulation, the time step of the PROG1-side is 0.05 s, and the internal time step for the PROG2-side is0.0125 s, which means that at every time interval of PROG1,PROG2 internally calculates 4 steps and returns the resultant datato PROG1. The results were checked against a more conservativecase with 0.0125 s on both sides. The basic concept of rotor-floatercoupling is schematically shown in Fig. 1. A possibly simplercoupling approach through transmitted forces and moments at thetower base was also experimented with in Shim and Kim (2008),and it was seen that it cannot fully account for the entire featuresof more complicated couplings between the rotor and floater.
The control system of the 5 MW wind turbine consists ofvariable-speed and variable-blade-pitch-to-feather controllers. Thetwo control strategies work together to produce quality power andkeep the whole system in good condition. Typical control strategiesof land-based turbines can be directly applicable to TLP-typeoffshore wind turbines without any significant modification dueto their limited rotational motions (Bae et al., 2011). However,in the case of spar-type offshore wind turbines, it is necessary tochange the control strategy to ensure smooth operation and higher-quality power generation. In this study, we will focus on the systemresponses and power outputs with two different control strategies: aconventional one used for land-based WT and a modified one forspar OWT. For the accurate estimation of the global performanceof the whole FOWT system with the respective control strategies, areliable rotor-floater-mooring coupled dynamic analysis tool isessential.
The adopted model of 5 MW turbine is the National RenewableEnergy Laboratory (NREL) offshore 5 MW baseline wind turbine,which has been adopted as the reference model for the integratedEuropean UpWind research program. The OC3-Hywind floatingplatform in this paper is the OC3-Hywind spar-buoy-type platform,which is slightly different from the actual OC3-Hywind spar designused by Statoil-Norway. The detailed specifications of the 5 MWturbine and OC3-Hywind spar are tabulated in Tables 1 to 3.(Jonkman, 2010).
The OC3-Hywind spar is moored by a system of three catenarylines. To increase the yaw stiffness of the platform, the lines areattached to the hull via delta connection. This delta-connectioneffect is included in the time-domain simulation by adding yawspring stiffness.
Item Unit Value
Hub height m 90.0Rotor diameter m 126.0Tower diameter (top) m 3.87Tower diameter (bottom) m 6.5Elevation to tower base above SWL m 10Elevation to tower top above SWL m 87.6Overall tower mass kg 249,718Turbine mass (tower + tower top) kg 599,718CM location of tower above SWL m 43.4
Table 1 Specifications of 5 MW turbine

52 Influence of Control Strategy on FOWT Global Performance by Aero-Elastic-Control-Floater-Mooring Coupled Dynamic Analysis
Item Unit Value
Depth to platform base below SWL m 120.0Elevation to platform top above SWL m 10Depth to top of taper below SWL m 4Depth to bottom of taper below SWL m 12Platform diameter above taper m 6.5Platform diameter below taper m 9.4Platform mass, including ballast kg 7,466,330CM location below SWL m 89.9155
Table 2 Specifications of OC3-Hywind spar platform
Item Unit Value
Number of mooring lines ea 3Angle between adjacent lines deg 120Depth to anchors below SWL m 320Depth to fairleads below SWL m 70.0Radius to anchors from centerline m 853.87Radius to fairleads from centerline m 5.2Unstretched mooring line length m 902.2Mooring line diameter m 0.09Mooring line mass density kg/m 77.7066Mooring line weight in water N/m 698.094Mooring line extensional stiffness N 384,243,000Additional yaw spring stiffness Nm/rad 98,340,000
Table 3 Specifications of OC3-Hywind spar mooring system
Fig. 2 Mooring-line arrangement
Each mooring line is modeled by 20 high-order finite elements,and its unstretched length is 902.2 m. Illustrations of mooring-line arrangement are shown in Fig. 2. The convergence of themooring-line dynamics with more cubic elements was also checked.
HYDRODYNAMIC COEFFICIENTS IN FREQUENCYDOMAIN
Wave forces and hydrodynamic coefficients for the submergedportion of the hull are calculated by using the potential-based3D diffraction/radiation panel program (Lee et al., 1991). Thesubmerged body has two planes of symmetry and each quadranthas 3900 panels. Second-order mean drift forces are also calculatedso that it can generate slowly-varying drift forces and motionsthrough Newman’s approximation method. The viscous drag forceof the hull is included by employing two Morison members forupper and lower sections. The drag coefficient CD is taken to be0.6, which is typical for a cylinder at high Reynolds numbers.
Mode rad/s Mode rad/s
Surge 0.05 Sway 0.05Heave 0.20 Roll 0.22Pitch 0.22 Yaw 0.71
Table 4 Natural frequencies of platform motions
The viscous loadings on Morison members are calculated at thebody’s instantaneous position up to the instantaneous free surface ateach time step. The wave particle kinematics above the MWL aregenerated by using uniform extrapolation technique. The nonlinearviscous drag forces also contribute to the nonlinear slowly-varyingmotions. The time-series generation of the input wave field and thecorresponding first-order wave frequency and second-order slowly-varying wave forces and spar motions is based on the two-termVolterra-series expansion (Kim and Yue, 1991). For the design ofoffshore floating platforms, 3-hour simulations are usually requiredfor the survival condition. However, in the case of FOWT design,1-hour simulation length is usually recommended.
The natural frequencies of the OC3-Hywind spar platform aregiven in Table 4. It is seen that all the natural frequencies are locatedbelow the lowest wave frequency of appreciable energy except theyaw mode. However, yaw motions will be small anyway due to theminimal wave-induced yaw moments on the vertical-cylinder hull.
The flexibility of tower is included by using a linear modalrepresentation, as suggested in PROG2. As shown in Fig. 3, twofore-aft and two side-to-side mode shapes of tower and two flap-wise modes and one edgewise mode of blades are used for coupleddynamic analysis. The natural frequencies of those elastic modes at17.11-m/s steady wind are tabulated in Table 5. The tower base islocated at 10-m height from the MWL, so the flexibility of towerbegins from that height.
Fig. 3 Normalized mode shapes of (a) tower fore-aft, (b) towerside-to-side and (c) blades
Mode rad/s
1st tower fore-aft mode 2.332nd tower fore-aft mode 16.221st tower side-to-side mode 2.312nd tower side-to-side mode 14.34Blade 1st flapwise 4.51Blade 2nd flapwise 12.63Blade 1st edgewise 6.86
Table 5 Natural frequencies of tower and blade at 17.11-m/ssteady wind

Journal of Ocean and Wind Energy, Vol. 1, No. 1, February 2014, pp. 50–58 53
Fig. 4 Two control strategies
TWO CONTROL STRATEGIES
For the NREL 5 MW turbine, two control systems are designedto work. A generator-torque controller and a blade-pitch controllerare applied in the below-rated and above-rated wind-speed range,respectively. The generator-torque controller is designed to maxi-mize power capture, and the blade-pitch controller is designed toregulate generator speed by gain-scheduled proportional-integral(PI) control. The schematic diagram of the two control strategies isdepicted in Fig. 4.
The controllers determine their feedback order, such as generatortorque of blade-pitch angle, by measuring the filtered shaft speed.The measured shaft speed is then compared with the target shaftspeed. The error between measured and target shaft speed can beexpressed as the equation of motion for the rotor-speed error:
[
IDrivetrain +1ì0
(
−¡P
¡�
)
NGearKd
]
�
+
[
1ì0
(
−¡P
¡�
)
NGearKp −P0
ì20
]
�
+
[
1ì0
(
−¡P
¡�
)
NGearKi
]
� = 0 (5)
where IDrivetrain is a drivetrain inertia, and P and P0 are mechanicalpower and rated mechanical power, respectively. � is a full-spanrotor-collective blade-pitch angle and ì0 is a rated low-speed shaftrotational speed. ¡P/¡� stands for a sensitivity of aerodynamicpower to rotor-collective blade pitch. Kp, Ki and Kd are theblade-pitch controller proportional, integral, and derivative gains,respectively. It is seen that the rotor-speed error responds with thenatural frequency of ��n:
��n =
√
√
√
√
√
√
√
1ì0
(
−¡P
¡�
)
NGearKi
IDrivetrain +1ì0
(
−¡P
¡�
)
NGearKd
(6)
The platform pitch motion associated with the rotor thrust forcedetermined by the above equation can also be expressed as:
6IMass + IAdded7� + 6BRadiation +BViscous7�
+ 6CHydrostatic +CMooring7� = LHHT (7)
where � is the platform pitch angle, IMass is the pitch inertia, IAdded
is the pitch added inertia, BRadiation is the pitch radiation damping,BViscous is the linearized pitch damping, CHydrostatic is the pitchhydrostatic coefficient, CMooring is the linearized pitch mooringrestoring coefficient, T is the aerodynamic rotor thrust, and LHH
is the hub height. Equation 7 can be rewritten in terms of thetranslational motion of the hub x as:[
IMass + IAdded
L2HH
]
x+
[
BRadiation +BViscous
L2HH
+¡T
¡V
]
x
+
[
CHydrostatic +CMooring
L2HH
]
x = T0
(8)
where T0 is the aerodynamic rotor thrust at a linearization point,and V is the rotor-disk-averaged wind speed. Then, the platformpitch natural frequency can be expressed as:
�xn =
√
CHydrostatic +CMooring
IMass + IAdded(9)
If the controller-response natural frequency ��n in Eq. 6 is greaterthan the platform pitch natural frequency �xn in Eq. 9, there isa possibility of negative damping of the platform pitch motion(Larsen and Hanson, 2007). To avoid the platform pitch resonance,the controller-response natural frequency ��n should be reducedso that the motions of the floating platform with controlled windturbine remain positively damped. For the 5 MW baseline, NRELrecommended the optimal gain values of proportional (Kp =
0001882681s) and integral (Ki = 00008068634) gains at minimumblade-pitch setting for the baseline wind turbines. The derivativegain Kd is set to zero because it gives better performance thanother values. Based on these gains, the blade-pitch control systemuses a new gain, according to the blade-pitch angle input. Note thatthe negative damping represented by −P0/ì
20 term is introduced in
the speed error response, and it should be compensated by theproportional gain in the blade-pitch controller.
MODIFICATION OF CONTROL STRATEGIES
The blade-pitch response of this control strategy can be evaluatedfor a land-based turbine. The step variation of input wind speed isapplied to the land-based turbine, and the response of blade-pitchangle is investigated. The current control parameter (conventionalcontrol strategy) gives very fast and accurate response of blade-pitch angle. This strategy is very good for a land-based turbine orTLP-type offshore wind turbine, since they have minimal rotationalmotions and very high-pitch natural frequencies (Bae and Kim,2011). However, if the pitch/roll natural frequency of a floatingplatform is low and close to the pitch-angle-actuator frequency, suchas with spar-type or semisubmersible-type FOWTs, the interactionbetween platform-pitch motion and the variation of thrust force dueto the blade-pitch control action may cause serious resonance. Inorder to avoid this resonance, the pitch-angle-actuator frequencymust be lowered by detuning the gain values, as pointed out earlier.
In Fig. 5b, the pitch angle of conventional control reaches itstarget pitch angle very quickly in response to the variation of stepinput wind speed. If we reduce the gain values, then the overallreaction of the pitch-angle actuator is changed. It takes longerto reach the target pitch angle, and the gradient of pitch-angle
Fig. 5 (a) Step wind input and (b) blade-pitch angle (land-based)
54 Influence of Control Strategy on FOWT Global Performance by Aero-Elastic-Control-Floater-Mooring Coupled Dynamic Analysis
Fig. 6 (a) Generator torque and (b) generator power (land-based)
variation is small compared to that of conventional control. When itcomes to the control quality, the conventional control shows largertransient overshoot in lower wind-speed range, while the modifiedgain control shows relatively smaller or no transient overshoots.
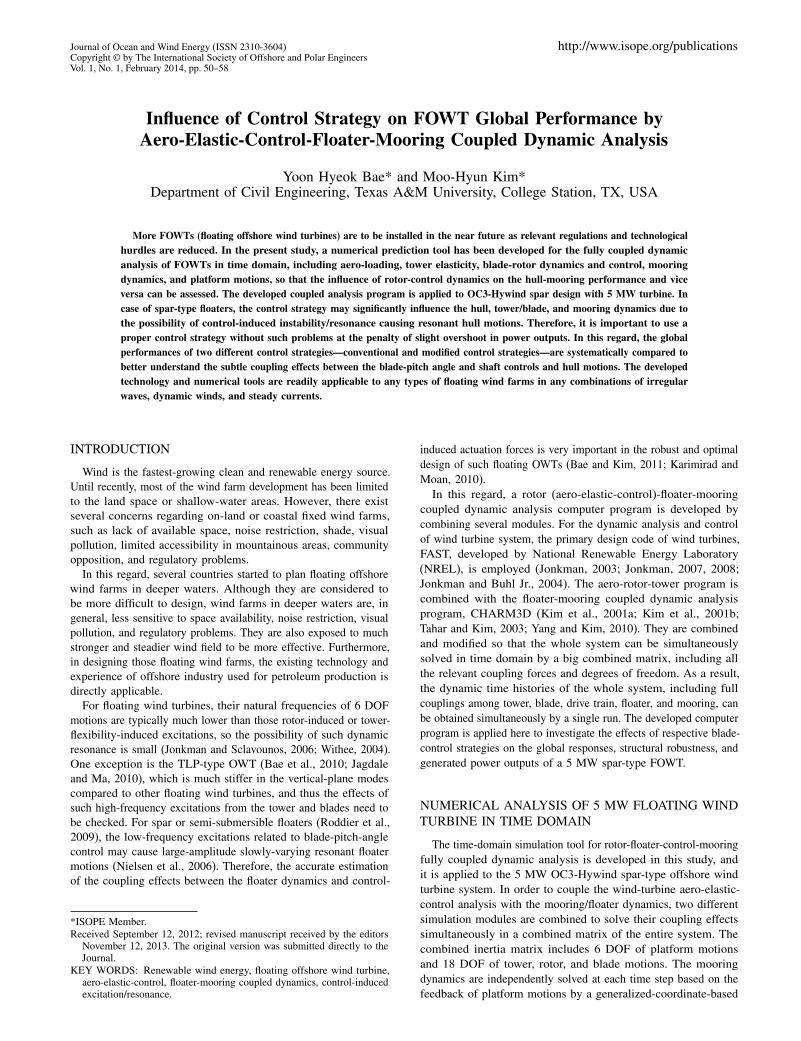
In addition to this detuned-gain modification, the negativedamping term can also be reduced to zero if the variable-speed-torque control changes Region 3 from a constant generator powerto a constant generator torque. Region 3 is one of the controlregions, where the generator torque is computed as a tabulatedfunction of the filtered generator speed and originally designed toproduce a constant generator power. This modification may reducethe negative damping term of the speed-error equation, but it couldalso affect the quality of generated power output. With the samestep variation of input wind speed, and keeping the same gainvalues, the trends of conventional and constant-torque control arecompared.
Figure 6a shows that the modification of Region 3 producesconstant generator torque regardless of the change of input windspeed. However, the generated power has relatively larger overshootat every initial stage of wind-speed variation compared to theconventional-control case. This kind of power surge may havenegative effects on the generator or other electric devices in theturbine.
The two modifications of control strategy explained earlier are,in fact, not necessary for the land-based or TLP-type wind turbines,as already pointed out. However, in the case of OC3-Hywind spar,the modifications are quite essential since the hull motions can begreatly amplified without them. This is particularly so since theconventional-control-induced excitation frequencies are very closeto the surge/sway and roll-pitch natural frequencies. However, bymodifying the control strategy as explained above, the detrimentalresonance effects can be avoided. In order to see the effects ofmodifications on OC3-Hywind spar, similar tests are carried outwith the same step wind input.
Figure 7b shows the comparison of the pitch-angle variationbetween the conventional and modified control strategies. We cansee that the pitch angle changes very hastily with significantlyamplified amplitudes with the conventional-control strategy. Theconventional-control-induced excitation frequencies are very closeto the pitch natural frequency of OC3-Hywind spar.
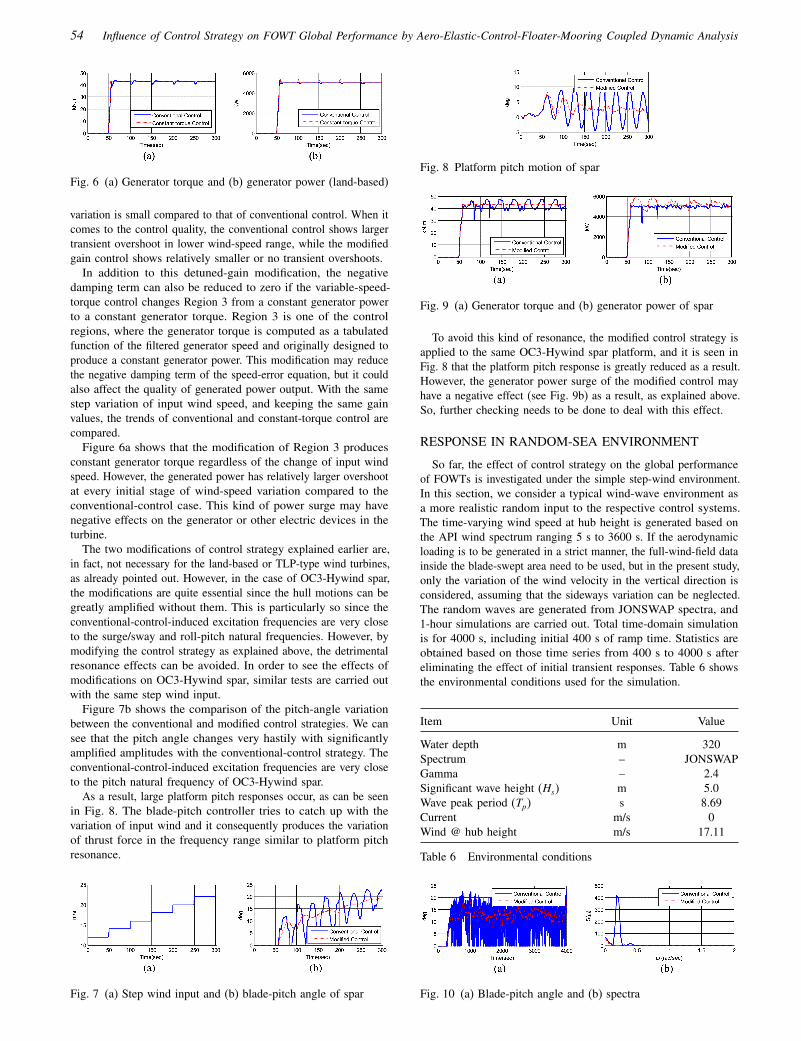
As a result, large platform pitch responses occur, as can be seenin Fig. 8. The blade-pitch controller tries to catch up with thevariation of input wind and it consequently produces the variationof thrust force in the frequency range similar to platform pitchresonance.
Fig. 7 (a) Step wind input and (b) blade-pitch angle of spar
Fig. 8 Platform pitch motion of spar
Fig. 9 (a) Generator torque and (b) generator power of spar
To avoid this kind of resonance, the modified control strategy isapplied to the same OC3-Hywind spar platform, and it is seen inFig. 8 that the platform pitch response is greatly reduced as a result.However, the generator power surge of the modified control mayhave a negative effect (see Fig. 9b) as a result, as explained above.So, further checking needs to be done to deal with this effect.
RESPONSE IN RANDOM-SEA ENVIRONMENT
So far, the effect of control strategy on the global performanceof FOWTs is investigated under the simple step-wind environment.In this section, we consider a typical wind-wave environment asa more realistic random input to the respective control systems.The time-varying wind speed at hub height is generated based onthe API wind spectrum ranging 5 s to 3600 s. If the aerodynamicloading is to be generated in a strict manner, the full-wind-field datainside the blade-swept area need to be used, but in the present study,only the variation of the wind velocity in the vertical direction isconsidered, assuming that the sideways variation can be neglected.The random waves are generated from JONSWAP spectra, and1-hour simulations are carried out. Total time-domain simulationis for 4000 s, including initial 400 s of ramp time. Statistics areobtained based on those time series from 400 s to 4000 s aftereliminating the effect of initial transient responses. Table 6 showsthe environmental conditions used for the simulation.
Item Unit Value
Water depth m 320Spectrum – JONSWAPGamma – 2.4Significant wave height (Hs) m 5.0Wave peak period (Tp) s 8.69Current m/s 0Wind @ hub height m/s 17.11
Table 6 Environmental conditions
Fig. 10 (a) Blade-pitch angle and (b) spectra

Journal of Ocean and Wind Energy, Vol. 1, No. 1, February 2014, pp. 50–58 55
Fig. 11 (a) Shaft thrust force and (b) spectra
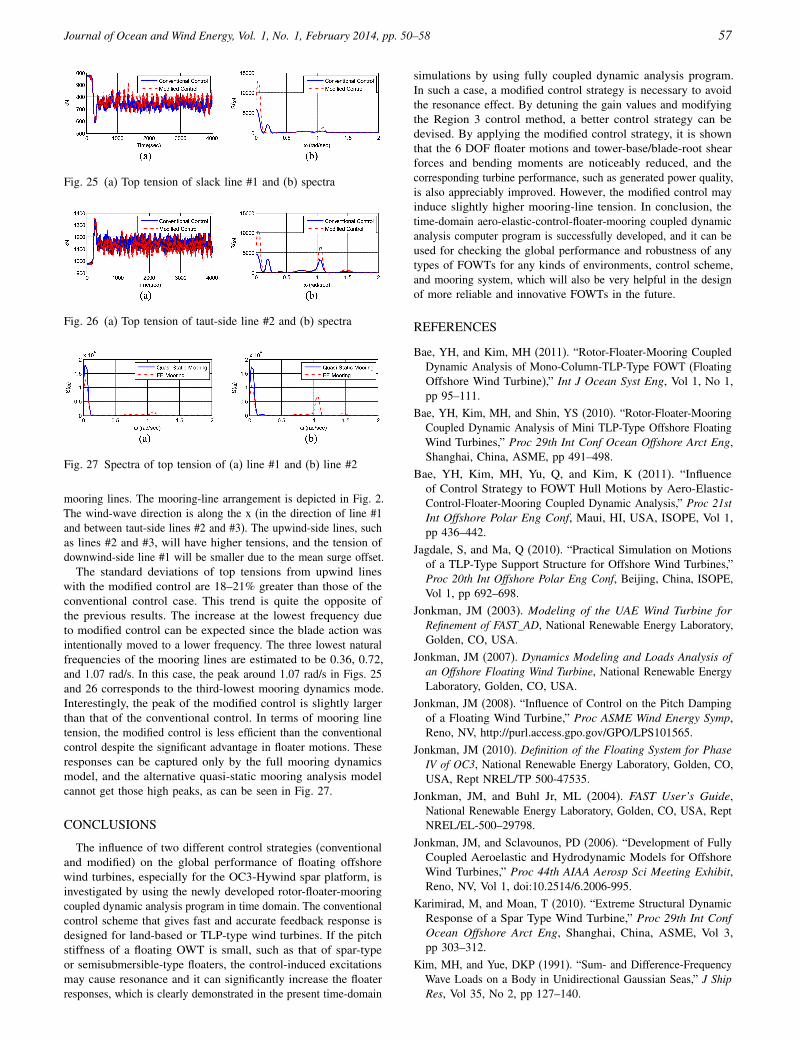
In Fig. 10, the solid line shows the variation of blade-pitch angleas a result of applying the conventional control strategy. It shows alot of fluctuations. From time to time, blade-pitch angle hits 0deg, which means the controller tries to capture a maximum liftforce from the blade. This random pitch-angle action is mostlyconcentrated in the frequency range between 0015∼0023 rad/s.The frequency range coincides with the pitch/roll/heave naturalfrequencies of OC3-Hywind spar (see Table 4). So, it is expectedthat large pitch/heave motions will occur as a result of the blade-pitch-angle control.
The corresponding time history of the thrust force measured atthe low-speed shaft point is given by the solid line in Fig. 11. Atthis point, the thrust force is affected by the aerodynamic force,which is regulated by the blade-pitch controller. The trend is verysimilar to the blade-pitch-angle variation. The high peak is alsoshown at the same frequency range.
If the two modifications are applied to the retuned control system,the duty cycle of blade-pitch is reduced noticeably, as can be seenin the dotted line in Fig. 10. The actuation frequency is much lowerthan the pitch-roll-heave resonance frequencies. The resulting pitchmotions will be smaller, so the blade-pitch controller needs to spendless effort to adjust. Compared to the conventional control case inFig. 10b, the peak frequency is located at a much smaller frequency.The resulting shaft-thrust forces are also plotted in Fig. 11.
The major contribution of the thrust force is aerodynamic loading.The thrust force directly affects the floater pitch motion. In thecase of conventional control, the blade-action-induced thrust forceis again greatly amplified in the range of 0015∼0023 rad/s by thesame reason. The harmful resonance disappears when modifiedcontrol scheme is applied, as shown in Fig. 11.
The same kind of improvement of performance can also be seenin the 6 DOF platform motions (Figs. 12 to 17) by applying themodified control strategy. Without such modification, the platformmotions become too large, especially in heave and pitch modes,
Fig. 12 (a) Surge motion and (b) spectra for two control strategies
Fig. 13 (a) Sway motion and (b) spectra for two control strategies
Fig. 14 (a) Heave motion and (b) spectra for two control strategies
Fig. 15 (a) Roll motion and (b) spectra for two control strategies
Fig. 16 (a) Pitch motion and (b) spectra for two control strategies
Fig. 17 (a) Yaw motion and (b) spectra for two control strategies
so they are not acceptable in design. The sway-roll-yaw are alsoappreciably influenced by the blade-control action. The resultstypically illustrate that the blade-control scheme strongly influencesplatform motions, and the phenomenon can only be simulated byuse of a rotor-floater-mooring, fully-coupled time-domain simulationprogram. The same phenomenon has also been observed in theexperiment with spar-type FOWT (Nielsen et al., 2006).
Gyroscopic effect can also be seen in the case of conventionalcontrol in Fig. 17. This gyroscopic yaw moment comes not fromthe aerodynamic loads on the rotor but from the spinning inertia ofthe rotor combined with large pitch motion.
Table 7 shows the statistics of the OC3-Hywind spar motion in thegiven random environment. All 6 DOF motions with conventionalcontrol strategy show very large maximum and standard-deviationvalues due to the control-actuated pitch/heave resonance.
The comparisons of the rotor speed and generated power outputbetween the two cases are also shown in Figs. 18 and 19. Therotor speed with conventional control is also greatly affected byplatform pitch resonance combined with the blade-pitch actuation,and the power output from the conventional control has a lot ofpower drops during the simulation time. The reason for this suddendrop is the instantaneous reduction of the relative wind speed dueto large pitch-backward motions. Thus, the time frame of thesesudden drops coincides with that of 0-deg blade-pitch angle. Inthe case of the modified control, the number and range of powerdrops are significantly reduced but nontrivial power overshoot also

56 Influence of Control Strategy on FOWT Global Performance by Aero-Elastic-Control-Floater-Mooring Coupled Dynamic Analysis
Max Min Mean SD
Surge (m) C 2.76E+01 2.21E+00 1.39E+01 6.76E+00M 1.87E+01 6.52E+00 1.22E+01 1.98E+00
Sway (m) C 5.38E−01 −2.09E+00 −7.03E−01 5.44E−01M −3.64E−01 −1.02E+00 −6.34E−01 1.17E−01
Heave (m) C 4.83E+00 −4.74E+00 −5.04E−01 2.84E+00M 1.71E−01 −9.21E−01 −3.64E−01 1.75E−01
Roll (deg) C 1.52E+00 −6.08E−01 3.84E−01 4.36E−01M 4.03E−01 1.97E−01 2.97E−01 3.44E−02
Pitch (deg) C 1.30E+01 −5.79E+00 3.26E+00 5.55E+00M 5.05E+00 6.78E−01 2.74E+00 7.10E−01
Yaw (deg) C 1.56E+00 −3.08E+00 1.77E−02 9.48E−01M 3.41E−01 −4.95E−01 −9.38E−02 1.11E−01
Table 7 Statistics of platform motions (C = conventional control;M = modified control)
Fig. 18 (a) Rotor speed and (b) spectra
Fig. 19 (a) Generator power and (b) spectra
exists as a minor side effect. Nevertheless, the overall quality ofthe generated power with the modified control strategy is muchbetter than that of the other case.
The fore-aft shear force, axial force, and fore-aft bending momentat the tower base (Figs. 20 to 22) are important to the structuraldesign of a tower. The general tendency of the time histories ofthe shear, axial forces, and bending moment at the tower base is
Fig. 20 (a) Tower-base fore-aft shear force and (b) spectra
Fig. 21 (a) Tower-base axial force and (b) spectra
Fig. 22 (a) Tower-base fore-aft bending moment and (b) spectra
similar to that of platform motions. It is seen that large forcesand moments are transferred to the position in the case of theconventional control, and the location of the peak is consistent withthat of platform motions. The maximum shear force and bendingmoment with the conventional control are over 70% higher thanthose of the modified control. The higher standard deviation of theshear force means more vulnerability to the fatigue failure. It mayhappen when the blade control system is poorly designed. Thenegative sign of axial force stands for the compression force thatmay be a concern for buckling failure.
The structural loading on the blade root location is also investi-gated in this study. Since the configuration of the blades attachedto the rotor hub is a kind of cantilever beam, the highest shearforce and bending moment are expected at the blade-root location.Based on the elastic blade configurations, two shear forces, flapwiseand edgewise, at the root location are selected for comparison, asshown in Figs. 23 and 24.
In frequency domain, the flapwise shear force with conventionalcontrol shows high peak around platform pitch resonance frequencyand small peaks around 1P (blade rpm) frequency of 1.27 rad/s. Incase of modified control, 1P frequency is dominant.
In the case of edgewise direction in Fig. 24, the shear forceis more strongly associated with the rotation of the blade. Thisshear force shows a clear peak at the 1P frequency. The shearforces in frequency domain show a different trend between the twocontrol strategies. The modified control shows smoother transitionaround 1P frequency, while the conventional control shows sharperand higher peaks at 1P frequency with minor peaks nearby. Thesedifferences are mostly due to the different actuator speed of bladepitch, which results in smooth transition with low-speed actuator(modified) and sharper transition with rapid actuator (conventional).The maximum flapwise shear force with the conventional control isaround 39% greater than that of the modified control.
The differences in hull motions between the conventional controland modified control directly affect the top-tension statistics of
Fig. 23 (a) Flapwise shear force at blade root and (b) spectra
Fig. 24 (a) Edgewise shear force at blade root and (b) spectra
Journal of Ocean and Wind Energy, Vol. 1, No. 1, February 2014, pp. 50–58 57
Fig. 25 (a) Top tension of slack line #1 and (b) spectra
Fig. 26 (a) Top tension of taut-side line #2 and (b) spectra
Fig. 27 Spectra of top tension of (a) line #1 and (b) line #2
mooring lines. The mooring-line arrangement is depicted in Fig. 2.The wind-wave direction is along the x (in the direction of line #1and between taut-side lines #2 and #3). The upwind-side lines, suchas lines #2 and #3, will have higher tensions, and the tension ofdownwind-side line #1 will be smaller due to the mean surge offset.
The standard deviations of top tensions from upwind lineswith the modified control are 18–21% greater than those of theconventional control case. This trend is quite the opposite ofthe previous results. The increase at the lowest frequency dueto modified control can be expected since the blade action wasintentionally moved to a lower frequency. The three lowest naturalfrequencies of the mooring lines are estimated to be 0.36, 0.72,and 1.07 rad/s. In this case, the peak around 1.07 rad/s in Figs. 25and 26 corresponds to the third-lowest mooring dynamics mode.Interestingly, the peak of the modified control is slightly largerthan that of the conventional control. In terms of mooring linetension, the modified control is less efficient than the conventionalcontrol despite the significant advantage in floater motions. Theseresponses can be captured only by the full mooring dynamicsmodel, and the alternative quasi-static mooring analysis modelcannot get those high peaks, as can be seen in Fig. 27.
CONCLUSIONS
The influence of two different control strategies (conventionaland modified) on the global performance of floating offshorewind turbines, especially for the OC3-Hywind spar platform, isinvestigated by using the newly developed rotor-floater-mooringcoupled dynamic analysis program in time domain. The conventionalcontrol scheme that gives fast and accurate feedback response isdesigned for land-based or TLP-type wind turbines. If the pitchstiffness of a floating OWT is small, such as that of spar-typeor semisubmersible-type floaters, the control-induced excitationsmay cause resonance and it can significantly increase the floaterresponses, which is clearly demonstrated in the present time-domain
simulations by using fully coupled dynamic analysis program.In such a case, a modified control strategy is necessary to avoidthe resonance effect. By detuning the gain values and modifyingthe Region 3 control method, a better control strategy can bedevised. By applying the modified control strategy, it is shownthat the 6 DOF floater motions and tower-base/blade-root shearforces and bending moments are noticeably reduced, and thecorresponding turbine performance, such as generated power quality,is also appreciably improved. However, the modified control mayinduce slightly higher mooring-line tension. In conclusion, thetime-domain aero-elastic-control-floater-mooring coupled dynamicanalysis computer program is successfully developed, and it can beused for checking the global performance and robustness of anytypes of FOWTs for any kinds of environments, control scheme,and mooring system, which will also be very helpful in the designof more reliable and innovative FOWTs in the future.
REFERENCES
Bae, YH, and Kim, MH (2011). “Rotor-Floater-Mooring CoupledDynamic Analysis of Mono-Column-TLP-Type FOWT (FloatingOffshore Wind Turbine),” Int J Ocean Syst Eng, Vol 1, No 1,pp 95–111.
Bae, YH, Kim, MH, and Shin, YS (2010). “Rotor-Floater-MooringCoupled Dynamic Analysis of Mini TLP-Type Offshore FloatingWind Turbines,” Proc 29th Int Conf Ocean Offshore Arct Eng,Shanghai, China, ASME, pp 491–498.
Bae, YH, Kim, MH, Yu, Q, and Kim, K (2011). “Influenceof Control Strategy to FOWT Hull Motions by Aero-Elastic-Control-Floater-Mooring Coupled Dynamic Analysis,” Proc 21stInt Offshore Polar Eng Conf, Maui, HI, USA, ISOPE, Vol 1,pp 436–442.
Jagdale, S, and Ma, Q (2010). “Practical Simulation on Motionsof a TLP-Type Support Structure for Offshore Wind Turbines,”Proc 20th Int Offshore Polar Eng Conf, Beijing, China, ISOPE,Vol 1, pp 692–698.
Jonkman, JM (2003). Modeling of the UAE Wind Turbine forRefinement of FAST_AD, National Renewable Energy Laboratory,Golden, CO, USA.
Jonkman, JM (2007). Dynamics Modeling and Loads Analysis ofan Offshore Floating Wind Turbine, National Renewable EnergyLaboratory, Golden, CO, USA.
Jonkman, JM (2008). “Influence of Control on the Pitch Dampingof a Floating Wind Turbine,” Proc ASME Wind Energy Symp,Reno, NV, http://purl.access.gpo.gov/GPO/LPS101565.
Jonkman, JM (2010). Definition of the Floating System for PhaseIV of OC3, National Renewable Energy Laboratory, Golden, CO,USA, Rept NREL/TP 500-47535.
Jonkman, JM, and Buhl Jr, ML (2004). FAST User’s Guide,National Renewable Energy Laboratory, Golden, CO, USA, ReptNREL/EL-500–29798.
Jonkman, JM, and Sclavounos, PD (2006). “Development of FullyCoupled Aeroelastic and Hydrodynamic Models for OffshoreWind Turbines,” Proc 44th AIAA Aerosp Sci Meeting Exhibit,Reno, NV, Vol 1, doi:10.2514/6.2006-995.
Karimirad, M, and Moan, T (2010). “Extreme Structural DynamicResponse of a Spar Type Wind Turbine,” Proc 29th Int ConfOcean Offshore Arct Eng, Shanghai, China, ASME, Vol 3,pp 303–312.
Kim, MH, and Yue, DKP (1991). “Sum- and Difference-FrequencyWave Loads on a Body in Unidirectional Gaussian Seas,” J ShipRes, Vol 35, No 2, pp 127–140.

58 Influence of Control Strategy on FOWT Global Performance by Aero-Elastic-Control-Floater-Mooring Coupled Dynamic Analysis
Kim, MH, Ran, ZH, and Zheng, WH (2001a). “Hull/MooringCoupled Dynamic Analysis of a Truss Spar in Time Domain,”Int J Offshore Polar Eng, Vol 11, No 1, pp 42–54.
Kim, MH, Tahar, A, and Kim, YB (2001b). “Variability ofTLP Motion Analysis Against Various Design Methodolo-gies/Parameters,” Proc 11th Int Offshore Polar Eng Conf,Stavanger, Norway, ISOPE, Vol 1, pp 467–473.
Larsen, TJ, and Hanson, TD (2007). “A Method to Avoid Nega-tive Damped Low Frequent Tower Vibrations for a Floating,Pitch Controlled Wind Turbine,” J Phys: Conf Ser, Vol 75,p 11.
Lee, C, Newman, J, Kim, M, and Yue, D (1991). “The Computationof Second-Order Wave Loads,” Proc 10th Int Conf OffshoreMech Arct Eng, Stavanger, Norway, ASME, Vol 1, pp 113–123.
Nielsen, FG, Hanson, TD, and Skaare, B (2006). “IntegratedDynamic Analysis of Floating Offshore Wind Turbines,” Proc25th Int Conf Offshore Mech Arct Eng, Hamburg, Germany,ASME, Vol 1, pp 671–679.
Roddier, D, Cermelli, C, and Weinstein, A (2009). “Windfloat:A Floating Foundation for Offshore Wind Turbines Part I:Design Basis and Qualification Process,” Proc 28th Int ConfOcean Offshore Arct Eng, Honolulu, HI, USA, ASME, Vol 1,pp 845–853.
Shim, S, and Kim, MH (2008). “Rotor-Floater-Tether CoupledDynamic Analysis of Offshore Floating Wind Turbines,” Proc18th Int Offshore Polar Eng Conf, Vancouver, Canada, ISOPE,Vol 1, pp 455–460.
Tahar, A, and Kim, MH (2003). “Hull/Mooring/Riser CoupledDynamic Analysis and Sensitivity Study of a Tanker-BasedFPSO,” J Appl Ocean Res, Vol 25, No 6, pp 367–382.
Withee, JE (2004). Fully Coupled Dynamic Analysis of a FloatingWind Turbine System, PhD Thesis, Massachusetts Institute ofTechnology, Cambridge, MA, USA.
Yang, CK, and Kim, MH (2010). “Transient Effects of TendonDisconnection of a TLP by Hull–Tendon–Riser Coupled DynamicAnalysis,” J Ocean Eng, Vol 37, No 8, pp 667–677.
Proceedings of the 10th (2013) ISOPEOcean Mining & Gas Hydrates Symposium
Szczecin, Poland, September 22–26, 2013
DEEP-OCEAN MINERALS AND PROCESSING, EXPLORATION ANDENVIRONMENT, DEEP-OCEAN MINING SYSTEMS AND TECHNOLOGY(Mining Systems, Ship, Pipe, Nodule Lift, Buffer, Link, Oceanfloor Miner, andMiner Control)
GAS HYDRATES (Fundamentals, Properties, Geotechnical and GeochemicalCharacteristics, Development)
The Proceedings (ISBN 978-1-880653-92-0; ISSN 1946-0066): $100 (ISOPE Member: $80)in a single volume (CD-ROM) is available from www.isope.org or www.deepoceanmining.org,ISOPE, P.O. Box 189, Cupertino, California 95015-0189, USA (Fax +1-650-254-2038;[email protected])