intrum investor presentation · cms service line margins excl nri's, % 25 27 -2 ppt portfolio...
TRANSCRIPT

Intrum Investor presentation “Leading the way to a sound economy”

© Intrum Justitia AB (publ) 2018 All rights reserved.
This is Intrum Europe’s leading credit management company
• Balanced business model with a holistic client service offering
• Diversification with local presence in 24 markets
• Strong operational performance and consistent financial returns
Intrum Key Metrics – Q1 2018 LTM Pro Forma (SEKm)
Cash EBITDA (excl. NRIs1) 8,421
Employees >8,000
1 Non-recurring items.
Net revenue 12,406
2
Top five
Other
Market leader

© Intrum Justitia AB (publ) 2018 All rights reserved.
Intrum benefits from clear competitive advantages
Capital structure Ample liquidity and low cost of debt
Risk culture Embedded principles and robust processes
Capabilities Full service offering across debt servicing and purchasing
Diversification Access to multiple asset classes and industry verticals across 24 markets
Scale Greater relevance and operational efficiencies
• Trusted preferred partner to clients
• Significant financial flexibility
• Attractive risk profile
3

Current Performance highlights

Highlights from 2017 and Q1 2018
5
• Approval from the EU authorities to merge with Lindorff, subject to certain remedies
• Successful refinancing of the merged entity
• New corporate identity and brand – Intrum
• Strong business momentum – record high Portfolio Investments and numerous acquisitions
• Established market leading position in Italy
• Presentation of 2018-2020 strategy and updated financials targets
2017
Solid start to 2018
• EBIT excl. NRI and excl. Revaluations up 10% year on year
• Continued good progress on integration – SEK 280 million cost synergies realized so far, well in line to reach the
target for 2018
• Remedy units divested at attractive valuation
• Strong pipeline for portfolio investments and good opportunities in CMS
• Transformational partnership with Intesa Sanpaolo in Italy announced in April
© Intrum Justitia AB (publ) 2018 All rights reserved.
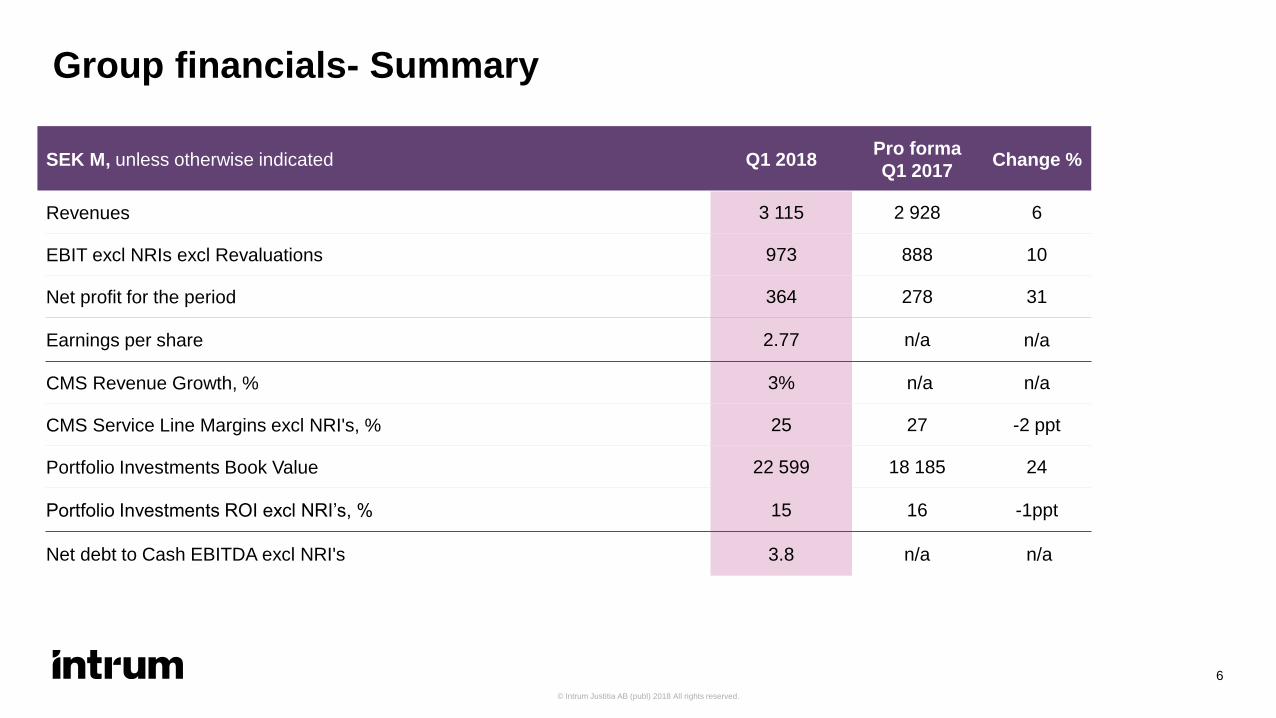
Group financials- Summary
6
SEK M, unless otherwise indicated Q1 2018 Pro forma
Q1 2017 Change %
Revenues 3 115 2 928 6
EBIT excl NRIs excl Revaluations 973 888 10
Net profit for the period 364 278 31
Earnings per share 2.77 n/a n/a
CMS Revenue Growth, % 3% n/a n/a
CMS Service Line Margins excl NRI's, % 25 27 -2 ppt
Portfolio Investments Book Value 22 599 18 185 24
Portfolio Investments ROI excl NRI’s, % 15 16 -1ppt
Net debt to Cash EBITDA excl NRI's 3.8 n/a n/a

© Intrum Justitia AB (publ) 2018 All rights reserved.
Explicit initiatives to reach long term targets - Examples from three countries
7
• Reduction of around 400 FTEs
• Around 50 FTEs transferred to low cost service centers
• 18 office locations closed
• Reduction of approximately 50 FTEs
• New premises in Amsterdam, close the two existing
• Staff reductions supported by positively received voluntary program
• Review of client focus and profitability
• Excess office space rented out
• Divestment of non-core portfolios
• Expected run-rate cost savings of EUR 10 million p.a. by end 2018
Spain
Netherlands
Poland
• Taking advantage of market growth opportunities through focus and efficiency
• Robotics for automated collection services under development
• Consolidation of production systems and IT platforms

A clear strategic plan to deliver our targets

© Intrum Justitia AB (publ) 2018 All rights reserved.
Intrum 2020 – Committed to deliver strong shareholder value Financial targets for 2018-2020
EPS growth • Central driver for shareholder value creation – highly correlated with
total shareholder returns
• Implied average annual EPS CAGR of 15%
Portfolio ROI
• Key profit growth driver, applicable on an LTM basis
• ≥13% unlevered returns imply strong risk-adjusted shareholder value creation
• Reflects portfolio mix post combination and current market pricing
Leverage (Net Debt/Cash EBITDA)
• Target range reflects Intrum’s strong cash flow, low risk profile and strong investment outlook and pipeline
• Leverage may temporarily deviate from target as a result of strategic acquisitions or otherwise
Dividend • Strong commitment to shareholder friendly dividend policy
• Balanced between (i) ambition to deleverage and (ii) strong investment outlook
Note: See appendix for detailed definitions.
Financial targets Key rationale for selection of target
≥75% growth 2020 vs 2016 EPS of SEK ≥35 in 2020
≥13% p.a.
2.5x–3.5x
≥50% pay-out ratio over time
9
© Intrum Justitia AB (publ) 2018 All rights reserved.
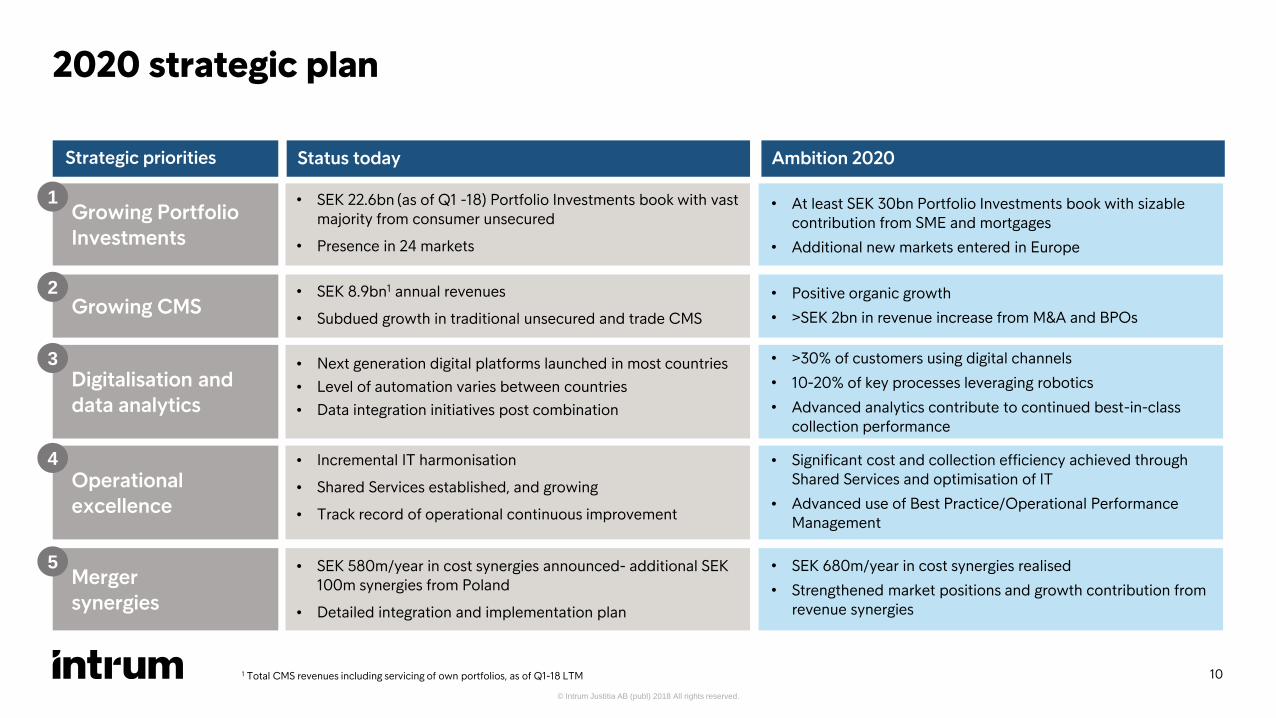
Growing Portfolio Investments
Growing CMS
Digitalisation and data analytics
Operational excellence
Merger synergies
• SEK 22.6bn (as of Q1 -18) Portfolio Investments book with vast majority from consumer unsecured
• Presence in 24 markets
• SEK 8.9bn1 annual revenues
• Subdued growth in traditional unsecured and trade CMS
• Next generation digital platforms launched in most countries
• Level of automation varies between countries
• Data integration initiatives post combination
• Incremental IT harmonisation
• Shared Services established, and growing
• Track record of operational continuous improvement
• SEK 580m/year in cost synergies announced- additional SEK 100m synergies from Poland
• Detailed integration and implementation plan
Strategic priorities Status today Ambition 2020
• At least SEK 30bn Portfolio Investments book with sizable contribution from SME and mortgages
• Additional new markets entered in Europe
• Positive organic growth
• >SEK 2bn in revenue increase from M&A and BPOs
• >30% of customers using digital channels
• 10-20% of key processes leveraging robotics
• Advanced analytics contribute to continued best-in-class collection performance
• Significant cost and collection efficiency achieved through Shared Services and optimisation of IT
• Advanced use of Best Practice/Operational Performance Management
• SEK 680m/year in cost synergies realised
• Strengthened market positions and growth contribution from revenue synergies
2020 strategic plan
1 Total CMS revenues including servicing of own portfolios, as of Q1-18 LTM
1
2
3
4
5
10

© Intrum Justitia AB (publ) 2018 All rights reserved.
Strong market outlook and opportunity set
Expansion of our addressable market 1
Continued growth in credit and defaults 2
Mounting accounting and regulatory pressures 3
Widening of the sophistication and efficiency gap 4
11

© Intrum Justitia AB (publ) 2018 All rights reserved.
123
284
323
730
317 317
B2Cunsecured
B2Csecured
B2BSME & Corporate
TotalEurope
Growth from large untapped market segments…
European stock of NPLs (€bn, % of total) – 2016E
640 1,047
B2C & SME Corporate
…with Intrum’s strengthened capabilities
• Historical core focus of Intrum – represents ~12% of market
• Strong expertise through Aktua
• Investment and servicing experience in various markets
• Very large opportunity
• Rapidly growing experience in some countries
Current footprint
All 24 markets
8 markets and growing…
12%
27%
31%
B2C secured and B2B SME
1 Expansion of our addressable market Addressable segments represent ~6x Intrum’s historical core market
B2C unsecured
12

© Intrum Justitia AB (publ) 2018 All rights reserved.
Input Frontbook
GMM
Lower gross return
Frontbook
Return Volatility
Reduced risk
Backbook
Performance
Excess return over bussiness case
Operating
Costs %
Supporting net returns and ROI
Cost of
Capital
Greater excess equity return
Outcome
Trend
over the last
3 years
Our risk adjusted returns remain very attractive
Stronger risk-adjusted ROI and return to shareholders
13

Long-Term Strategic Partnership with Intesa Sanpaolo in Italy

© Intrum Justitia AB (publ) 2018 All rights reserved.
15
Landmark Long-term Strategic Partnership in Italy
• A landmark partnership between Intrum, Europe's largest credit management services company, and Intesa Sanpaolo, one of the largest and strongest banks in Europe
• Establishes Intrum as a leading CMS company and NPL servicer in Italy – a large and strategically important market for Intrum
− Unparalleled access to future growth opportunities in Italy
− Ability to attract servicing contracts and portfolios from other Italian banks
− Highly efficient, professional and compliant Italian CMS player
• Demonstrates Intrum’s competitive strengths
− Scale, following the Intrum Justitia / Lindorff merger, to be the go-to partner for large banks
− Capabilities to replicate its proven and successful business model into new markets
− Business model to drive integrated NPL purchases and servicing carve-outs
• Significant reinvestment of proceeds from remedy units disposal at attractive returns

© Intrum Justitia AB (publ) 2018 All rights reserved.
16
Strategic Partnership Combining Scale, Market Access and Operating Excellence
A Strong Combination…
Not Contributed
49%
Italy Italian
Portfolios
NPL Recoveries
51%

© Intrum Justitia AB (publ) 2018 All rights reserved.
17
Sale of NPLs
Consideration
Intesa Sanpaolo Portfolio SPV
Intrum Co-Investor
JV Co.
Bank Syndicate
Debt
Equity
49%
~80% ~20%
51%
Structure provides access to diversified, low cost and non-recourse source of financing
Efficient and Attractive SPV Financing Structure (1/2)

© Intrum Justitia AB (publ) 2018 All rights reserved.
Efficient and Attractive SPV Financing Structure (2/2)
18
NPL Portfolio
Equity
Debt
Structure provides access to diversified, low cost and non-recourse source of financing
• Vendor loan financing at 94.9% advance rate and no cost from
pre-closing (April 2018) to closing (November 2018)
• Senior bank financing from closing in November 2018
• 60% advance rate
• EURIBOR (0% floor) + 325 bps
• 5.5 years legal maturity
• Non-recourse to Intrum
• Potential upside from GACS financing post closing
• Equity interest to be shared between Intesa (49%), Intrum (~41%)
and co-investors (~10%)
• Equity interest accounted for by Intrum as a JV investment
recognizing its share of income generated over the life of the
portfolio
Balance Sheet Portfolio SPV
Managing Leverage whilst continuing to Grow

© Intrum Justitia AB (publ) 2018 All rights reserved.
Capitalisation Table
Intrum’s net Debt to Cash EBITDA was at Q1 at 3.8x. Which was in line with business plan presented in conjunction with the merger
20
SEK m EUR m xPF Cash
EBITDA
Cash and Equivalents 2,583- 251-
Debt:
Multicurrency Super Senior RCF - -
Sw edish Domestic MTNs 2,000 195
Private Placement Notes 1,645 160
Commercial Paper Program 50 5
Senior unsecured notes 30,713 2,987
Other liabilities 218 21
Total Net Debt 32,043 3,116 3.8
Total Debt 34,626 3,367 4.1
Market Capitalization 31,136 3,028
Total Capitalization 65,762 6,395 7.8
Pro forma Q1 2018 LTM Cash EBITDA
(Excl NRIs) 8,421 819

© Intrum Justitia AB (publ) 2018 All rights reserved.
Funding and Liquidity
Funding sources
‒ RCF SEK 0 m Utilized per 31 Mar 2018
‒ Public Bonds SEK 32,713 m Issued in both EUR and SEK
‒ Private Placements EUR 160 m 7y issued June 2016
‒ Commercial Paper (up to SEK 4bn) SEK 50 m outstanding per 31 Mar 2017
21
Maturity profile
Sources of Liquidity
‒ Unutilised RCF SEK 11 bn per 31 Mar 2017
‒ Cash and cash equivalents SEK 2.5 bn
In excess of SEK 13bn in available liquidity
-
5 000
10 000
15 000
20 000
25 000
2018 2019 2020 2021 2022 2023 2024
MS
EK
CP BONDS SEK MTN Private Placement

© Intrum Justitia AB (publ) 2018 All rights reserved.
Financial targets for 2018–2020
Portfolio and BPO replacement capex (based on approx.
run-rate for amortisations in Q1-
18)
Free cash flow
Capex Tax expense
Interest expense (debt adjusted for RemCo proceeds)
Cash EBITDA ex. NRIs
~(4.0)
2.6
(0.2) (0.5) (1.1)
~3.8x Q1’18 PF Leverage
Strong cash flow generation from balanced business model provides deleveraging optionality
Indicative cash-flow profile based on adjusted Q1-18 LTM data (SEKbn)
Leverage target
~0.3x impact on Net Debt/Cash
EBITDA
2.5–3.5x Increase in Cash EBITDA outpacing increase in net debt
1
2
3
8.4
22

4.1 3.8
4.2- 4.5
3.5
3.0
0
1
2
3
4
5
2017 YE Remco ISP Full Synergies Growth to 2020
x
Leverage ratio*- effects and expectations
23
~
~
~ ~
x x
x
*Net debt to cash EBITDA
~ x

Outlook & near-term priorities
24
© Intrum Justitia AB (publ) 2018 All rights reserved.
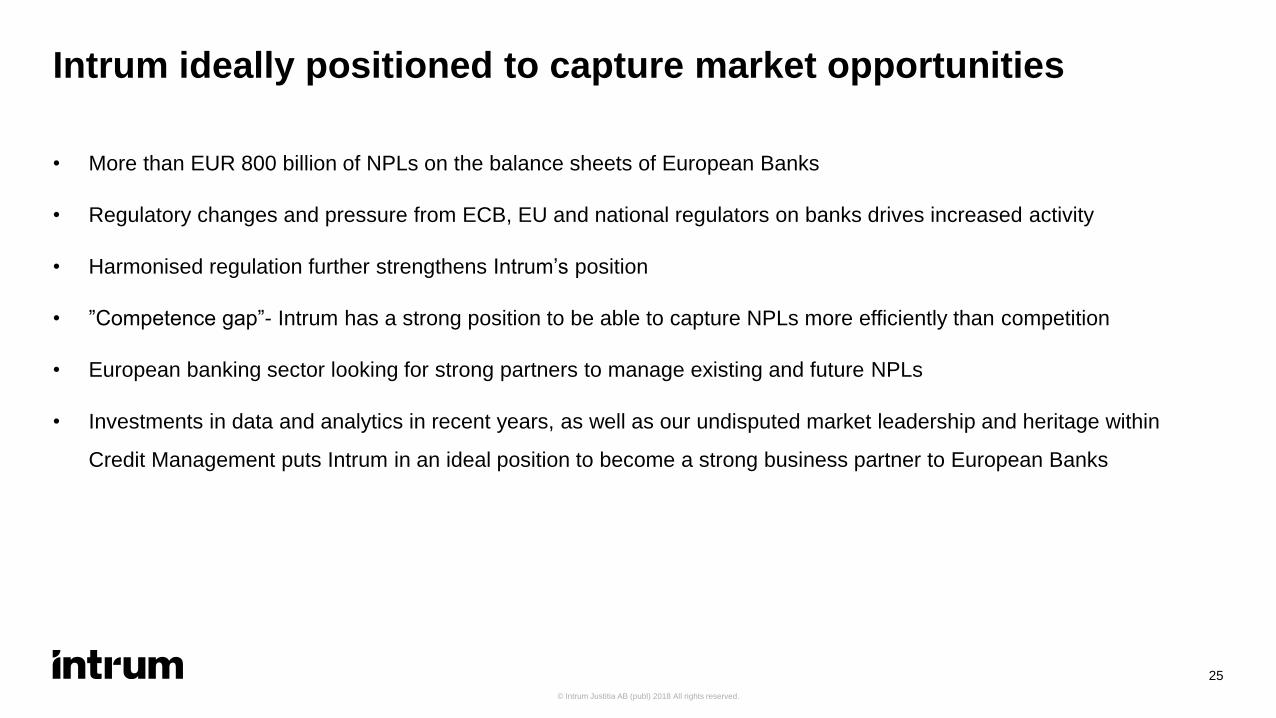
Intrum ideally positioned to capture market opportunities
• More than EUR 800 billion of NPLs on the balance sheets of European Banks
• Regulatory changes and pressure from ECB, EU and national regulators on banks drives increased activity
• Harmonised regulation further strengthens Intrum’s position
• ”Competence gap”- Intrum has a strong position to be able to capture NPLs more efficiently than competition
• European banking sector looking for strong partners to manage existing and future NPLs
• Investments in data and analytics in recent years, as well as our undisputed market leadership and heritage within
Credit Management puts Intrum in an ideal position to become a strong business partner to European Banks
25

© Intrum Justitia AB (publ) 2018 All rights reserved.
Near-term priorities
26
Continue to select and invest in the most attractive deals taking advantage of strong pipeline
Proactively drive the pipeline for larger CMS acquisitions and BPO-opportunities
Improve margin trend for CMS
Continue to realize the full synergy and integration benefits from the merger

Q&A