introduzione ai settori stoxx 600 - moneyriskanalysis.com · introduzione ai settori stoxx 600...
TRANSCRIPT

Introduzione ai Settori STOXX 600
Quante volte vi sarà capitato nella vostra attività di investitore di cercare i dettaglidi un singolo settore e magari di voler confrontare il vostro titolo con i competitor?Nella mia esperienza ho sempre trovato piuttosto complicato trovare dei siti che
riuscissero a fornire un flash completo di qualsiasi comparto.
Molti siti offrono una piattaforma che necessita di una elaborazione specifica daparte dell'utente e di una preparazione a monte sia informatica che finanziaria
sopra la media, altri siti invece non considerano l’importanza di un’analisi settoriale.
Ebbene, grazie alla convivenza tra informatica e finanza del nostro team,siamo riusciti ad elaborare un quadro chiaro, ricco di contenuti e soprattutto
utile a fornirvi i dati necessari per arricchire le vostre scelte.In un unico pdf potete osservare infatti con un semplice click ogni singoloIn un unico pdf potete osservare infatti con un semplice click ogni singolo
settore nei suoi dati più completi, che verranno aggiornati una volta al mese.
La performance del passato non è indicativa di uguali rendimenti nel futuro. Questo report non rappresenta una sollecitazione a comprare quote di Fondi di Investimento o di qualsiasi altro strumento finanziario, nè un servizio di consulenza, ma solo un servizio di elaborazione
ed analisi di dati storici di strumenti finanziari.Copyright Money Risk Analysis (C) Riproduzione riservata.
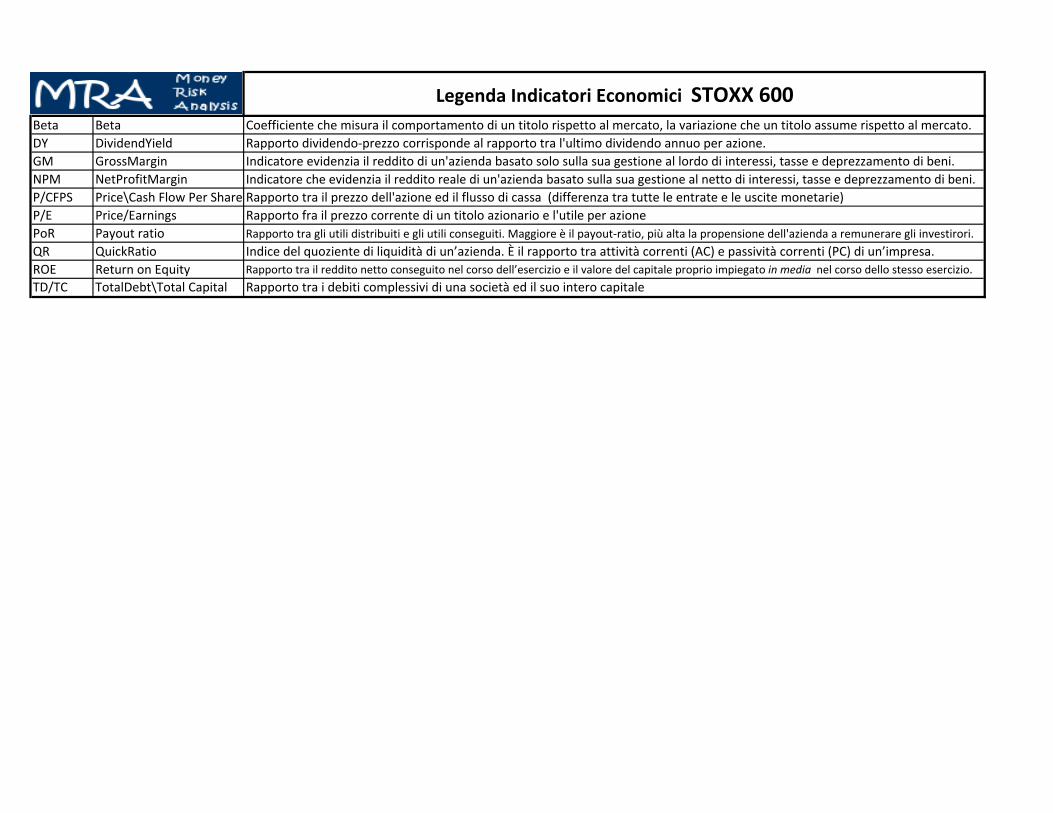
Legenda Indicatori Economici STOXX 600Beta Beta Coefficiente che misura il comportamento di un titolo rispetto al mercato, la variazione che un titolo assume rispetto al mercato.DY DividendYield Rapporto dividendo‐prezzo corrisponde al rapporto tra l'ultimo dividendo annuo per azione.GM GrossMargin Indicatore evidenzia il reddito di un'azienda basato solo sulla sua gestione al lordo di interessi, tasse e deprezzamento di beni.NPM NetProfitMargin Indicatore che evidenzia il reddito reale di un'azienda basato sulla sua gestione al netto di interessi, tasse e deprezzamento di beni.P/CFPS Price\Cash Flow Per Share Rapporto tra il prezzo dell'azione ed il flusso di cassa (differenza tra tutte le entrate e le uscite monetarie) P/E Price/Earnings Rapporto fra il prezzo corrente di un titolo azionario e l'utile per azionePoR Payout ratio Rapporto tra gli utili distribuiti e gli utili conseguiti. Maggiore è il payout‐ratio, più alta la propensione dell'azienda a remunerare gli investirori.QR QuickRatio Indice del quoziente di liquidità di un’azienda. È il rapporto tra attività correnti (AC) e passività correnti (PC) di un’impresa.ROE Return on Equity Rapporto tra il reddito netto conseguito nel corso dell’esercizio e il valore del capitale proprio impiegato in media nel corso dello stesso esercizio.TD/TC TotalDebt\Total Capital Rapporto tra i debiti complessivi di una società ed il suo intero capitale

STOXX 600 Settore AUTOMOBILI
Name Country Industry MarketCap Currency P/E Beta ROE DYBayerische Motoren Werke AG (BMWX:GER) Germania Auto & Truck Manufacturers 57.65 EUR 11.06 1.19 16.11% 2.14%Continental AG (CONX:GER) Germania Auto & Truck Parts 33.78 EUR 17.57 1.51 22.91% 1.09%Daimler AG (DAIX.N:GER) Germania Auto & Truck Manufacturers 70.92 EUR 11.35 1.43 16.98% 2.50%Fiat SpA (F:MIL) Italia Auto & Truck Manufacturers 10.62 EUR 11.91 1.17 12.46% 2.50%GKN PLC (GKN:LSE) Inghilterra Auto & Truck Parts 6.26 GBP 16.04 1.54 23.59% 2.07%Compagnie Generale des Etablissements MichelinFrancia Tires 16.41 EUR 14.78 1.07 12.60% 2.83%Nokian Tyres plc (NRE1V:HEX) Finlandia Tires 3.75 EUR 20.92 0.97 12.98% 5.16%Peugeot SA (UG:PAR) Francia Auto & Truck Manufacturers 4.55 EUR ‐‐ 1.41 ‐28.31% 5.16%Pirelli & C SpA (PC:MIL) Italia Tires 5.82 EUR 19.21 0.70 12.88% 2.14%Porsche Automobil Holding SE (PAH3:GER) Germania Auto & Truck Manufacturers 12.2 EUR 10.13 0.95 8.17% 1.86%Renault SA (RNO:PAR) Francia Auto & Truck Manufacturers 21.09 EUR ‐‐ 1.66 ‐‐ 2.41%Rheinmetall AG (RHMX:GER) Germania Auto & Truck Parts 1.95 EUR 74.93 1.31 2.22% 0.60%Valeo SA (FR:PAR) Francia Auto & Truck Parts 7.69 EUR 16.95 1.72 19.81% 1.76%Volkswagen AG (VOW3:GER) Germania Auto & Truck Manufacturers 88.69 EUR 10.35 1.45 10.96% 1.55%
Fonte dati: Financial Times Pagina 1 Per spiegazione indicatori si prega di consultare la Legenda

STOXX 600 Settore AUTOMOBILI
Name GM NPM PoR P/CFPS QR TD/TCBayerische Motoren Werke AG (BMWX:GER) 20.08% 7.02% 32.12% 4.69 0.851 0.6636Continental AG (CONX:GER) 23.41% 6.03% 26.00% 8.79 0.8746 0.4159Daimler AG (DAIX.N:GER) 21.69% 7.39% 35.18% 5.42 0.8982 0.6419Fiat SpA (F:MIL) 14.11% 2.25% ‐‐ 1.4 1.09 0.7038GKN PLC (GKN:LSE) ‐‐ 5.70% 0.3291 8.36 0.805 0.3379Compagnie Generale des Etablissements Michelin 31.64% 5.57% 39.11% 7.53 1.1 0.1981Nokian Tyres plc (NRE1V:HEX) 0.461 12.08% 105.23% 13.53 2.12 0.2091Peugeot SA (UG:PAR) 15.02% ‐4.42% ‐‐ 4.15 0.8759 0.8007Pirelli & C SpA (PC:MIL) 0.6304 4.99% 51.63% 9.81 0.8739 0.4889Porsche Automobil Holding SE (PAH3:GER) ‐128.57% 3.44% 25.53% ‐‐ ‐‐ 0.0098Renault SA (RNO:PAR) ‐‐ ‐‐ ‐‐ ‐‐ ‐‐ ‐‐Rheinmetall AG (RHMX:GER) 47.28% 0.48% 0.5172 8.34 0.8294 0.3033Valeo SA (FR:PAR) 17.12% 3.87% ‐‐ 7.46 0.8689 0.4282Volkswagen AG (VOW3:GER) 18.25% 4.64% 0.2064 3.87 0.7885 0.5833
Fonte dati: Financial Times Pagina 2 Per spiegazione indicatori si prega di consultare la Legenda

STOXX 600 Settore BANCHEName Country Industry MarketCap Currency P/E Beta ROE DYBank of Ireland (BIR:ISE) Irlanda Regional Banks 8.82 EUR ‐‐ 3.44 ‐8.49%Bankia SA (BKIA:MCE) Spagna Money Center Banks 16.92 EUR 29.53 ‐‐ 14.07%Bankinter SA (BKT:MCE) Spagna Regional Banks 4.96 EUR 20.35 1.26 6.49% 0.92%Barclays PLC (BARC:LSE) Inghilterra Regional Banks 40.8 GBP ‐‐ 1.79 ‐‐ 2.55%Banca Monte dei Paschi di Siena SpA (BMPS:MIL) Italia Regional Banks 2.89 EUR ‐‐ 1.45 ‐21.61% 2.55%Banca Popolare di Milano Scarl (PMI:MIL) Italia Regional Banks 2.19 EUR 73.88 1.42 0.77% 2.55%Banca Popolare di Sondrio ScpA (BPSO:MIL) Italia Regional Banks 1.59 EUR 29.92 0.76 2.79% 0.78%Banca Popolare dell'Emilia Romagna Sc (BPE:MIL Italia Regional Banks 2.76 EUR 574.06 1.30 0.15%Banco Bilbao Vizcaya Argentaria S.A. (BBVA:MCE)Spagna Money Center Banks 51.88 EUR 157.38 1.37 0.86% 3.25%Banco Comercial Portugues SA (BCP:LIS) Portogallo Regional Banks 4.1 EUR ‐‐ 1.88 ‐24.78% 3.25%Banco Espirito Santo SA (BES:LIS) Portogallo Regional Banks 5.2 EUR ‐‐ 2.14 ‐7.53% 3.25%Banco Popolare Sc (BP:MIL) Italia Regional Banks 5.04 EUR ‐‐ 1.62 ‐5.73% 3.25%Banco Popular Espanol SA (POP:MCE) Spagna Regional Banks 11.18 EUR 30.12 1.22 3.03% 0.59%Banco de Sabadell SA (SAB:MCE) Spagna Regional Banks 9.63 EUR 38.91 1.19 2.58% 0.33%Banco Santander SA (SAN:MCE) Spagna Regional Banks 82.38 EUR 18.09 1.27 6.16% 6.62%BNP Paribas SA (BNP:PAR) Francia Money Center Banks 68.58 EUR 14.18 1.66 5.59% 2.72%Caixabank SA (CABK:MCE) Spagna Regional Banks 23.76 EUR 44.13 1.16 2.14% 3.53%COMMERZBANK AG (CBKX:GER) Germania Regional Banks 14.45 EUR 175.44 1.37 0.30% 3.53%Credit Agricole SA (ACA:PAR) Francia Regional Banks 28.41 EUR 11.51 2.08 5.94% 3.08%Credit Suisse Group AG (CSGN:VTX) Svizzera Investment Services 43.69 CHF 37.18 1.63 2.95% 2.56%Danske Bank (DANSKE:CPH) Danimarca Regional Banks 152.1 DKK 21.21 1.87 5.02% 1.33%Deutsche Bank AG (DBKX.N:GER) Germania Regional Banks 31.92 EUR 41.89 1.30 1.23% 1.76%DNB NOR ASA (DNBNOR:OSL) Germania Regional Banks 166.79 NOK 9.52 1.33 12.99% 1.90%Erste Group Bank AG (EBS:VIE) Germania S&Ls/Savings Banks 10.12 EUR 1367.02 1.69 ‐0.20% 0.64%Societe Generale (GLE:PAR) Francia Regional Banks 34.56 EUR 17.96 2.26 3.67% 2.31%HSBC Holdings PLC (HSBA:LSE) Inghilterra Regional Banks 113.77 GBP 11.99 1.14 8.75% 5.01%Intesa Sanpaolo SpA (ISP:MIL) Italia Regional Banks 39.19 EUR 24.8 1.68 3.46% 1.66%Julius Baer Gruppe AG (BAER:VTX) Svizzera Regional Banks 9.03 CHF 46.13 1.46 3.85% 1.49%Jyske Bank A/S (JYSK:CPH) Danimarca Regional Banks 21.83 DKK 12.07 1.63 10.93% 1.49%KBC Groupe SA (KBC:BRU) Belgio S&Ls/Savings Banks 18.18 EUR 42.22 2.94 2.89% 1.72%Komercni Banka as (BAAKOMB:PRA) Repubblica Ceca Regional Banks 173.52 CZK 13.7 0.93 13.15% 4.28%
Fonte dati: Financial Times Pagina 1 Per spiegazione indicatori si prega di consultare la Legenda
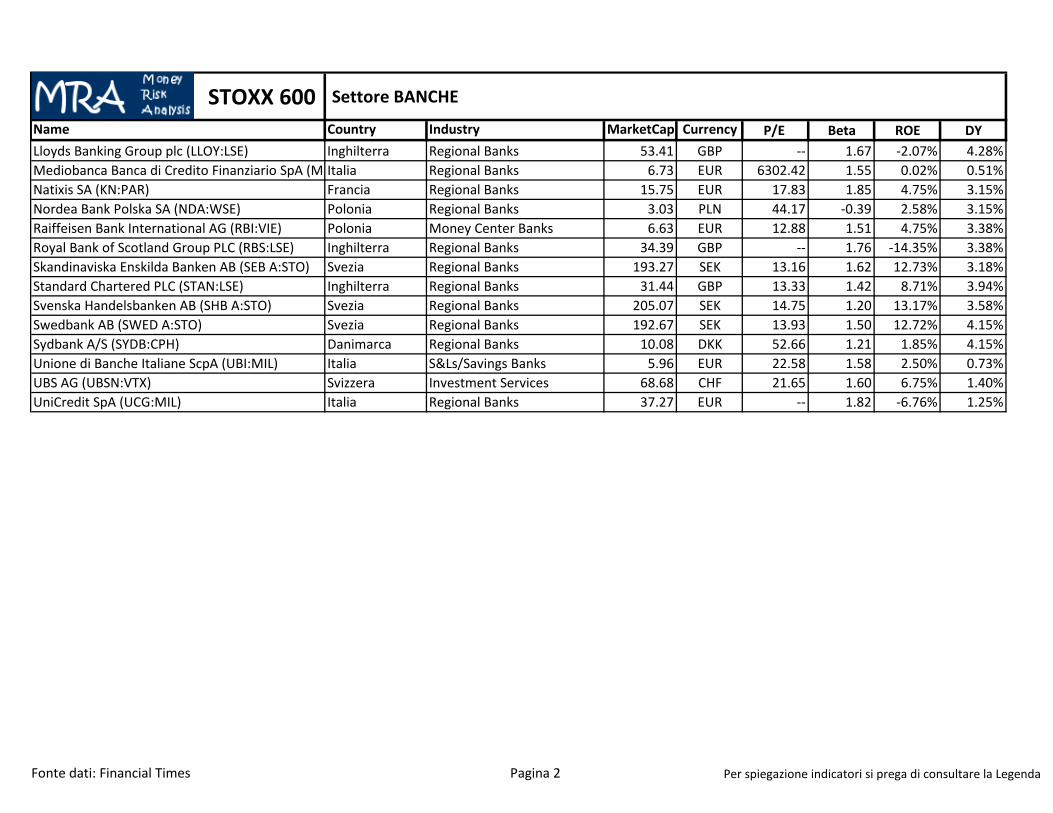
STOXX 600 Settore BANCHEName Country Industry MarketCap Currency P/E Beta ROE DYLloyds Banking Group plc (LLOY:LSE) Inghilterra Regional Banks 53.41 GBP ‐‐ 1.67 ‐2.07% 4.28%Mediobanca Banca di Credito Finanziario SpA (M Italia Regional Banks 6.73 EUR 6302.42 1.55 0.02% 0.51%Natixis SA (KN:PAR) Francia Regional Banks 15.75 EUR 17.83 1.85 4.75% 3.15%Nordea Bank Polska SA (NDA:WSE) Polonia Regional Banks 3.03 PLN 44.17 ‐0.39 2.58% 3.15%Raiffeisen Bank International AG (RBI:VIE) Polonia Money Center Banks 6.63 EUR 12.88 1.51 4.75% 3.38%Royal Bank of Scotland Group PLC (RBS:LSE) Inghilterra Regional Banks 34.39 GBP ‐‐ 1.76 ‐14.35% 3.38%Skandinaviska Enskilda Banken AB (SEB A:STO) Svezia Regional Banks 193.27 SEK 13.16 1.62 12.73% 3.18%Standard Chartered PLC (STAN:LSE) Inghilterra Regional Banks 31.44 GBP 13.33 1.42 8.71% 3.94%Svenska Handelsbanken AB (SHB A:STO) Svezia Regional Banks 205.07 SEK 14.75 1.20 13.17% 3.58%Swedbank AB (SWED A:STO) Svezia Regional Banks 192.67 SEK 13.93 1.50 12.72% 4.15%Sydbank A/S (SYDB:CPH) Danimarca Regional Banks 10.08 DKK 52.66 1.21 1.85% 4.15%Unione di Banche Italiane ScpA (UBI:MIL) Italia S&Ls/Savings Banks 5.96 EUR 22.58 1.58 2.50% 0.73%UBS AG (UBSN:VTX) Svizzera Investment Services 68.68 CHF 21.65 1.60 6.75% 1.40%UniCredit SpA (UCG:MIL) Italia Regional Banks 37.27 EUR ‐‐ 1.82 ‐6.76% 1.25%
Fonte dati: Financial Times Pagina 2 Per spiegazione indicatori si prega di consultare la Legenda

STOXX 600 Settore BANCHEName GM NPM PoR P/CFPS QR TD/TCBank of Ireland (BIR:ISE) ‐‐ ‐10.84% ‐‐ ‐‐ ‐‐Bankia SA (BKIA:MCE) ‐‐ 9.40% 33.16 ‐‐ ‐‐Bankinter SA (BKT:MCE) ‐‐ 15.66% 24.81% ‐‐ ‐‐ ‐‐Barclays PLC (BARC:LSE) ‐‐ ‐‐ ‐‐ ‐‐ ‐‐ ‐‐Banca Monte dei Paschi di Siena SpA (BMPS:MIL) ‐‐ ‐32.08% ‐‐ ‐‐ ‐‐ ‐‐Banca Popolare di Milano Scarl (PMI:MIL) ‐‐ 1.74% ‐‐ 21.44 ‐‐ ‐‐Banca Popolare di Sondrio ScpA (BPSO:MIL) ‐‐ 5.87% 28.77% 17.65 ‐‐ ‐‐Banca Popolare dell'Emilia Romagna Sc (BPE:MIL ‐‐ 0.66% ‐‐ 34.71 ‐‐ ‐‐Banco Bilbao Vizcaya Argentaria S.A. (BBVA:MCE) ‐‐ 4.78% ‐‐ 23.44 ‐‐ ‐‐Banco Comercial Portugues SA (BCP:LIS) ‐‐ ‐33.16% ‐‐ ‐‐ ‐‐ ‐‐Banco Espirito Santo SA (BES:LIS) ‐‐ ‐20.88% ‐‐ ‐‐ ‐‐ ‐‐Banco Popolare Sc (BP:MIL) ‐‐ ‐13.40% ‐‐ ‐‐ ‐‐ ‐‐Banco Popular Espanol SA (POP:MCE) ‐‐ 7.28% ‐‐ 23.28 ‐‐ ‐‐Banco de Sabadell SA (SAB:MCE) ‐‐ 5.54% 16.19% 19.37 ‐‐ ‐‐Banco Santander SA (SAN:MCE) ‐‐ 13.03% 153.80% 10.39 ‐‐ ‐‐BNP Paribas SA (BNP:PAR) ‐‐ 7.82% 38.66% ‐‐ ‐‐ ‐‐Caixabank SA (CABK:MCE) ‐‐ 5.46% 196.26% 25.95 ‐‐ ‐‐COMMERZBANK AG (CBKX:GER) ‐‐ 1.66% 196.26% 25.54 ‐‐ ‐‐Credit Agricole SA (ACA:PAR) ‐‐ 5.08% 12.32% ‐‐ ‐‐ ‐‐Credit Suisse Group AG (CSGN:VTX) ‐‐ 10.34% ‐‐ ‐‐ ‐‐ ‐‐Danske Bank (DANSKE:CPH) ‐‐ 15.13% 28.35% 15.71 ‐‐ ‐‐Deutsche Bank AG (DBKX.N:GER) ‐‐ 2.09% 114.86% 10.21 ‐‐ ‐‐DNB NOR ASA (DNBNOR:OSL) ‐‐ 27.62% 25.10% 8.24 ‐‐ ‐‐Erste Group Bank AG (EBS:VIE) ‐‐ 2.58% ‐‐ 16.07 ‐‐ ‐‐Societe Generale (GLE:PAR) ‐‐ 3.17% ‐‐ ‐‐ ‐‐ ‐‐HSBC Holdings PLC (HSBA:LSE) ‐‐ 26.02% 58.70% ‐‐ ‐‐ ‐‐Intesa Sanpaolo SpA (ISP:MIL) ‐‐ 8.61% 50.71% 16.96 ‐‐ ‐‐Julius Baer Gruppe AG (BAER:VTX) ‐‐ 7.87% 69.80% 23.75 ‐‐ ‐‐Jyske Bank A/S (JYSK:CPH) ‐‐ 21.30% 69.80% 9.93 ‐‐ ‐‐KBC Groupe SA (KBC:BRU) ‐‐ 12.32% 0.00% 14 ‐‐ ‐‐Komercni Banka as (BAAKOMB:PRA) ‐‐ 41.60% ‐‐ 11.79 ‐‐ ‐‐
Fonte dati: Financial Times Pagina 3 Per spiegazione indicatori si prega di consultare la Legenda

STOXX 600 Settore BANCHEName GM NPM PoR P/CFPS QR TD/TCLloyds Banking Group plc (LLOY:LSE) ‐‐ ‐4.04% ‐‐ ‐‐ ‐‐ ‐‐Mediobanca Banca di Credito Finanziario SpA (M ‐‐ ‐0.29% 0.00% 196.88 ‐‐ ‐‐Natixis SA (KN:PAR) ‐‐ 7.11% ‐‐ ‐‐ ‐‐ ‐‐Nordea Bank Polska SA (NDA:WSE) ‐‐ 7.10% ‐‐ 30.05 ‐‐ ‐‐Raiffeisen Bank International AG (RBI:VIE) ‐‐ 10.08% 83.63% 6.41 ‐‐ ‐‐Royal Bank of Scotland Group PLC (RBS:LSE) ‐‐ ‐40.73% 83.63% ‐‐ ‐‐ ‐‐Skandinaviska Enskilda Banken AB (SEB A:STO) ‐‐ 37.32% 59.37% 11.54 ‐‐ ‐‐Standard Chartered PLC (STAN:LSE) ‐‐ 21.50% 52.17% 10.97 ‐‐ ‐‐Svenska Handelsbanken AB (SHB A:STO) ‐‐ 39.07% 74.00% 14 ‐‐ ‐‐Swedbank AB (SWED A:STO) ‐‐ 36.76% 82.11% 13.5 ‐‐ ‐‐Sydbank A/S (SYDB:CPH) ‐‐ 3.83% 0.00% 35.23 ‐‐ ‐‐Unione di Banche Italiane ScpA (UBI:MIL) ‐‐ 7.52% 21.53% 11.98 ‐‐ ‐‐UBS AG (UBSN:VTX) ‐‐ 12.19% 30.30% 16.04 ‐‐ ‐‐UniCredit SpA (UCG:MIL) ‐‐ ‐12.97% ‐‐ ‐‐ ‐‐ ‐‐
Fonte dati: Financial Times Pagina 4 Per spiegazione indicatori si prega di consultare la Legenda
STOXX 600 Settore MATERIE PRIME
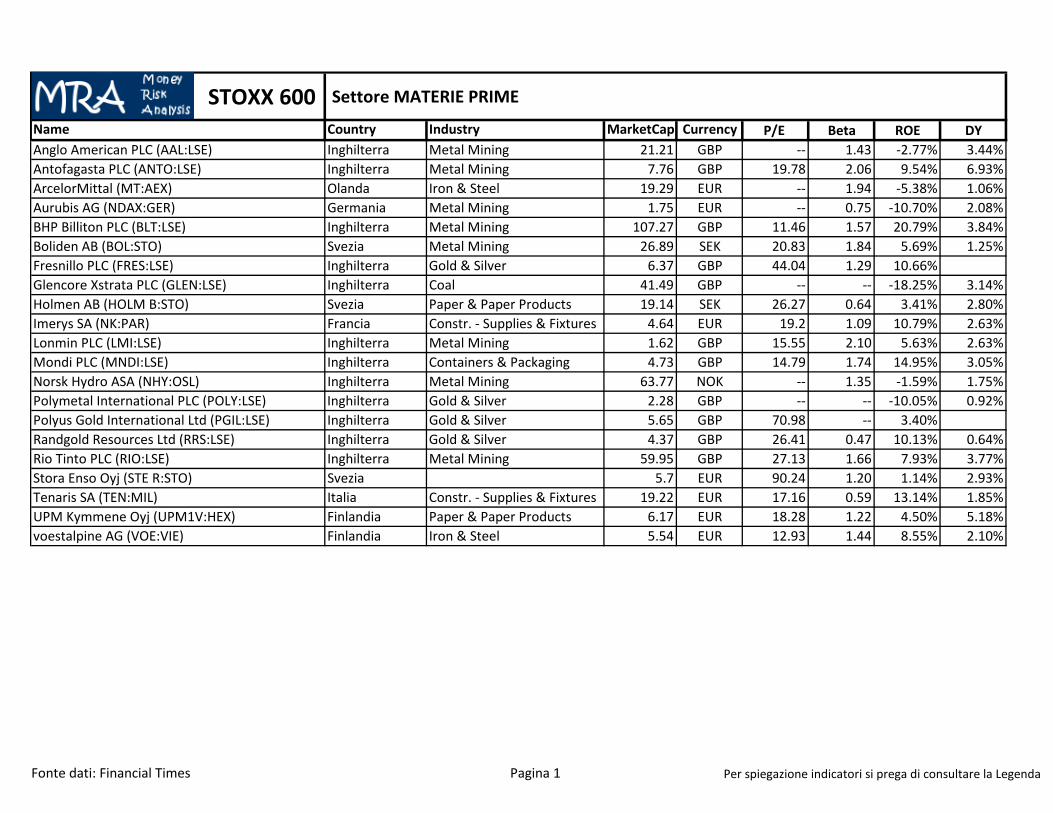
Name Country Industry MarketCap Currency P/E Beta ROE DYAnglo American PLC (AAL:LSE) Inghilterra Metal Mining 21.21 GBP ‐‐ 1.43 ‐2.77% 3.44%Antofagasta PLC (ANTO:LSE) Inghilterra Metal Mining 7.76 GBP 19.78 2.06 9.54% 6.93%ArcelorMittal (MT:AEX) Olanda Iron & Steel 19.29 EUR ‐‐ 1.94 ‐5.38% 1.06%Aurubis AG (NDAX:GER) Germania Metal Mining 1.75 EUR ‐‐ 0.75 ‐10.70% 2.08%BHP Billiton PLC (BLT:LSE) Inghilterra Metal Mining 107.27 GBP 11.46 1.57 20.79% 3.84%Boliden AB (BOL:STO) Svezia Metal Mining 26.89 SEK 20.83 1.84 5.69% 1.25%Fresnillo PLC (FRES:LSE) Inghilterra Gold & Silver 6.37 GBP 44.04 1.29 10.66%Glencore Xstrata PLC (GLEN:LSE) Inghilterra Coal 41.49 GBP ‐‐ ‐‐ ‐18.25% 3.14%Holmen AB (HOLM B:STO) Svezia Paper & Paper Products 19.14 SEK 26.27 0.64 3.41% 2.80%Imerys SA (NK:PAR) Francia Constr. ‐ Supplies & Fixtures 4.64 EUR 19.2 1.09 10.79% 2.63%Lonmin PLC (LMI:LSE) Inghilterra Metal Mining 1.62 GBP 15.55 2.10 5.63% 2.63%Mondi PLC (MNDI:LSE) Inghilterra Containers & Packaging 4.73 GBP 14.79 1.74 14.95% 3.05%Norsk Hydro ASA (NHY:OSL) Inghilterra Metal Mining 63.77 NOK ‐‐ 1.35 ‐1.59% 1.75%Polymetal International PLC (POLY:LSE) Inghilterra Gold & Silver 2.28 GBP ‐‐ ‐‐ ‐10.05% 0.92%Polyus Gold International Ltd (PGIL:LSE) Inghilterra Gold & Silver 5.65 GBP 70.98 ‐‐ 3.40%Randgold Resources Ltd (RRS:LSE) Inghilterra Gold & Silver 4.37 GBP 26.41 0.47 10.13% 0.64%Rio Tinto PLC (RIO:LSE) Inghilterra Metal Mining 59.95 GBP 27.13 1.66 7.93% 3.77%Stora Enso Oyj (STE R:STO) Svezia 5.7 EUR 90.24 1.20 1.14% 2.93%Tenaris SA (TEN:MIL) Italia Constr. ‐ Supplies & Fixtures 19.22 EUR 17.16 0.59 13.14% 1.85%UPM Kymmene Oyj (UPM1V:HEX) Finlandia Paper & Paper Products 6.17 EUR 18.28 1.22 4.50% 5.18%voestalpine AG (VOE:VIE) Finlandia Iron & Steel 5.54 EUR 12.93 1.44 8.55% 2.10%
Fonte dati: Financial Times Pagina 1 Per spiegazione indicatori si prega di consultare la Legenda

STOXX 600 Settore MATERIE PRIME
Name GM NPM PoR P/CFPS QR TD/TCAnglo American PLC (AAL:LSE) ‐‐ 1.45% ‐‐ 11.63 1.36 0.3233Antofagasta PLC (ANTO:LSE) 52.12% 20.76% 141.99% 7.42 3.29 0.1369ArcelorMittal (MT:AEX) ‐‐ ‐3.24% ‐‐ 12.84 0.5859 0.2956Aurubis AG (NDAX:GER) 4.04% ‐1.83% ‐‐ ‐‐ 0.4971 0.238BHP Billiton PLC (BLT:LSE) ‐‐ 24.27% 0.4222 7.47 0.9297 0.3161Boliden AB (BOL:STO) 8.69% 3.76% 37.08% 4.86 0.3479 0.2647Fresnillo PLC (FRES:LSE) 0.4751 16.16% 83.63% 21.39 10.86 0.2384Glencore Xstrata PLC (GLEN:LSE) 2.38% ‐3.14% ‐‐ ‐‐ 0.6752 0.5094Holmen AB (HOLM B:STO) 0.4397 4.38% 106.33% 9.2 0.4465 0.2293Imerys SA (NK:PAR) 65.55% 6.60% 50.33% 10.04 1.37 0.3675Lonmin PLC (LMI:LSE) ‐‐ 13.03% 0.00% 7.68 0.9151 0Mondi PLC (MNDI:LSE) 39.56% 6.39% 0.3425 7.33 0.8642 0.381Norsk Hydro ASA (NHY:OSL) 34.30% ‐1.57% ‐‐ 18.96 1.1 0.1192Polymetal International PLC (POLY:LSE) 23.93% ‐11.60% ‐‐ 42.87 0.7556 0.3833Polyus Gold International Ltd (PGIL:LSE) 39.67% 6.14% 2.392 24.72 2.02 0.2336Randgold Resources Ltd (RRS:LSE) 52.11% 28.63% 0 16.08 0.9494 0.001Rio Tinto PLC (RIO:LSE) ‐‐ 2.11% 0.985 17.16 1.03 0.348Stora Enso Oyj (STE R:STO) 29.52% 0.43% 3.7619 4.83 1.23 0.5012Tenaris SA (TEN:MIL) 39.07% 14.86% 0.3272 12.73 1.99 0.0695UPM Kymmene Oyj (UPM1V:HEX) 10.25% 3.33% 0.9419 7.01 1.31 0.3564voestalpine AG (VOE:VIE) 20.17% 4.48% 0 5.09 0.6805 0.3987
Fonte dati: Financial Times Pagina 2 Per spiegazione indicatori si prega di consultare la Legenda
STOXX 600 Settore CHIMICO
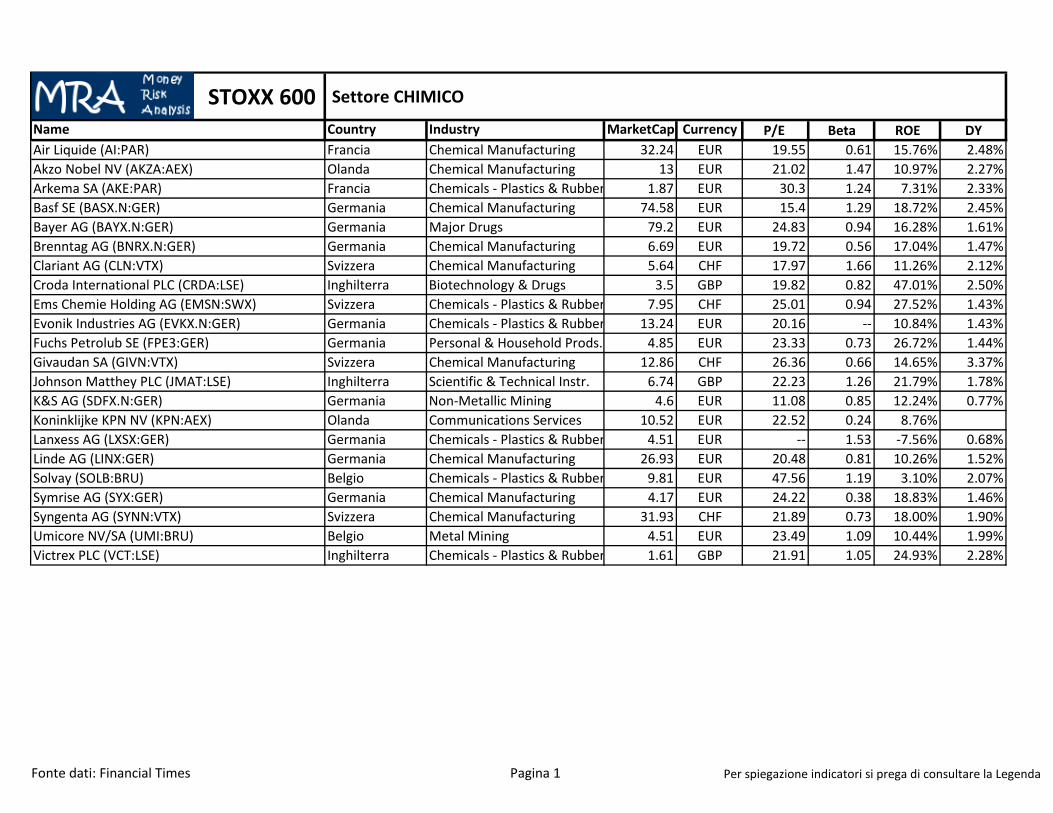
Name Country Industry MarketCap Currency P/E Beta ROE DYAir Liquide (AI:PAR) Francia Chemical Manufacturing 32.24 EUR 19.55 0.61 15.76% 2.48%Akzo Nobel NV (AKZA:AEX) Olanda Chemical Manufacturing 13 EUR 21.02 1.47 10.97% 2.27%Arkema SA (AKE:PAR) Francia Chemicals ‐ Plastics & Rubber 1.87 EUR 30.3 1.24 7.31% 2.33%Basf SE (BASX.N:GER) Germania Chemical Manufacturing 74.58 EUR 15.4 1.29 18.72% 2.45%Bayer AG (BAYX.N:GER) Germania Major Drugs 79.2 EUR 24.83 0.94 16.28% 1.61%Brenntag AG (BNRX.N:GER) Germania Chemical Manufacturing 6.69 EUR 19.72 0.56 17.04% 1.47%Clariant AG (CLN:VTX) Svizzera Chemical Manufacturing 5.64 CHF 17.97 1.66 11.26% 2.12%Croda International PLC (CRDA:LSE) Inghilterra Biotechnology & Drugs 3.5 GBP 19.82 0.82 47.01% 2.50%Ems Chemie Holding AG (EMSN:SWX) Svizzera Chemicals ‐ Plastics & Rubber 7.95 CHF 25.01 0.94 27.52% 1.43%Evonik Industries AG (EVKX.N:GER) Germania Chemicals ‐ Plastics & Rubber 13.24 EUR 20.16 ‐‐ 10.84% 1.43%Fuchs Petrolub SE (FPE3:GER) Germania Personal & Household Prods. 4.85 EUR 23.33 0.73 26.72% 1.44%Givaudan SA (GIVN:VTX) Svizzera Chemical Manufacturing 12.86 CHF 26.36 0.66 14.65% 3.37%Johnson Matthey PLC (JMAT:LSE) Inghilterra Scientific & Technical Instr. 6.74 GBP 22.23 1.26 21.79% 1.78%K&S AG (SDFX.N:GER) Germania Non‐Metallic Mining 4.6 EUR 11.08 0.85 12.24% 0.77%Koninklijke KPN NV (KPN:AEX) Olanda Communications Services 10.52 EUR 22.52 0.24 8.76%Lanxess AG (LXSX:GER) Germania Chemicals ‐ Plastics & Rubber 4.51 EUR ‐‐ 1.53 ‐7.56% 0.68%Linde AG (LINX:GER) Germania Chemical Manufacturing 26.93 EUR 20.48 0.81 10.26% 1.52%Solvay (SOLB:BRU) Belgio Chemicals ‐ Plastics & Rubber 9.81 EUR 47.56 1.19 3.10% 2.07%Symrise AG (SYX:GER) Germania Chemical Manufacturing 4.17 EUR 24.22 0.38 18.83% 1.46%Syngenta AG (SYNN:VTX) Svizzera Chemical Manufacturing 31.93 CHF 21.89 0.73 18.00% 1.90%Umicore NV/SA (UMI:BRU) Belgio Metal Mining 4.51 EUR 23.49 1.09 10.44% 1.99%Victrex PLC (VCT:LSE) Inghilterra Chemicals ‐ Plastics & Rubber 1.61 GBP 21.91 1.05 24.93% 2.28%
Fonte dati: Financial Times Pagina 1 Per spiegazione indicatori si prega di consultare la Legenda
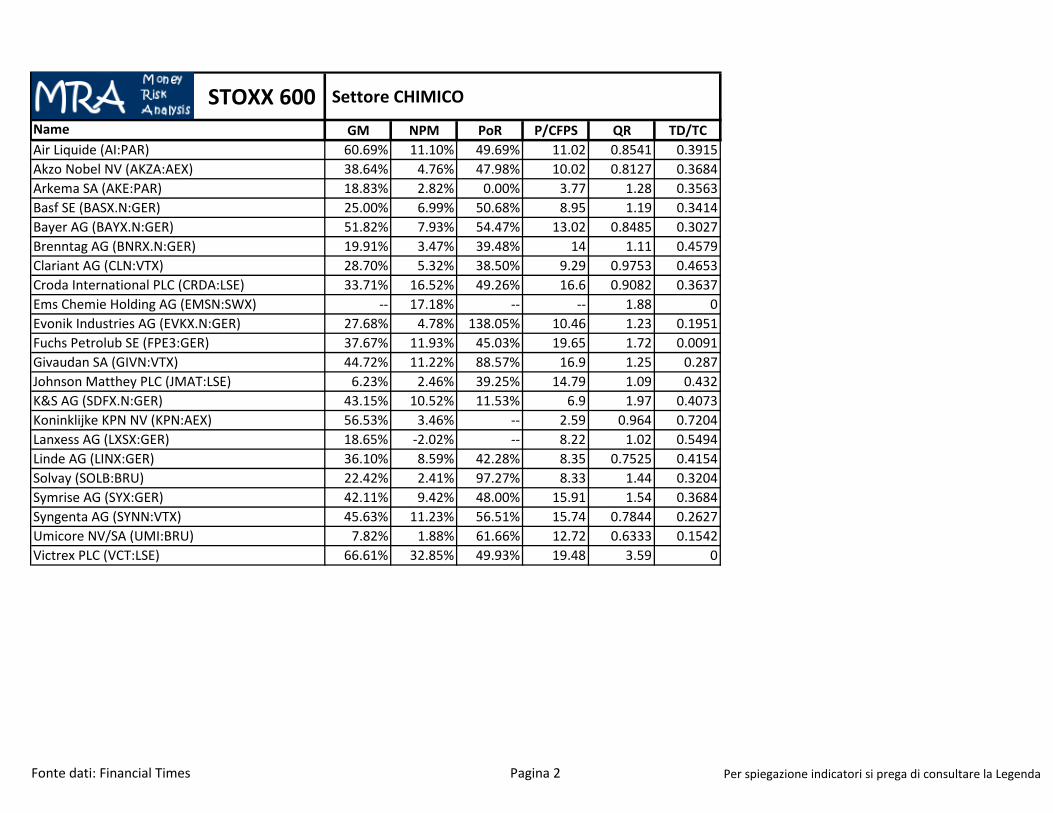
STOXX 600 Settore CHIMICO
Name GM NPM PoR P/CFPS QR TD/TCAir Liquide (AI:PAR) 60.69% 11.10% 49.69% 11.02 0.8541 0.3915Akzo Nobel NV (AKZA:AEX) 38.64% 4.76% 47.98% 10.02 0.8127 0.3684Arkema SA (AKE:PAR) 18.83% 2.82% 0.00% 3.77 1.28 0.3563Basf SE (BASX.N:GER) 25.00% 6.99% 50.68% 8.95 1.19 0.3414Bayer AG (BAYX.N:GER) 51.82% 7.93% 54.47% 13.02 0.8485 0.3027Brenntag AG (BNRX.N:GER) 19.91% 3.47% 39.48% 14 1.11 0.4579Clariant AG (CLN:VTX) 28.70% 5.32% 38.50% 9.29 0.9753 0.4653Croda International PLC (CRDA:LSE) 33.71% 16.52% 49.26% 16.6 0.9082 0.3637Ems Chemie Holding AG (EMSN:SWX) ‐‐ 17.18% ‐‐ ‐‐ 1.88 0Evonik Industries AG (EVKX.N:GER) 27.68% 4.78% 138.05% 10.46 1.23 0.1951Fuchs Petrolub SE (FPE3:GER) 37.67% 11.93% 45.03% 19.65 1.72 0.0091Givaudan SA (GIVN:VTX) 44.72% 11.22% 88.57% 16.9 1.25 0.287Johnson Matthey PLC (JMAT:LSE) 6.23% 2.46% 39.25% 14.79 1.09 0.432K&S AG (SDFX.N:GER) 43.15% 10.52% 11.53% 6.9 1.97 0.4073Koninklijke KPN NV (KPN:AEX) 56.53% 3.46% ‐‐ 2.59 0.964 0.7204Lanxess AG (LXSX:GER) 18.65% ‐2.02% ‐‐ 8.22 1.02 0.5494Linde AG (LINX:GER) 36.10% 8.59% 42.28% 8.35 0.7525 0.4154Solvay (SOLB:BRU) 22.42% 2.41% 97.27% 8.33 1.44 0.3204Symrise AG (SYX:GER) 42.11% 9.42% 48.00% 15.91 1.54 0.3684Syngenta AG (SYNN:VTX) 45.63% 11.23% 56.51% 15.74 0.7844 0.2627Umicore NV/SA (UMI:BRU) 7.82% 1.88% 61.66% 12.72 0.6333 0.1542Victrex PLC (VCT:LSE) 66.61% 32.85% 49.93% 19.48 3.59 0
Fonte dati: Financial Times Pagina 2 Per spiegazione indicatori si prega di consultare la Legenda
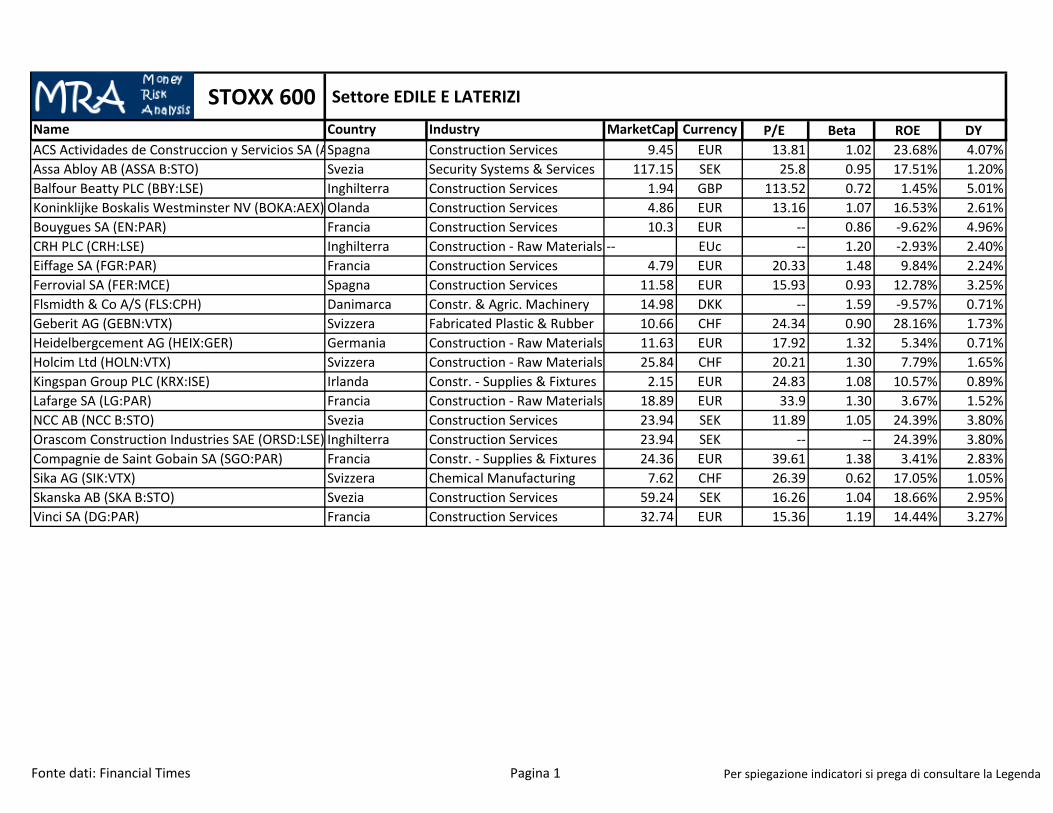
STOXX 600 Settore EDILE E LATERIZIName Country Industry MarketCap Currency P/E Beta ROE DYACS Actividades de Construccion y Servicios SA (ASpagna Construction Services 9.45 EUR 13.81 1.02 23.68% 4.07%Assa Abloy AB (ASSA B:STO) Svezia Security Systems & Services 117.15 SEK 25.8 0.95 17.51% 1.20%Balfour Beatty PLC (BBY:LSE) Inghilterra Construction Services 1.94 GBP 113.52 0.72 1.45% 5.01%Koninklijke Boskalis Westminster NV (BOKA:AEX) Olanda Construction Services 4.86 EUR 13.16 1.07 16.53% 2.61%Bouygues SA (EN:PAR) Francia Construction Services 10.3 EUR ‐‐ 0.86 ‐9.62% 4.96%CRH PLC (CRH:LSE) Inghilterra Construction ‐ Raw Materials ‐‐ EUc ‐‐ 1.20 ‐2.93% 2.40%Eiffage SA (FGR:PAR) Francia Construction Services 4.79 EUR 20.33 1.48 9.84% 2.24%Ferrovial SA (FER:MCE) Spagna Construction Services 11.58 EUR 15.93 0.93 12.78% 3.25%Flsmidth & Co A/S (FLS:CPH) Danimarca Constr. & Agric. Machinery 14.98 DKK ‐‐ 1.59 ‐9.57% 0.71%Geberit AG (GEBN:VTX) Svizzera Fabricated Plastic & Rubber 10.66 CHF 24.34 0.90 28.16% 1.73%Heidelbergcement AG (HEIX:GER) Germania Construction ‐ Raw Materials 11.63 EUR 17.92 1.32 5.34% 0.71%Holcim Ltd (HOLN:VTX) Svizzera Construction ‐ Raw Materials 25.84 CHF 20.21 1.30 7.79% 1.65%Kingspan Group PLC (KRX:ISE) Irlanda Constr. ‐ Supplies & Fixtures 2.15 EUR 24.83 1.08 10.57% 0.89%Lafarge SA (LG:PAR) Francia Construction ‐ Raw Materials 18.89 EUR 33.9 1.30 3.67% 1.52%NCC AB (NCC B:STO) Svezia Construction Services 23.94 SEK 11.89 1.05 24.39% 3.80%Orascom Construction Industries SAE (ORSD:LSE) Inghilterra Construction Services 23.94 SEK ‐‐ ‐‐ 24.39% 3.80%Compagnie de Saint Gobain SA (SGO:PAR) Francia Constr. ‐ Supplies & Fixtures 24.36 EUR 39.61 1.38 3.41% 2.83%Sika AG (SIK:VTX) Svizzera Chemical Manufacturing 7.62 CHF 26.39 0.62 17.05% 1.05%Skanska AB (SKA B:STO) Svezia Construction Services 59.24 SEK 16.26 1.04 18.66% 2.95%Vinci SA (DG:PAR) Francia Construction Services 32.74 EUR 15.36 1.19 14.44% 3.27%
Fonte dati: Financial Times Pagina 1 Per spiegazione indicatori si prega di consultare la Legenda

STOXX 600 Settore EDILE E LATERIZIName GM NPM PoR P/CFPS QR TD/TCACS Actividades de Construccion y Servicios SA (A ‐‐ 3.25% ‐‐ 3.85 1.03 0.6881Assa Abloy AB (ASSA B:STO) 37.95% 9.87% 0.00% 20.27 0.6624 0.3872Balfour Beatty PLC (BBY:LSE) 9.87% 0.19% 571.36% 19.2 0.9019 0.5193Koninklijke Boskalis Westminster NV (BOKA:AEX) 38.00% 10.08% 0.3967 6.94 ‐‐ 0.3209Bouygues SA (EN:PAR) 0.5179 1.65% ‐‐ 5.1 0.7533 0.479CRH PLC (CRH:LSE) 26.16% ‐1.64% ‐‐ 35.41 1.26 0.3639Eiffage SA (FGR:PAR) 0.8062 1.96% 46.26% 4.31 0.8374 0.8692Ferrovial SA (FER:MCE) ‐‐ 8.58% 65.61% 12.4 1.05 0.5916Flsmidth & Co A/S (FLS:CPH) 0.201 ‐2.92% ‐‐ 17.35 0.9627 0.4456Geberit AG (GEBN:VTX) 46.37% 21.79% ‐‐ 20.57 2.79 0.007Heidelbergcement AG (HEIX:GER) 42.00% 6.08% 17.38% 6.27 0.6295 0.4174Holcim Ltd (HOLN:VTX) 43.78% 8.09% 0.3341 8.24 0.7889 0.3853Kingspan Group PLC (KRX:ISE) 6.86% 4.98% 0.2706 16.17 1.33 0.2583Lafarge SA (LG:PAR) 22.75% 4.84% 0 10.71 0.8773 0.4533NCC AB (NCC B:STO) 10.02% 3.44% 0.6512 8.88 1.6 0.5239Orascom Construction Industries SAE (ORSD:LSE) 10.02% 3.44% 0.6512 8.88 1.6 0.5239Compagnie de Saint Gobain SA (SGO:PAR) ‐‐ 1.50% 0 9.64 0.9238 0.3975Sika AG (SIK:VTX) 52.42% 6.70% ‐‐ 15.32 1.72 0.3685Skanska AB (SKA B:STO) 9.18% 2.76% 0.6827 11.1 0.7735 0.3287Vinci SA (DG:PAR) 55.41% 5.02% 0.5046 7.97 0.7987 0.59
Fonte dati: Financial Times Pagina 2 Per spiegazione indicatori si prega di consultare la Legenda

STOXX 600 Settore SERVIZI FINANZIARIName Country Industry MarketCap Currency P/E Beta ROE DYIII:LSE Inghilterra 3.72 GBP 1.50Aberdeen Asset Management PLC (ADN:LSE) Inghilterra Investment Services 5.69 GBP 16.59 1.35 27.68% 3.68%Ackermans en van Haaren NV (ACKB:BRU) Belgio Misc. Financial Services 3.07 EUR 10.34 0.75 ‐‐ 1.39%Ashmore Group PLC (ASHM:LSE) Inghilterra Investment Services 2.49 GBP 14.58 1.28 29.27% 4.60%Azimut Holding SpA (AZM:MIL) Italia Investment Services 3.21 EUR 18.94 1.15 24.43% 2.50%Bolsas y Mercados Espanoles Holding (BME:MCESpagna Investment Services 2.49 EUR 17.45 0.88 35.57% 4.37%Close Brothers Group PLC (CBG:LSE) Inghilterra Regional Banks 2.07 GBP 15.65 0.95 16.08% 3.30%Deutsche Boerse AG (DB1X.N:GER) Germania Investment Services 10.22 EUR 20.37 0.99 15.99% 2.92%Exor SpA (EXO:MIL) Italia Auto & Truck Manufacturers 7.96 EUR ‐‐ 0.79 ‐‐ 0.83%GAM Holding AG (GAM:SWX) Svizzera Investment Services 2.76 CHF 13.41 1.39 10.32% 4.08%Groupe Bruxelles Lambert SA (GBLB:BRU) Belgio Misc. Financial Services 12.01 EUR ‐‐ 1.00 ‐‐ 2.74%Hargreaves Lansdown PLC (HL.:LSE) Inghilterra Investment Services 5.55 GBP 35.06 1.14 96.99% 1.83%Henderson Group PLC (HGG:LSE) Inghilterra Investment Services 2.76 GBP 26.02 1.63 13.27% 3.26%ICAP PLC (IAP:LSE) Inghilterra Investment Services 2.69 GBP 228.87 0.70 1.18% 5.30%IG Group Holdings PLC (IGG:LSE) Inghilterra Investment Services 2.3 GBP 14.85 0.39 32.27% 3.69%Industrivarden AB (INDU A:STO) Svezia Investment Services 56.18 SEK 6.93 1.41 15.83% 2.72%Intermediate Capital Group PLC (ICP:LSE) Inghilterra Investment Services 1.81 GBP 8.38 1.50 13.89% 4.50%International Personal Finance PLC (IPF:LSE) Inghilterra Consumer Financial Services 1.31 GBP 14.29 2.63 24.84% 1.71%Intrum Justitia AB (IJ:STO) Svezia Business Services 15.22 SEK 17.77 0.74 27.07% 2.11%Investec PLC (INVP:LSE) Inghilterra Investment Services 4.85 GBP 16.12 1.52 7.52% 3.52%Investment Kinnevik AB (KINV B:STO) Svezia Containers & Packaging 63.61 SEK 7.51 1.07 13.67% 2.14%Investor AB (INVE B:STO) Svezia Misc. Financial Services 184.91 SEK 4.51 0.97 19.60% 2.30%Jupiter Fund Management PLC (JUP:LSE) Inghilterra Investment Services 1.79 GBP 19.43 1.82 18.22% 3.22%London Stock Exchange Group PLC (LSE:LSE) Inghilterra Investment Services 4.92 GBP 29.64 1.10 11.73% 1.65%Man Group PLC (EMG:LSE) Inghilterra Investment Services 1.74 GBP 56.43 1.24 2.11% 5.05%Pargesa Holding SA (PARG:SWX) Svizzera Construction ‐ Raw Materials 6.1 CHF 17.07 1.22 5.33% 2.17%Partners Group Holding AG (PGHN:SWX) Svizzera Misc. Financial Services 6.37 CHF 20.19 0.84 40.80% 1.98%Provident Financial PLC (PFG:LSE) Inghilterra Consumer Financial Services 2.73 GBP 19.19 0.51 35.60% 4.34%Ratos AB (RATO B:STO) Svezia Misc. Financial Services 22.05 SEK 30.94 1.37 5.20% 3.19%Schroders PLC (SDRC:LSE) Inghilterra 6.84 GBP 20.16 1.69 16.26% 2.98%Wendel SA (MF:PAR) Francia Conglomerates 5.25 EUR ‐‐ 1.65 ‐5.84% 1.71%
Fonte dati: Financial Times Pagina 1 Per spiegazione indicatori si prega di consultare la Legenda
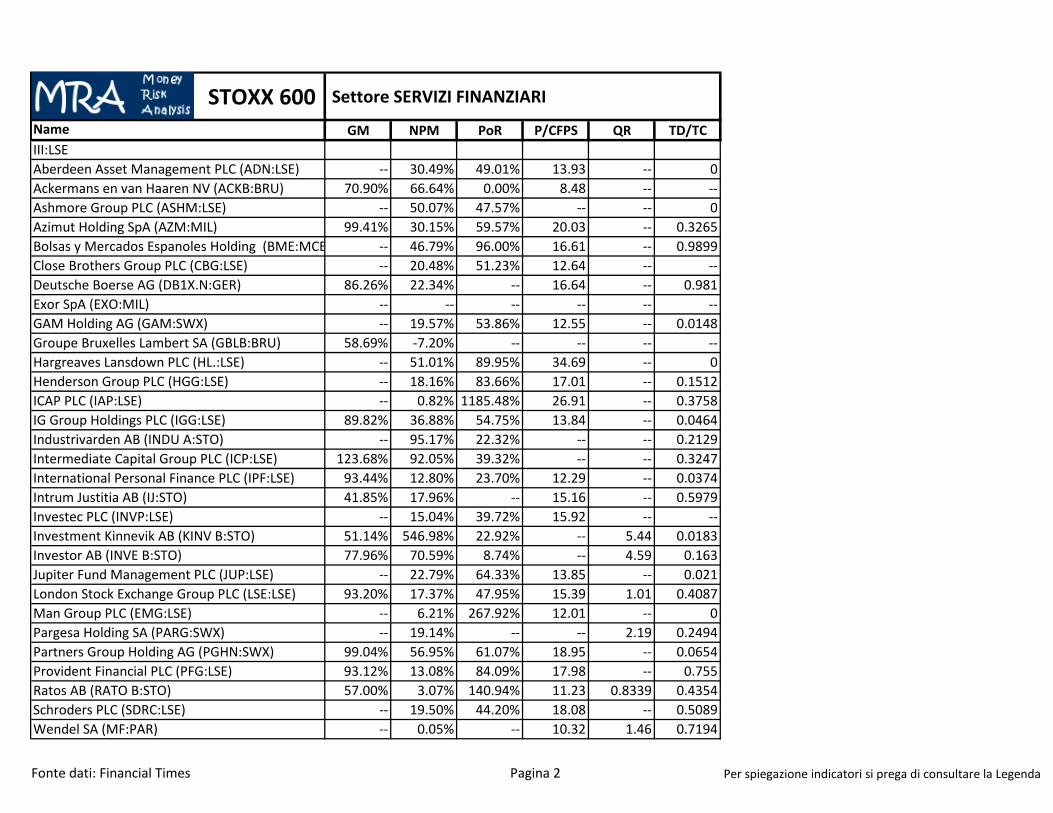
STOXX 600 Settore SERVIZI FINANZIARIName GM NPM PoR P/CFPS QR TD/TCIII:LSEAberdeen Asset Management PLC (ADN:LSE) ‐‐ 30.49% 49.01% 13.93 ‐‐ 0Ackermans en van Haaren NV (ACKB:BRU) 70.90% 66.64% 0.00% 8.48 ‐‐ ‐‐Ashmore Group PLC (ASHM:LSE) ‐‐ 50.07% 47.57% ‐‐ ‐‐ 0Azimut Holding SpA (AZM:MIL) 99.41% 30.15% 59.57% 20.03 ‐‐ 0.3265Bolsas y Mercados Espanoles Holding (BME:MCE ‐‐ 46.79% 96.00% 16.61 ‐‐ 0.9899Close Brothers Group PLC (CBG:LSE) ‐‐ 20.48% 51.23% 12.64 ‐‐ ‐‐Deutsche Boerse AG (DB1X.N:GER) 86.26% 22.34% ‐‐ 16.64 ‐‐ 0.981Exor SpA (EXO:MIL) ‐‐ ‐‐ ‐‐ ‐‐ ‐‐ ‐‐GAM Holding AG (GAM:SWX) ‐‐ 19.57% 53.86% 12.55 ‐‐ 0.0148Groupe Bruxelles Lambert SA (GBLB:BRU) 58.69% ‐7.20% ‐‐ ‐‐ ‐‐ ‐‐Hargreaves Lansdown PLC (HL.:LSE) ‐‐ 51.01% 89.95% 34.69 ‐‐ 0Henderson Group PLC (HGG:LSE) ‐‐ 18.16% 83.66% 17.01 ‐‐ 0.1512ICAP PLC (IAP:LSE) ‐‐ 0.82% 1185.48% 26.91 ‐‐ 0.3758IG Group Holdings PLC (IGG:LSE) 89.82% 36.88% 54.75% 13.84 ‐‐ 0.0464Industrivarden AB (INDU A:STO) ‐‐ 95.17% 22.32% ‐‐ ‐‐ 0.2129Intermediate Capital Group PLC (ICP:LSE) 123.68% 92.05% 39.32% ‐‐ ‐‐ 0.3247International Personal Finance PLC (IPF:LSE) 93.44% 12.80% 23.70% 12.29 ‐‐ 0.0374Intrum Justitia AB (IJ:STO) 41.85% 17.96% ‐‐ 15.16 ‐‐ 0.5979Investec PLC (INVP:LSE) ‐‐ 15.04% 39.72% 15.92 ‐‐ ‐‐Investment Kinnevik AB (KINV B:STO) 51.14% 546.98% 22.92% ‐‐ 5.44 0.0183Investor AB (INVE B:STO) 77.96% 70.59% 8.74% ‐‐ 4.59 0.163Jupiter Fund Management PLC (JUP:LSE) ‐‐ 22.79% 64.33% 13.85 ‐‐ 0.021London Stock Exchange Group PLC (LSE:LSE) 93.20% 17.37% 47.95% 15.39 1.01 0.4087Man Group PLC (EMG:LSE) ‐‐ 6.21% 267.92% 12.01 ‐‐ 0Pargesa Holding SA (PARG:SWX) ‐‐ 19.14% ‐‐ ‐‐ 2.19 0.2494Partners Group Holding AG (PGHN:SWX) 99.04% 56.95% 61.07% 18.95 ‐‐ 0.0654Provident Financial PLC (PFG:LSE) 93.12% 13.08% 84.09% 17.98 ‐‐ 0.755Ratos AB (RATO B:STO) 57.00% 3.07% 140.94% 11.23 0.8339 0.4354Schroders PLC (SDRC:LSE) ‐‐ 19.50% 44.20% 18.08 ‐‐ 0.5089Wendel SA (MF:PAR) ‐‐ 0.05% ‐‐ 10.32 1.46 0.7194
Fonte dati: Financial Times Pagina 2 Per spiegazione indicatori si prega di consultare la Legenda
STOXX 600 Settore ALIMENTARE
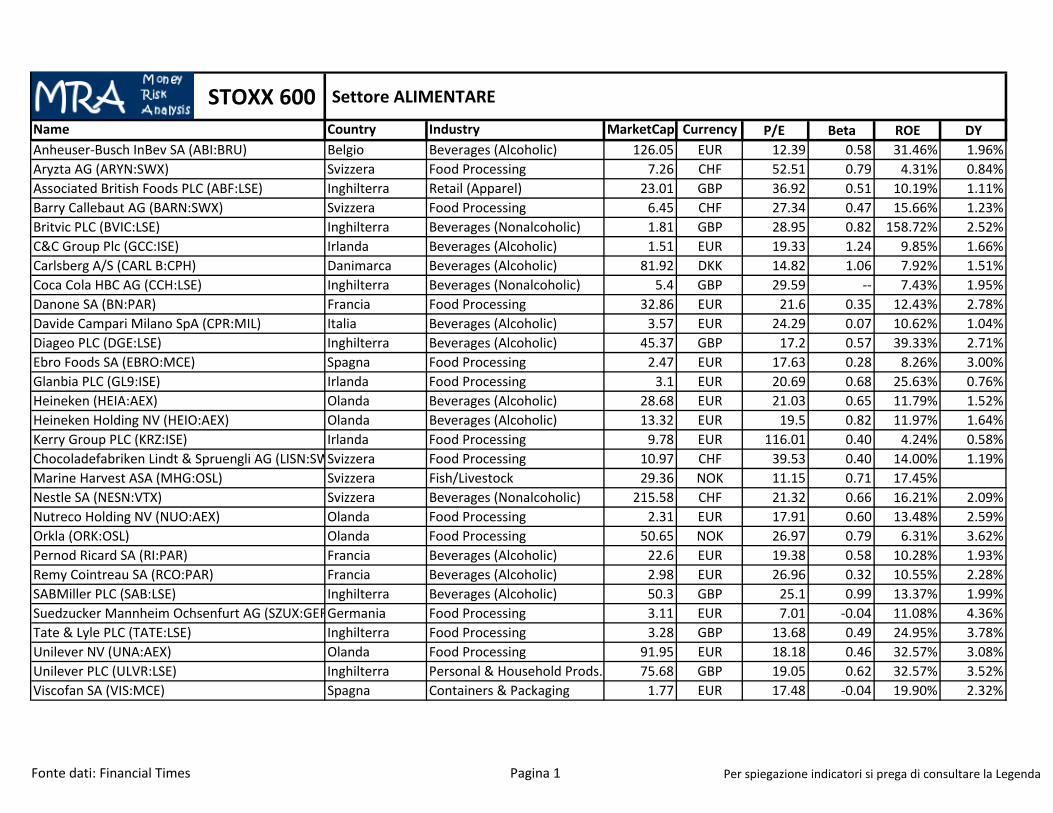
Name Country Industry MarketCap Currency P/E Beta ROE DYAnheuser‐Busch InBev SA (ABI:BRU) Belgio Beverages (Alcoholic) 126.05 EUR 12.39 0.58 31.46% 1.96%Aryzta AG (ARYN:SWX) Svizzera Food Processing 7.26 CHF 52.51 0.79 4.31% 0.84%Associated British Foods PLC (ABF:LSE) Inghilterra Retail (Apparel) 23.01 GBP 36.92 0.51 10.19% 1.11%Barry Callebaut AG (BARN:SWX) Svizzera Food Processing 6.45 CHF 27.34 0.47 15.66% 1.23%Britvic PLC (BVIC:LSE) Inghilterra Beverages (Nonalcoholic) 1.81 GBP 28.95 0.82 158.72% 2.52%C&C Group Plc (GCC:ISE) Irlanda Beverages (Alcoholic) 1.51 EUR 19.33 1.24 9.85% 1.66%Carlsberg A/S (CARL B:CPH) Danimarca Beverages (Alcoholic) 81.92 DKK 14.82 1.06 7.92% 1.51%Coca Cola HBC AG (CCH:LSE) Inghilterra Beverages (Nonalcoholic) 5.4 GBP 29.59 ‐‐ 7.43% 1.95%Danone SA (BN:PAR) Francia Food Processing 32.86 EUR 21.6 0.35 12.43% 2.78%Davide Campari Milano SpA (CPR:MIL) Italia Beverages (Alcoholic) 3.57 EUR 24.29 0.07 10.62% 1.04%Diageo PLC (DGE:LSE) Inghilterra Beverages (Alcoholic) 45.37 GBP 17.2 0.57 39.33% 2.71%Ebro Foods SA (EBRO:MCE) Spagna Food Processing 2.47 EUR 17.63 0.28 8.26% 3.00%Glanbia PLC (GL9:ISE) Irlanda Food Processing 3.1 EUR 20.69 0.68 25.63% 0.76%Heineken (HEIA:AEX) Olanda Beverages (Alcoholic) 28.68 EUR 21.03 0.65 11.79% 1.52%Heineken Holding NV (HEIO:AEX) Olanda Beverages (Alcoholic) 13.32 EUR 19.5 0.82 11.97% 1.64%Kerry Group PLC (KRZ:ISE) Irlanda Food Processing 9.78 EUR 116.01 0.40 4.24% 0.58%Chocoladefabriken Lindt & Spruengli AG (LISN:SWSvizzera Food Processing 10.97 CHF 39.53 0.40 14.00% 1.19%Marine Harvest ASA (MHG:OSL) Svizzera Fish/Livestock 29.36 NOK 11.15 0.71 17.45%Nestle SA (NESN:VTX) Svizzera Beverages (Nonalcoholic) 215.58 CHF 21.32 0.66 16.21% 2.09%Nutreco Holding NV (NUO:AEX) Olanda Food Processing 2.31 EUR 17.91 0.60 13.48% 2.59%Orkla (ORK:OSL) Olanda Food Processing 50.65 NOK 26.97 0.79 6.31% 3.62%Pernod Ricard SA (RI:PAR) Francia Beverages (Alcoholic) 22.6 EUR 19.38 0.58 10.28% 1.93%Remy Cointreau SA (RCO:PAR) Francia Beverages (Alcoholic) 2.98 EUR 26.96 0.32 10.55% 2.28%SABMiller PLC (SAB:LSE) Inghilterra Beverages (Alcoholic) 50.3 GBP 25.1 0.99 13.37% 1.99%Suedzucker Mannheim Ochsenfurt AG (SZUX:GERGermania Food Processing 3.11 EUR 7.01 ‐0.04 11.08% 4.36%Tate & Lyle PLC (TATE:LSE) Inghilterra Food Processing 3.28 GBP 13.68 0.49 24.95% 3.78%Unilever NV (UNA:AEX) Olanda Food Processing 91.95 EUR 18.18 0.46 32.57% 3.08%Unilever PLC (ULVR:LSE) Inghilterra Personal & Household Prods. 75.68 GBP 19.05 0.62 32.57% 3.52%Viscofan SA (VIS:MCE) Spagna Containers & Packaging 1.77 EUR 17.48 ‐0.04 19.90% 2.32%
Fonte dati: Financial Times Pagina 1 Per spiegazione indicatori si prega di consultare la Legenda

STOXX 600 Settore ALIMENTARE
Name GM NPM PoR P/CFPS QR TD/TCAnheuser‐Busch InBev SA (ABI:BRU) 59.27% 38.24% 31.34% 9.02 0.6142 0.4704Aryzta AG (ARYN:SWX) 27.19% 3.46% 53.52% 15.03 0.931 0.3529Associated British Foods PLC (ABF:LSE) ‐‐ 4.97% 41.16% 19.61 0.6167 0.1517Barry Callebaut AG (BARN:SWX) 14.68% 4.31% ‐‐ ‐‐ 0.681 0.518Britvic PLC (BVIC:LSE) 51.06% 4.68% 72.05% 17.1 0.7392 0.9312C&C Group Plc (GCC:ISE) ‐‐ 13.92% 40.34% 15.21 1.37 0.2789Carlsberg A/S (CARL B:CPH) 49.48% 8.94% 22.30% 8.25 0.447 0.36Coca Cola HBC AG (CCH:LSE) 35.43% 3.22% 58.29% 11.34 0.8337 0.4366Danone SA (BN:PAR) 48.46% 5.92% 64.35% 16.67 0.622 0.447Davide Campari Milano SpA (CPR:MIL) 53.17% 9.87% 30.76% 18.8 1.67 0.4879Diageo PLC (DGE:LSE) 61.20% 24.18% 46.63% 14.33 0.6069 0.5474Ebro Foods SA (EBRO:MCE) 44.94% 7.23% 54.85% 12.52 0.8568 0.2003Glanbia PLC (GL9:ISE) ‐‐ 6.34% 19.66% 15.55 0.884 0.4276Heineken (HEIA:AEX) 36.54% 8.26% 37.54% 9.05 0.4977 0.4974Heineken Holding NV (HEIO:AEX) 36.54% 8.26% 12.90% 4.2 0.4977 0.4974Kerry Group PLC (KRZ:ISE) 10.48% 1.45% 83.28% 50.61 0.7267 0.4116Chocoladefabriken Lindt & Spruengli AG (LISN:SW 67.43% 10.46% 0.00% 27.29 2.05 0.0027Marine Harvest ASA (MHG:OSL) 47.90% 12.75% 221.00% 8.97 2.69 0.3385Nestle SA (NESN:VTX) 47.80% 9.96% 68.47% 17.46 0.6588 0.2532Nutreco Holding NV (NUO:AEX) 11.49% 3.30% 162.16% 12.56 1.08 0.3415Orkla (ORK:OSL) ‐‐ 5.97% 132.38% 16.35 0.9253 0.2611Pernod Ricard SA (RI:PAR) 62.67% 14.38% 0.00% 16.44 0.6638 0.4082Remy Cointreau SA (RCO:PAR) 47.78% 12.00% 61.22% 19.1 0.8154 0.3228SABMiller PLC (SAB:LSE) ‐‐ 15.90% 48.04% 17.04 0.5176 0.4012Suedzucker Mannheim Ochsenfurt AG (SZUX:GER 23.72% 7.06% ‐‐ 3.73 0.8994 0.209Tate & Lyle PLC (TATE:LSE) ‐‐ 7.29% 50.63% 9.29 1.78 0.4541Unilever NV (UNA:AEX) ‐‐ 10.57% 60.61% 14.34 0.4709 0.437Unilever PLC (ULVR:LSE) ‐‐ 10.57% 63.11% 14.34 0.4709 0.437Viscofan SA (VIS:MCE) 66.25% 13.26% 51.14% 11.81 1.01 0.2028
Fonte dati: Financial Times Pagina 2 Per spiegazione indicatori si prega di consultare la Legenda

STOXX 600 Settore FARMACEUTICO
Name Country Industry MarketCap Currency P/E Beta ROE DYActelion Ltd (ATLN:VTX) Svizzera Biotechnology & Drugs 10.31 CHF 20.59 0.76 29.17% 1.40%AstraZeneca PLC (AZN:LSE) Inghilterra Biotechnology & Drugs 51.47 GBP 42.01 0.34 9.37% 4.32%BTG PLC (BTG:LSE) Inghilterra Biotechnology & Drugs 1.92 GBP 87.09 0.53 4.49% 4.32%Chr Hansen Holding A/S (CHR:CPH) Danimarca Chemical Manufacturing 32.57 DKK 30.24 0.29 22.73% 2.59%Coloplast A/S (COLO B:CPH) Danimarca Medical Equipment & Supplie 88.19 DKK 32.35 0.38 47.86% 2.29%Elekta publ AB (EKTA B:STO) Svezia Medical Equipment & Supplie 33.01 SEK 29.09 0.27 23.35% 1.56%Essilor International Compagnie Generale d'OptiqFrancia Medical Equipment & Supplie 16.15 EUR 27.03 0.22 16.00% 1.25%Fresenius SE & Co KGaA (FREX:GER) Germania Medical Equipment & Supplie 19.45 EUR 19.71 0.42 12.17% 0.85%Fresenius Medical Care AG & Co KGaA (FMEX:GE Germania Healthcare Facilities 15.31 EUR 18.61 0.24 12.20% 1.14%Gerresheimer AG (GXIX:GER) Germania Medical Equipment & Supplie 1.51 EUR 24.15 0.33 12.51% 1.46%Getinge AB (GETI B:STO) Svezia Medical Equipment & Supplie 41.96 SEK 25.38 0.62 11.76% 1.54%GlaxoSmithKline PLC (GSK:LSE) Inghilterra Biotechnology & Drugs 80.42 GBP 14.89 0.47 84.96% 4.71%GN Store Nord A/S (GN:CPH) Danimarca Medical Equipment & Supplie 22.15 DKK 30.23 1.31 13.52% 0.64%Grifols SA (GRF:MCE) Spagna Biotechnology & Drugs 11.89 EUR 37.46 0.28 17.37% 0.42%Hikma Pharmaceuticals PLC (HIK:LSE) Inghilterra Biotechnology & Drugs 3.06 GBP 24.2 0.65 22.92% 0.80%Lonza Group AG (LONN:VTX) Svizzera Biotechnology & Drugs 4.61 CHF 52.29 1.20 4.11% 2.47%Meda AB (MEDA A:STO) Svezia Biotechnology & Drugs 38.84 SEK 48.13 0.30 5.38% 1.36%Merck KGaA (MRKX:GER) Germania Major Drugs 7.71 EUR 21.56 0.56 11.25% 1.17%Novartis AG (NOVN:VTX) Svizzera Major Drugs 201.82 CHF 22.86 0.81 12.79% 2.14%Novo Nordisk A/S (NOVO B:CPH) Danimarca Biotechnology & Drugs 508.28 DKK 25.73 0.98 60.54% 1.87%Novozymes A/S (NZYM B:CPH) Danimarca Chemical Manufacturing 68.27 DKK 37.05 0.49 21.35% 0.97%Orion Oyj (ORNBV:HEX) Finlandia Biotechnology & Drugs 3.34 EUR 16.3 0.49 40.29% 5.25%Qiagen NV (QIAX:GER) Germania Biotechnology & Drugs 3.67 EUR 76.71 0.35 2.54% 5.25%Rhoen Klinikum AG (RHKX:GER) Germania Healthcare Facilities 3.24 EUR 36.73 ‐0.09 5.55% 0.78%Roche Holding AG (ROG:VTX) Svizzera Major Drugs 219.57 CHF 19.7 0.96 66.04% 1.99%Sanofi SA (SAN:PAR) Francia Biotechnology & Drugs 100.95 EUR 27.5 0.59 6.51% 3.68%Shire PLC (SHP:LSE) Inghilterra Biotechnology & Drugs 18.9 GBP 22.5 0.75 30.94% 0.42%Smith & Nephew PLC (SN.:LSE) Inghilterra Medical Equipment & Supplie 8.18 GBP 25.04 0.56 14.02% 1.81%Sonova Holding AG (SOON:SWX) Svizzera Medical Equipment & Supplie 8.44 CHF 69.38 0.99 7.62% 1.27%Stada Arzneimittel AG (SAZX.N:GER) Germania Biotechnology & Drugs 1.84 EUR 17.03 0.88 11.96% 1.60%UCB SA (UCB:BRU) Belgio Major Drugs 11.59 EUR 55.16 0.69 4.40% 1.31%
Fonte dati: Financial Times Pagina 1 Per spiegazione indicatori si prega di consultare la Legenda

STOXX 600 Settore FARMACEUTICO
Name Country Industry MarketCap Currency P/E Beta ROE DYMDC Holdings Inc (MDH:FRA) Belgio 1.34 USD 4.33 1.57 29.56% 3.60%
Fonte dati: Financial Times Pagina 2 Per spiegazione indicatori si prega di consultare la Legenda

STOXX 600 Settore FARMACEUTICO
Name GM NPM PoR P/CFPS QR TD/TCActelion Ltd (ATLN:VTX) 88.31% 26.46% 27.66% 17.99 3.25 0.122AstraZeneca PLC (AZN:LSE) 79.72% 8.02% 170.77% 12.89 0.821 0.325BTG PLC (BTG:LSE) 67.69% 8.92% 170.77% 41.3 1.33 0Chr Hansen Holding A/S (CHR:CPH) 52.49% 19.40% 38.71% 22.53 1.19 0.4427Coloplast A/S (COLO B:CPH) 67.85% 24.29% 71.79% 26.36 1.69 0.0207Elekta publ AB (EKTA B:STO) 43.99% 11.27% 65.01% 20.89 1.25 0.459Essilor International Compagnie Generale d'Optiq 55.40% 12.75% 33.33% 18.08 1.06 0.2244Fresenius SE & Co KGaA (FREX:GER) 32.13% 8.26% 22.73% 7.48 0.7415 0.4833Fresenius Medical Care AG & Co KGaA (FMEX:GE 33.71% 8.21% 28.62% 10.86 1.3 0.4645Gerresheimer AG (GXIX:GER) 28.66% 5.41% 35.16% 8.78 0.6782 0.4765Getinge AB (GETI B:STO) 50.18% 7.05% 55.81% 11.42 0.8221 0GlaxoSmithKline PLC (GSK:LSE) 69.82% 21.23% 69.06% 11.9 0.8282 0.7002GN Store Nord A/S (GN:CPH) 59.92% 10.82% 19.86% 19.55 1.3 0.1932Grifols SA (GRF:MCE) 78.18% 12.48% 27.46% 25.26 1.67 0.5708Hikma Pharmaceuticals PLC (HIK:LSE) 55.97% 15.82% 18.68% 18.35 1.06 0.2995Lonza Group AG (LONN:VTX) 23.05% 2.43% 128.44% ‐‐ ‐‐ 0.5201Meda AB (MEDA A:STO) 61.21% 6.14% ‐‐ 12.99 0.295 0.481Merck KGaA (MRKX:GER) 73.03% 10.90% 10.21% 3.2 1.52 0.2504Novartis AG (NOVN:VTX) 66.67% 15.79% 69.18% 16.33 0.8827 0.1948Novo Nordisk A/S (NOVO B:CPH) 83.08% 30.13% 47.12% 18.53 1.34 0.005Novozymes A/S (NZYM B:CPH) 57.18% 18.74% 29.60% 23.23 1.51 0.0094Orion Oyj (ORNBV:HEX) 60.92% 20.48% 85.21% 13.73 2.2 0.3341Qiagen NV (QIAX:GER) 62.63% 5.31% 85.21% 22.67 2.35 0.2369Rhoen Klinikum AG (RHKX:GER) 73.84% 3.04% 39.15% 13.86 3.36 0.3397Roche Holding AG (ROG:VTX) 73.63% 24.31% 60.27% 15.92 1.48 0.4674Sanofi SA (SAN:PAR) 67.00% 11.53% 0.00% 14.95 1.26 0.2038Shire PLC (SHP:LSE) 86.41% 28.69% 8.32% 18.74 2.12 0Smith & Nephew PLC (SN.:LSE) 74.72% 12.78% 44.15% 14.99 1.16 0.0881Sonova Holding AG (SOON:SWX) 68.89% 6.76% 87.98% 40.2 1.92 0.1299Stada Arzneimittel AG (SAZX.N:GER) 48.61% 5.63% 27.34% 8.38 0.9285 0.6519UCB SA (UCB:BRU) 67.34% 5.72% 100.00% 27.74 0.768 0.374
Fonte dati: Financial Times Pagina 3 Per spiegazione indicatori si prega di consultare la Legenda

STOXX 600 Settore FARMACEUTICO
Name GM NPM PoR P/CFPS QR TD/TCMDC Holdings Inc (MDH:FRA) 18.82% 18.71% 0.00% 4.21 ‐‐ 0.4885
Fonte dati: Financial Times Pagina 4 Per spiegazione indicatori si prega di consultare la Legenda

STOXX 600 Settore BENI SERVIZI INDUSTRIALIName Country Industry MarketCap Currency P/E Beta ROE DYAP Moeller Maersk A/S (MAERSK B:CPH) Danimarca Water Transportation 264.94 DKK 15.69 1.14 8.09% 2.27%Aalberts Industries NV (AALB:AEX) Olanda Misc. Fabricated Products 2.66 EUR 19.77 1.45 13.54% 1.45%ABB Ltd (ABBN:VTX) Svizzera Electronic Instr. & Controls 53.12 CHF 21.25 1.49 15.87% 3.05%Abertis Infraestructuras SA (ABE:MCE) Spagna Misc. Transportation 13.71 EUR 23.98 0.82 15.42% 3.25%Adecco SA (ADEN:VTX) Svizzera Business Services 13.56 CHF 18.96 1.51 15.37% 2.79%Aeroports De Paris SA (ADP:PAR) Francia Misc. Transportation 8.9 EUR 29.21 0.63 8.09% 2.06%Aggreko PLC (AGK:LSE) Inghilterra Rental & Leasing 4.22 GBP 17.01 0.90 22.52% 1.68%Airbus Group NV (AIR:PAR) Francia Aerospace & Defense 39.5 EUR 27.35 0.77 13.68% 1.49%Alfa Laval AB (ALFA:STO) Svezia Misc. Capital Goods 75.59 SEK 24.97 1.04 19.86% 1.46%Alstom SA (ALO:PAR) Francia Conglomerates 8.33 EUR 11.1 1.33 16.27% 3.11%Amadeus It Holding SA (AMS:MCE) Spagna Software & Programming 13.41 EUR 23.66 0.24 33.43% 1.45%Andritz AG (ANDR:VIE) Spagna Misc. Capital Goods 4.64 EUR 69.77 0.40 6.98% 0.84%Ashtead Group PLC (AHT:LSE) Inghilterra Rental & Leasing 4.34 GBP 20.43 1.61 29.69% 0.96%Atlantia SpA (ATL:MIL) Italia Misc. Transportation 15.05 EUR 19.05 0.74 12.36% 3.27%Atlas Copco AB (ATCO A:STO) Svezia Misc. Capital Goods 230.27 SEK 19.18 1.12 32.73% 2.02%Babcock International Group PLC (BAB:LSE) Inghilterra Water Transportation 6.56 GBP 25.49 0.55 22.46% 1.98%BAE Systems PLC (BA.:LSE) Inghilterra Aerospace & Defense 12.72 GBP 77.71 0.75 4.73% 5.00%BBA Aviation PLC (BBA:LSE) Inghilterra Misc. Transportation 1.5 GBP 18.46 1.35 13.04% 2.89%Berendsen PLC (BRSN:LSE) Inghilterra Business Services 1.79 GBP 20.97 0.99 16.68% 2.69%Bilfinger SE (GBFX:GER) Germania Construction Services 3.95 EUR 22.45 0.86 8.09% 2.57%Bollore SA (BOL:PAR) Francia Water Transportation 12.22 EUR 15.04 0.60 13.21% 0.69%Bunzl PLC (BNZL:LSE) Inghilterra Containers & Packaging 5.55 GBP 26.51 0.69 22.66% 1.95%Bureau Veritas Registre International de ClassificaFrancia Business Services 9.78 EUR 28.35 0.28 32.86% 2.17%Capita PLC (CPI:LSE) Inghilterra Business Services 7.15 GBP 40.3 0.74 20.69% 2.45%Carillion PLC (CLLN:LSE) Inghilterra Business Services 1.58 GBP 15.84 0.77 10.19% 4.76%CNH Industrial NV (CNHI:MIL) Italia Constr. & Agric. Machinery 11.47 EUR ‐‐ ‐‐ ‐‐ 1.89%Cobham PLC (COB:LSE) Inghilterra Aerospace & Defense 3.33 GBP 28.97 1.00 10.90% 3.14%DCC PLC (DCC:LSE) Inghilterra Oil & Gas Operations 2.59 GBP 22.21 0.70 13.68% 1.90%Deutsche Post AG (DPWX.N:GER) Germania Trucking 32.07 EUR 16 1.01 22.16% 3.02%DKSH Holding AG (DKSH:SWX) Svizzera Business Services 4.65 CHF 20.52 ‐‐ 18.82% 1.52%DS Smith PLC (SMDS:LSE) Inghilterra Paper & Paper Products 2.92 GBP 31.06 1.66 8.34% 2.78%
Fonte dati: Financial Times Pagina 1 Per spiegazione indicatori si prega di consultare la Legenda

STOXX 600 Settore BENI SERVIZI INDUSTRIALIName Country Industry MarketCap Currency P/E Beta ROE DYDSV A/S (DSV:CPH) Danimarca Trucking 30.82 DKK 19.67 0.98 27.27% 0.86%Edenred SA (EDEN:PAR) Francia Business Services 5.61 EUR 35.42 0.55 ‐‐ 3.34%Electrocomponents PLC (ECM:LSE) Inghilterra Electronic Instr. & Controls 1.25 GBP 19.1 1.01 18.31% 4.12%Essentra PLC (ESNT:LSE) Inghilterra Security Systems & Services 1.97 GBP 32.52 1.06 18.86% 1.84%Eurazeo SA (RF:PAR) Francia Misc. Financial Services 4.08 EUR ‐‐ 1.21 ‐‐ 1.92%Experian PLC (EXPN:LSE) Inghilterra Business Services 11.17 GBP 29.07 0.99 26.11% 3.71%Finmeccanica SpA (FNC:MIL) Italia Aerospace & Defense 3.75 EUR ‐‐ 1.32 ‐17.80% 3.71%Flughafen Zuerich AG (FHZN:SWX) Svizzera Misc. Transportation 3.44 CHF 25.13 0.85 7.01% 1.16%Fraport AG Frankfurt Airport Services Worldwide Germania Misc. Transportation 4.9 EUR 21.52 0.78 7.41% 1.73%GEA Group AG (G1AX:GER) Germania Constr. & Agric. Machinery 6.23 EUR 22.11 1.21 12.58% 1.85%GEA Group AG (G1AX:GER) Germania Constr. & Agric. Machinery 6.23 EUR 22.11 1.21 12.58% 1.85%G4S PLC (GFS:LSE) Inghilterra Security Systems & Services 3.75 GBP ‐‐ 0.17 ‐24.08% 3.70%Groupe Eurotunnel SA (GET:PAR) Francia Misc. Transportation 5.32 EUR 51.6 0.76 4.37% 1.55%Halma PLC (HLMA:LSE) Inghilterra Communications Equipment 2.17 GBP 24.87 0.63 20.41% 1.86%Hays PLC (HAS:LSE) Inghilterra Business Services 2.17 GBP 27.87 1.44 38.78% 1.62%Hexagon AB (HEXA B:STO) Svezia Scientific & Technical Instr. 70.64 SEK 22.07 1.56 13.18% 0.95%Howden Joinery Group PLC (HWDN:LSE) Inghilterra Constr. ‐ Supplies & Fixtures 2.13 GBP 21.3 1.65 53.30% 1.67%Huhtamaki Oyj (HUH1V:HEX) Finlandia Containers & Packaging 2.08 EUR 21.14 0.63 12.07% 2.95%IMI PLC (IMI:LSE) Inghilterra Misc. Fabricated Products 4.07 GBP 22.02 1.39 30.82% 2.48%Intertek Group PLC (ITRK:LSE) Inghilterra Business Services 4.72 GBP 23.8 0.63 29.44% 1.57%Kaba Holding AG (KABN:SWX) Svizzera Communications Equipment 1.61 CHF 19.1 0.69 14.59% 2.61%Kone Oyj (KNEBV:HEX) Finlandia Misc. Capital Goods 13.73 EUR 25.13 0.42 50.95% 7.48%Konecranes Abp (KCR1V:HEX) Finlandia Constr. & Agric. Machinery 1.44 EUR 27.06 1.26 10.97% 4.60%Kuehne und Nagel International AG (KNIN:VTX) Svizzera Water Transportation 14.32 CHF 23.43 0.44 23.57% 3.19%Legrand SA (LR:PAR) Francia Electronic Instr. & Controls 12.43 EUR 23.73 0.65 16.52% 2.24%Leoni AG (LEOX.N:GER) Germania Communications Equipment 1.73 EUR 16.43 1.64 13.12% 1.39%Man Group PLC (EMG:LSE) Inghilterra Investment Services 1.74 GBP 56.43 1.24 2.11% 5.05%Meggitt PLC (MGGT:LSE) Inghilterra Aerospace & Defense 3.79 GBP 16.47 1.09 11.67% 2.68%Melrose Industries PLC (MRO:LSE) Inghilterra Electronic Instr. & Controls 3.04 GBP 25.73 1.57 6.12% 2.91%Metso Oyj (MEO1V:HEX) Finlandia Constr. & Agric. Machinery 4.45 EUR 17.41 1.23 15.09% 3.38%Michael Page International PLC (MPI:LSE) Inghilterra Business Services 1.4 GBP 33.04 1.64 21.86% 2.32%
Fonte dati: Financial Times Pagina 2 Per spiegazione indicatori si prega di consultare la Legenda
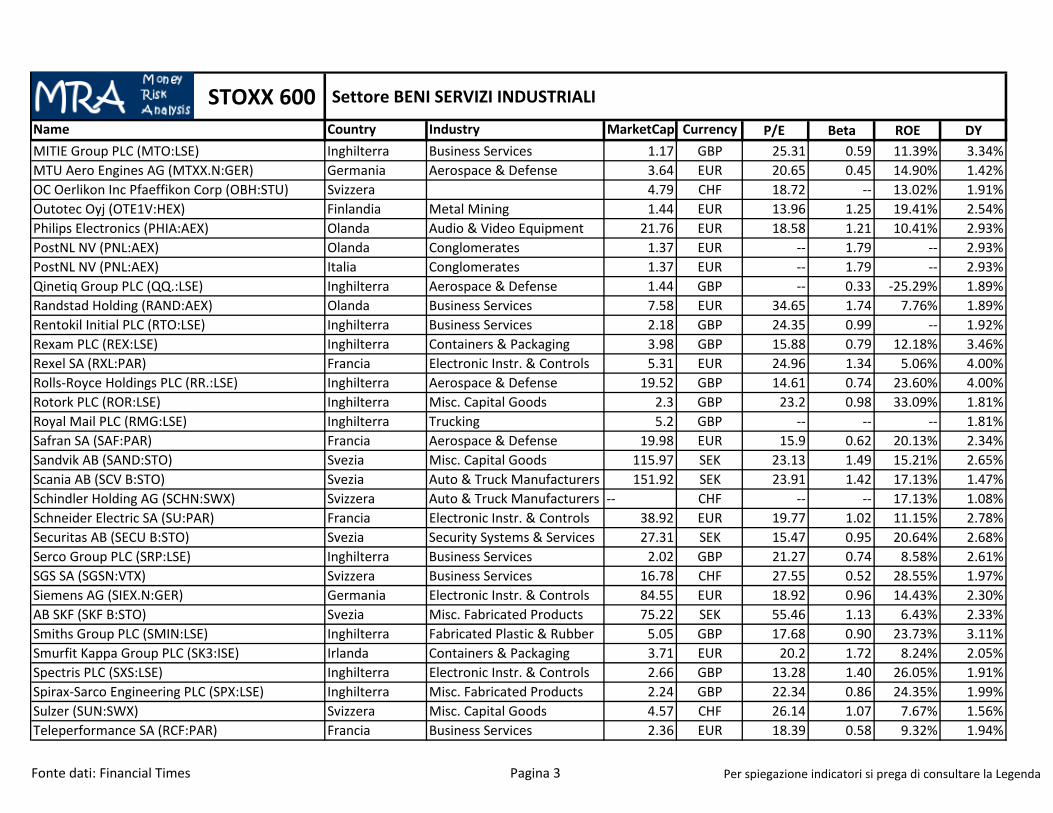
STOXX 600 Settore BENI SERVIZI INDUSTRIALIName Country Industry MarketCap Currency P/E Beta ROE DYMITIE Group PLC (MTO:LSE) Inghilterra Business Services 1.17 GBP 25.31 0.59 11.39% 3.34%MTU Aero Engines AG (MTXX.N:GER) Germania Aerospace & Defense 3.64 EUR 20.65 0.45 14.90% 1.42%OC Oerlikon Inc Pfaeffikon Corp (OBH:STU) Svizzera 4.79 CHF 18.72 ‐‐ 13.02% 1.91%Outotec Oyj (OTE1V:HEX) Finlandia Metal Mining 1.44 EUR 13.96 1.25 19.41% 2.54%Philips Electronics (PHIA:AEX) Olanda Audio & Video Equipment 21.76 EUR 18.58 1.21 10.41% 2.93%PostNL NV (PNL:AEX) Olanda Conglomerates 1.37 EUR ‐‐ 1.79 ‐‐ 2.93%PostNL NV (PNL:AEX) Italia Conglomerates 1.37 EUR ‐‐ 1.79 ‐‐ 2.93%Qinetiq Group PLC (QQ.:LSE) Inghilterra Aerospace & Defense 1.44 GBP ‐‐ 0.33 ‐25.29% 1.89%Randstad Holding (RAND:AEX) Olanda Business Services 7.58 EUR 34.65 1.74 7.76% 1.89%Rentokil Initial PLC (RTO:LSE) Inghilterra Business Services 2.18 GBP 24.35 0.99 ‐‐ 1.92%Rexam PLC (REX:LSE) Inghilterra Containers & Packaging 3.98 GBP 15.88 0.79 12.18% 3.46%Rexel SA (RXL:PAR) Francia Electronic Instr. & Controls 5.31 EUR 24.96 1.34 5.06% 4.00%Rolls‐Royce Holdings PLC (RR.:LSE) Inghilterra Aerospace & Defense 19.52 GBP 14.61 0.74 23.60% 4.00%Rotork PLC (ROR:LSE) Inghilterra Misc. Capital Goods 2.3 GBP 23.2 0.98 33.09% 1.81%Royal Mail PLC (RMG:LSE) Inghilterra Trucking 5.2 GBP ‐‐ ‐‐ ‐‐ 1.81%Safran SA (SAF:PAR) Francia Aerospace & Defense 19.98 EUR 15.9 0.62 20.13% 2.34%Sandvik AB (SAND:STO) Svezia Misc. Capital Goods 115.97 SEK 23.13 1.49 15.21% 2.65%Scania AB (SCV B:STO) Svezia Auto & Truck Manufacturers 151.92 SEK 23.91 1.42 17.13% 1.47%Schindler Holding AG (SCHN:SWX) Svizzera Auto & Truck Manufacturers ‐‐ CHF ‐‐ ‐‐ 17.13% 1.08%Schneider Electric SA (SU:PAR) Francia Electronic Instr. & Controls 38.92 EUR 19.77 1.02 11.15% 2.78%Securitas AB (SECU B:STO) Svezia Security Systems & Services 27.31 SEK 15.47 0.95 20.64% 2.68%Serco Group PLC (SRP:LSE) Inghilterra Business Services 2.02 GBP 21.27 0.74 8.58% 2.61%SGS SA (SGSN:VTX) Svizzera Business Services 16.78 CHF 27.55 0.52 28.55% 1.97%Siemens AG (SIEX.N:GER) Germania Electronic Instr. & Controls 84.55 EUR 18.92 0.96 14.43% 2.30%AB SKF (SKF B:STO) Svezia Misc. Fabricated Products 75.22 SEK 55.46 1.13 6.43% 2.33%Smiths Group PLC (SMIN:LSE) Inghilterra Fabricated Plastic & Rubber 5.05 GBP 17.68 0.90 23.73% 3.11%Smurfit Kappa Group PLC (SK3:ISE) Irlanda Containers & Packaging 3.71 EUR 20.2 1.72 8.24% 2.05%Spectris PLC (SXS:LSE) Inghilterra Electronic Instr. & Controls 2.66 GBP 13.28 1.40 26.05% 1.91%Spirax‐Sarco Engineering PLC (SPX:LSE) Inghilterra Misc. Fabricated Products 2.24 GBP 22.34 0.86 24.35% 1.99%Sulzer (SUN:SWX) Svizzera Misc. Capital Goods 4.57 CHF 26.14 1.07 7.67% 1.56%Teleperformance SA (RCF:PAR) Francia Business Services 2.36 EUR 18.39 0.58 9.32% 1.94%
Fonte dati: Financial Times Pagina 3 Per spiegazione indicatori si prega di consultare la Legenda

STOXX 600 Settore BENI SERVIZI INDUSTRIALIName Country Industry MarketCap Currency P/E Beta ROE DYThales SA (HO:PAR) Francia Aerospace & Defense 9.26 EUR 15.87 0.77 15.39% 2.49%ThyssenKrupp AG (TKAX:GER) Germania Iron & Steel 11.33 EUR ‐‐ 1.58 ‐54.83% 2.49%TNT Express NV (TNTE:AEX) Olanda Trucking 3.6 EUR ‐‐ ‐‐ ‐3.70% 0.59%Travis Perkins PLC (TPK:LSE) Inghilterra Retail (Home Improvement) 4.41 GBP 16.93 2.20 10.97% 1.73%Trelleborg AB (TREL B:STO) Svezia Chemical Manufacturing 33.31 SEK 20.91 1.84 12.00% 1.66%Ultra Electronics Holdings PLC (ULE:LSE) Inghilterra Aerospace & Defense 1.21 GBP 31.66 0.66 12.04% 2.44%Vallourec SA (VK:PAR) Francia Constr. ‐ Supplies & Fixtures 5.42 EUR ‐‐ 1.26 ‐‐ 1.91%Vallourec SA (VK:PAR) Svezia Constr. ‐ Supplies & Fixtures 5.42 EUR ‐‐ 1.26 ‐‐ 1.91%Koninklijke Vopak NV (VPK:AEX) Olanda Misc. Transportation 4.53 EUR 14.44 0.29 18.22% 2.16%Wartsila Oyj Abp (WRT1V:HEX) Finlandia Business Services 7.9 EUR 20.2 0.91 21.67% 2.62%Weir Group PLC (WEIR:LSE) Inghilterra Misc. Capital Goods 5.68 GBP 16.99 1.39 24.01% 1.58%Wirecard AG (WDIX:GER) Germania Business Services 3.68 EUR 40.15 0.17 14.39% 0.30%Wolseley PLC (WOS:LSE) Inghilterra Misc. Capital Goods 9.11 GBP 23.23 1.20 14.38% 2.13%WS Atkins PLC (ATK:LSE) Inghilterra Construction Services 1.35 GBP 14.71 0.72 100.44% 2.40%Zardoya Otis SA (ZOT:MCE) Spagna Misc. Capital Goods 5.23 EUR 32.32 0.38 49.59% 2.16%Zodiac Aerospace SA (ZC:PAR) Francia Aerospace & Defense 6.99 EUR 18.01 0.38 17.13% 1.32%
Fonte dati: Financial Times Pagina 4 Per spiegazione indicatori si prega di consultare la Legenda

STOXX 600 Settore BENI SERVIZI INDUSTRIALIName GM NPM PoR P/CFPS QR TD/TCAP Moeller Maersk A/S (MAERSK B:CPH) ‐‐ 7.14% 35.85% 5.89 1.26 0.2702Aalberts Industries NV (AALB:AEX) 59.97% 6.66% ‐‐ 11.4 0.3811 0.313ABB Ltd (ABBN:VTX) 28.66% 7.03% 64.34% 14.14 1.22 0.2946Abertis Infraestructuras SA (ABE:MCE) ‐‐ 15.54% 0.00% 7.21 1.42 0.715Adecco SA (ADEN:VTX) 18.25% 2.86% 52.06% 15.86 ‐‐ 0.3666Aeroports De Paris SA (ADP:PAR) 97.56% 11.06% 0.00% 11.99 1.25 0.522Aggreko PLC (AGK:LSE) 59.12% 15.64% 28.46% 8.05 1.2 0.2602Airbus Group NV (AIR:PAR) 14.11% 2.49% 0.00% 11.47 0.4536 0.5048Alfa Laval AB (ALFA:STO) 35.36% 10.16% 51.96% 18.66 0.8442 0.1986Alstom SA (ALO:PAR) 19.95% 3.67% 34.19% 6.68 0.739 0.5246Amadeus It Holding SA (AMS:MCE) 74.10% 17.98% 73.05% 15.48 ‐‐ 0.4808Andritz AG (ANDR:VIE) 43.44% 0.93% 77.90% 22.35 0.8909 0.4057Ashtead Group PLC (AHT:LSE) ‐‐ 13.37% 19.44% 8.92 1.23 0.6164Atlantia SpA (ATL:MIL) 93.75% 16.40% 86.08% 13.75 0.9934 0.6845Atlas Copco AB (ATCO A:STO) 38.29% 14.40% ‐‐ 15.57 1.67 0.3914Babcock International Group PLC (BAB:LSE) ‐‐ 6.31% 0.00% 21.28 0.6728 0.4337BAE Systems PLC (BA.:LSE) 3.36% 1.04% 385.90% 19.02 0.65 0.4612BBA Aviation PLC (BBA:LSE) 19.35% 6.22% 53.42% 12.06 1.1 0.3717Berendsen PLC (BRSN:LSE) 50.38% 8.08% 57.02% 6.21 1.05 0.4736Bilfinger SE (GBFX:GER) 13.26% 2.05% 78.36% 8.74 1.01 0.2131Bollore SA (BOL:PAR) 28.54% 8.25% 15.44% 9.97 0.9591 0.298Bunzl PLC (BNZL:LSE) ‐‐ 3.39% 53.31% 19.07 0.8132 0.497Bureau Veritas Registre International de Classifica 71.51% 9.06% 0.00% 19.32 ‐‐ 0.6061Capita PLC (CPI:LSE) 27.43% 4.41% 98.14% 19.24 ‐‐ 0.7162Carillion PLC (CLLN:LSE) 10.44% 3.19% 75.05% 10.5 0.9838 0.39CNH Industrial NV (CNHI:MIL) ‐‐ ‐‐ 75.05% ‐‐ 2.64 0.7963Cobham PLC (COB:LSE) 31.78% 6.40% 90.38% 11.84 0.613 0.3852DCC PLC (DCC:LSE) 7.28% 1.06% 40.26% 13.35 1.04 0.5591Deutsche Post AG (DPWX.N:GER) 10.91% 4.01% 46.26% 9.03 0.988 0.3715DKSH Holding AG (DKSH:SWX) 9.00% 2.53% 30.94% 16.31 1.12 0.0773DS Smith PLC (SMDS:LSE) 46.39% 2.31% 86.14% 10.95 0.7097 0.4462
Fonte dati: Financial Times Pagina 5 Per spiegazione indicatori si prega di consultare la Legenda

STOXX 600 Settore BENI SERVIZI INDUSTRIALIName GM NPM PoR P/CFPS QR TD/TCDSV A/S (DSV:CPH) 21.89% 3.44% ‐‐ 14.88 ‐‐ 0.5158Edenred SA (EDEN:PAR) ‐‐ 16.60% 116.88% 27.5 0.792 5.37Electrocomponents PLC (ECM:LSE) 45.92% 5.20% 78.39% 13.33 1.05 0.3166Essentra PLC (ESNT:LSE) ‐‐ 7.56% 60.22% 19.48 1.06 0.3982Eurazeo SA (RF:PAR) ‐‐ ‐‐ ‐‐ ‐‐ 1.24 0.5876Experian PLC (EXPN:LSE) ‐‐ 13.88% 53.19% 22.81 0.8217 0.5818Finmeccanica SpA (FNC:MIL) 41.14% ‐3.48% ‐‐ ‐‐ 0.6593 0.5992Flughafen Zuerich AG (FHZN:SWX) 62.56% 14.06% 44.79% 9.51 1.16 0.3901Fraport AG Frankfurt Airport Services Worldwide 77.46% 9.20% 52.13% 8.33 1.36 0.5901GEA Group AG (G1AX:GER) 31.54% 6.53% 37.63% 15.03 1.45 0.307GEA Group AG (G1AX:GER) 31.54% 6.53% 37.63% 15.03 1.45 0.307G4S PLC (GFS:LSE) 20.02% ‐3.04% ‐‐ ‐‐ 1.33 0.7102Groupe Eurotunnel SA (GET:PAR) 62.30% 9.28% 79.73% 19.88 1.81 0.613Halma PLC (HLMA:LSE) ‐‐ 13.36% 46.32% 17.76 1.59 0.2501Hays PLC (HAS:LSE) ‐‐ 2.06% 44.63% 21.37 ‐‐ 0.4348Hexagon AB (HEXA B:STO) 55.48% 15.28% 0.00% 15.33 0.619 0.3597Howden Joinery Group PLC (HWDN:LSE) 61.70% 10.43% 35.42% 18 1.48 0.0008Huhtamaki Oyj (HUH1V:HEX) 14.85% 4.17% 62.62% 10.72 1.31 0.4487IMI PLC (IMI:LSE) ‐‐ 11.11% 57.88% 15.64 1.34 0.3149Intertek Group PLC (ITRK:LSE) ‐‐ 9.93% 37.02% 15.21 1.61 0.4926Kaba Holding AG (KABN:SWX) 29.49% 8.71% 50.02% 13.93 1.14 0.1259Kone Oyj (KNEBV:HEX) 15.09% 10.47% ‐‐ 16.94 0.6125 0.1223Konecranes Abp (KCR1V:HEX) ‐‐ 2.35% 123.69% 13.7 0.8882 0.4183Kuehne und Nagel International AG (KNIN:VTX) 14.79% 3.64% 114.65% 17.5 1.26 0.0232Legrand SA (LR:PAR) 51.65% 11.96% 50.69% 18.28 1.13 0.3275Leoni AG (LEOX.N:GER) 17.30% 2.70% 30.96% 7.64 0.8538 0.3582Man Group PLC (EMG:LSE) ‐‐ 6.21% 267.92% 12.01 ‐‐ 0Meggitt PLC (MGGT:LSE) 40.08% 14.19% 43.62% 9.7 1.08 0.2469Melrose Industries PLC (MRO:LSE) 35.05% 7.03% 81.80% 13.71 0.9502 0.1349Metso Oyj (MEO1V:HEX) 29.83% 6.17% 58.77% 10.57 1 0.4683Michael Page International PLC (MPI:LSE) 51.11% 4.24% 23.51% 23.36 ‐‐ 0.008
Fonte dati: Financial Times Pagina 6 Per spiegazione indicatori si prega di consultare la Legenda

STOXX 600 Settore BENI SERVIZI INDUSTRIALIName GM NPM PoR P/CFPS QR TD/TCMITIE Group PLC (MTO:LSE) 15.96% 2.24% 84.48% 14.45 1.14 0.403MTU Aero Engines AG (MTXX.N:GER) 14.70% 4.61% 39.85% 10.82 0.6455 0.3585OC Oerlikon Inc Pfaeffikon Corp (OBH:STU) 29.10% 8.98% 35.94% 12.43 1.67 0.1277Outotec Oyj (OTE1V:HEX) 20.69% 4.81% 39.30% 11.24 1.22 0.3322Philips Electronics (PHIA:AEX) 41.60% 5.02% 59.36% 8.69 0.9118 0.2521PostNL NV (PNL:AEX) 96.12% ‐3.95% ‐‐ ‐‐ 0.9283 2.14PostNL NV (PNL:AEX) 96.12% ‐3.95% ‐‐ ‐‐ 0.9283 2.14Qinetiq Group PLC (QQ.:LSE) ‐‐ ‐10.92% ‐‐ ‐‐ 1.23 0.2547Randstad Holding (RAND:AEX) 18.17% 1.39% 82.66% 17.04 ‐‐ 0.2358Rentokil Initial PLC (RTO:LSE) ‐‐ 3.92% 46.47% 7.32 0.8281 1.19Rexam PLC (REX:LSE) ‐‐ 6.42% 54.43% 9.5 1.32 0.4419Rexel SA (RXL:PAR) 24.51% 1.62% 100.31% 16.01 1.22 0.4243Rolls‐Royce Holdings PLC (RR.:LSE) 21.38% 8.89% 30.29% 8.96 0.9713 0.2734Rotork PLC (ROR:LSE) 47.43% 17.20% 41.94% 19.24 1.76 0.0066Royal Mail PLC (RMG:LSE) ‐‐ ‐‐ 41.94% ‐‐ 0.878 0.3516Safran SA (SAF:PAR) 82.75% 8.76% 37.21% 9.25 0.686 0.3322Sandvik AB (SAND:STO) 32.61% 5.74% 0.00% 11.96 0.8806 0.5131Scania AB (SCV B:STO) 24.76% 7.17% 50.34% 16.27 0.9756 0.5526Schindler Holding AG (SCHN:SWX) 24.76% 7.17% 50.34% 16.27 0.9756 0.5526Schneider Electric SA (SU:PAR) 37.75% 8.25% ‐‐ 14.08 1.17 0.3247Securitas AB (SECU B:STO) 17.39% 2.82% 0.00% 8.88 ‐‐ 0.5965Serco Group PLC (SRP:LSE) 11.64% 2.22% 53.88% 10.65 1.19 0.4443SGS SA (SGSN:VTX) 44.63% 10.94% ‐‐ 17.93 1.75 0.3716Siemens AG (SIEX.N:GER) 27.77% 5.94% 58.64% 11.58 0.8403 0.4308AB SKF (SKF B:STO) 24.96% 2.30% 184.52% 21.78 1.41 0.5029Smiths Group PLC (SMIN:LSE) 45.20% 9.42% 54.42% 12.1 1.12 0.4687Smurfit Kappa Group PLC (SK3:ISE) 28.89% 2.46% ‐‐ 6.53 1.09 0.551Spectris PLC (SXS:LSE) 58.04% 16.64% 25.35% 10.6 1.06 0.1491Spirax‐Sarco Engineering PLC (SPX:LSE) ‐‐ 14.84% 43.55% 17.36 1.98 0.2Sulzer (SUN:SWX) 30.73% 5.40% 62.83% 14.72 1.54 0.1965Teleperformance SA (RCF:PAR) 100.00% 5.30% 0.00% 10.02 ‐‐ 0.0523
Fonte dati: Financial Times Pagina 7 Per spiegazione indicatori si prega di consultare la Legenda
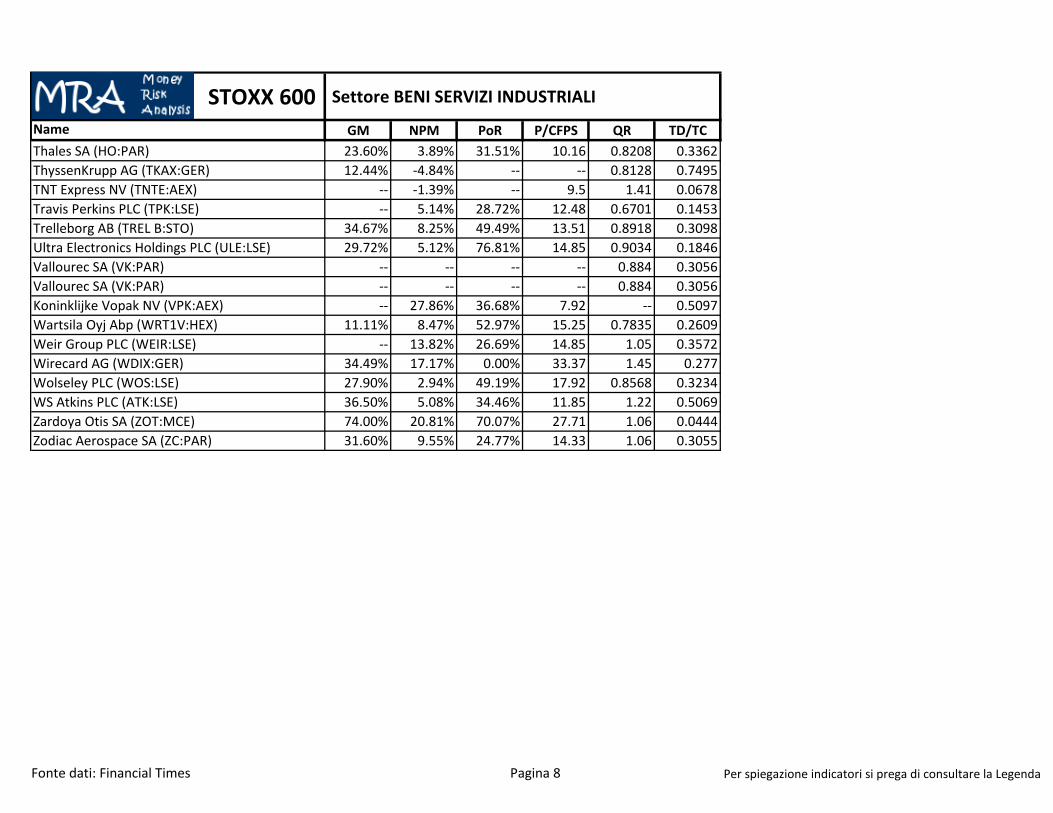
STOXX 600 Settore BENI SERVIZI INDUSTRIALIName GM NPM PoR P/CFPS QR TD/TCThales SA (HO:PAR) 23.60% 3.89% 31.51% 10.16 0.8208 0.3362ThyssenKrupp AG (TKAX:GER) 12.44% ‐4.84% ‐‐ ‐‐ 0.8128 0.7495TNT Express NV (TNTE:AEX) ‐‐ ‐1.39% ‐‐ 9.5 1.41 0.0678Travis Perkins PLC (TPK:LSE) ‐‐ 5.14% 28.72% 12.48 0.6701 0.1453Trelleborg AB (TREL B:STO) 34.67% 8.25% 49.49% 13.51 0.8918 0.3098Ultra Electronics Holdings PLC (ULE:LSE) 29.72% 5.12% 76.81% 14.85 0.9034 0.1846Vallourec SA (VK:PAR) ‐‐ ‐‐ ‐‐ ‐‐ 0.884 0.3056Vallourec SA (VK:PAR) ‐‐ ‐‐ ‐‐ ‐‐ 0.884 0.3056Koninklijke Vopak NV (VPK:AEX) ‐‐ 27.86% 36.68% 7.92 ‐‐ 0.5097Wartsila Oyj Abp (WRT1V:HEX) 11.11% 8.47% 52.97% 15.25 0.7835 0.2609Weir Group PLC (WEIR:LSE) ‐‐ 13.82% 26.69% 14.85 1.05 0.3572Wirecard AG (WDIX:GER) 34.49% 17.17% 0.00% 33.37 1.45 0.277Wolseley PLC (WOS:LSE) 27.90% 2.94% 49.19% 17.92 0.8568 0.3234WS Atkins PLC (ATK:LSE) 36.50% 5.08% 34.46% 11.85 1.22 0.5069Zardoya Otis SA (ZOT:MCE) 74.00% 20.81% 70.07% 27.71 1.06 0.0444Zodiac Aerospace SA (ZC:PAR) 31.60% 9.55% 24.77% 14.33 1.06 0.3055
Fonte dati: Financial Times Pagina 8 Per spiegazione indicatori si prega di consultare la Legenda

STOXX 600 Settore ASSICURAZIONIName Country Industry MarketCap Currency P/E Beta ROE DYAdmiral Group PLC (ADM:LSE) Inghilterra Insurance (Prop. & Casualty) 3.94 GBP 13.65 0.93 59.00% 3.29%Aegon NV (AGN:AEX) Olanda Insurance (Life) 13.67 EUR 22.28 1.39 2.23% 2.92%Ageas SA (FORB:BRU) Belgio Insurance (Miscellaneous) 7.34 EUR 12.67 2.14 6.22% 3.34%Allianz SE (ALVX:GER) Germania Insurance (Prop. & Casualty) 55.35 EUR 9.32 1.26 11.94% 3.22%Amlin PLC (AML:LSE) Inghilterra Insurance (Prop. & Casualty) 2.22 GBP 7.51 0.90 18.81% 5.86%Assicurazioni Generali SpA (G:MIL) Italia Insurance (Life) 25.69 EUR 18.76 1.19 6.99% 2.18%Aviva PLC (AV.:LSE) Inghilterra Insurance (Life) 15.01 GBP 23.44 1.33 8.02% 2.94%Axa SA (CS:PAR) Francia Insurance (Life) 45.15 EUR 11.02 1.59 7.88% 4.34%Baloise Holding AG (BALN:VTX) Svizzera Insurance (Life) 5.46 CHF 11.61 1.25 9.57% 2.83%Catlin Group Ltd (CGL:LSE) Inghilterra Insurance (Prop. & Casualty) 1.92 GBP 8.75 0.75 12.82% 5.86%CNP Assurances SA (CNP:PAR) Francia Insurance (Life) 10.97 EUR 10.38 1.10 7.16% 4.82%Delta Lloyd NV (DL:AEX) Olanda Insurance (Life) 3.55 EUR 29.97 1.04 6.78% 4.73%Direct Line Insurance Group PLC (DLG:LSE) Inghilterra Insurance (Prop. & Casualty) 3.62 GBP 11.58 ‐‐ 11.13% 5.22%Direct Line Insurance Group PLC (DLG:LSE) Inghilterra Insurance (Prop. & Casualty) 3.62 GBP 11.58 ‐‐ 11.13% 5.22%Hannover Rueck SE (HNRX.N:GER) Germania Insurance (Prop. & Casualty) 7.98 EUR 8.92 0.60 15.02% 3.34%Helvetia Holding AG (HELN:SWX) Svizzera Insurance (Life) 3.87 CHF 10.93 1.40 9.36% 2.54%Hiscox Ltd (HSX:LSE) Inghilterra Insurance (Prop. & Casualty) 2.24 GBP 9.82 0.57 17.14%ING Groep (INGA:AEX) Olanda Insurance (Life) 37.89 EUR 16.01 1.76 4.65%Lancashire Holdings Ltd (LRE:LSE) Inghilterra Insurance (Prop. & Casualty) 1.26 GBP 10 0.27 15.63% 1.35%Legal & General Group PLC (LGEN:LSE) Inghilterra Investment Services 12.28 GBP 13.84 1.58 16.11% 4.48%Mapfre SA (MAP:MCE) Spagna Insurance (Life) 9.35 EUR 11.8 1.13 10.13% 3.12%Muenchener Rueckversicherung (MUV2:MUN) Germania 29.65 EUR 8.93 0.68 12.46% 3.23%Old Mutual PLC (OML:LSE) Inghilterra Insurance (Life) 9.53 GBP 13.83 1.15 9.58% 4.16%Prudential PLC (PRU:LSE) Inghilterra Insurance (Life) 34.42 GBP 25.45 1.55 13.45% 2.50%Resolution Ltd (RSL:LSE) Inghilterra Insurance (Life) 4.17 GBP 20.48 1.27 3.85% 7.18%RSA Insurance Group PLC (RSA:LSE) Inghilterra Insurance (Prop. & Casualty) 4.86 GBP ‐‐ 0.62 ‐10.72% 5.72%Sampo Oyj (SAMAS:HEX) Finlandia Insurance (Prop. & Casualty) 19.83 EUR 13.68 0.75 14.05% 4.65%Scor SE (SCR:PAR) Francia Insurance (Prop. & Casualty) 5.01 EUR 8.96 0.79 11.27% 4.98%St. James's Place PLC (STJ:LSE) Inghilterra Investment Services 4.03 GBP 21.18 1.31 22.83% 2.05%Standard Life PLC (SL.:LSE) Inghilterra Insurance (Life) 9.02 GBP 19.32 1.20 10.85% 4.19%Storebrand ASA (STB:OSL) Inghilterra Insurance (Life) 14.87 NOK 7.48 1.32 9.35% 4.19%
Fonte dati: Financial Times Pagina 1 Per spiegazione indicatori si prega di consultare la Legenda

STOXX 600 Settore ASSICURAZIONIName Country Industry MarketCap Currency P/E Beta ROE DYSwiss Life Holding AG (SLHN:VTX) Svizzera Insurance (Life) 6.88 CHF 8.82 1.66 8.19% 2.56%Swiss Re AG (SREN:VTX) Svizzera Insurance (Life) 27.92 CHF 7.2 1.34 13.27% 10.62%Topdanmark A/S (TOP:CPH) Danimarca Insurance (Life) 19.38 DKK 12.35 0.26 27.82% 10.62%Tryg A/S (TRYG:CPH) Danimarca Insurance (Prop. & Casualty) 31.12 DKK 13.48 0.13 19.51% 5.32%UnipolSai Assicurazioni SpA (US:MIL) Italia Insurance (Prop. & Casualty) 7.42 EUR ‐‐ 1.69 ‐‐ 5.81%Vienna Insurance Group AG Wiener Vers (BAAVIGRepubblica Ceca 4.66 EUR 23.19 0.81 3.94% 5.81%Zurich Insurance Group AG (ZURN:VTX) Svizzera Insurance (Prop. & Casualty) 37.43 CHF 10.48 1.29 12.02% 6.76%
Fonte dati: Financial Times Pagina 2 Per spiegazione indicatori si prega di consultare la Legenda

STOXX 600 Settore ASSICURAZIONIName GM NPM PoR P/CFPS QR TD/TCAdmiral Group PLC (ADM:LSE) ‐‐ 31.04% 94.88% 11.37 ‐‐ 0.0002Aegon NV (AGN:AEX) ‐‐ 1.95% 71.78% ‐‐ ‐‐ 0.328Ageas SA (FORB:BRU) ‐‐ 5.48% 0.00% ‐‐ ‐‐ 0.3205Allianz SE (ALVX:GER) ‐‐ 7.02% 40.11% 7.43 ‐‐ 0.3586Amlin PLC (AML:LSE) ‐‐ 14.26% 43.56% 7 ‐‐ 0.1892Assicurazioni Generali SpA (G:MIL) ‐‐ 1.98% 51.69% ‐‐ ‐‐ 0.5254Aviva PLC (AV.:LSE) ‐‐ 2.53% 66.20% ‐‐ ‐‐ 0.448Axa SA (CS:PAR) ‐‐ 3.83% 46.64% 7.69 ‐‐ 0.1584Baloise Holding AG (BALN:VTX) ‐‐ 4.76% 52.45% 9.85 ‐‐ 0.2571Catlin Group Ltd (CGL:LSE) ‐‐ 10.75% 45.41% 7.77 ‐‐ 0.024CNP Assurances SA (CNP:PAR) ‐‐ 3.10% 51.29% 7.56 ‐‐ 0.4269Delta Lloyd NV (DL:AEX) ‐‐ 3.67% 116.47% 6.81 ‐‐ 0.6452Direct Line Insurance Group PLC (DLG:LSE) ‐‐ 7.97% 98.69% ‐‐ ‐‐ 0.1626Direct Line Insurance Group PLC (DLG:LSE) ‐‐ 7.97% 98.69% ‐‐ ‐‐ 0.1626Hannover Rueck SE (HNRX.N:GER) ‐‐ 6.88% 40.40% 8.23 ‐‐ 0.274Helvetia Holding AG (HELN:SWX) ‐‐ 4.32% 43.00% 9.52 ‐‐ 0.3834Hiscox Ltd (HSX:LSE) ‐‐ 17.43% 31.32% 9.05 ‐‐ 0.0002ING Groep (INGA:AEX) ‐‐ 11.76% 31.32% 9.69 ‐‐ 0.7687Lancashire Holdings Ltd (LRE:LSE) ‐‐ 34.53% 11.88% 8.97 ‐‐ 0.1854Legal & General Group PLC (LGEN:LSE) ‐‐ 2.28% 61.59% ‐‐ ‐‐ 0.3564Mapfre SA (MAP:MCE) ‐‐ 5.39% 50.54% ‐‐ ‐‐ 0.0569Muenchener Rueckversicherung (MUV2:MUN) ‐‐ 5.26% 38.21% ‐‐ ‐‐ 0.1512Old Mutual PLC (OML:LSE) ‐‐ 4.95% 59.64% ‐‐ ‐‐ 0.2254Prudential PLC (PRU:LSE) ‐‐ 2.57% 63.82% ‐‐ ‐‐ 0.4432Resolution Ltd (RSL:LSE) ‐‐ 2.14% 147.06% 5.77 ‐‐ 0.1591RSA Insurance Group PLC (RSA:LSE) ‐‐ ‐3.65% ‐‐ ‐‐ ‐‐ 0.3482Sampo Oyj (SAMAS:HEX) ‐‐ 21.73% 63.64% ‐‐ ‐‐ 0.1887Scor SE (SCR:PAR) ‐‐ 5.16% 43.91% ‐‐ ‐‐ 0.2919St. James's Place PLC (STJ:LSE) ‐‐ 2.78% 43.12% 20.41 ‐‐ 0.1707Standard Life PLC (SL.:LSE) ‐‐ 2.41% 80.47% ‐‐ ‐‐ 0.3002Storebrand ASA (STB:OSL) ‐‐ 3.74% 0.00% 5.38 ‐‐ 0.3278
Fonte dati: Financial Times Pagina 3 Per spiegazione indicatori si prega di consultare la Legenda

STOXX 600 Settore ASSICURAZIONIName GM NPM PoR P/CFPS QR TD/TCSwiss Life Holding AG (SLHN:VTX) ‐‐ 4.28% 22.46% 6.08 ‐‐ 0.2896Swiss Re AG (SREN:VTX) ‐‐ 12.53% 69.76% 3.72 ‐‐ 0.3599Topdanmark A/S (TOP:CPH) ‐‐ 9.79% 69.76% ‐‐ ‐‐ 0.3942Tryg A/S (TRYG:CPH) ‐‐ 11.68% 73.34% ‐‐ ‐‐ 0.252UnipolSai Assicurazioni SpA (US:MIL) ‐‐ ‐6.03% ‐‐ ‐‐ ‐‐ 0.3334Vienna Insurance Group AG Wiener Vers (BAAVIG ‐‐ 2.55% 82.84% ‐‐ ‐‐ 0.1702Zurich Insurance Group AG (ZURN:VTX) ‐‐ 6.42% 62.86% 8.2 ‐‐ 0.2629
Fonte dati: Financial Times Pagina 4 Per spiegazione indicatori si prega di consultare la Legenda

STOXX 600 Settore MEDIA
Name Country Industry MarketCap Currency P/E Beta ROE DYBritish Sky Broadcasting Group PLC (BSY:LSE) Inghilterra Broadcasting & Cable TV 14.06 GBP 15.94 0.46 101.57% 3.46%Daily Mail and General Trust (DMGT:LSE) Inghilterra Printing & Publishing 2.9 GBP 22.39 1.54 74.47% 2.35%Eutelsat Communications SA (ETL:PAR) Francia Communications Services 5.43 EUR 16.76 0.28 18.28% 4.38%Havas SA (HAV:PAR) Francia Advertising 2.29 EUR 18.31 1.07 11.47% 1.94%Informa PLC (INF:LSE) Inghilterra Printing & Publishing 2.94 GBP 28.49 1.46 8.20% 2.52%ITV PLC (ITV:LSE) Inghilterra Broadcasting & Cable TV 7.45 GBP 22.96 1.40 38.93% 1.89%Jcdecaux SA (DEC:PAR) Francia Advertising 6.66 EUR 73.16 1.00 3.58% 1.61%Kabel Deutschland Holding AG (KD8X.N:GER) Germania Broadcasting & Cable TV 8.59 EUR ‐‐ 0.31 ‐‐ 2.58%Lagardere SCA (MMB:PAR) Francia Printing & Publishing 3.89 EUR 2.94 1.15 45.40% 4.38%Mediaset SpA (MS:MIL) Italia Broadcasting & Cable TV 4.47 EUR 483.38 1.32 ‐‐Modern Times Group MTG AB (MTG B:STO) Svezia Broadcasting & Cable TV 19.48 SEK 17.83 1.44 21.66% 2.52%Pearson (PSON:LSE) Inghilterra Printing & Publishing 8.93 GBP 30.06 0.84 5.16% 4.40%Prosiebensat 1 Media AG (PSMX.N:GER) Germania Broadcasting & Cable TV 6.77 EUR 18.52 1.32 34.76% 3.50%Publicis Groupe SA (PUB:PAR) Francia Advertising 13.18 EUR 17.5 0.78 16.32% 1.78%Reed Elsevier NV (REN:AEX) Olanda Printing & Publishing 23.45 EUR 16.68 0.64 46.19% 2.86%Reed Elsevier PLC (REL:LSE) Inghilterra Printing & Publishing 19.3 GBP 17.68 0.81 47.55% 2.78%Rightmove PLC (RMV:LSE) Inghilterra Real Estate Operations 2.34 GBP 32.35 1.21 904.98% 1.19%RTL Group SA (RTL:BRU) Belgio 12.63 EUR 14.42 1.02 23.12% 7.28%Schibsted ASA (SCH:OSL) Belgio Printing & Publishing 36.4 NOK 23.55 1.05 22.40% 0.75%SES SA (SESG:PAR) Francia Communications Services 10.96 EUR 19.19 0.31 20.15% 3.36%Sky Deutschland AG (SKYX.N:GER) Germania Broadcasting & Cable TV 5.23 EUR ‐‐ 1.55 ‐71.32% 3.36%Axel Springer SE (SPRX.N:GER) Germania Computer Services 4.29 EUR 32.39 0.63 7.03% 3.06%Telenet Group Holding NV (TNET:BRU) Belgio Communications Services 4.9 EUR 42.13 0.53 ‐‐ 14.00%Television Francaise 1 SA (TFI:PAR) Francia Broadcasting & Cable TV 2.64 EUR 26.78 1.70 5.78% 4.41%UBM PLC (UBM:LSE) Inghilterra Advertising 1.63 GBP 18.36 1.39 42.64% 4.11%Vivendi SA (VIV:PAR) Francia Communications Services 26.28 EUR ‐‐ 0.91 ‐10.98% 2.55%Wolters Kluwer (WKL:AEX) Olanda Printing & Publishing 6.02 EUR 16.96 0.85 22.70% 2.98%WPP PLC (WPP:LSE) Inghilterra Advertising 16.79 GBP 18.12 1.23 13.01% 2.72%
Fonte dati: Financial Times Pagina 1 Per spiegazione indicatori si prega di consultare la Legenda

STOXX 600 Settore MEDIA
Name GM NPM PoR P/CFPS QR TD/TCBritish Sky Broadcasting Group PLC (BSY:LSE) 49.03% 12.11% 53.82% 10.46 0.655 0.7302Daily Mail and General Trust (DMGT:LSE) ‐‐ 9.40% 50.67% 10.92 0.5405 0.6676Eutelsat Communications SA (ETL:PAR) 90.55% 25.97% 73.43% 7.47 4.65 0.676Havas SA (HAV:PAR) ‐‐ 7.84% 33.07% 12.59 0.8916 0.3661Informa PLC (INF:LSE) ‐‐ 9.10% 110.64% 11.81 0.4298 0.4061ITV PLC (ITV:LSE) ‐‐ 13.81% 42.84% 17.74 1.1 0.2995Jcdecaux SA (DEC:PAR) 38.50% 3.35% ‐‐ 14.5 1.49 0.2624Kabel Deutschland Holding AG (KD8X.N:GER) 52.60% ‐1.05% ‐‐ 22.71 0.4884 2.11Lagardere SCA (MMB:PAR) 55.21% 17.44% 0.00% 2.54 0.9716 0.3483Mediaset SpA (MS:MIL) 38.25% 0.67% 0.00% 4.13 ‐‐ ‐‐Modern Times Group MTG AB (MTG B:STO) 39.72% 8.27% 0.00% 14.34 0.8497 0.2614Pearson (PSON:LSE) 54.39% 5.82% 132.65% 14.78 1.14 0.2806Prosiebensat 1 Media AG (PSMX.N:GER) 45.05% 14.00% 0.00% 14.91 1.31 0.7674Publicis Groupe SA (PUB:PAR) ‐‐ 11.56% 30.00% 13.42 0.8307 0.1435Reed Elsevier NV (REN:AEX) 64.91% 18.48% 52.37% ‐‐ ‐‐ 0Reed Elsevier PLC (REL:LSE) 64.90% 18.48% 48.71% 21.7 ‐‐ 0Rightmove PLC (RMV:LSE) ‐‐ 53.12% 37.56% 30.96 ‐‐ 0RTL Group SA (RTL:BRU) 67.06% 16.10% 37.52% 10.97 0.8209 0.1363Schibsted ASA (SCH:OSL) 94.28% 10.25% 0.00% 16.51 0.8168 0.3675SES SA (SESG:PAR) ‐‐ 31.69% ‐‐ 9.93 0.7426 0.5999Sky Deutschland AG (SKYX.N:GER) 20.23% ‐8.61% ‐‐ ‐‐ 0.943 0.652Axel Springer SE (SPRX.N:GER) 41.10% 6.38% 134.92% 12.49 1.15 0.2429Telenet Group Holding NV (TNET:BRU) 39.39% 7.09% 0.00% 10.44 0.5427 1.61Television Francaise 1 SA (TFI:PAR) 52.91% 4.91% 118.32% 15.6 0.9061 0.0536UBM PLC (UBM:LSE) ‐‐ 12.42% 75.01% 12.17 ‐‐ 0.6864Vivendi SA (VIV:PAR) 41.32% ‐8.38% ‐‐ 7.95 0.9021 0.3907Wolters Kluwer (WKL:AEX) 67.94% 9.90% 58.72% 7.9 0.6513 0.6325WPP PLC (WPP:LSE) 91.44% 9.18% 49.05% 11.77 0.9723 0.3625
Fonte dati: Financial Times Pagina 2 Per spiegazione indicatori si prega di consultare la Legenda
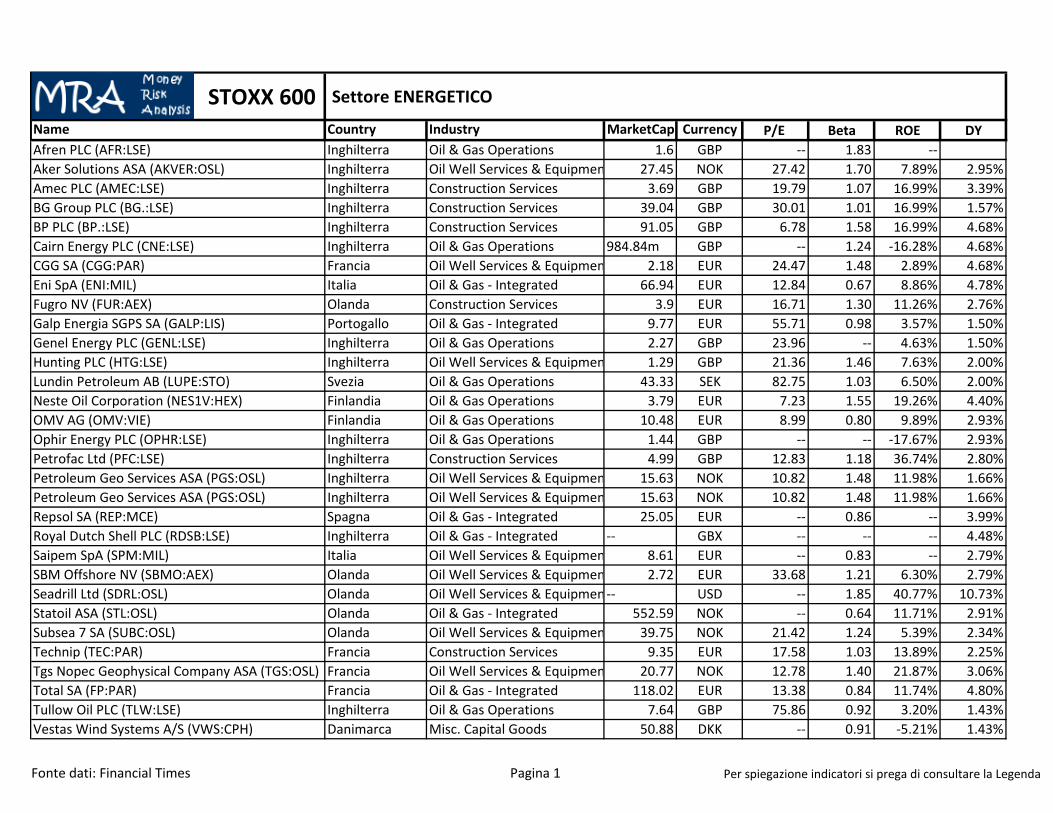
STOXX 600 Settore ENERGETICOName Country Industry MarketCap Currency P/E Beta ROE DYAfren PLC (AFR:LSE) Inghilterra Oil & Gas Operations 1.6 GBP ‐‐ 1.83 ‐‐Aker Solutions ASA (AKVER:OSL) Inghilterra Oil Well Services & Equipmen 27.45 NOK 27.42 1.70 7.89% 2.95%Amec PLC (AMEC:LSE) Inghilterra Construction Services 3.69 GBP 19.79 1.07 16.99% 3.39%BG Group PLC (BG.:LSE) Inghilterra Construction Services 39.04 GBP 30.01 1.01 16.99% 1.57%BP PLC (BP.:LSE) Inghilterra Construction Services 91.05 GBP 6.78 1.58 16.99% 4.68%Cairn Energy PLC (CNE:LSE) Inghilterra Oil & Gas Operations 984.84m GBP ‐‐ 1.24 ‐16.28% 4.68%CGG SA (CGG:PAR) Francia Oil Well Services & Equipmen 2.18 EUR 24.47 1.48 2.89% 4.68%Eni SpA (ENI:MIL) Italia Oil & Gas ‐ Integrated 66.94 EUR 12.84 0.67 8.86% 4.78%Fugro NV (FUR:AEX) Olanda Construction Services 3.9 EUR 16.71 1.30 11.26% 2.76%Galp Energia SGPS SA (GALP:LIS) Portogallo Oil & Gas ‐ Integrated 9.77 EUR 55.71 0.98 3.57% 1.50%Genel Energy PLC (GENL:LSE) Inghilterra Oil & Gas Operations 2.27 GBP 23.96 ‐‐ 4.63% 1.50%Hunting PLC (HTG:LSE) Inghilterra Oil Well Services & Equipmen 1.29 GBP 21.36 1.46 7.63% 2.00%Lundin Petroleum AB (LUPE:STO) Svezia Oil & Gas Operations 43.33 SEK 82.75 1.03 6.50% 2.00%Neste Oil Corporation (NES1V:HEX) Finlandia Oil & Gas Operations 3.79 EUR 7.23 1.55 19.26% 4.40%OMV AG (OMV:VIE) Finlandia Oil & Gas Operations 10.48 EUR 8.99 0.80 9.89% 2.93%Ophir Energy PLC (OPHR:LSE) Inghilterra Oil & Gas Operations 1.44 GBP ‐‐ ‐‐ ‐17.67% 2.93%Petrofac Ltd (PFC:LSE) Inghilterra Construction Services 4.99 GBP 12.83 1.18 36.74% 2.80%Petroleum Geo Services ASA (PGS:OSL) Inghilterra Oil Well Services & Equipmen 15.63 NOK 10.82 1.48 11.98% 1.66%Petroleum Geo Services ASA (PGS:OSL) Inghilterra Oil Well Services & Equipmen 15.63 NOK 10.82 1.48 11.98% 1.66%Repsol SA (REP:MCE) Spagna Oil & Gas ‐ Integrated 25.05 EUR ‐‐ 0.86 ‐‐ 3.99%Royal Dutch Shell PLC (RDSB:LSE) Inghilterra Oil & Gas ‐ Integrated ‐‐ GBX ‐‐ ‐‐ ‐‐ 4.48%Saipem SpA (SPM:MIL) Italia Oil Well Services & Equipmen 8.61 EUR ‐‐ 0.83 ‐‐ 2.79%SBM Offshore NV (SBMO:AEX) Olanda Oil Well Services & Equipmen 2.72 EUR 33.68 1.21 6.30% 2.79%Seadrill Ltd (SDRL:OSL) Olanda Oil Well Services & Equipmen ‐‐ USD ‐‐ 1.85 40.77% 10.73%Statoil ASA (STL:OSL) Olanda Oil & Gas ‐ Integrated 552.59 NOK ‐‐ 0.64 11.71% 2.91%Subsea 7 SA (SUBC:OSL) Olanda Oil Well Services & Equipmen 39.75 NOK 21.42 1.24 5.39% 2.34%Technip (TEC:PAR) Francia Construction Services 9.35 EUR 17.58 1.03 13.89% 2.25%Tgs Nopec Geophysical Company ASA (TGS:OSL) Francia Oil Well Services & Equipmen 20.77 NOK 12.78 1.40 21.87% 3.06%Total SA (FP:PAR) Francia Oil & Gas ‐ Integrated 118.02 EUR 13.38 0.84 11.74% 4.80%Tullow Oil PLC (TLW:LSE) Inghilterra Oil & Gas Operations 7.64 GBP 75.86 0.92 3.20% 1.43%Vestas Wind Systems A/S (VWS:CPH) Danimarca Misc. Capital Goods 50.88 DKK ‐‐ 0.91 ‐5.21% 1.43%
Fonte dati: Financial Times Pagina 1 Per spiegazione indicatori si prega di consultare la Legenda
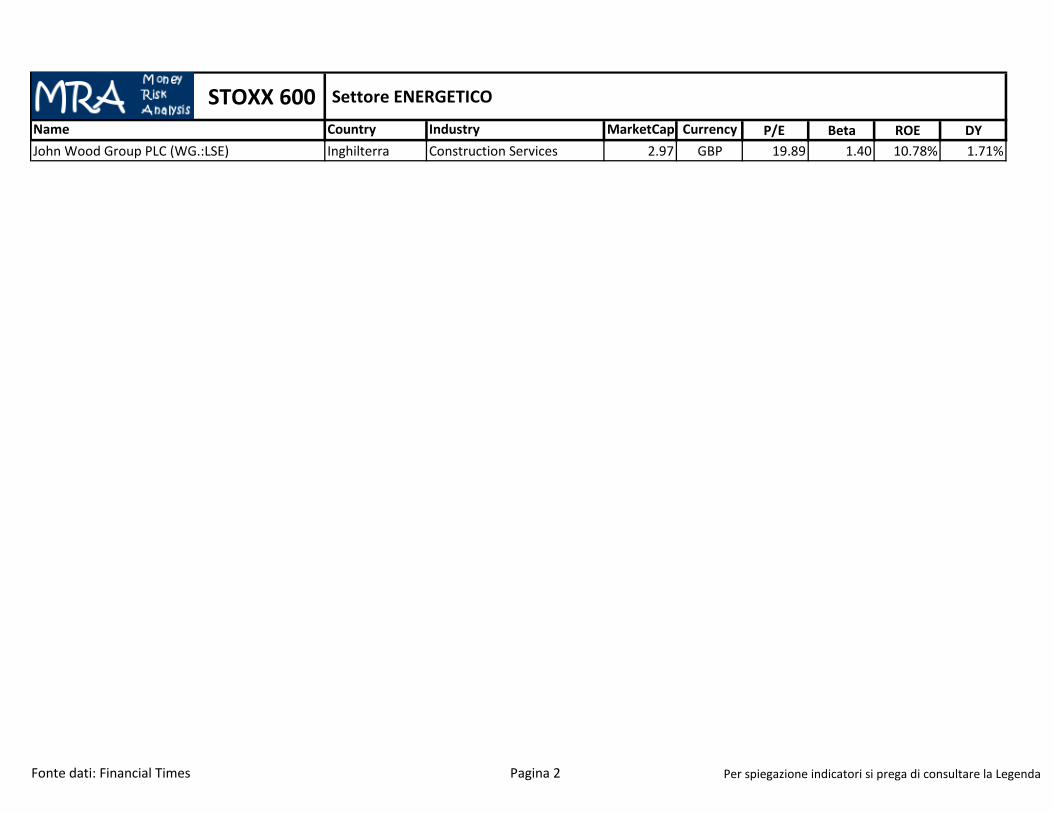
STOXX 600 Settore ENERGETICOName Country Industry MarketCap Currency P/E Beta ROE DYJohn Wood Group PLC (WG.:LSE) Inghilterra Construction Services 2.97 GBP 19.89 1.40 10.78% 1.71%
Fonte dati: Financial Times Pagina 2 Per spiegazione indicatori si prega di consultare la Legenda

STOXX 600 Settore ENERGETICOName GM NPM PoR P/CFPS QR TD/TCAfren PLC (AFR:LSE) ‐‐ ‐‐ ‐‐ 0.7442 0.405Aker Solutions ASA (AKVER:OSL) ‐‐ 2.34% 0.00% 10.47 ‐‐ 0.455Amec PLC (AMEC:LSE) 13.66% 4.68% 64.17% 15.07 1.22 0.103BG Group PLC (BG.:LSE) 13.66% 4.68% 64.17% 15.07 1.22 0.103BP PLC (BP.:LSE) 13.66% 4.68% 64.17% 15.07 1.22 0.103Cairn Energy PLC (CNE:LSE) ‐‐ ‐‐ 64.17% ‐‐ 5.76 0.017CGG SA (CGG:PAR) 22.54% 3.22% 64.17% 4.29 1.24 0.3634Eni SpA (ENI:MIL) 21.39% 4.35% ‐‐ 4.03 1.29 0.2971Fugro NV (FUR:AEX) 58.60% 8.82% 54.03% 9.66 1.55 0.278Galp Energia SGPS SA (GALP:LIS) 8.26% 1.21% 117.65% 12.94 1.33 0.3643Genel Energy PLC (GENL:LSE) 59.56% 53.35% 117.65% 13.5 4.14 0Hunting PLC (HTG:LSE) 32.62% 7.96% 42.22% 11.17 1.28 0.2096Lundin Petroleum AB (LUPE:STO) 44.99% 6.10% 42.22% 26.27 0.7222 0.4945Neste Oil Corporation (NES1V:HEX) 10.06% 2.99% 0.00% 4.47 0.7009 0.3754OMV AG (OMV:VIE) 10.25% 4.08% 68.76% 2.99 0.6891 0.2744Ophir Energy PLC (OPHR:LSE) ‐‐ ‐‐ 68.76% ‐‐ 4.32 0Petrofac Ltd (PFC:LSE) 18.39% 10.22% 34.63% 9.48 0.913 0.4029Petroleum Geo Services ASA (PGS:OSL) 61.99% 15.87% 0.00% 3.79 ‐‐ 0.3328Petroleum Geo Services ASA (PGS:OSL) 61.99% 15.87% 0.00% 3.79 ‐‐ 0.3328Repsol SA (REP:MCE) ‐‐ ‐‐ ‐‐ ‐‐ 1.16 0.4058Royal Dutch Shell PLC (RDSB:LSE) ‐‐ ‐‐ ‐‐ ‐‐ 1.16 0.4058Saipem SpA (SPM:MIL) 19.74% ‐1.11% ‐‐ 14.76 ‐‐ ‐‐SBM Offshore NV (SBMO:AEX) 10.08% 2.39% 0.00% ‐‐ 1.65 0.5751Seadrill Ltd (SDRL:OSL) 57.71% 52.75% 65.77% 4.65 ‐‐ 0.6455Statoil ASA (STL:OSL) 50.38% 6.28% 110.89% 4.96 1.25 0.339Subsea 7 SA (SUBC:OSL) 11.79% 5.56% 0.00% 9.48 1.09 0.1212Technip (TEC:PAR) 17.32% 6.11% 35.56% 11.88 1.07 0.3818Tgs Nopec Geophysical Company ASA (TGS:OSL) 97.74% 30.46% 53.06% 5.61 ‐‐ ‐‐Total SA (FP:PAR) 29.50% 5.05% 111.46% 6.41 1.01 0.307Tullow Oil PLC (TLW:LSE) 54.42% 8.16% 104.62% 15.89 1.31 0.2862Vestas Wind Systems A/S (VWS:CPH) 14.73% ‐1.35% 104.62% ‐‐ 0.5683 0.2852
Fonte dati: Financial Times Pagina 3 Per spiegazione indicatori si prega di consultare la Legenda
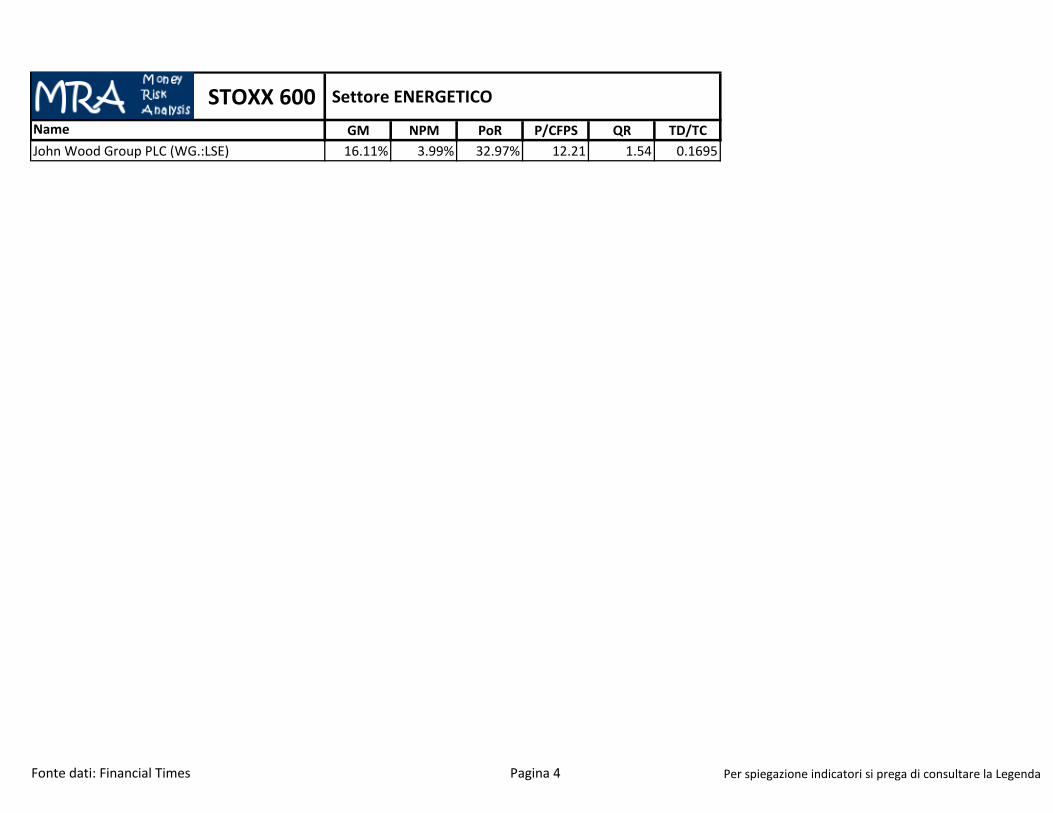
STOXX 600 Settore ENERGETICOName GM NPM PoR P/CFPS QR TD/TCJohn Wood Group PLC (WG.:LSE) 16.11% 3.99% 32.97% 12.21 1.54 0.1695
Fonte dati: Financial Times Pagina 4 Per spiegazione indicatori si prega di consultare la Legenda

STOXX 600 Settore ARTICOLI PERSONALI CASALINGHIName Country Industry MarketCap Currency P/E Beta ROE DYadidas AG (ADSX.N:GER) Germania Footwear 15.93 EUR 20.24 0.77 14.58% 1.45%Amer Sports Oyj (AMEAS:HEX) Finlandia Recreational Products 1.77 EUR 21.11 0.74 11.56% 2.68%Barratt Developments PLC (BDEV:LSE) Inghilterra Construction Services 3.48 GBP 26.41 1.92 4.37% 1.61%Beiersdorf AG (BEIX:GER) Germania Personal & Household Prods. 17.89 EUR 30.15 0.45 16.37% 0.73%Bellway PLC (BWY:LSE) Inghilterra Construction Services 1.73 GBP 12.11 1.57 11.75% 2.61%Berkeley Group Holdings PLC (BKG:LSE) Inghilterra Construction Services 3.05 GBP 16.04 0.76 17.31% 6.61%Societe B I C SA (BB:PAR) Francia Office Supplies 4.64 EUR 18.31 0.23 ‐‐ 2.66%British American Tobacco PLC (BATS:LSE) Inghilterra Tobacco 64.97 GBP 16.91 0.68 55.35% 4.12%Burberry Group PLC (BRBY:LSE) Inghilterra Apparel/Accessories 6.49 GBP 23.17 1.06 30.25% 2.04%Christian Dior SA (CDI:PAR) Francia Apparel/Accessories 26.74 EUR ‐‐ 1.04 ‐‐ 1.63%Compagnie Financiere Richemont SA (CFR:VTX) Svizzera Jewelry & Silverware 46 CHF 19.17 1.03 20.85% 0.74%Electrolux AB (ELUX B:STO) Svezia Appliance & Tool 53.54 SEK 73.77 1.54 4.48% 2.63%Henkel & Co KGaA AG (HEN3:GER) Germania Personal & Household Prods. 33.08 EUR 21.46 0.65 16.36% 1.14%Hermes International SCA (RMS:PAR) Francia Apparel/Accessories 26.88 EUR 33.79 0.16 30.57% 1.06%Hugo Boss AG (BOSX.N:GER) Germania Apparel/Accessories 6.94 EUR 20.67 0.92 49.80% 2.50%Husqvarna AB (HUSQ B:STO) Svezia Constr. & Agric. Machinery 30.41 SEK 28.43 1.41 9.22% 1.99%Imperial Tobacco Group PLC (IMT:LSE) Inghilterra Tobacco 24.47 GBP 26.61 0.47 16.12% 4.56%L'Oreal SA (OR:PAR) Francia Personal & Household Prods. 74.11 EUR 25.33 0.58 13.58% 2.03%Luxottica Group SpA (LUX:MIL) Italia Retail (Specialty) 19.43 EUR 35.51 0.43 13.41% 1.28%LVMH Moet Hennessy Louis Vuitton SA (MC:PAR)Francia Apparel/Accessories 72.07 EUR 20.74 0.92 ‐‐ 2.19%Osram Licht AG (OSRX.N:GER) Germania Electronic Instr. & Controls 4.19 EUR 147.61 ‐‐ ‐‐ 2.19%Pandora A/S (PNDORA:CPH) Danimarca Jewelry & Silverware 44.17 DKK 20.33 2.52 35.52% 1.88%Persimmon PLC (PSN:LSE) Inghilterra Construction Services 3.96 GBP 15.42 1.62 12.74%Reckitt Benckiser Group PLC (RB.:LSE) Inghilterra Personal & Household Prods. 34.89 GBP 20.31 0.54 28.38% 2.83%Skandinaviska Enskilda Banken AB (SEB A:STO) Svezia Regional Banks 191.98 SEK 12.33 1.63 13.91% 3.20%Svenska Cellulosa SCA AB (SCA B:STO) Svezia Personal & Household Prods. 130.32 SEK 23.4 0.71 9.02% 1.80%The Swatch Group SA (UHR:VTX) Svizzera Jewelry & Silverware 30.43 CHF 15.88 1.21 21.27% 0.87%Swedish Match AB (SWMA:STO) Svezia Tobacco 45.23 SEK 16.42 0.23 ‐‐ 2.28%Taylor Wimpey PLC (TW.:LSE) Inghilterra Construction Services 3.29 GBP 13.84 1.48 11.33% 0.68%Tod's SpA (TOD:MIL) Italia Footwear 3.09 EUR 23.13 0.36 17.23% 2.14%
Fonte dati: Financial Times Pagina 1 Per spiegazione indicatori si prega di consultare la Legenda

STOXX 600 Settore ARTICOLI PERSONALI CASALINGHIName GM NPM PoR P/CFPS QR TD/TCadidas AG (ADSX.N:GER) 49.27% 5.44% 39.90% 14.26 0.8924 0.2114Amer Sports Oyj (AMEAS:HEX) 43.67% 3.90% 56.64% ‐‐ 1.53 0.4432Barratt Developments PLC (BDEV:LSE) 14.55% 4.61% 41.49% 25.57 0.2392 0.0906Beiersdorf AG (BEIX:GER) 63.28% 8.84% 0.2978 27.56 1.78 0.031Bellway PLC (BWY:LSE) 0.1926 10.94% 0.3145 11.91 0.2107 0.045Berkeley Group Holdings PLC (BKG:LSE) 29.39% 15.28% 46.26% 14.43 0.1878 0.0164Societe B I C SA (BB:PAR) 0.3329 13.19% ‐‐ ‐‐ ‐‐ ‐‐British American Tobacco PLC (BATS:LSE) 78.75% 27.52% 69.06% 13.74 0.6491 0.6278Burberry Group PLC (BRBY:LSE) 0.7178 13.52% 65.08% 15.38 1.01 0.0978Christian Dior SA (CDI:PAR) ‐‐ ‐‐ ‐‐ ‐‐ 0.5626 0.234Compagnie Financiere Richemont SA (CFR:VTX) 63.76% 20.37% 39.83% 15.02 1.93 0.1609Electrolux AB (ELUX B:STO) 19.48% 0.62% 2.772 13.29 0.7752 0.5062Henkel & Co KGaA AG (HEN3:GER) 48.07% 9.94% 0.333 16.58 1.06 0.2048Hermes International SCA (RMS:PAR) 68.83% 21.23% 0 28.83 1.63 0.0195Hugo Boss AG (BOSX.N:GER) 64.95% 13.71% 0.7022 16.25 0.9068 0.1951Husqvarna AB (HUSQ B:STO) 26.80% 3.44% 0.8073 15 1.02 0.4258Imperial Tobacco Group PLC (IMT:LSE) 19.56% 3.40% 1.2017 11.24 0.4595 0.6635L'Oreal SA (OR:PAR) 71.27% 12.89% 0.5149 19.12 1.09 0.017Luxottica Group SpA (LUX:MIL) 66.12% 7.51% 0.5647 21.5 0.9039 0.3338LVMH Moet Hennessy Louis Vuitton SA (MC:PAR) 65.50% 13.52% 0.4366 13.63 0.6407 0.2403Osram Licht AG (OSRX.N:GER) 28.77% 0.65% 0.4366 11.38 1.18 0.146Pandora A/S (PNDORA:CPH) 66.58% 24.64% 0.3707 18.25 1.02 0.0296Persimmon PLC (PSN:LSE) 20.20% 12.33% 1.4172 15.13 0.39 0Reckitt Benckiser Group PLC (RB.:LSE) 59.43% 17.33% 0.5664 18.26 0.3807 0.304Skandinaviska Enskilda Banken AB (SEB A:STO) ‐‐ 38.76% 0.5606 10.9 ‐‐ ‐‐Svenska Cellulosa SCA AB (SCA B:STO) 24.73% 6.25% 0.6014 12.42 0.6396 0.366The Swatch Group SA (UHR:VTX) 77.89% 22.80% 0.2121 13.63 2.43 0.0061Swedish Match AB (SWMA:STO) 47.30% 21.49% 0.5358 15.15 1.3 1.08Taylor Wimpey PLC (TW.:LSE) 22.54% 10.45% 1.1333 13.55 0.2792 0.0425Tod's SpA (TOD:MIL) 74.43% 13.63% 0.6178 17.86 1.72 0.0555
Fonte dati: Financial Times Pagina 2 Per spiegazione indicatori si prega di consultare la Legenda

STOXX 600 Settore IMMOBILIARE
Name Country Industry MarketCap Currency P/E Beta ROE DYBritish Land Company PLC (BLND:LSE) Inghilterra Real Estate Operations 6.87 GBP 11.11 0.99 10.71% 3.15%Capital & Counties Properties PLC (CAPC:LSE) Inghilterra Real Estate Operations 2.54 GBP 7.66 0.69 20.23% 0.45%Castellum AB (CAST:STO) Svezia Real Estate Operations 18.8 SEK 12.17 0.68 12.06% 2.72%Cofinimmo SA (COFB:BRU) Belgio Real Estate Operations 1.53 EUR 30.34 0.63 3.80% 5.06%Corio NV (CORA:AEX) Olanda Real Estate Operations 3.26 EUR ‐‐ 1.05 ‐6.49% 5.45%Derwent London PLC (DLN:LSE) Inghilterra Real Estate Operations 2.84 GBP 6.8 1.01 21.93% 1.10%Deutsche Euroshop AG (DEQX.N:GER) Germania Real Estate Operations 1.86 EUR 12.6 0.21 11.95% 2.67%Deutsche Wohnen AG (DWNIX:GER) Germania Real Estate Operations 4.36 EUR 14.38 0.35 7.89% 1.00%Fonciere des Regions SA (FDR:PAR) Francia Real Estate Operations 4.52 EUR 12.54 1.12 8.39% 5.82%Gecina SA (GFC:PAR) Francia Real Estate Operations 6.1 EUR 18.94 1.46 5.05% 4.74%Great Portland Estates PLC (GPOR:LSE) Inghilterra Real Estate Operations 2.18 GBP 8.65 0.91 16.87% 1.30%Hammerson PLC (HMSO:LSE) Inghilterra Real Estate Operations 4.12 GBP 12.76 1.05 8.15% 2.89%Hufvudstaden AB (HUFV A:STO) Svezia Real Estate Operations 20.78 SEK 10.43 0.57 12.86% 2.03%Icade SA (ICAD:PAR) Francia Real Estate Operations 5.6 EUR 37.21 0.79 ‐‐ 4.84%Immofinanz AG (IIA:VIE) Francia Real Estate Operations 3.79 EUR 27.52 1.31 2.38% 4.47%Intu Properties PLC (INTU:LSE) Inghilterra Real Estate Operations 3.66 GBP 9.11 1.12 10.90% 4.15%JM AB (JM:STO) Svezia Construction Services 17.72 SEK 15.74 1.79 24.95% 2.29%Klepierre SA (LI:PAR) Francia Real Estate Operations 6.59 EUR 120.45 1.03 2.49% 4.69%Land Securities Group PLC (LAND:LSE) Inghilterra Real Estate Operations 8.34 GBP 10.33 1.08 10.69% 2.31%Land Securities Group PLC (LAND:LSE) Inghilterra Real Estate Operations 8.34 GBP 10.33 1.08 10.69% 2.31%PSP Swiss Property AG (PSPN:SWX) Svizzera Rental & Leasing 3.91 CHF 10.74 0.38 9.89% 3.81%SEGRO PLC (SGRO:LSE) Inghilterra Real Estate Operations 2.58 GBP 12.25 1.41 9.20% 3.68%Shaftesbury PLC (SHB:LSE) Inghilterra Real Estate Operations 1.84 GBP 7 0.73 19.53% 1.58%Swiss Prime Site AG (SPSN:VTX) Svizzera Real Estate Operations 4.47 CHF 13.76 0.21 8.57% 4.87%Unibail‐Rodamco SE (UL:PAR) Francia 18.78 EUR 14.45 ‐‐ 9.70%Wereldhave NV (WHA:AEX) Olanda Real Estate Operations 1.38 EUR 22.03 0.78 4.58% 4.42%
Fonte dati: Financial Times Pagina 1 Per spiegazione indicatori si prega di consultare la Legenda

STOXX 600 Settore IMMOBILIARE
Name GM NPM PoR P/CFPS QR TD/TCBritish Land Company PLC (BLND:LSE) 83.67% 174.64% 44.24% ‐‐ ‐‐ 0.3114Capital & Counties Properties PLC (CAPC:LSE) 68.61% 359.98% 3.43% 7.6 ‐‐ 0.1712Castellum AB (CAST:STO) 66.51% 45.25% 47.32% 12.62 ‐‐ 0.6219Cofinimmo SA (COFB:BRU) 87.75% 28.06% 0.00% ‐‐ ‐‐ 0.506Corio NV (CORA:AEX) 82.15% ‐54.93% ‐‐ ‐‐ ‐‐ 0.4557Derwent London PLC (DLN:LSE) 77.45% 290.03% 8.19% 6.1 ‐‐ 0.2886Deutsche Euroshop AG (DEQX.N:GER) 89.91% 77.87% 43.23% 12.41 ‐‐ 0.532Deutsche Wohnen AG (DWNIX:GER) 78.86% 35.30% ‐‐ 20 0.5885 0.5781Fonciere des Regions SA (FDR:PAR) 91.28% 61.56% 77.40% 8.56 1.31 0.5408Gecina SA (GFC:PAR) 91.42% 55.65% 85.34% 18.21 0.2732 0.4054Great Portland Estates PLC (GPOR:LSE) 81.02% 319.49% 11.93% 8.68 ‐‐ 0.3352Hammerson PLC (HMSO:LSE) 88.04% 101.37% 42.22% 12.6 ‐‐ 0.3627Hufvudstaden AB (HUFV A:STO) 70.26% 114.37% 30.23% 11.06 ‐‐ 0.2737Icade SA (ICAD:PAR) 29.38% 9.10% 0.00% 19.65 ‐‐ ‐‐Immofinanz AG (IIA:VIE) 73.17% 15.33% 120.85% ‐‐ 0.5756 0.4932Intu Properties PLC (INTU:LSE) ‐‐ 98.38% 40.62% 10.03 ‐‐ 0.5306JM AB (JM:STO) 17.76% 8.76% 50.91% ‐‐ 2.61 0.1559Klepierre SA (LI:PAR) 88.46% 13.58% 558.21% 12.15 0.5925 0.6883Land Securities Group PLC (LAND:LSE) 60.16% 102.40% 29.58% 10.39 0.6054 0.3297Land Securities Group PLC (LAND:LSE) 60.16% 102.40% 29.58% 10.39 0.6054 0.3297PSP Swiss Property AG (PSPN:SWX) 95.27% 67.13% 40.59% 10.79 0.2019 0.3322SEGRO PLC (SGRO:LSE) 81.59% 76.41% 52.09% 12.23 2.64 0.4193Shaftesbury PLC (SHB:LSE) 81.70% 267.08% 13.16% 7.69 ‐‐ 0.3145Swiss Prime Site AG (SPSN:VTX) 78.64% 45.21% 63.32% 12.08 0.5768 0.5523Unibail‐Rodamco SE (UL:PAR) 85.34% 97.37% 67.08% 12 ‐‐ 0.4575Wereldhave NV (WHA:AEX) 75.49% 52.61% 114.60% ‐‐ ‐‐ 0.3122
Fonte dati: Financial Times Pagina 2 Per spiegazione indicatori si prega di consultare la Legenda

STOXX 600 Settore DISTRIBUZIONEName Country Industry MarketCap Currency P/E Beta ROE DYKoninklijke Ahold NV (AH:AEX) Olanda Retail (Grocery) 13.4 EUR 16.81 0.58 13.80% 2.92%Booker Group PLC (BOK:LSE) Inghilterra Retail (Grocery) 2.6 GBP 28.52 0.44 17.59% 1.81%Carrefour SA (CA:PAR) Francia Retail (Grocery) 20.16 EUR 20.2 1.06 12.74% 2.23%Casino Guichard Perrachon SA (CO:PAR) Francia Retail (Grocery) 10.09 EUR 11.88 0.82 11.24% 3.50%Etablissements Delhaize Freres et Cie le Lion SA ( Belgio Retail (Grocery) 5.38 EUR 24.15 0.48 4.33% 2.23%Distribuidora Internacional de Alimentacion SA (DSpagna Retail (Grocery) 4.1 EUR 21.23 ‐‐ 113.74% 1.63%Dixons Retail PLC (DXNS:LSE) Inghilterra Retail (Technology) 1.65 GBP 31.08 1.50 37.00% 1.63%Dufry AG (DUFN:VTX) Svizzera Retail (Specialty) 4.52 CHF 46.82 1.02 7.88% 1.63%Colruyt (COLR:BRU) Belgio Retail (Grocery) 6.65 EUR 17.06 0.11 21.71% 1.86%Galenica AG (GALN:SWX) Svizzera Biotechnology & Drugs 5.75 CHF 19.39 0.55 21.12% 1.03%H & M Hennes & Mauritz AB (HM B:STO) Svezia Retail (Apparel) 400.95 SEK 26.2 0.60 37.21% 2.42%Home Retail Group PLC (HOME:LSE) Inghilterra Retail (Specialty) 1.69 GBP 25.69 1.11 2.50% 1.45%ICA Gruppen AB (ICA:STO) Svezia Retail (Specialty) 25.53 SEK 4.45 0.75 58.55% 2.61%Inchcape PLC (INCH:LSE) Inghilterra Retail (Specialty) 2.9 GBP 15.5 2.03 13.07% 2.73%Industria de Diseno Textil SA (ITX:MCE) Spagna Retail (Apparel) 67.13 EUR 28.25 0.49 26.87% 1.77%Jeronimo Martins SGPS SA (JMT:LIS) Portogallo Retail (Grocery) 8.17 EUR 21.33 0.53 29.47% 1.69%Kering SA (KER:PAR) Francia Retail (Department & Discoun 20.01 EUR 22.93 0.96 7.92% 2.37%Kesko Oyj (KESBV:HEX) Finlandia Retail (Grocery) 2.92 EUR 16.95 0.86 7.72% 4.74%Kingfisher PLC (KGF:LSE) Inghilterra Retail (Home Improvement) 9.74 GBP 13.77 0.75 11.38% 2.41%Marks and Spencer Group PLC (MKS:LSE) Inghilterra Retail (Department & Discoun 7.07 GBP 14.55 0.92 20.17% 3.92%Metro AG (MEOX:GER) Germania Retail (Grocery) 9.13 EUR 24.9 1.18 6.76% 2.63%WM Morrison Supermarkets PLC (MRW:LSE) Inghilterra Retail (Grocery) 4.64 GBP ‐‐ 0.37 ‐4.80% 6.54%Next PLC (NXT:LSE) Inghilterra Retail (Apparel) 9.94 GBP 17.99 0.61 193.43% 2.01%Ocado Group PLC (OCDO:LSE) Inghilterra Retail (Catalog & Mail Order) 1.85 GBP ‐‐ 1.61 ‐6.13% 2.01%J Sainsbury PLC (SBRY:LSE) Inghilterra Retail (Grocery) 6.3 GBP 10.1 0.59 11.11% 5.11%Sports Direct International PLC (SPD:LSE) Inghilterra Retail (Specialty) 4.61 GBP 28.47 1.18 25.61% 5.11%Tesco PLC (TSCO:LSE) Inghilterra Retail (Grocery) 24.49 GBP 12.75 0.69 12.22% 4.88%
Fonte dati: Financial Times Pagina 1 Per spiegazione indicatori si prega di consultare la Legenda

STOXX 600 Settore DISTRIBUZIONEName GM NPM PoR P/CFPS QR TD/TCKoninklijke Ahold NV (AH:AEX) 26.62% 2.44% 57.36% 8.08 1.16 0.194Booker Group PLC (BOK:LSE) 4.14% 2.14% 50.38% 23.63 0.37 0Carrefour SA (CA:PAR) 21.97% 1.34% 0.00% 8.03 0.5767 0.5178Casino Guichard Perrachon SA (CO:PAR) 25.58% 3.09% 0 3.93 0.6155 0.4366Etablissements Delhaize Freres et Cie le Lion SA ( 0.2418 1.07% 0.6396 6.52 0.7362 0.3554Distribuidora Internacional de Alimentacion SA (D 21.68% 1.91% 0.00% 9.09 0.2496 0.8535Dixons Retail PLC (DXNS:LSE) ‐‐ 0.71% 0.00% 9.54 0.3993 0.9709Dufry AG (DUFN:VTX) 58.96% 4.13% 0.00% 13.29 0.4735 0.6121Colruyt (COLR:BRU) 0.2553 4.34% 85.76% 11.97 0.709 0.017Galenica AG (GALN:SWX) 17.02% 9.97% 0.00% 14.06 1.13 0.3245H & M Hennes & Mauritz AB (HM B:STO) 58.95% 13.11% ‐‐ 18.47 1.51 0Home Retail Group PLC (HOME:LSE) 31.52% 1.20% 0.3605 8.75 0.8598 0.0031ICA Gruppen AB (ICA:STO) 14.96% 12.16% 0 2.32 0.4367 0.2794Inchcape PLC (INCH:LSE) 14.19% 3.08% 0.4152 11.5 0.5665 0.1952Industria de Diseno Textil SA (ITX:MCE) 59.33% 14.24% 0.6346 20.72 1.47 0.0005Jeronimo Martins SGPS SA (JMT:LIS) 21.48% 3.32% 0 12.73 0.2311 0.2961Kering SA (KER:PAR) 62.48% 8.82% 0.5418 17.31 0.6842 0.2987Kesko Oyj (KESBV:HEX) 13.75% 1.98% 0 8.66 0.921 0.1906Kingfisher PLC (KGF:LSE) 37.03% 6.38% 0.3316 10.03 0.485 0.0488Marks and Spencer Group PLC (MKS:LSE) 7.32% 4.64% 0.5663 7.54 0.2061 0.5002Metro AG (MEOX:GER) 20.59% 0.68% ‐‐ 5.42 0.4927 0.5535WM Morrison Supermarkets PLC (MRW:LSE) 6.07% ‐1.35% ‐‐ 30.74 0.2012 0.3926Next PLC (NXT:LSE) 33.16% 14.79% 0.3631 14.82 1.3 0.7563Ocado Group PLC (OCDO:LSE) 31.25% ‐1.58% 0.3631 61.58 0.9793 0.4437J Sainsbury PLC (SBRY:LSE) 5.62% 2.65% 0.5071 5.41 0.291 0.3298Sports Direct International PLC (SPD:LSE) 42.02% 6.86% 0 20.63 0.5895 0.3178Tesco PLC (TSCO:LSE) 6.31% 3.01% 0.6221 7.04 0.4444 0.4324
Fonte dati: Financial Times Pagina 2 Per spiegazione indicatori si prega di consultare la Legenda
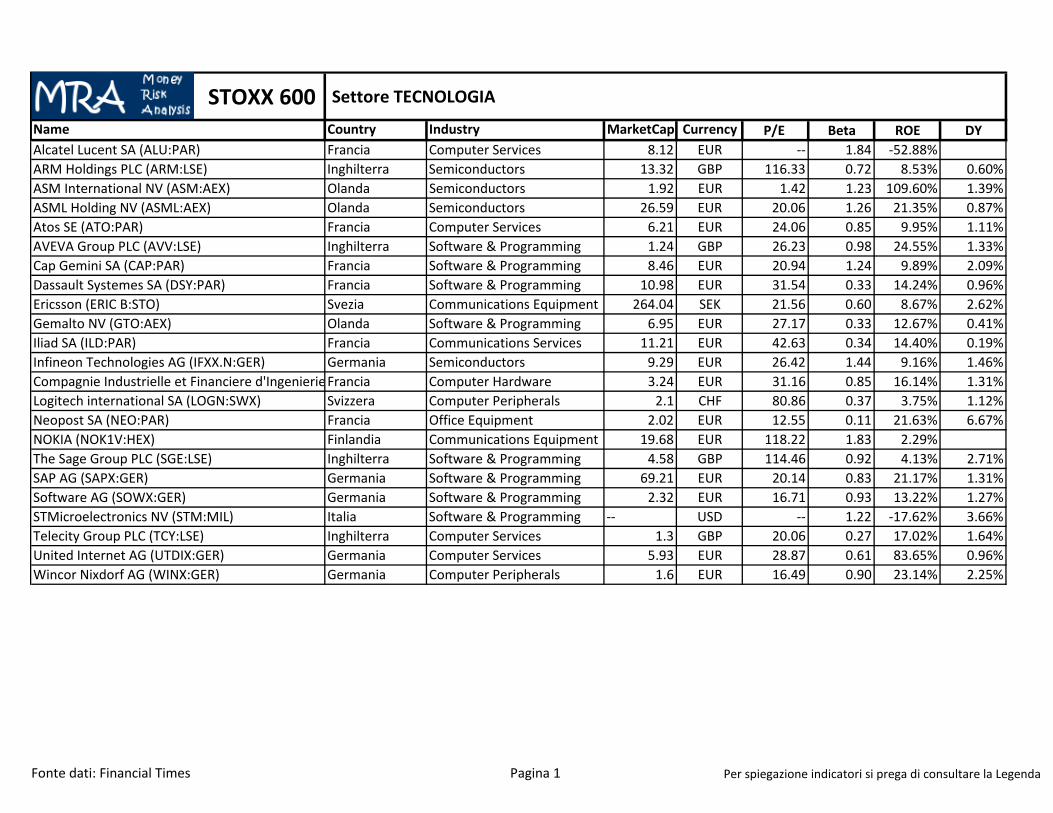
STOXX 600 Settore TECNOLOGIAName Country Industry MarketCap Currency P/E Beta ROE DYAlcatel Lucent SA (ALU:PAR) Francia Computer Services 8.12 EUR ‐‐ 1.84 ‐52.88%ARM Holdings PLC (ARM:LSE) Inghilterra Semiconductors 13.32 GBP 116.33 0.72 8.53% 0.60%ASM International NV (ASM:AEX) Olanda Semiconductors 1.92 EUR 1.42 1.23 109.60% 1.39%ASML Holding NV (ASML:AEX) Olanda Semiconductors 26.59 EUR 20.06 1.26 21.35% 0.87%Atos SE (ATO:PAR) Francia Computer Services 6.21 EUR 24.06 0.85 9.95% 1.11%AVEVA Group PLC (AVV:LSE) Inghilterra Software & Programming 1.24 GBP 26.23 0.98 24.55% 1.33%Cap Gemini SA (CAP:PAR) Francia Software & Programming 8.46 EUR 20.94 1.24 9.89% 2.09%Dassault Systemes SA (DSY:PAR) Francia Software & Programming 10.98 EUR 31.54 0.33 14.24% 0.96%Ericsson (ERIC B:STO) Svezia Communications Equipment 264.04 SEK 21.56 0.60 8.67% 2.62%Gemalto NV (GTO:AEX) Olanda Software & Programming 6.95 EUR 27.17 0.33 12.67% 0.41%Iliad SA (ILD:PAR) Francia Communications Services 11.21 EUR 42.63 0.34 14.40% 0.19%Infineon Technologies AG (IFXX.N:GER) Germania Semiconductors 9.29 EUR 26.42 1.44 9.16% 1.46%Compagnie Industrielle et Financiere d'IngenierieFrancia Computer Hardware 3.24 EUR 31.16 0.85 16.14% 1.31%Logitech international SA (LOGN:SWX) Svizzera Computer Peripherals 2.1 CHF 80.86 0.37 3.75% 1.12%Neopost SA (NEO:PAR) Francia Office Equipment 2.02 EUR 12.55 0.11 21.63% 6.67%NOKIA (NOK1V:HEX) Finlandia Communications Equipment 19.68 EUR 118.22 1.83 2.29%The Sage Group PLC (SGE:LSE) Inghilterra Software & Programming 4.58 GBP 114.46 0.92 4.13% 2.71%SAP AG (SAPX:GER) Germania Software & Programming 69.21 EUR 20.14 0.83 21.17% 1.31%Software AG (SOWX:GER) Germania Software & Programming 2.32 EUR 16.71 0.93 13.22% 1.27%STMicroelectronics NV (STM:MIL) Italia Software & Programming ‐‐ USD ‐‐ 1.22 ‐17.62% 3.66%Telecity Group PLC (TCY:LSE) Inghilterra Computer Services 1.3 GBP 20.06 0.27 17.02% 1.64%United Internet AG (UTDIX:GER) Germania Computer Services 5.93 EUR 28.87 0.61 83.65% 0.96%Wincor Nixdorf AG (WINX:GER) Germania Computer Peripherals 1.6 EUR 16.49 0.90 23.14% 2.25%
Fonte dati: Financial Times Pagina 1 Per spiegazione indicatori si prega di consultare la Legenda
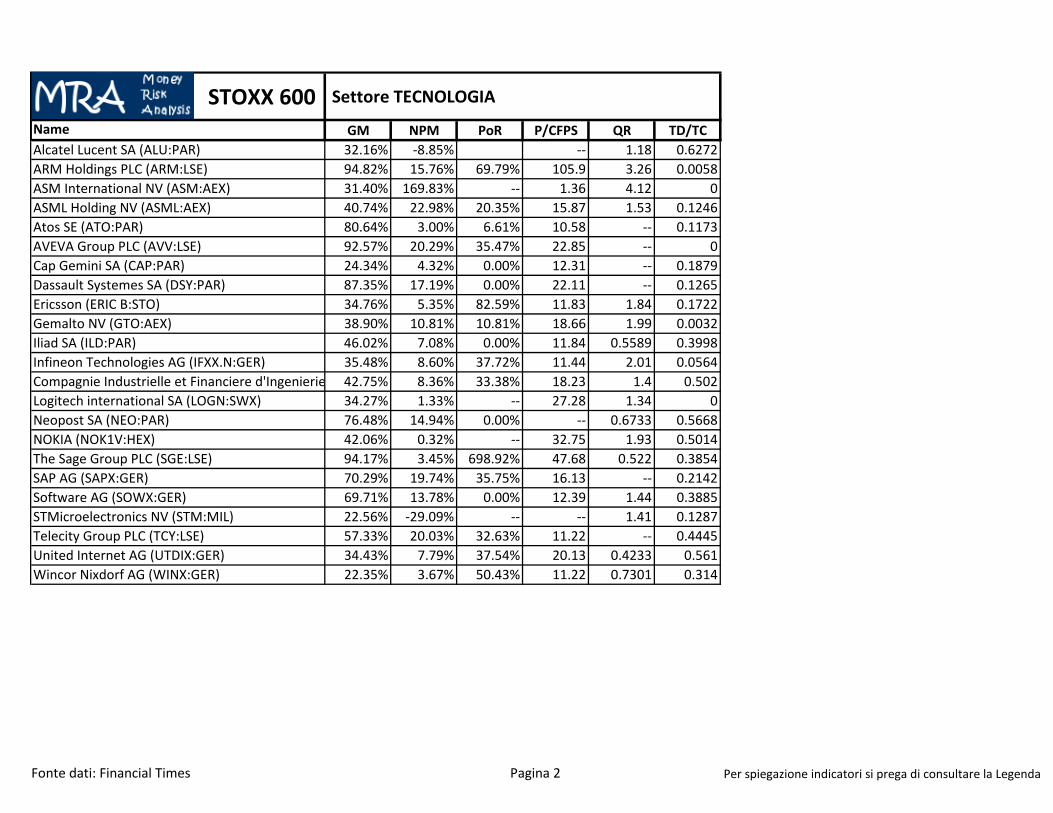
STOXX 600 Settore TECNOLOGIAName GM NPM PoR P/CFPS QR TD/TCAlcatel Lucent SA (ALU:PAR) 32.16% ‐8.85% ‐‐ 1.18 0.6272ARM Holdings PLC (ARM:LSE) 94.82% 15.76% 69.79% 105.9 3.26 0.0058ASM International NV (ASM:AEX) 31.40% 169.83% ‐‐ 1.36 4.12 0ASML Holding NV (ASML:AEX) 40.74% 22.98% 20.35% 15.87 1.53 0.1246Atos SE (ATO:PAR) 80.64% 3.00% 6.61% 10.58 ‐‐ 0.1173AVEVA Group PLC (AVV:LSE) 92.57% 20.29% 35.47% 22.85 ‐‐ 0Cap Gemini SA (CAP:PAR) 24.34% 4.32% 0.00% 12.31 ‐‐ 0.1879Dassault Systemes SA (DSY:PAR) 87.35% 17.19% 0.00% 22.11 ‐‐ 0.1265Ericsson (ERIC B:STO) 34.76% 5.35% 82.59% 11.83 1.84 0.1722Gemalto NV (GTO:AEX) 38.90% 10.81% 10.81% 18.66 1.99 0.0032Iliad SA (ILD:PAR) 46.02% 7.08% 0.00% 11.84 0.5589 0.3998Infineon Technologies AG (IFXX.N:GER) 35.48% 8.60% 37.72% 11.44 2.01 0.0564Compagnie Industrielle et Financiere d'Ingenierie 42.75% 8.36% 33.38% 18.23 1.4 0.502Logitech international SA (LOGN:SWX) 34.27% 1.33% ‐‐ 27.28 1.34 0Neopost SA (NEO:PAR) 76.48% 14.94% 0.00% ‐‐ 0.6733 0.5668NOKIA (NOK1V:HEX) 42.06% 0.32% ‐‐ 32.75 1.93 0.5014The Sage Group PLC (SGE:LSE) 94.17% 3.45% 698.92% 47.68 0.522 0.3854SAP AG (SAPX:GER) 70.29% 19.74% 35.75% 16.13 ‐‐ 0.2142Software AG (SOWX:GER) 69.71% 13.78% 0.00% 12.39 1.44 0.3885STMicroelectronics NV (STM:MIL) 22.56% ‐29.09% ‐‐ ‐‐ 1.41 0.1287Telecity Group PLC (TCY:LSE) 57.33% 20.03% 32.63% 11.22 ‐‐ 0.4445United Internet AG (UTDIX:GER) 34.43% 7.79% 37.54% 20.13 0.4233 0.561Wincor Nixdorf AG (WINX:GER) 22.35% 3.67% 50.43% 11.22 0.7301 0.314
Fonte dati: Financial Times Pagina 2 Per spiegazione indicatori si prega di consultare la Legenda

STOXX 600 Settore TELECOMUNICAZIONI
Name Country Industry MarketCap Currency P/E Beta ROE DYBelgacom SA (BELG:BRU) Belgio Communications Services 7.19 EUR 10.79 0.56 22.00% 7.69%BT Group (BT.A:LSE) Inghilterra Communications Services 29.51 GBP 13.79 0.75 ‐‐ 2.66%Cable & Wireless Communications PLC (CWC:LSE Inghilterra Communications Services 1.34 GBP ‐‐ 0.71 ‐66.81% 4.87%Deutsche Telekom AG (DTEX.N:GER) Germania Communications Services 50.97 EUR 52.28 0.62 3.73% 4.37%Elisa Oyj (ELI1V:HEX) Finlandia Communications Services 3.53 EUR 16.87 0.48 23.10% 6.16%Freenet AG (FNTX.N:GER) Germania Communications Services 3.1 EUR 12.98 0.32 19.80% 5.98%Inmarsat PLC (ISAT:LSE) Inghilterra Communications Services 3.44 GBP 57.29 0.46 9.39% 3.61%Jazztel PLC (JAZ:MCE) Spagna Communications Services 2.6 EUR 38.6 0.54 18.13% 3.61%Koninklijke KPN NV (KPN:AEX) Olanda Communications Services 10.52 EUR 22.52 0.24 8.76%Orange SA (ORA:PAR) Francia Communications Services 28.61 EUR 15.47 0.71 7.70% 7.41%Hellenic Telecommunications Organization SA (HTGrecia Communications Services 5.31 EUR 12.28 1.29 23.42% 7.41%Portugal Telecom SGPS SA (PTC:LIS) Portogallo Communications Services 2.57 EUR 7.42 0.94 16.78% 8.50%Swisscom AG (SCMN:VTX) Svizzera Communications Services 27.12 CHF 16.22 0.41 35.47% 2.73%Talktalk Telecom Group PLC (TALK:LSE) Inghilterra Communications Services 2.79 GBP 49.26 0.44 14.55% 3.74%TDC A/S (TDC:CPH) Danimarca Communications Services 40.76 DKK 12.86 0.35 14.89% 7.37%Tele2 AB (TEL2 B:STO) Svezia Communications Services 37.22 SEK 56.78 0.86 3.12% 3.71%Telecom Italia SpA (TIT:MIL) Italia Communications Services 15.61 EUR ‐‐ 0.96 ‐5.57% 1.85%Telefonica SA (TEF:MCE) Spagna Communications Services 53.91 EUR 11.7 1.00 22.06% 5.00%Telefonica Deutschland Holding AG (O2DX.N:GERGermania Communications Services 6.64 EUR 85.32 ‐‐ 1.25% 7.91%Telekom Austria AG (TKA:VIE) Germania Communications Services 3.14 EUR 36.25 0.52 7.43% 0.53%Telenor ASA (TEL:OSL) Germania Communications Services 207.02 NOK 15.91 1.00 17.44% 3.69%TeliaSonera AB (TLSN:STO) Svezia Communications Services 201.31 SEK 13.6 0.48 13.60% 4.52%Vodafone Group PLC (VOD:LSE) Inghilterra Communications Services 57.47 GBP 3.22 0.59 23.58% 8.81%Ziggo NV (ZIGGO:AEX) Olanda Communications Services 6.28 EUR 29.04 ‐‐ 15.47% 5.01%
Fonte dati: Financial Times Pagina 1 Per spiegazione indicatori si prega di consultare la Legenda

STOXX 600 Settore TELECOMUNICAZIONI
Name GM NPM PoR P/CFPS QR TD/TCBelgacom SA (BELG:BRU) 59.47% 10.32% 0.00% 5.01 0.7965 0.4269BT Group (BT.A:LSE) ‐‐ 11.77% 23.88% 6.04 0.6168 1.12Cable & Wireless Communications PLC (CWC:LSE 31.30% ‐1.25% ‐‐ 8.67 1.26 0.6323Deutsche Telekom AG (DTEX.N:GER) 39.71% 2.00% 236.56% 4.21 0.9291 0.6094Elisa Oyj (ELI1V:HEX) 42.49% 12.69% 105.37% 8.68 0.8408 0.5626Freenet AG (FNTX.N:GER) 17.78% 7.48% 0.00% 10.52 0.952 0.3027Inmarsat PLC (ISAT:LSE) 77.68% 8.13% 204.86% 17.27 0.4668 0.6513Jazztel PLC (JAZ:MCE) 39.31% 6.64% 204.86% 15.14 0.7082 0.4371Koninklijke KPN NV (KPN:AEX) 56.53% 3.46% ‐‐ 2.59 0.964 0.7204Orange SA (ORA:PAR) 56.16% 5.16% 0.00% 3.5 0.5781 0.5902Hellenic Telecommunications Organization SA (HT 68.29% 10.70% 0.44% 4.91 1.11 0.5754Portugal Telecom SGPS SA (PTC:LIS) 84.24% 13.33% ‐‐ 1.91 ‐‐ 0.7979Swisscom AG (SCMN:VTX) 55.61% 14.70% 68.18% 7.38 ‐‐ 0.6374Talktalk Telecom Group PLC (TALK:LSE) 55.25% 3.26% 178.18% 14.4 0.5 0.5742TDC A/S (TDC:CPH) 72.31% 12.68% 96.31% 5.06 0.5311 0.5354Tele2 AB (TEL2 B:STO) 37.94% 2.19% 299.27% 9.49 0.814 0.304Telecom Italia SpA (TIT:MIL) 58.19% ‐2.47% ‐‐ 3.93 0.8715 0.6339Telefonica SA (TEF:MCE) 71.24% 8.59% 34.51% 3.69 0.9704 0.6884Telefonica Deutschland Holding AG (O2DX.N:GER 60.15% 1.58% 674.69% 5.49 1.12 0.1944Telekom Austria AG (TKA:VIE) 86.92% 2.62% 51.14% 3.22 0.7585 0.724Telenor ASA (TEL:OSL) 62.30% 15.93% ‐‐ 6.8 0.7494 0.4166TeliaSonera AB (TLSN:STO) 43.44% 16.41% 87.73% 6.34 2.16 0.4325Vodafone Group PLC (VOD:LSE) 29.63% 43.79% 28.19% 2.23 1.65 0.2879Ziggo NV (ZIGGO:AEX) 68.81% 13.69% 74.68% 8.61 0.4604 0.7005
Fonte dati: Financial Times Pagina 2 Per spiegazione indicatori si prega di consultare la Legenda

STOXX 600 Settore VIAGGI TEMPO LIBERO
Name Country Industry MarketCap Currency P/E Beta ROE DYAccor SA (AC:PAR) Francia Hotels & Motels 8.05 EUR 64.75 1.11 4.71% 2.27%Air France KLM SA (AF:PAR) Francia Airline 3.27 EUR ‐‐ 1.53 ‐58.48% 2.27%Carnival PLC (CCL:LSE) Inghilterra Recreational Activities 17.84 GBP 29.23 1.01 4.28% 2.55%Compass Group PLC (CPG:LSE) Inghilterra Restaurants 16.58 GBP 40.23 0.65 14.17% 2.58%easyJet plc (EZJ:LSE) Inghilterra Airline 6.46 GBP 16.53 0.93 20.89% 2.06%Firstgroup PLC (FGP:LSE) Inghilterra Railroads 1.56 GBP 29.46 0.42 2.58%Greene King PLC (GNK:LSE) Inghilterra Restaurants 1.96 GBP 21.13 0.79 9.29% 3.02%International Consolidated Airlines Group SA (IAGInghilterra Airline 8.07 GBP 136.49 ‐‐ 3.83% 3.02%InterContinental Hotels Group PLC (IHG:LSE) Inghilterra Hotels & Motels 5.08 GBP 24.09 1.01 329.20% 2.18%Ladbrokes PLC (LAD:LSE) Inghilterra Casinos & Gaming 1.34 GBP 20.03 1.17 15.80% 6.13%Deutsche Lufthansa AG (LHAX:GER) Germania Airline 8.43 EUR 26.74 1.05 5.78% 1.81%Greek Organisation of Football Prognostics SA (O Grecia Casinos & Gaming 3.59 EUR 25.43 0.81 12.34% 2.00%Paddy Power PLC (PLS:ISE) Irlanda Casinos & Gaming 2.7 EUR 21.79 0.41 41.85% 1.97%Ryanair Holdings (RY4B:ISE) Irlanda Airline 9.52 EUR 18.87 0.64 15.84% 1.97%Sodexo SA (SW:PAR) Francia Restaurants 12.15 EUR 26.84 0.34 14.67% 2.09%Stagecoach Group PLC (SGC:LSE) Inghilterra Railroads 2.15 GBP 14.71 0.63 ‐‐ 2.38%Thomas Cook Group plc (TCG:LSE) Inghilterra Personal Services 2.55 GBP ‐‐ 2.30 ‐43.52% 2.38%TUI AG (TUI1:HAN) Inghilterra 3 EUR ‐‐ 1.41 0.48% 0.93%TUI Travel PLC (TT.:LSE) Inghilterra Recreational Activities 4.72 GBP 79.92 1.39 ‐‐ 3.20%Whitbread PLC (WTB:LSE) Inghilterra Restaurants 7.37 GBP 24.22 0.90 20.23% 1.47%William Hill PLC (WMH:LSE) Inghilterra Casinos & Gaming 3.03 GBP 14.06 0.70 20.65% 3.33%
Fonte dati: Financial Times Pagina 1 Per spiegazione indicatori si prega di consultare la Legenda

STOXX 600 Settore VIAGGI TEMPO LIBERO
Name GM NPM PoR P/CFPS QR TD/TCAccor SA (AC:PAR) 92.67% 2.49% ‐‐ 17.24 1.23 0.4475Air France KLM SA (AF:PAR) 14.86% ‐5.82% ‐‐ 5.63 0.6838 0.8058Carnival PLC (CCL:LSE) 43.47% 6.64% 32.33% 11.4 0.189 0.282Compass Group PLC (CPG:LSE) ‐‐ 2.47% 1.0188 21.87 0.8875 0.448easyJet plc (EZJ:LSE) 0.4002 9.35% 0.7739 12.67 ‐‐ 0.2519Firstgroup PLC (FGP:LSE) 4.55% 0.56% 0.00% 3.32 0.8285 0.6013Greene King PLC (GNK:LSE) ‐‐ 7.57% 63.69% 12.84 0.4545 0.5899International Consolidated Airlines Group SA (IAG 58.69% 0.81% 63.69% 8.79 0.6742 0.5485InterContinental Hotels Group PLC (IHG:LSE) 0.588 19.65% 144.89% 18.61 0.715 1.06Ladbrokes PLC (LAD:LSE) ‐‐ 5.99% 121.49% 10.14 ‐‐ 0.4967Deutsche Lufthansa AG (LHAX:GER) ‐0.56% 1.02% 66.29% 4.31 0.8242 0.5092Greek Organisation of Football Prognostics SA (O 9.33% 3.80% 0.5651 19.37 0.7396 0.1285Paddy Power PLC (PLS:ISE) 82.79% 16.53% 0.5392 16.63 ‐‐ ‐‐Ryanair Holdings (RY4B:ISE) 35.02% 10.39% 0.5392 10.93 2.01 0.4867Sodexo SA (SW:PAR) 14.93% 2.51% 0.5813 16.03 0.8298 0.4696Stagecoach Group PLC (SGC:LSE) ‐‐ 5.13% 0.3455 7.65 0.7398 0.9415Thomas Cook Group plc (TCG:LSE) 21.69% ‐2.23% ‐‐ 65.16 0.5331 0.7343TUI AG (TUI1:HAN) 11.14% 1.18% 4.1648 5.05 0.5565 0.6652TUI Travel PLC (TT.:LSE) 11.07% 0.46% 2.2059 ‐‐ ‐‐ ‐‐Whitbread PLC (WTB:LSE) ‐‐ 13.90% 0.3524 16.96 0.3901 0.224William Hill PLC (WMH:LSE) 81.69% 15.24% 0.4124 10.36 0.8293 0.4668
Fonte dati: Financial Times Pagina 2 Per spiegazione indicatori si prega di consultare la Legenda

STOXX 600 Settore SERVIZI PUBBLICA UTILITA'Name Country Industry MarketCap Currency P/E Beta ROE DYCentrica PLC (CNA:LSE) Inghilterra Natural Gas Utilities 16.8 GBP 18.15 0.61 17.09% 5.11%CEZ as (BAACEZ:PRA) Repubblica Ceca Electric Utilities 311.23 CZK 8.61 0.69 14.12% 5.88%Drax Group PLC (DRX:LSE) Inghilterra Electric Utilities 2.67 GBP 52.9 0.23 3.56% 2.66%E.ON SE (EOAX.N:GER) Germania Electric Utilities 27.2 EUR 12.14 0.87 6.24% 3.25%Electricite de France SA (EDF:PAR) Francia Electric Utilities 53.01 EUR 14.97 0.91 11.63% 4.39%Edp Energias de Portugal SA (EDP:LIS) Portogallo Electric Utilities 10.59 EUR 12.32 1.03 12.08% 3.88%Enagas SA (ENG:MCE) Spagna Natural Gas Utilities 5.37 EUR 13.31 0.66 19.52% 4.45%Endesa SA (ELE:MCE) Spagna Electric Utilities 28.47 EUR 15.15 0.92 9.13% 4.41%Enel SpA (ENEL:MIL) Italia Electric Utilities 37.58 EUR 11.65 1.05 9.02% 2.60%Enel Green Power SpA (EGPW:MIL) Italia Conglomerates 10.2 EUR 21.25 0.72 6.72% 1.25%Fortum (FUM1V:HEX) Finlandia Electric Utilities 14.04 EUR 11.69 0.71 12.00% 6.96%Gas Natural SDG SA (GAS:MCE) Spagna Natural Gas Utilities 20.5 EUR 14.19 0.73 10.82% 3.46%GDF Suez SA (GSZ:PAR) Francia Natural Gas Utilities 46.01 EUR ‐‐ 0.82 ‐17.24% 7.87%Iberdrola SA (IBE:MCE) Spagna Electric Utilities 31.37 EUR 12.29 1.04 7.56% 2.50%National Grid PLC (NG.:LSE) Inghilterra Electric Utilities 30.72 GBP 12.34 0.42 24.48% 4.96%Pennon Group PLC (PNN:LSE) Inghilterra Waste Management Services 2.76 GBP 52.98 0.35 5.21% 3.93%Red Electrica Corporacion SA (REE:MCE) Spagna Electric Utilities 7.94 EUR 14.97 0.75 25.23% 3.42%Rubis SCA (RUI:PAR) Francia Oil & Gas Operations 1.94 EUR 18.12 0.36 10.34% 3.74%RWE AG (RWEX:GER) Germania Electric Utilities 16.29 EUR ‐‐ 1.10 ‐27.70% 2.74%SSE PLC (SSE:LSE) Inghilterra Electric Utilities 14.57 GBP 18.98 0.27 14.41% 5.61%Severn Trent PLC (SVT:LSE) Inghilterra Water Utilities 4.29 GBP 9.52 0.24 46.59% 4.33%Snam SpA (SRG:MIL) Italia Natural Gas Utilities 14.37 EUR 15.66 0.52 15.40% 4.71%Suez Environnement Company SA (SEV:PAR) Francia Waste Management Services 7.21 EUR 20.52 1.10 6.69% 4.60%Terna Rete Elettrica Nazionale SpA (TRN:MIL) Italia Electric Utilities 7.73 EUR 14.87 0.54 ‐‐ 4.16%United Utilities Group PLC (UU.:LSE) Inghilterra Water Utilities 5.3 GBP 7.83 0.27 34.58% 4.49%Veolia Environnement VE SA (VIE:PAR) Francia Waste Management Services 7.76 EUR ‐‐ 1.24 ‐2.12% 4.95%
Fonte dati: Financial Times Pagina 1 Per spiegazione indicatori si prega di consultare la Legenda
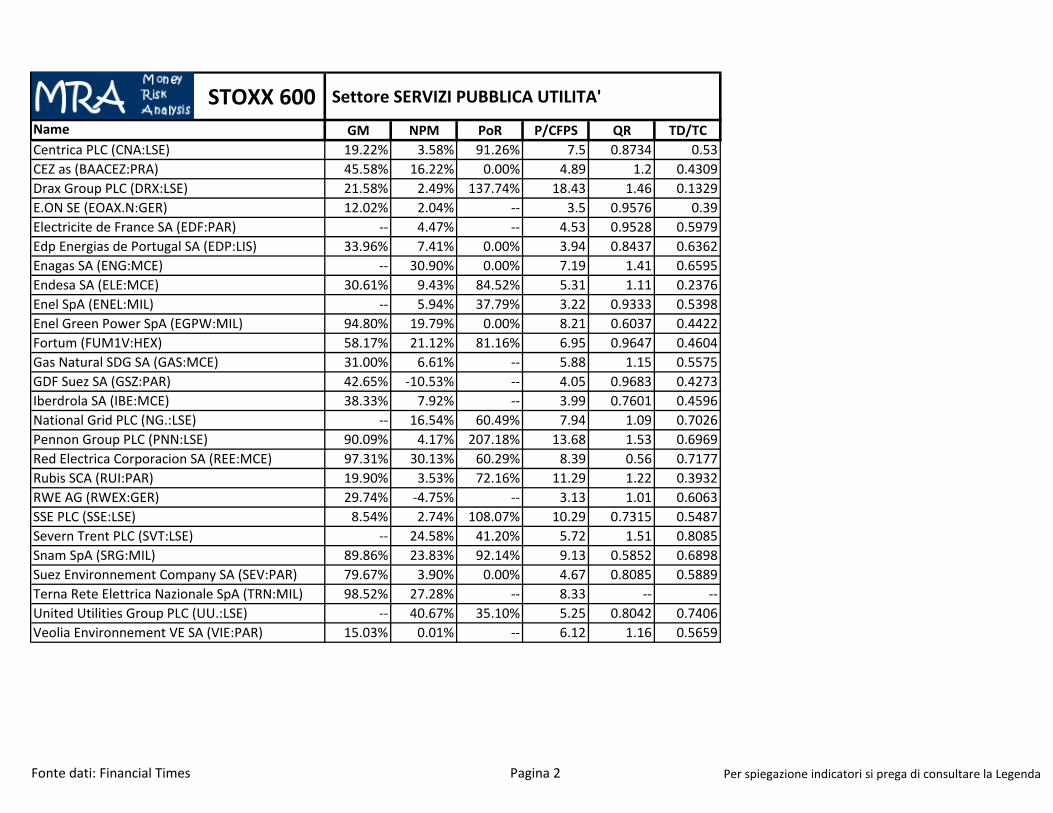
STOXX 600 Settore SERVIZI PUBBLICA UTILITA'Name GM NPM PoR P/CFPS QR TD/TCCentrica PLC (CNA:LSE) 19.22% 3.58% 91.26% 7.5 0.8734 0.53CEZ as (BAACEZ:PRA) 45.58% 16.22% 0.00% 4.89 1.2 0.4309Drax Group PLC (DRX:LSE) 21.58% 2.49% 137.74% 18.43 1.46 0.1329E.ON SE (EOAX.N:GER) 12.02% 2.04% ‐‐ 3.5 0.9576 0.39Electricite de France SA (EDF:PAR) ‐‐ 4.47% ‐‐ 4.53 0.9528 0.5979Edp Energias de Portugal SA (EDP:LIS) 33.96% 7.41% 0.00% 3.94 0.8437 0.6362Enagas SA (ENG:MCE) ‐‐ 30.90% 0.00% 7.19 1.41 0.6595Endesa SA (ELE:MCE) 30.61% 9.43% 84.52% 5.31 1.11 0.2376Enel SpA (ENEL:MIL) ‐‐ 5.94% 37.79% 3.22 0.9333 0.5398Enel Green Power SpA (EGPW:MIL) 94.80% 19.79% 0.00% 8.21 0.6037 0.4422Fortum (FUM1V:HEX) 58.17% 21.12% 81.16% 6.95 0.9647 0.4604Gas Natural SDG SA (GAS:MCE) 31.00% 6.61% ‐‐ 5.88 1.15 0.5575GDF Suez SA (GSZ:PAR) 42.65% ‐10.53% ‐‐ 4.05 0.9683 0.4273Iberdrola SA (IBE:MCE) 38.33% 7.92% ‐‐ 3.99 0.7601 0.4596National Grid PLC (NG.:LSE) ‐‐ 16.54% 60.49% 7.94 1.09 0.7026Pennon Group PLC (PNN:LSE) 90.09% 4.17% 207.18% 13.68 1.53 0.6969Red Electrica Corporacion SA (REE:MCE) 97.31% 30.13% 60.29% 8.39 0.56 0.7177Rubis SCA (RUI:PAR) 19.90% 3.53% 72.16% 11.29 1.22 0.3932RWE AG (RWEX:GER) 29.74% ‐4.75% ‐‐ 3.13 1.01 0.6063SSE PLC (SSE:LSE) 8.54% 2.74% 108.07% 10.29 0.7315 0.5487Severn Trent PLC (SVT:LSE) ‐‐ 24.58% 41.20% 5.72 1.51 0.8085Snam SpA (SRG:MIL) 89.86% 23.83% 92.14% 9.13 0.5852 0.6898Suez Environnement Company SA (SEV:PAR) 79.67% 3.90% 0.00% 4.67 0.8085 0.5889Terna Rete Elettrica Nazionale SpA (TRN:MIL) 98.52% 27.28% ‐‐ 8.33 ‐‐ ‐‐United Utilities Group PLC (UU.:LSE) ‐‐ 40.67% 35.10% 5.25 0.8042 0.7406Veolia Environnement VE SA (VIE:PAR) 15.03% 0.01% ‐‐ 6.12 1.16 0.5659
Fonte dati: Financial Times Pagina 2 Per spiegazione indicatori si prega di consultare la Legenda