introductory investment analysis slide set 1 course instructor lauren rudd [email protected] tel:...
TRANSCRIPT
Introductory Investment AnalysisSlide Set 1
Course Instructor
Lauren [email protected]
Tel: 941-346-5333 HomeTel: 941-706-3449 Office
January 12, 2015

Purpose
• Select investment candidates• You will do this by means of:
- Intrinsic Value using: FCFF Discounted Earnings Dividend Discount Model
- Comparative Analysis- Estimating Earnings
Copyright Rudd International 201/12/2015

3
What Is An Investment?
A current commitment of $ for a period of time in order to derive future payments that will compensate for:
–The time the funds are committed–The expected rate of inflation–Uncertainty of future flow of funds
01/12/2015 Copyright Rudd International

Reason for investing
By investing (saving money now instead of spending it), you can trade off present consumption for a larger future consumption.
01/12/2015 Copyright Rudd International 4

Pure rate of interest
• Pure Rate of Interest –It is the exchange rate between future
consumption (future dollars) and present consumption (current dollars). Market forces determine this rate. –Example: If you can exchange $100
today for $104 next year, this rate is 4% (104/100-1).
01/12/2015 Copyright Rudd International 5

Pure time value of money
The fact that people are willing to pay more for the money borrowed and lenders desire to receive a surplus on their savings (money invested) gives rise to the value of time referred to as the pure time value of money.
01/12/2015 Copyright Rudd International 6
Other factors affecting value
Inflation: If the future payment will be diminished in value because of inflation, then the investor will demand an interest rate higher than the pure time value of money to also cover the expected inflation expense.
01/12/2015 Copyright Rudd International 7
Other factors affecting value
Uncertainty:
If the future payment from the investment is not certain, the investor will demand an interest rate that exceeds the pure time value of money plus the inflation rate to provide a risk premium to cover the investment risk Pure Time Value of Money.
01/12/2015 Copyright Rudd International 8
Other factors affecting value
• Greater Fool Theory
• Sound Investing – Do not pay more for an investment than it is worth
• Beauty may be in the eye of the beholder….not value
Copyright Rudd International 901/12/2015

Required rate of return
• The minimum rate of return an investor require on an investment, including the pure rate of interest and all other risk premiums to compensate the investor for taking the investment risk.
• Investors may expect to receive a rate of return different from the required rate of return, which is called expected rate of return. What would occur if these two rates of returns are not the same?
01/12/2015 Copyright Rudd International 10
Valuation - Myths
• Valuation is objective• A hard earned valuation is immune to the
ravages of time• Valuation is precise• The more quantitative the better• Valuation assumes markets are inefficient• The end result, not the process, is key
Copyright Rudd International 1101/12/2015
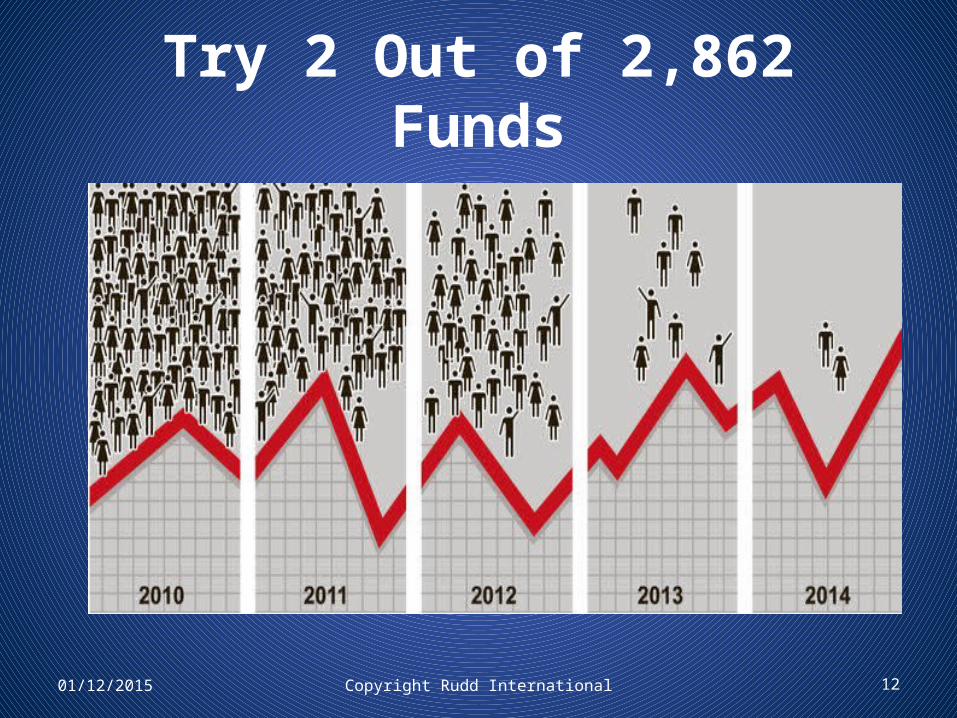
Try 2 Out of 2,862 Funds
01/12/2015 Copyright Rudd International 12
Valuation – the role it plays
Fundamental Analysis –true value of the firm. It is used in:
• Uncovering corporate value• Portfolio Management• Acquisitions• Credit Applications
Copyright Rudd International 1301/12/2015
Valuation
Three approaches:
• Discounted Cash Flow
• Relative valuation
• Contingent claims (options)
Copyright Rudd International 1401/12/2015
Compounding
Concept of adding accumulated interest back to the principal, so that interest is earned on interest
Copyright Rudd International 1501/12/2015
16
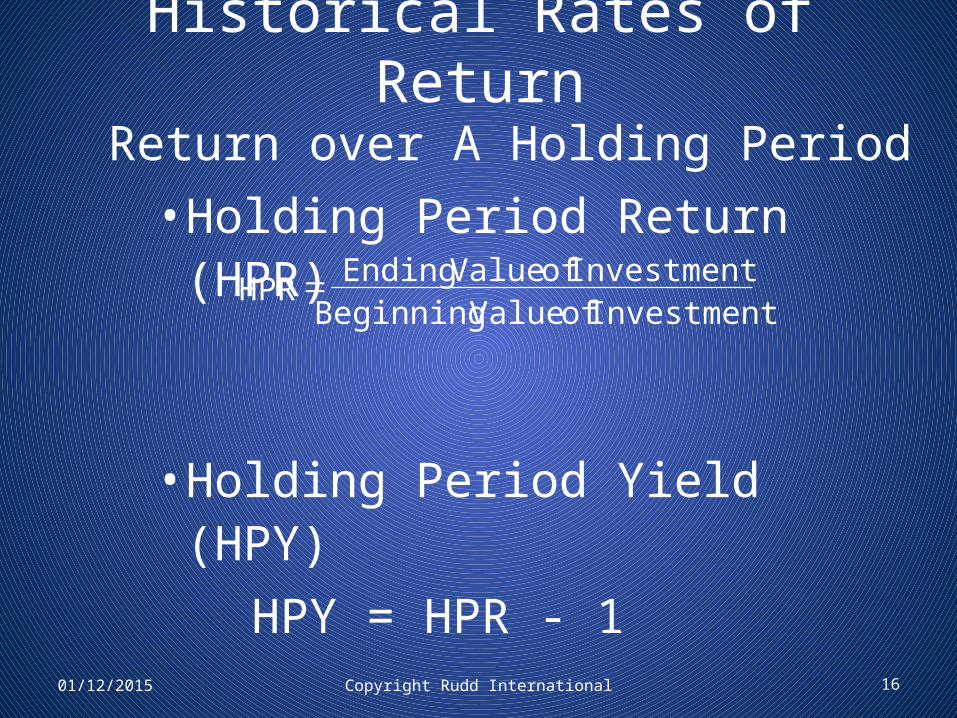
Historical Rates of Return
Return over A Holding Period• Holding Period Return (HPR)
• Holding Period Yield (HPY)HPY = HPR - 1
Investment of Value BeginningInvestment of Value Ending
HPR=
01/12/2015 Copyright Rudd International

Annual HPR and HPY
•Annual HPR = HPR1/n
•Annual HPY = HPR1/n – 1
where n=number of years of the investment
01/12/2015 Copyright Rudd International 17
18
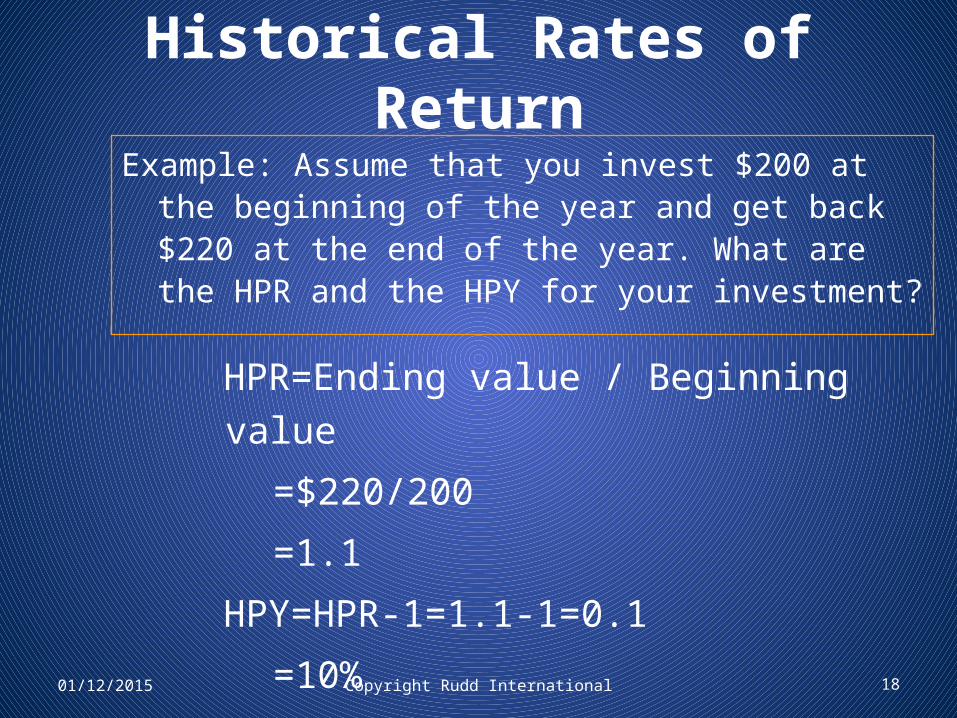
Historical Rates of ReturnExample: Assume that you invest $200 at the beginning of the
year and get back $220 at the end of the year. What are the HPR and the HPY for your investment?
HPR=Ending value / Beginning value
=$220/200
=1.1
HPY=HPR-1=1.1-1=0.1
=10%
01/12/2015 Copyright Rudd International

19
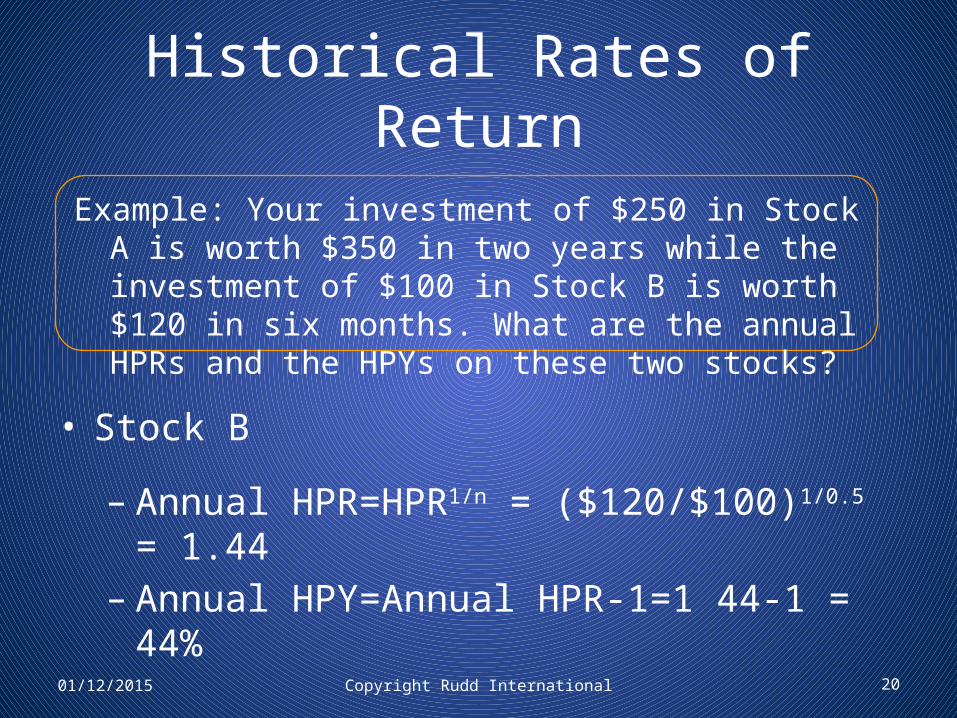
Historical Rates of ReturnExample: Your investment of $250 in Stock A is worth $350 in
two years while the investment of $100 in Stock B is worth $120 in six months. What are the annual HPRs and the HPYs on these two stocks?
Stock A
• Annual HPR=HPR1/n = ($350/$250)1/2 =1.1832
• Annual HPY=Annual HPR-1=1.1832-1=18.32%
01/12/2015 Copyright Rudd International
Historical Rates of Return
• Stock B
– Annual HPR=HPR1/n = ($120/$100)1/0.5 = 1.44– Annual HPY=Annual HPR-1=1 44-1 = 44%
01/12/2015 Copyright Rudd International 20
Example: Your investment of $250 in Stock A is worth $350 in two years while the investment of $100 in Stock B is worth $120 in six months. What are the annual HPRs and the HPYs on these two stocks?
21
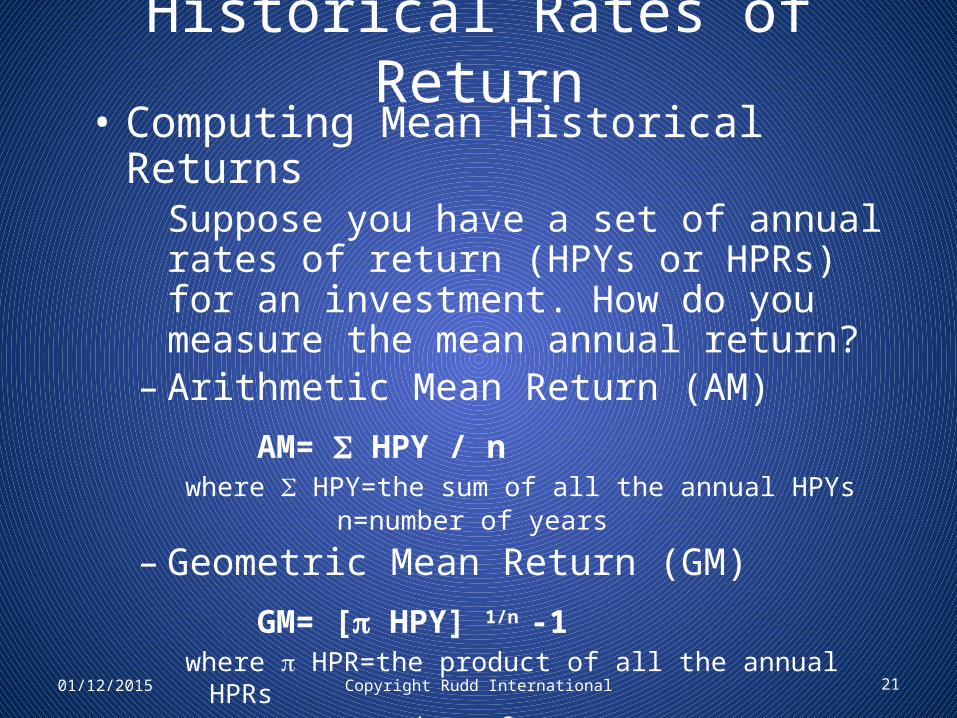
Historical Rates of Return• Computing Mean Historical Returns
Suppose you have a set of annual rates of return (HPYs or HPRs) for an investment. How do you measure the mean annual return?
– Arithmetic Mean Return (AM)
AM= HPY / nwhere HPY=the sum of all the annual HPYs
n=number of years
– Geometric Mean Return (GM)
GM= [ HPY] 1/n -1where HPR=the product of all the annual HPRs
n=number of years
01/12/2015 Copyright Rudd International

22
Historical Rates of ReturnSuppose you invested $100 three years ago and it is worth $110.40 today. The information below shows the annual ending values and HPR and HPY. This example illustrates the computation of the AM and the GM over a three-year period for an investment.
Year Beginning Ending HPR HPY Value Value
1 100 115.0 1.15 0.152 115 138.0 1.20 0.203 138 110.4 0.80 -0.20
01/12/2015 Copyright Rudd International

23
Historical Rates of Return
AM=[(0.15)+(0.20)+(-0.20)] / 3 = 0.15/3=5%
GM=[(1.15) x (1.20) x (0.80)]1/3 – 1 =(1.104)1/3 -1=1.03353 -1
=3.353%
01/12/2015 Copyright Rudd International

Comparison of AM and GM
• When rates of return are the same for all years, the AM and the GM will be equal.
• When rates of return are not the same for all years, the AM will always be higher than the GM.
• While the AM is best used as an “expected value” for an individual year, while the GM is the best measure of an asset’s long-term performance.
01/12/2015 Copyright Rudd International 24

Holding Period Return
• Ending value divided by beginning value• $220/$200 HPR = 1.10
• Annual HPR = HPR1/n
• Assume 6 months
• 1.102 = 1.21 or 21%
Copyright Rudd International 2501/12/2015
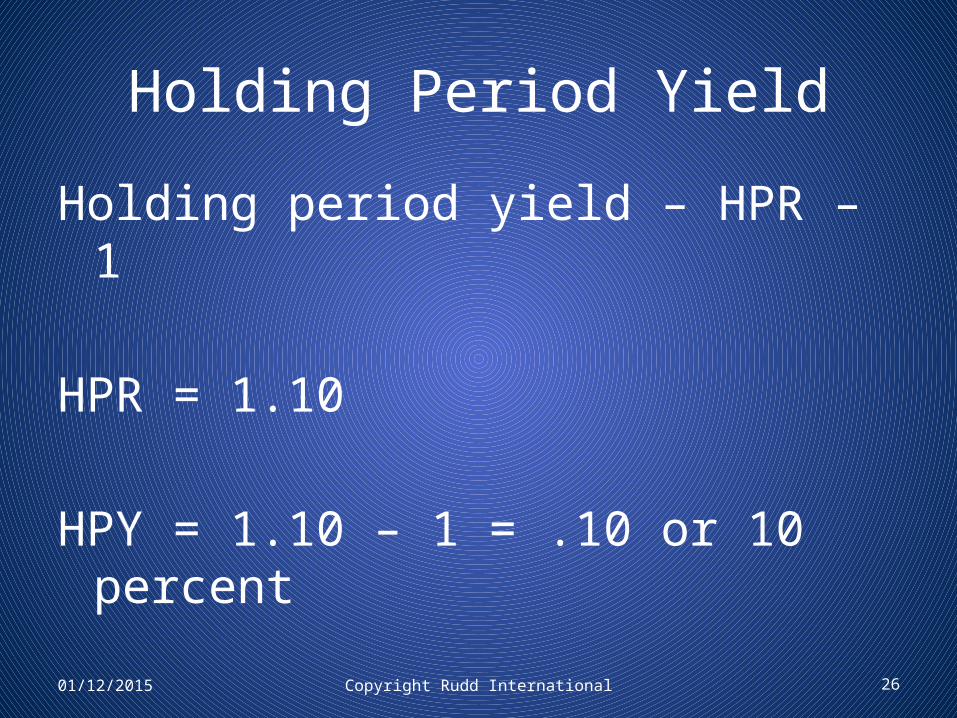
Holding Period Yield
Holding period yield – HPR – 1
HPR = 1.10
HPY = 1.10 – 1 = .10 or 10 percent
Copyright Rudd International 2601/12/2015
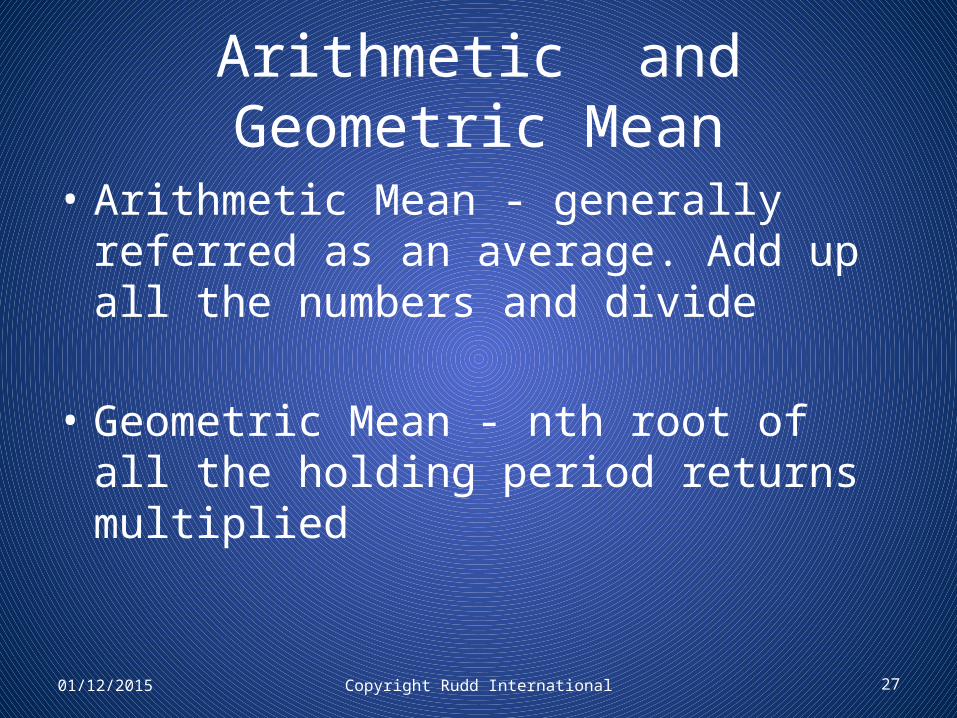
Arithmetic and Geometric Mean
• Arithmetic Mean - generally referred as an average. Add up all the numbers and divide
• Geometric Mean - nth root of all the holding period returns multiplied
Copyright Rudd International 2701/12/2015
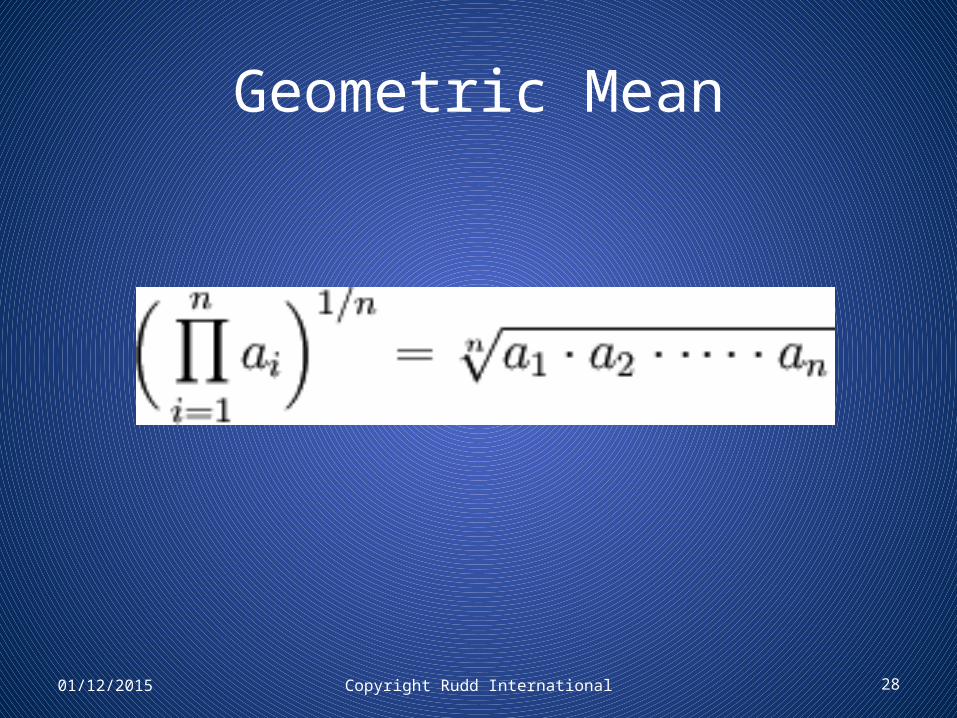
Geometric Mean
Copyright Rudd International 2801/12/2015

Arithmetic Mean vs Geometric
Year Beg End HPR HPY
1 $50 $100 2.00 1.00 or 100%
2 $100 $50 0.50 -0.50 or -50%
AM = 1.00 + (-0.50) / 2 = .25 or 25%
GM = [(2.00) * (0.50)]1/2 - 1 = 1-1 = 0Copyright Rudd International 2901/12/2015

CAGR
Compound Annual Growth Rate – CAGRThe year-over-year growth rate of an investment over a
specified period of time.
The compound annual growth rate is calculated by taking the nth root of the total percentage growth rate, where n is the number of years in the period being considered.
Copyright Rudd International 3001/12/2015

CAGR
Copyright Rudd International 3101/12/2015
Valuation
• Discounted Cash Flow
• The foundation of most approaches to valuation
• Based on the concept of present value
Copyright Rudd International 3201/12/2015

Valuation – Present Value
• Present Value - an amount today that is equivalent to a future payment, or series of payments, that has been discounted by an appropriate interest rate.
Copyright Rudd International 3301/12/2015
Valuation – Present Value cont.
• Money has time value – Therefore, the present value of a promised future payment is worth less the longer you have to wait to receive it.
• The difference depends on the time periods for compounding and the interest or discount rate.
Copyright Rudd International 3401/12/2015

Valuation – Present Value cont.
The relationship between the present value and future value can be expressed as:
PV = FV/(1 + i)n
PV = present value FV = future value i = interest rate per periodn = number of periods
Copyright Rudd International 3501/12/2015
Valuation – Present Value cont.
• For example, someone contracts to pay you $100 in one year. What is it worth right now?
• Assume the going interest rate is 5%
Copyright Rudd International 3601/12/2015
Valuation – Present Value cont.
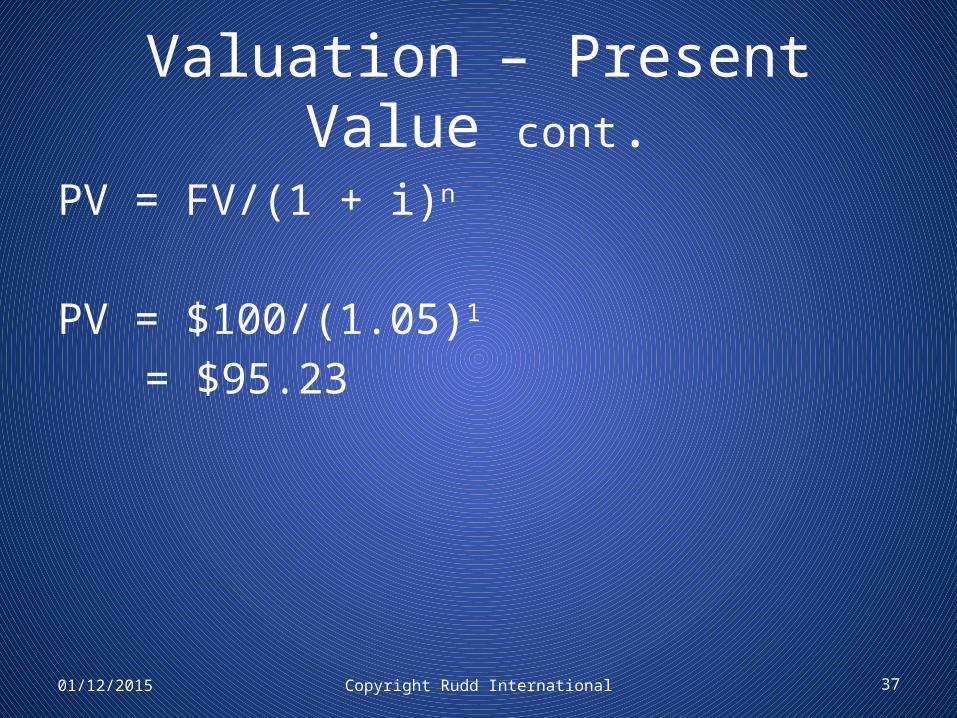
PV = FV/(1 + i)n
PV = $100/(1.05)1 = $95.23
Copyright Rudd International 3701/12/2015
Valuation – Present Value cont.
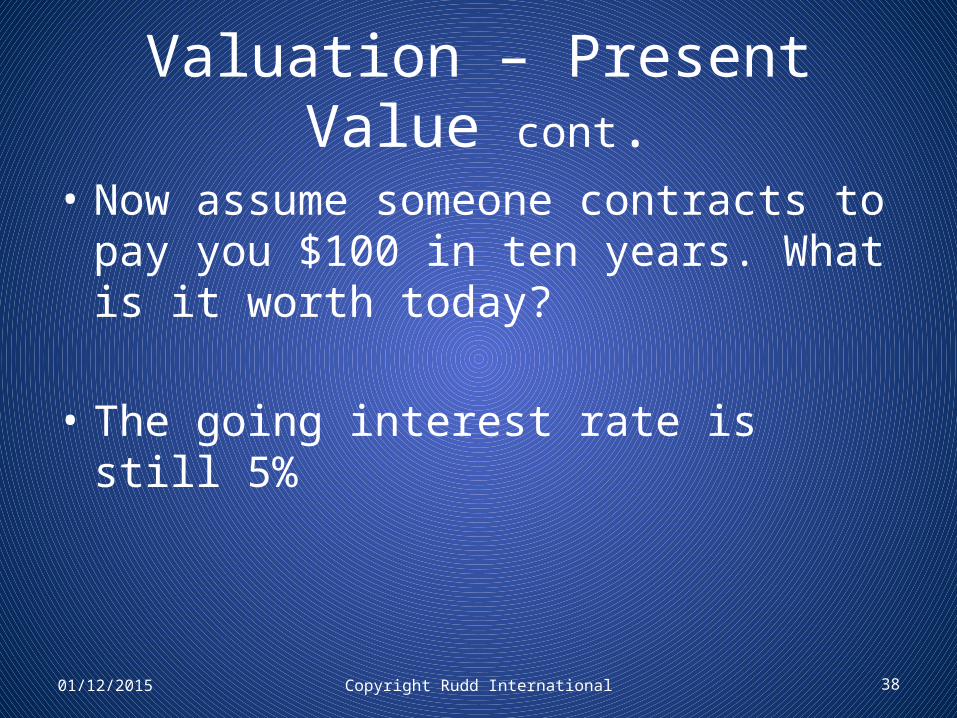
• Now assume someone contracts to pay you $100 in ten years. What is it worth today?
• The going interest rate is still 5%
Copyright Rudd International 3801/12/2015
Valuation – Present Value cont.
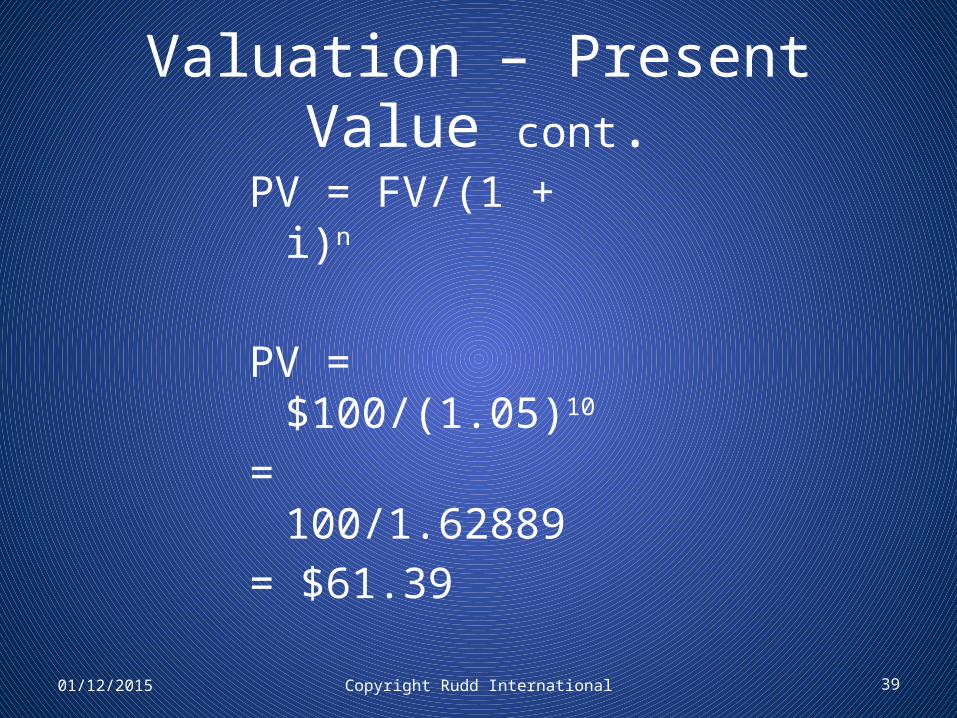
PV = FV/(1 + i)n
PV = $100/(1.05)10 = 100/1.62889 = $61.39
Copyright Rudd International 3901/12/2015
Valuation – Present Value cont.
The previous examples assume interest is paid once a year at the end of the year.
Suppose interest is paid more than once a year
Copyright Rudd International 4001/12/2015

Valuation – Present Value cont.
• At interest compounded q times a year:
• PV = FV/(1 + r/q)nq
• Or in the same example but compounding monthly (q = 12)
• P = 100,000/(1 + 0.05/12)120 = 100,000/1.64701 = 60716
Copyright Rudd International 4101/12/2015
Valuation – Present Value cont.
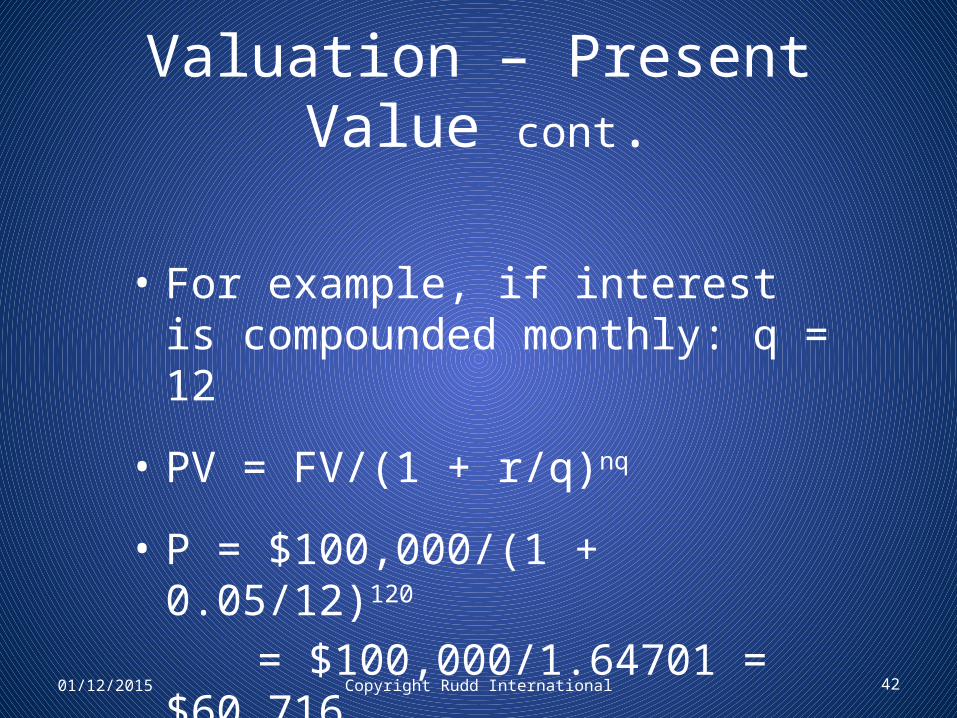
• For example, if interest is compounded monthly: q = 12
• PV = FV/(1 + r/q)nq
• P = $100,000/(1 + 0.05/12)120
= $100,000/1.64701 = $60,716
Copyright Rudd International 4201/12/2015
Valuation – Present Value cont.
• Up until now we have discussed a single payment with a single interest rate payable after a set period of time.
• Next consider multiple payments
• For example a payment after one year• A payment after the second year• A payment after the nth year
Copyright Rudd International 4301/12/2015

Valuation – Present Value cont.
• Present value over multiple periods
• PV=
• PV=1
/(1 )n t
ttCF r
1/(1 )
n ttt
FV r
Copyright Rudd International 4401/12/2015
Valuation – Relative Valuation
• Majority of Valuations are relative in nature
• Example – Using an industry standard P/E ratio to value a firm
• Assumes market reliability
• Individual stocks are valued incorrectly
Copyright Rudd International 4501/12/2015
Class 1 - Part II
Accounting Statements
01/12/2015 Copyright Rudd International 46
Accounting Statements – Balance Sheet
• Assets
Current – Short life spanFixed - Long Lived Real AssetsFinancial InvestmentsIntangible
Copyright Rudd International 4701/12/2015

Accounting Statements – Balance Sheet
• Liabilities
– Current – Short-term liabilities– Debt – Long term obligations– Other – Other long term obligations
Copyright Rudd International 4801/12/2015

Accounting Statements
• Shareholder Equity
- Common Stock- Additional Paid in Capital- Retained Earnings
Copyright Rudd International 4901/12/2015
Accounting Statements
• Assets = Liabilities + Shareholder Equity
Copyright Rudd International 5001/12/2015
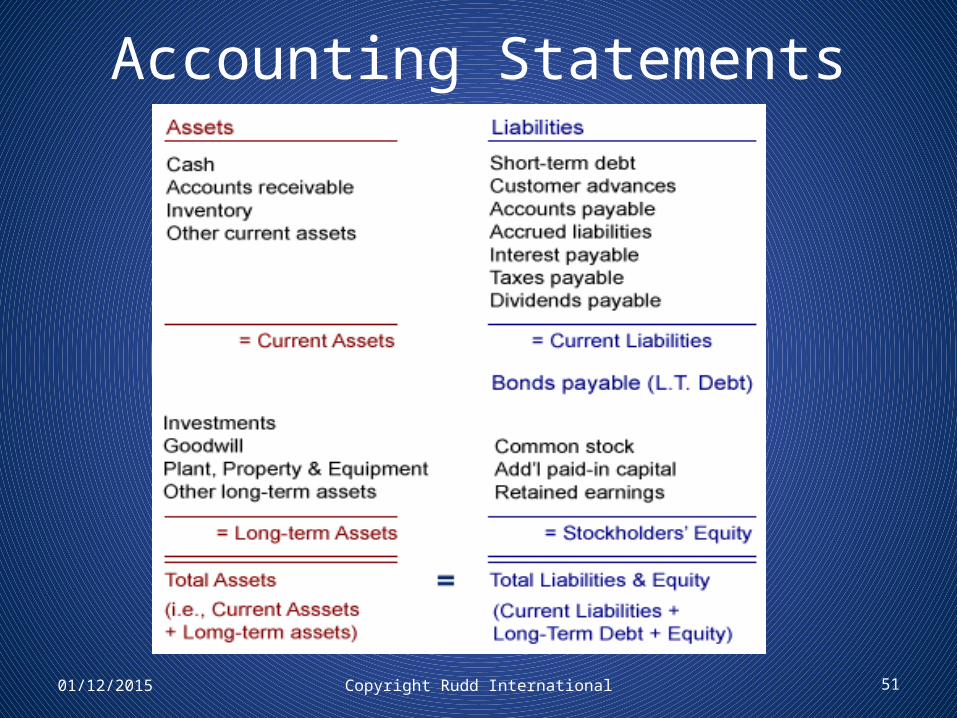
Accounting Statements
Copyright Rudd International 5101/12/2015

Accounting Statements – Income StatementRevenues
- Operating Expenses= Operating Income
- Financial Expenses- Taxes
= Net Inc. before Extraordinary Items+- Extraordinary Items- Preferred Dividends
= Net income to shareholders
Copyright Rudd International 5201/12/2015
Accounting Statements - Cash Flow
Cash Flow from Operations
+ Cash Flow from Investing
+ Cash Flow from Financing
= Net Change in Cash Balance
Copyright Rudd International 5301/12/2015
Accounting Statements - Free Cash Flow
Free Cash Flow = Cash Flow from Operations – Capital Expenditures
Copyright Rudd International 5401/12/2015
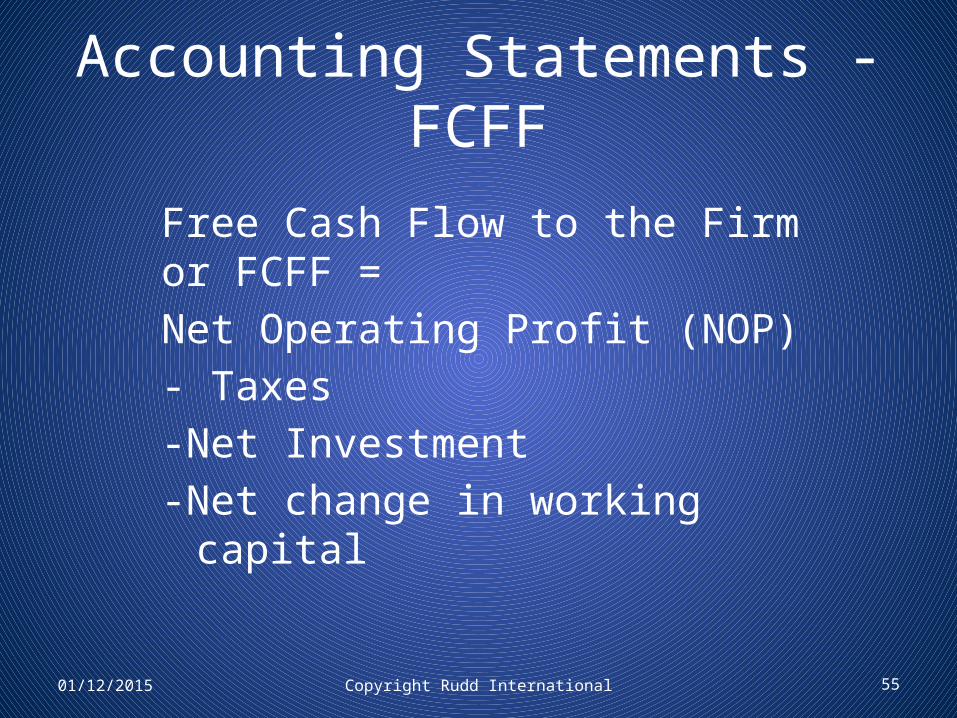
Accounting Statements - FCFF
Free Cash Flow to the Firm or FCFF =Net Operating Profit (NOP) - Taxes-Net Investment-Net change in working capital
Copyright Rudd International 5501/12/2015

Accounting Statements
Copyright Rudd International 5601/12/2015
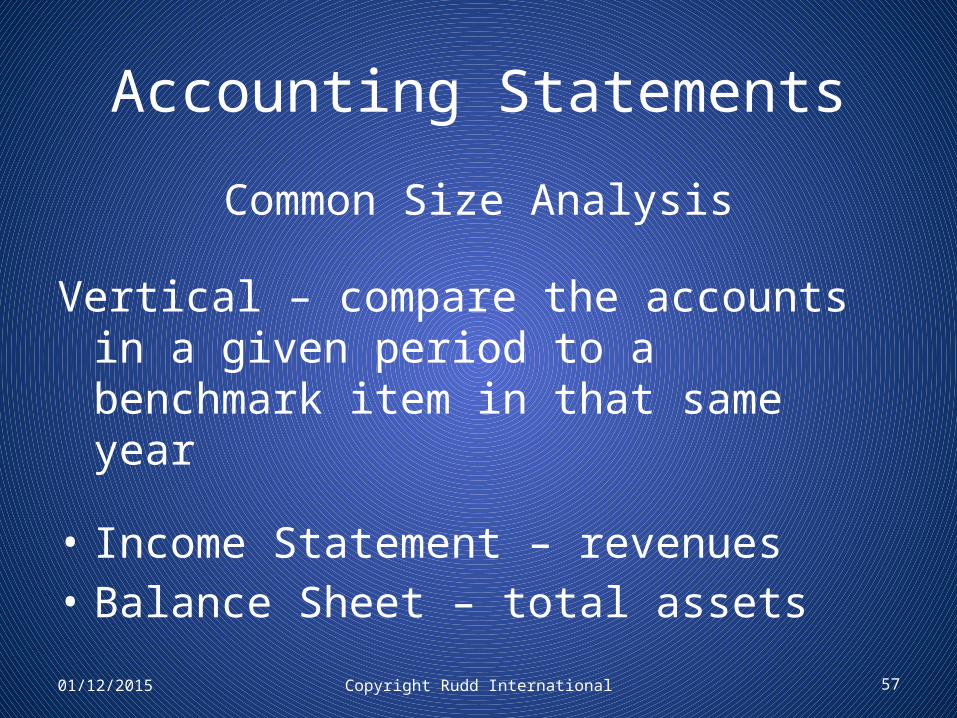
Accounting Statements
Common Size Analysis
Vertical – compare the accounts in a given period to a benchmark item in that same year
• Income Statement – revenues• Balance Sheet – total assets
Copyright Rudd International 5701/12/2015
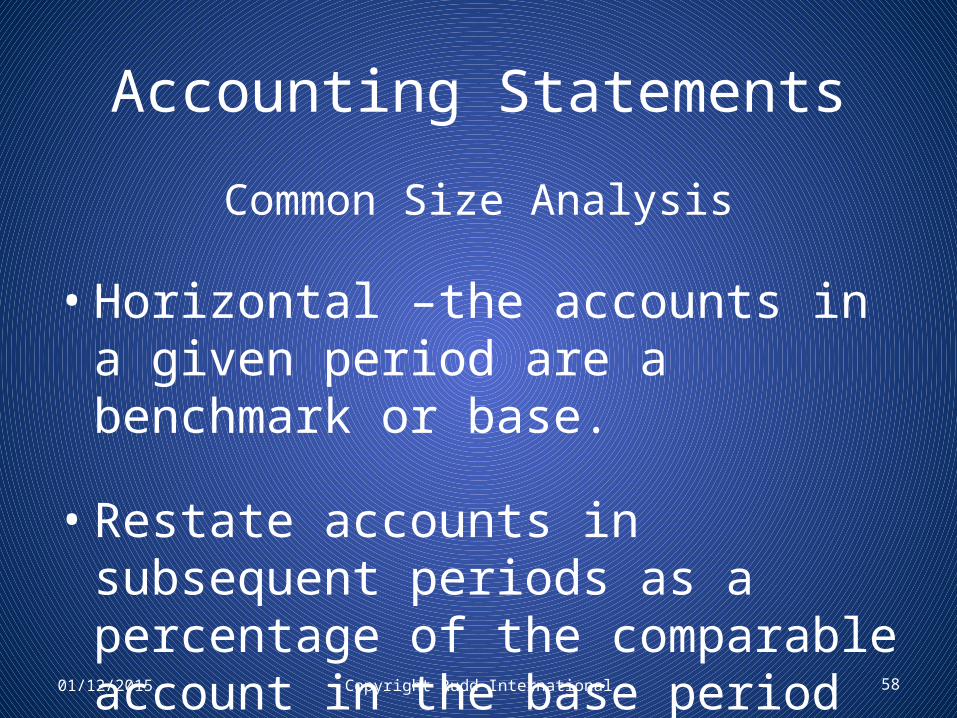
Accounting Statements
Common Size Analysis
• Horizontal –the accounts in a given period are a benchmark or base.
• Restate accounts in subsequent periods as a percentage of the comparable account in the base period
Copyright Rudd International 5801/12/2015

Financial Ratio Analysis
• Activity Ratios – Effectiveness is using asset investments to work
• Liquidity Ratios – Ability to meet short-term and intermediate debt obligations
• Solvency Ratios – Ability to meet long-term debt obligations
• Profitability Ratios – Ability to generate profits
Copyright Rudd International 5901/12/2015

Financial Ratio Analysis
• Activity – Turnover ratios such as:
• Inventory Turnover =
Cost of goods sold __________________________________________________
Average Inventory
Copyright Rudd International 6001/12/2015

Financial Ratio Analysis
• Liquidity – Generate cash for immediate needs
Current Ratio =
Current Assets Current Liabilities
Copyright Rudd International 6101/12/2015
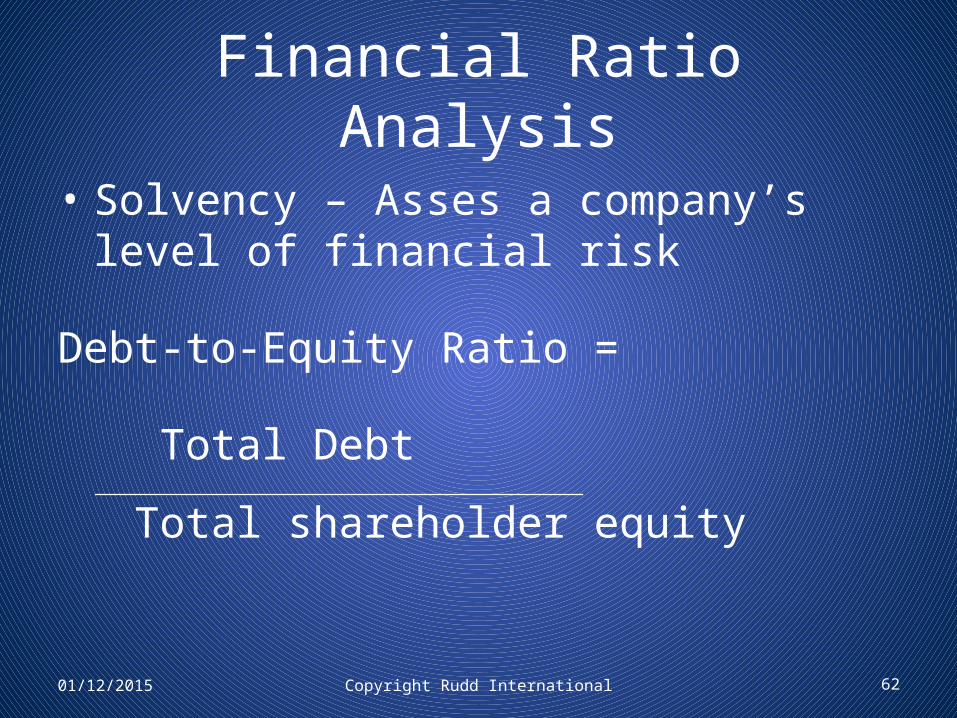
Financial Ratio Analysis
• Solvency – Asses a company’s level of financial risk
Debt-to-Equity Ratio =
Total Debt
Total shareholder equity
Copyright Rudd International 6201/12/2015
Financial Ratio Analysis
• Profitability – Asses a company’s level of profitability
Operating profit margin =
Operating income (EBIT)
Total revenue
Copyright Rudd International 6301/12/2015