introduction - …€¦ · web viewa word of caution is required ... (table 7). our sample is...
TRANSCRIPT

Changes in Expenditure, Income and Income Sources for Development NGOs based in the UK
October 2017
Dan Brockington (SIID) and Nicola Banks (GDI)
Highlights
In the England and Wales charity begins at home. Total spend by development NGOs in 2015 here was about £6.7bn; total charitable spend about £68bn of which £50bn was for charities whose remit is only within the UK.
The development NGO sector has grown vigorously, especially since the 1980s.
The sector is highly unequal in terms of its allocation of resources, with 8% of organisations controlling 88% of expenditure.
Income and expenditure by development NGOs has increased since 2004 across all class sizes in England and Wales, and in Scotland since at least 2009.
The public is the most important source of revenue for development NGOs, providing 40% of revenues. This has increased in real terms over the last 5 years, but decreased marginally in relative importance as the sector has diversified.
Growth in public income is not rivalrous, ie. organisations do not seem to be fighting for the same pound. Instead they are seeking and creating new sources. It is likely that growth in public income derives from high net-worth individuals.
Corporate donations generally account for little more than 5% of income, and have not increased except for the largest NGOs.
Scottish NGOs we have analysed are drawing less on donations from the public proportionately to England and Wales. This may be a function of the sample.
Fundraising ratios (return on fundraising invesments) are high and favourable for the sector as a whole.
If more was invested in fundraising it is possible that hundreds of millions of extra income could be earned.
1

Contents
Introduction 3
Methods 4
General Patterns in Income and Expenditure 7
Changes to Sources of Income 2009-2014 151. Data available for Income Analysis 152. Sources of Income 163. Change in Income Source over time 174. The Distribution of Income Source by Size Class 205. Trends in Income 226. Change to sources of income for different size classes of NG0: has there been a fight for the ‘development pound’? 237. Variations in Income by Region 258. The costs of fund-raising 27
A. How much should organisations spend on fundraising? 27B. What returns does the sector get from its fundraising? 28C. Variations in fundraising by region and size class 30D. What about organisations that spend nothing on fundraising? 31
Conclusion 33
Acknowledgements 34
Methodological Annexes 351. NCVO Data 352. NCVO income categories 363. Correction for Inflation 384. Excluded Organisations 39
2
Introduction
We have been tracking the finances and activities of nearly 900 development NGOs based in England, Wales and Scotland. This has entailed engagement with various umbrella agencies to obtain lists of NGOs and consultation exercises to determine which organisations should, or should not, be on the list. More details about this process, and who is included or excluded from our list, and earlier reports from it are available here.
This report compiles findings from three datasets about this group of NGOs:
1. Income and Expenditure figures from 2003 to 2015 which can be downloaded from the Charity Commission site (as per the instructions here). This provides data for English and Welsh charities which account for 837 organisations on our lists.
2. Income and Expenditure figures from 2009 to 2015 which we have compiled ourselves for Scottish development NGOs which account for 68 on our lists.
3. A breakdown of income sources and expenditure on fundraising for a sample of 580 NGOs from 2009 to 2014. We have obtained about half of these data from the National Council of Voluntary Organisations’ (NCVO) which runs a ‘Civil Society Almanac’. The Almanac provides detailed records of the sources of income of a large number of NGOs. The rest of these data we entered ourselves.
We are undertaking this work partly because we could not find this sort of general overview and description. Specifically we wanted to understand better how the development NGO sector in the UK works as a sector, and how it works with overseas partnerships and networks. We also want to understand what sustains the sector in the UK and how that support is changing. We want to do this because we believe that the sector promotes social justice and understanding how it operates will advance that cause.
Although the work reported here is considerable we see this only as a preliminary step to conducting more authoritative work on changes in income, expenditure, priorities and networks that we hope to undertake in collaboration with a number of different development organisations.
The report is structured as follows.
1. Our methods for putting together this list and the financial data it presents.
2. A basic description of the structure and geography of the sector, and its recent financial trends.
3. The changing sources of income and the role of fundraising in those changes.
This research is co-lead by Dan Brockington of the Sheffield Institute for International Development (SIID) and Nicola Banks of the Global Development Institute (GDI) at the Universities of Sheffield and Manchester respectively. All data used here will be made freely available in the public domain when our final reports are released.
3

Methods
To construct the list of 898 development NGOs we have screened over 1500 charities (hereafter NGOs) from the membership lists of BOND, Scotland's International Development Alliance; South West and South Wales International Development Network; The South Yorkshire International Development Network, the Foundation for Social Improvement and Small Charities Coalition; from grantees of DFID and Comic Relief; from Hub Cymru Africa; from organisations declaring their interests in ODA and famine relief on the Charity Commission website; from a previous research project into conservation NGOs, and from our own ‘snowballing’ of contacts and networks.
Any list like this is only as good as the criteria for being included or excluded. We have excluded the following sorts of organisations:
Those whose primary purposes are not international development – for example Leonard Cheshire and the RNLI;
That are not charities; That primarily give grants to UK-based organisations – or example Comic Relief; That spend on average less than £10k in between 2011 and 2015. This is not
because we think small organisations are unimportant, just that we did not have the resources to take them all on;
Organisations from Northern Ireland – because we could find no umbrella organisation to draw them from;
That are primarily religious NGOs. For the purpose of this research we have defined ‘primarily religious NGOs’ as organisations that spend much time and money on a set of activities (missionary work, church or mosque building) not undertaken by secular organisations. We have included many organisations with a religious underpinning, such as Christian Aid, Tearfund and Islamic Relief, which are organisations whose activity resembles that of secular organisations.
A word of caution is required about the last exclusion. Despite acknowledgment of the significance of religion within development and appreciation for the lessons that can be learnt from religious organisations, the sheer mass of religious NGOs have prevented us from including this group. As with the small NGOs, we believe these religious organisations comprise a potentially large group that is beyond our means to accurately list, deserving of a study in their own right.
As a result of these exclusions we are fairly certain that we are surveying only a small minority of the sector in terms of the number of organisations included, but we are covering most of its expenditure. We can be sure of this because the Charity Commission of England and Wales categorises charities according to their activities. In the category ‘Overseas Aid/Famine Relief’ 11,079 charities were listed in 2015. We have less than 10% of them. However this group was only spending £2.2bn, just under half of which was accounted for by the largest 37 organisations, many of whom we considered but discounted because they were only donor groups (like Comic Relief) or were not mainly development organisations (like Leonard Cheshire). This group of excluded organisations mainly consists of smaller charities – over 9600 were in the smallest categories.
4
Partly for this reason we are confident therefore that we have identified a sufficiently meaningful group of organisations to begin analyzing patterns within them. Another reason for that confidence is that we have subjected the list of included and excluded organisations to a public check, welcoming feedback from all organisations on the lists and the umbrella organisations that we drew our list from. The list of organisations we have screened, and the data we have collected, will be available to download on the project website when we have completed cross-checking data and collecting feedback from all the organisations included in the study. This is an integral part of our methods.
For this list of organisations we obtained financial data from two sources. Basic income and expenditure were available for download from the Charity Commission, the Office of the Scottish Charity Regulator and from the organisations themselves. All our data are already in the public domain. We have merely collated them.
The charities for whom we collected these data use a variety of financial years. To make them comparable and consistent we have converted financial year data into calendar years. We did this by assuming that expenditure and income were evenly spread through the year, and allocating figures to calendar years accordingly. We have also standardized the calendar year data, so that where data are not available for the whole calendar year, or, on occasion, financial years overlap so that the same month is reported twice, these discrepancies can be controlled for.
The reason why we have presented data from 2004-2015 (for English and Welsh charities) and 2009-2015 (Scottish) is because these are the years for which data are most complete. We cannot report on more recent trends because the data are still not available. It takes some time for organisations to complete their financial reports. This means that, for organisations whose financial years include the final months of 2016, their reports for those months are still not available. Full data for 2016 will only become available sometime in 2018.
We have data on the source of income from the NCVO Alamanc. These data take some time to collect, and so the latest year for which we have reasonably complete data is 2014. The NCVO Almanac provides detailed records of the finances, staffing and assets of a large sample of NGOs. This constitution of the Almanac is structured according to the size of the organisation. Records of all the largest (income over £100 million) are kept each year along with samples of the smaller organisations. The size of the sample decreases with the category size of the organisation – from 0.1 of the micro organisations (income less than £10 million), to 80 of the major organisations (income over £10 million).
It is important to note that the sample of NGOs taken to construct the Almanac is different each year. It does not follow the same organisations every year. This means that when we bought records from the Almanac of 400 organisations, we do not, in fact, have complete records for all organisations across all six years of the study. These deficiencies affect the smaller organisations most as these are sampled least frequently. We have therefore supplemented Almanac with our own records, filling in missing years
5
where necessary, and adding large numbers of smaller organisations, randomly selected from our list.
NCVO and Charity Commission data were not always concordant. The vast majority of records were the same but there were some significant differences (more than 10%, or more than £100k) in a few case. We tried to reconcile them. It may be best, however, to treat them as separate records in this analysis.
We have amalgamated the sources of income presented in the Almanac to present trends in the following list of sources:
Business Sector Independent Government Funded Bodies (NHS Trusts, Universities, Arts Councils, Public Corporations)InvestmentsNational LotteryNon-Profit Sector (Other NGOs and Foundations)Overseas GovernmentsThe PublicUK Government (Central and Local)Unclassified
Because it derives from the Almanac this report is similar to an earlier report presented by BOND which examined financial trends of 362 of its members from 2006/7-2013/14, with a detailed breakdown in income sources for nearly 230 BOND members. Our report differs in three ways from this earlier one. First, it concerns a larger group of NGOs, not just BOND members. Second, its data are more complete – for some smaller organisations, Almanac data were only available for two years in the BOND report – we have more complete records. Third, as explained in the appendices, NCVO data can alter the financial years for which income and expenditure are reported. We have corrected those alterations and use calendar, rather than financial years.
Full details of our treatment of the data – the nature of the data, amalgamations of income category, correction for inflation, are provided in the methodological annexes. We highlight here that we have also cleaned the data removing outliers and unusual organisations whose presence would distort findings with respect to historical data. This includes the British Council, which is so large that its trends distort the sector, and Save the Children International, whose reorganization say its income rise by two orders of magnitude (see the appendices for more information). We do include Save the Children Fund (UK). This omissions do not change the representativeness of the sample, because the unusual qualities of these organisations means that they are not typical of the sector.
6
General Patterns in Income and Expenditure
1. The development NGO sector in England and Wales compared to the rest of the charitable sector.
In the England and Wales, charity begins at home. Of £68 billion spent by the charitable sector in England and Wales in 2015, £53 billion (78%) was spent by charities operating within the UK alone (Table 1). Only £2.9 billion was spent entirely overseas.
Development charities’ spending constituted less than 10% of all charitable expenditure. Some even appears to have been spent by organisations who operate only within the UK. This could reflect the work of organisations like BOND, or it could mean that the Charity Commission data may contain inaccuracies.
Note we cannot include data on Scottish organisations here as we could not access the appropriate data.
Table 1: The Geography of Charitable Expenditure in England and Wales
Remit
Expenditure 2015 All charities(£ Million)
% of all charities
2015
Expenditure 2015Dev NGOs(£ Million)
Only Within UK 53,238 78 242UK and Beyond 12,164 18 4,524Only Beyond UK 2,946 4 1,943Total 68,347 6,710
Source: Authors’ Analysis of Charity Commission Data
7
2. The growth of the number of organisations in the sector
Development NGO growth has been increasingly vigorous since the 1980s. The high point was the mid-2000s, with an apparent decline after the financial crisis of 2007/8 (2008 is marked in black in Figure 1). Numbers have increased by over 250 since 2005.
Figure 1: Establishment dates of development NGOs spending more than £10k in 2015
However, this decline in the establishment of new organisations is not indicative of a decline in the sector as a whole, as the graph above only portrays organisations spending more than £10k in 2014. It takes a few years for many organisations to reach this size. The lag is illustrated in the graph below for all UK charities. It shows new organisations being started vigorously in recent years but a steep decline in the organisations that were recently established and spending more than £10k in 2014.
Figure 2: Establishment trends of all UK charities
8

It is possible to object that our methods only selected the ‘survivor’ NGOs and that we miss out all the organisations which used to exist in the early years of our survey but have ceased to exist. This would mean that the apparent rise we have just described is in fact much reduced, because there were many more organisations in existence much earlier on, but which are excluded from our work.
We do not think this is likely. In part we have just not heard of many large organisations which have ceased to exist or merged. There are some (Merlin, Village Aid) but they are few. If there was such a high rate of attrition we suspect that the sector would already know about it.
In part it is possible to test for attrition using Charity Commission records for English and Welsh charities. We examined trends in the ‘Overseas Aid / Famine Relief Class’ of NGOs and found that the number of organisations in this class as a whole increased from just over 6,000 in 2004 to just over 11,000 in 2105 – an increase of 83%. Other charities, not in this category increased by only half that – 43%. We believe therefore that the change we have described above is real, and not a function of our methods.
3. The size of the sector and its unevenness
Development NGOs based in Britain are spending just under £7bn reported in 2015 (Table 2). This is equivalent to about half of total ODA expenditure by the British government. We use expenditure to explore the size of the sector and its structure, rather than income, because expenditure data reflects actual use of funds, and can be more even than income, which is prone to fluctuations from year to year.
These figures require some qualification. The largest organisation (the British Council) which spends more than £900million, receives considerable support from the UK government. Tens of millions are also contributed by DFID to development NGOs based in the UK through partnership agreements. The second largest, Save the Children International, with expenditure of over £600 million, includes funds raised from many international offices across the world. Finally, there is also some double-counting in these sums, in that organisations are funding each other. Save the Children UK contributed nearly £200 million to Save the Children International; the larger organisations also support each other.
Table 2: The size and structure of the sector: Expenditure in 2015
Size Class Expenditure Expenditure (%) Count Count (%)>100m 3,536,640,324 51 9 1>40m 1,460,125,042 21 19 2>10m 1,097,792,077 16 49 5>3m 458,080,664 7 76 9>1m 244,991,023 4 126 14>500k 97,214,275 1 126 14>100k 76,282,325 1 278 31>10k 10,757,322 0.2 208 23Total 6,981,883,053 891
9

Source: Authors’ Analysis of Charity Commission and OSCR Data. Note not all of the organisations on our lists submitted expenditure records for 2015.
Table 2 also demonstrates the substantial unevenness of the sector. The 77 largest organisations account for over 90% of expenditure. With over 800 organisations accounting for just 13% of expenditure. Moreover this distribution excludes the myriads of small NGOs spending less than £10k per year.
This distribution is well known to the sector and a sensitive issue. There is a feeling that too much money is concentrated amongst too few organisations, and that not enough goes to ‘frontline’ smaller organisations. There is also the view that larger organisations can deliver economies of scale, and that not all organisations need to be large to achieve their objectives.
We make no comment on the appropriateness or efficiency of this distribution. Our purpose in the first instance is to describe this difference in order that more interesting questions about the consequences of it can be formulated.
4. The Geography of the Sector
We identified five regions in the mainland UK – Scotland, the North and North Wales, South West England and South Wales, South East England (excluding London) and London. We located NGOs in these regions according to the postcode of their correspondence addresses in the Charity Commission records. Maps of the different distributions of NGOs are shown below.
Figure 3: Distribution of development NGOs in the mainland UK
As the maps suggest, London dominates the development NGO scene. Most of the largest organisations are found there (Table 3), and by far the most money is spent by organisations headquartered there (Table 4).
Table 3: The distribution of development organisations in the UK
Size Class London SE not London South West The North Scotland Total
10

>100m 7 2 9>40m 15 2 1 1 19>10m 30 7 2 6 4 49>3m 48 11 6 9 2 76>1m 69 27 10 15 5 126>500k 72 23 8 18 5 126>100k 110 59 36 48 26 278>10k 64 37 35 44 28 208Total 415 168 97 141 71 891
Table 4: Money spent in 2015 (in millions £) by development NGOs headquartered in different regions in the UK
Size Class London SE not London South West The North Scotland Total
>100m 2,927,735,195 608,905,129 3,536,640,324
>40m 1,140,777,720 153,504,251 112,522,405 53,320,666 1,460,125,042
>10m 664,175,065 145,269,349 35,809,524 144,196,276 108,341,863 1,097,792,077
>3m 286,631,529 64,563,117 35,840,646 53,446,017 17,599,356 458,080,664
>1m 133,916,951 52,516,245 18,573,716 30,954,807 9,029,304 244,991,023
>500k 56,024,188 16,238,721 6,201,543 14,158,980 4,590,843 97,214,275
>100k 33,426,820 15,539,775 8,031,920 12,229,019 7,054,792 76,282,325
>10k 3,564,301 1,743,706 1,884,127 2,336,643 1,228,545 10,757,322
Total 5,246,251,769 1,058,280,293 106,341,476 369,844,146 201,165,369 6,981,883,053
The basic pattern of this distribution is well known, but its precise quantification may not be. The concentration of funds into large NGOs that characterizes the sector is augmented by their spatial concentration in London and the South East. This adds a dimension of geographical inequality upon the known inequalities in the structure of the sector.
The general reasons for this distribution should be clear. London is where government, politicians and policy makers are found. It is where, as these tables show, most of the other development organisations can be found. London and the South East contain by far the highest concentrations of people, and particularly wealthy people. Its also the location of the most powerful, and wealthy businesses, from which funds are required.
11

4. Financial Changes in the Sector over Time
Our historical data come from two sources. For English and Welsh charities we have data from 2004-15, for Scottish charities from 2009-2015. We present both in the graphs and tables below, distinguishing them where necessary for the analysis. We have excluded from this section the organisations like the British Council and Save the Children International whose records are exceptional.
The most salient fact is that in terms of the number of organisations, and their income and expenditure, this sector is growing. There are no indications in these data that the sector has somehow peaked, or become full. Expenditure has increase 44% between 2009 and 2015. This increase in expenditure cannot be explained by the rise in number of organisation. The number of organisations has increased by only 30%, and these new organisations tend to be smaller and contribute relatively little to the sector’s overall growth.
Figure 4: The Growth of Development NGOs and Development NGO expenditure
Second, there has been growth across all size classes (Table 5). However growth has been strongest for the largest size classes. The increases to the smaller size classes, though apparently considerable, is in fact driven by the growth in their numbers, rather, as we shall see, by increases in their individual income.
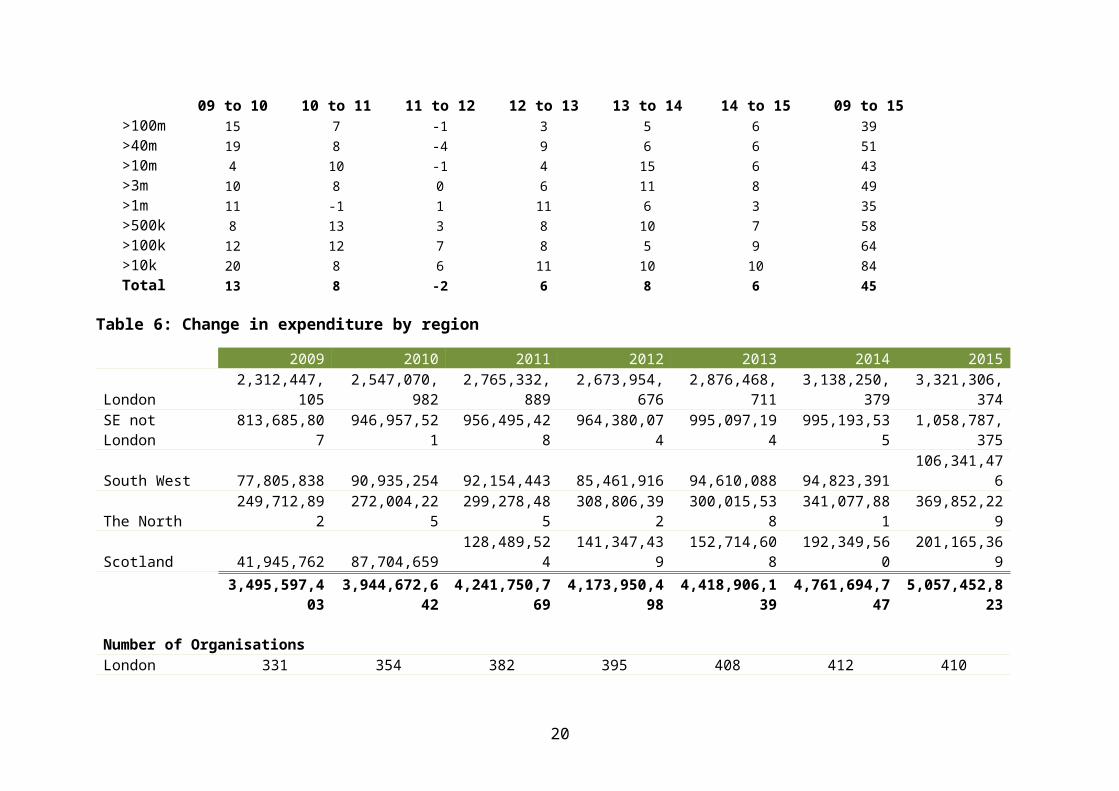
The regional pattern of growth is complicated (Table 6). London has seen the most new organisations (which are smaller and tend to grow more slowly), and also houses almost all the largest organisations (which grow faster). Scottish growth appears most vigorous, because it starts from a smaller base. Growth in expenditure is probably most vigorous in the North, where the number of organisations has grown by only 20%, but expenditure by nearly 50%, and this is comprised, generally speaking of relatively small organisations.
12

Table 5: Change in Expenditure per size class
2009 2010 2011 2012 2013 2014 2015>100m 1,199,296,348 1,373,942,636 1,468,682,985 1,455,016,451 1,505,831,611 1,575,089,696 1,671,035,697>40m 967,034,149 1,146,813,075 1,236,770,368 1,182,139,182 1,291,585,883 1,372,320,528 1,460,125,042>10m 726,981,475 759,540,142 833,545,560 825,279,572 854,838,378 980,525,766 1,038,712,864>3m 306,950,776 337,282,122 363,261,976 362,525,521 383,020,277 424,365,397 457,803,664>1m 181,234,842 201,560,327 198,584,387 201,030,382 223,838,522 237,511,967 244,991,023>500k 61,388,468 66,129,275 74,876,865 77,145,497 83,322,650 91,269,518 97,214,275>100k 46,851,217 52,373,032 58,428,703 62,781,992 67,552,576 70,762,024 76,789,407>10k 5,860,128 7,032,031 7,599,925 8,030,328 8,907,524 9,823,825 10,757,322Total 3,495,597,403 3,944,672,642 4,241,750,769 4,173,948,925 4,418,897,420 4,761,668,721 5,057,429,295
Number of Organisations>100m 6 6 6 6 6 6 6>40m 17 19 19 19 19 19 19>10m 44 45 45 45 45 47 47>3m 67 69 74 75 76 76 75>1m 112 116 121 124 126 127 126>500k 107 113 119 123 126 126 126>100k 206 237 263 270 281 283 279>10k 124 151 177 188 202 210 208Total 683 756 824 850 881 894 886
Percentage change in expenditure between consecutive years09 to 10 10 to 11 11 to 12 12 to 13 13 to 14 14 to 15 09 to 15
>100m 15 7 -1 3 5 6 39>40m 19 8 -4 9 6 6 51>10m 4 10 -1 4 15 6 43>3m 10 8 0 6 11 8 49>1m 11 -1 1 11 6 3 35>500k 8 13 3 8 10 7 58>100k 12 12 7 8 5 9 64>10k 20 8 6 11 10 10 84Total 13 8 -2 6 8 6 45
13

Table 6: Change in expenditure by region
2009 2010 2011 2012 2013 2014 2015London 2,312,447,105 2,547,070,982 2,765,332,889 2,673,954,676 2,876,468,711 3,138,250,379 3,321,306,374SE not London 813,685,807 946,957,521 956,495,428 964,380,074 995,097,194 995,193,535 1,058,787,375South West 77,805,838 90,935,254 92,154,443 85,461,916 94,610,088 94,823,391 106,341,476The North 249,712,892 272,004,225 299,278,485 308,806,392 300,015,538 341,077,881 369,852,229
Scotland 41,945,762 87,704,659 128,489,524 141,347,439 152,714,608 192,349,560 201,165,369
3,495,597,403 3,944,672,642 4,241,750,769 4,173,950,498 4,418,906,139 4,761,694,747 5,057,452,823
Number of OrganisationsLondon 331 354 382 395 408 412 410SE not London 142 152 158 164 167 169 168South West 77 83 89 90 95 99 97The North 117 121 128 132 139 141 142Scotland 16 46 67 70 74 75 71
Percentage change in expenditure between consecutive years09 to 10 10 to 11 11 to 12 12 to 13 13 to 14 14 to 15 09 to 15
London 10 9 -3 8 9 6 44SE not London 16 1 1 3 <0 6 30South West 17 1 -7 11 <0 12 37The North 9 10 3 -3 14 8 48Scotland 109 47 10 8 26 5 380
14

Changes to Sources of Income 2009-2014
1. Data available for Income Analysis
Of the NGOs described in the sector above, we have been able to collect data 580 organisations. These represent 65% of the organisations on our list and over 95% of its expenditure (Table 7). Our sample is representative of the regional dominance in that most come from London and the South East. In all regions however our sample accounts for well over 50% of the total expenditure. The number of organisations is relatively small in Scotland because it was not easy to obtain the necessary financial data at this stage. The size of the sample reported here means that this represents a substantially better analysis than any others previously available.
Table 7: Data Sources for Income Analysis
No NCVO Data Available NCVO Data Available
Size Class Count Expenditure Count Expenditure>100m 7 1,792,365,229>40m 18 1,368,251,679>10m 4 102,306,347 44 981,404,571>3m 4 30,279,929 73 424,546,535>1m 10 14,690,335 120 234,572,358>500k 34 27,286,310 90 68,257,902>100k 148 41,732,387 130 34,143,414>10k 116 5,403,366 98 5,814,721Total 316 221,698,674 580 4,909,356,408
No NCVO Data Available NCVO Data Available
Size Class Count Expenditure Count ExpenditureLondon 116 46,997,475 296 3,338,730,735SE not London 60 23,017,837 108 1,039,819,712South West 42 22,230,653 57 91,533,817The North 57 58,036,051 86 311,394,237Scotland 41 71,416,658 33 127,877,907Total 316 221,698,674 580 4,909,356,408
15

2. Sources of Income
On what sources do development NGOs rely? Table 8 shows that donations from the public are by far the most important source of funds, contributing nearly £10bn over 5 years and 40% of total income. It is unfortunately not possible to break the NCVO data down further to explore what sorts of public giving (such as high net worth, event based, standing order based) provides that income. Foundations and other NGOs, along with UK and overseas government provide the bulk of the rest of the income. Private companies support, relatively speaking a surprisingly small proportion of the sector’s income.
Table 8: Total income from different sources for Development NGOs 2009-2014
Souce Income ProportionPublic 9,957,213,870 40%Government 4,282,367,316 17%Non Profit Sector 3,945,836,738 16%Overseas Governments 3,810,253,394 15%Business Sector 1,656,798,867 7%Ind Govt Funded Bodies 813,363,064 3%Investments 157,594,768 0.6%Unclassified 104,629,824 0.4%National Lottery 87,096,933 0.4%Total 24,815,154,774
Note: Unclassified sources are small and will not be portrayed in further analyses. National Lottery income is also slight, but can be important for the smaller NGOs and so will still be included in some figures.
16

3. Change in Income Source over time
The rise in income we described earlier (Figure 4) has been accompanied by some slight diversification. Funding from the public, the main source, has risen over time, but declined in relative importance as it has not risen as much as funding from other NGOs, the UK Government and Overseas Governments (Figure 5B).
Figure 5: Changes in Funding by Source: A in pounds, B as a proportion
Note that panel A shows figures in real terms, with inflation accounted for.
17

This is increase is a considerable success for the sector. It replicates the findings of the earlier BOND report, which means that the strengths of the development sector are not confined to BOND members alone. At the same time it is important to note that the sector wide increases are not enjoyed by all organisations. As we shall see below, many can experience declines in income at the same time as the sector as a whole has improved its position.
While the rise in giving from the public is welcome, it is not entirely clear who that public might be. The increasing income from the public is interesting because the trend here does not follow the patterns of donations to overseas causes reported in the CAF surveys of giving in the UK (Figure 6). This may reflect problems with the CAF survey, except that it does involve thousands of people each year, who are visited repeatedly. It could mean that ‘the public’ which is surveyed by CAF is different from ‘the public’ which is giving to development NGOs. One possible explanation is that CAF surveys are a poor way of tracking donations from high net worth individuals. The giving reported in the CAF surveys are small, with median donations less than £20 per month. The rise in public giving to development causes may reflect the rise in wealthy public giving.
Figure 6: Proportion of the Public giving to overseas causes
Source: Diverse ‘UK Giving’ reports
Even more strangely, it appears that the income from the public is completely unrelated to the money available to most of the public. Figure 7 shows that public giving simply does not follow the trends of Real Household Disposable Income. Not only are the general tendencies different, but their peaks and troughs are opposed. This again suggests that the public who are giving to development NGOs are disposing of income which is not well captured by government measures of the general income available to most people. Again this points to more giving by high net worth individuals.
18

Figure 7: Changes in Giving from the Public to Development NGOs and Real Household Disposable Income available in the UK.
Source for RHDI: http://visual.ons.gov.uk/uk-perspectives-2016-personal-and-household-finances-in-the-uk/
19
4. The Distribution of Income Source by Size ClassGiven that resources are distributed so unevenly in the sector it is important to explore trends that affect different size classes of NGO. Table 9 shows how income sources vary across the sector.
Income from the public is particularly important for smaller organisations, rising from the sector norm of 40% to over 50%. Funding from other charities and foundations is also significant for smaller organisations. Other sources are comparatively smaller
Government funding is most important for organisations spending between £3 and £100 million. It is curiously small for the largest organisations.
Overseas Government funding features most significantly in the funding sources of the three largest size classes.
Corporate funding is relatively slight for the smaller organisations, and, curiously, those organisations in the second largest size bracket.
20
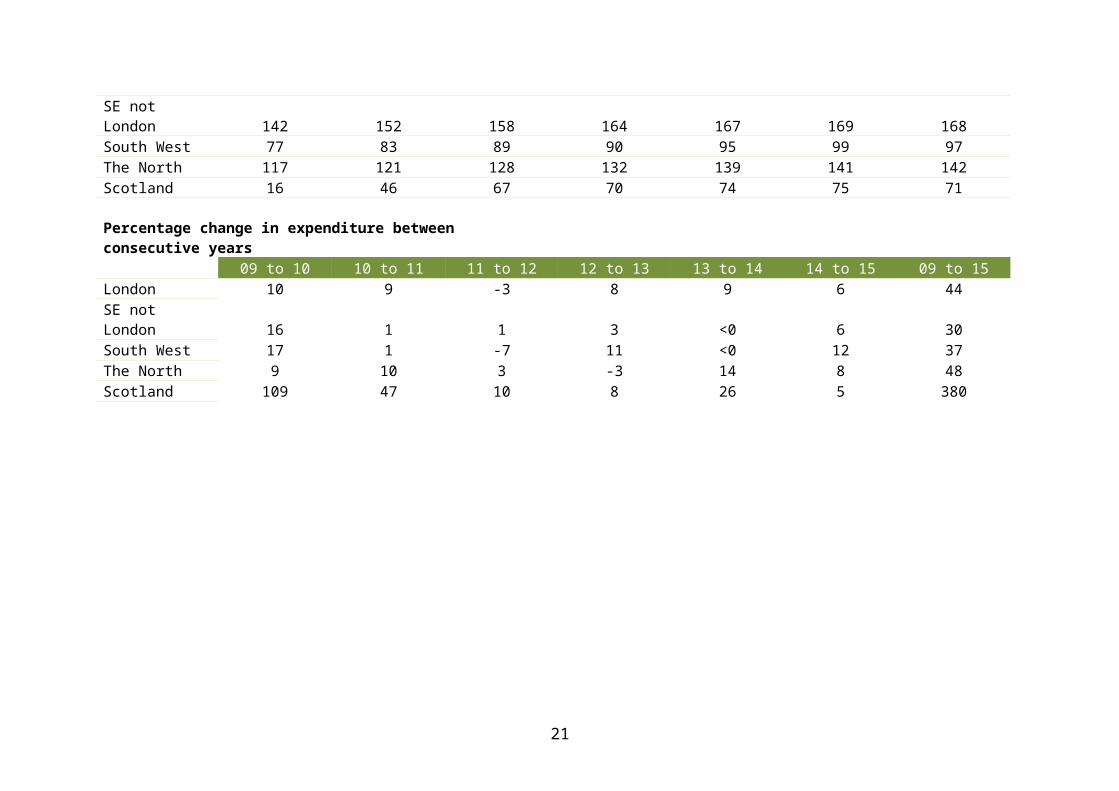
Table 9: Sources of income: Average contribution per size class 2009-2014
Panel A: Pounds (2015). Panel B: Relative importance source per size class. Yellow cells highlight important sources.
Size Class Public Government Non Profits O'seas Govt BusinessInd Gov F'd
Bods InvestmentsNational Lottery Total
1 >100m 3,516,632,374 1,027,075,978 1,424,620,488 1,357,440,906 760,742,278 616,479,975 35,781,347 11,803,634 8,750,576,981
2 >40m 2,960,044,980 1,457,758,962 906,293,106 1,287,749,144 231,044,367 92,998,913 21,735,995 16,366,455 6,973,991,921
3 >10m 1,563,239,857 1,133,478,349 932,843,667 871,691,265 310,119,367 53,178,260 32,465,874 23,997,078 4,921,013,716
4 >3m 1,021,351,747 462,900,223 319,970,762 179,843,736 221,141,802 34,726,609 18,129,376 14,888,748 2,272,953,004
5 >1m 583,366,708 154,705,441 200,092,322 87,861,909 102,624,008 12,841,758 37,583,628 9,696,869 1,188,772,643
6 >500k 180,166,139 31,562,305 86,366,249 20,935,346 17,893,564 2,501,087 8,181,088 6,027,444 353,633,223
7 >100k 115,996,832 13,795,538 68,599,255 4,705,132 12,775,398 447,019 3,306,157 4,150,829 223,776,159
8 >10k 20,256,469 1,097,203 6,871,693 25,957 1,084,117 189,443 413,465 165,299 30,103,647
Size Class Public Government Non Profits O'seas Govt BusinessInd Gov F'd Bods Investments
National Lottery Grand Total
1 >100m 40% 12% 16% 16% 9% 7% 0% 0%
2 >40m 42% 21% 13% 18% 3% 1% 0% 0%
3 >10m 32% 23% 19% 18% 6% 1% 1% 0%
4 >3m 45% 20% 14% 8% 10% 2% 1% 1%
5 >1m 49% 13% 17% 7% 9% 1% 3% 1%
6 >500k 51% 9% 24% 6% 5% 1% 2% 2%
7 >100k 52% 6% 31% 2% 6% 0% 1% 2%
8 >10k 67% 4% 23% 0% 4% 1% 1% 1%
21

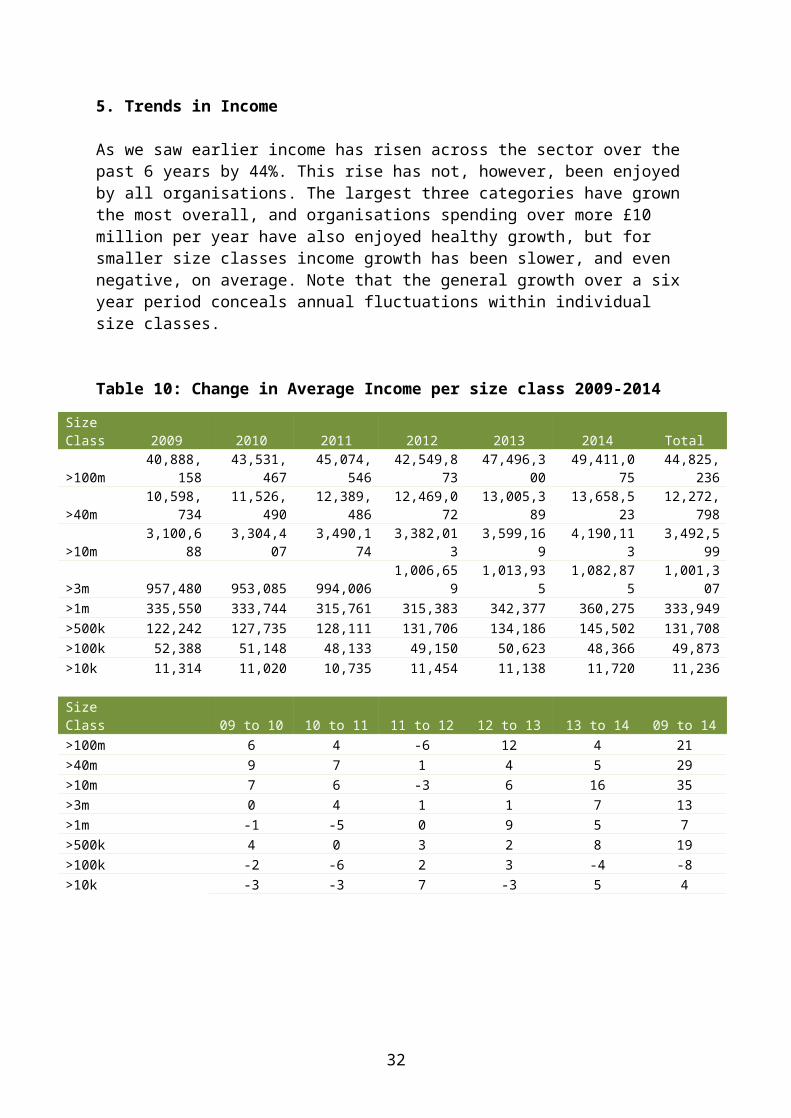
5. Trends in Income
As we saw earlier income has risen across the sector over the past 6 years by 44%. This rise has not, however, been enjoyed by all organisations. The largest three categories have grown the most overall, and organisations spending over more £10 million per year have also enjoyed healthy growth, but for smaller size classes income growth has been slower, and even negative, on average. Note that the general growth over a six year period conceals annual fluctuations within individual size classes.
Table 10: Change in Average Income per size class 2009-2014
Size Class 2009 2010 2011 2012 2013 2014 Total
>100m 40,888,158 43,531,467 45,074,546 42,549,873 47,496,300 49,411,075 44,825,236
>40m 10,598,734 11,526,490 12,389,486 12,469,072 13,005,389 13,658,523 12,272,798
>10m 3,100,688 3,304,407 3,490,174 3,382,013 3,599,169 4,190,113 3,492,599
>3m 957,480 953,085 994,006 1,006,659 1,013,935 1,082,875 1,001,307
>1m 335,550 333,744 315,761 315,383 342,377 360,275 333,949
>500k 122,242 127,735 128,111 131,706 134,186 145,502 131,708
>100k 52,388 51,148 48,133 49,150 50,623 48,366 49,873
>10k 11,314 11,020 10,735 11,454 11,138 11,720 11,236
Size Class 09 to 10 10 to 11 11 to 12 12 to 13 13 to 14 09 to 14
>100m 6 4 -6 12 4 21
>40m 9 7 1 4 5 29
>10m 7 6 -3 6 16 35
>3m 0 4 1 1 7 13
>1m -1 -5 0 9 5 7
>500k 4 0 3 2 8 19
>100k -2 -6 2 3 -4 -8
>10k -3 -3 7 -3 5 4
22

6. Change to sources of income for different size classes of NG0: has there been a fight for the ‘development pound’?
What could explain these trends in the growth of different size classes in the sector? What income sources are the larger organisations growing, and what are the smaller organisations losing? To answer these questions we need to examine trends in income source per sector, these are shown in the table below (Table 11).
First, with respect to income from the public, the driving force behind most of the change are the middle income NGOs, spending between £1 and £40 million. These have seen the greatest increases in income from the public, in relative and absolute terms. The two largest size classes, despite having a collective turnover which is double that of the next three size classes (3.2bn compared to 1.6bn) have not enjoyed the increased successes in fundraising from the public that their smaller siblings have seen. If, therefore, giving from the public does reflect the role of high net worth individuals then it might be the case that medium-sized organisations which can invest in fundraising, but which also can offer more of a niche appeal, may be better at targeting this group.
On the other hand it may reflect the fact that larger organisations are turning their attention elsewhere and seeking more funds from governments, foundations and businesses. In both these categories they have seen substantial increases in revenues, in relative and absolute terms. Small and medium sized organisations have been particularly unsuccessful in growing corporate income, as this has declined in relative and proportional terms. Foundations and non-profits have not sought to invest in the medium sized organisations (spending between £3 and £10 million).
One of the common notions that circulates in this field is that fund-raising is rivalrous – that the successes one organisation enjoys means that there is less money to be raised by other organisations. While this may be true over short time frames, we cannot find strong evidence for that here. But it does depend on what money you are talking about.
It is not obvious that there is any fight over ‘the public’s’ development pound. All organisations bar those in the second smallest category have seen average income from the public increase, and, in absolute terms, there is more money for all sizes of organisation. The public development pound is not evenly distributed however. It might be possible that the relatively small increases the larger organisations have seen reflects their crowded brand space – which would not handicap medium-sized organisations. Similarly the slight increases of the smallest organisations may reflect the fact that they can invest little in fundraising and so do little to attract public support. On the other hand the development pound of the UK Government, and corporate sector, is plainly directed at the largest organisations, while foundations and non-profits target the larger and smaller size classes. Thus, if fundraising is rivalrous then this is likely to be a problem only for specific types of organisation targeting particular types of funding.
23

Table 11: Change in Income from different sources for different size classes.
Size ClassMean Income per
organisation09 and 10
Mean Income per organisation
13 and 14
Change in Mean Income per
Organisation
Average Total Annual Income
09 & 10
Average Total Annual Income
13 & 14
Change in Average Total
Annual Income
Absolute Increase from09 10 to 13 14
Income from the Public>100m 92,553,166 95,292,422 3% 647,872,160 667,046,951 3% 19,174,790>40m 23,493,376 24,952,680 6% 422,880,769 449,148,247 6% 26,267,478>10m 5,574,314 6,904,843 24% 245,269,838 277,219,701 13% 31,949,863>3m 2,250,091 2,503,367 11% 153,006,158 174,914,564 14% 21,908,406>1m 805,153 893,957 11% 83,429,136 104,550,341 25% 21,121,206>500k 351,272 371,859 6% 27,968,495 31,724,122 13% 3,755,627>100k 149,831 134,668 -10% 15,284,626 16,385,685 7% 1,101,059>10k 40,455 40,916 1% 2,073,694 3,314,839 60% 1,241,145
Income from Non-Profits>100m 28,260,547 38,286,949 35% 197,823,832 268,008,641 35% 70,184,809>40m 6,646,269 10,015,096 51% 119,632,835 180,271,727 51% 60,638,892>10m 3,168,619 3,432,894 8% 139,419,228 139,983,050 0% 563,821>3m 731,281 718,382 -2% 49,727,124 50,275,292 1% 548,168>1m 282,557 352,901 25% 29,228,890 41,312,593 41% 12,083,703>500k 133,633 203,056 52% 10,692,379 17,325,413 62% 6,633,034>100k 68,642 74,840 9% 7,043,140 9,103,355 29% 2,060,215>10k 11,150 14,389 29% 587,742 1,164,500 98% 576,758
Income from the UK Government>100m 20,095,317 37,296,070 86% 140,667,222 261,072,488 86% 120,405,266>40m 11,972,294 15,846,209 32% 215,501,286 285,231,766 32% 69,730,480>10m 3,766,722 5,042,449 34% 165,735,770 201,941,241 22% 36,205,471>3m 704,289 1,088,914 55% 47,891,647 76,061,071 59% 28,169,424>1m 242,638 253,767 5% 25,095,305 29,672,134 18% 4,576,829>500k 69,828 78,602 13% 5,547,315 6,703,287 21% 1,155,972>100k 14,796 17,865 21% 1,542,236 2,168,922 41% 626,685>10k 3,356 1,865 -44% 172,951 151,052 -13% (21,900)
Income from Businesses>100m 19,880,724 20,125,106 1% 139,165,068 140,875,741 1% 1,710,673>40m 1,510,557 3,651,629 142% 27,190,032 65,729,314 142% 38,539,282>10m 1,484,160 1,150,631 -22% 65,303,046 46,312,720 -29% (18,990,326)>3m 666,537 406,799 -39% 45,324,505 28,516,966 -37% (16,807,539)>1m 178,236 119,704 -33% 18,399,754 14,004,073 -24% (4,395,681)>500k 35,336 31,103 -12% 2,769,347 2,662,822 -4% (106,525)>100k 17,896 13,530 -24% 1,846,682 1,652,526 -11% (194,155)>10k 3,143 1,964 -38% 175,188 158,786 -9% (16,402)
24

7. Variations in Income by Region
It is difficult to understand how geography and regional location affect sources of income in part because differences in location are conflated with differences in size class – all the largest organisations are head-quartered in London and the South East. It is also difficult as geography does not necessarily constrain fundraising activity, because fundraisers are able to appeal to diverse and disparate publics scattered over many locales.
Spatial variation in sources of income are shown in Table 12, below. London and the South East generate a higher proportion of their revenues from businesses than do other regions. This maybe because there is more money in businesses to give away. Thus locating in or near London makes sense because it gives better access to corporate finance. On the other hand this may just reflect the fact that larger NGOs are better at accessing funds from businesses and are also more likely to be based in London and the South East.
Scotland stands out for having a relatively small proportion of its income derived from public sources and more from governments (UK and Overseas). However the universe of organisations is small here and this may reflect the influence of one or two larger entities. It may also reflect the fact that increased Scottish Government funding, since the beginning of the Scottish Government’s international development strategy in 2005, has made available more government resources to the small number of NGOs we have included in our sample. Public funding would remain important for other Scottish development NGOs.
We looked for regional trends in the sources of income, but were not able to discern any that merited reporting in these data. The strong growth we reported from the North appears to have been driven by revenues from public sources, which increased by some £30 million.
25

Table 12: Sources of income per region – average per source
Region Public O'seas Govt Non ProfitsInd Gov F'd
Bods Govt Business TotalLondon 6,514,819,933 2,459,563,148 2,184,772,492 791,274,556 3,179,344,975 1,141,259,169 16,483,922,677SE not London 2,441,086,501 921,115,668 1,159,536,618 9,100,809 548,813,062 476,332,755 5,618,329,199South West 189,630,229 73,667,263 90,047,942 819,645 52,367,456 17,851,786 439,849,541The North 655,585,814 186,541,485 455,557,482 11,983,707 348,766,782 19,103,666 1,729,089,353Scotland 156,091,393 169,365,830 55,922,205 184,347 153,075,041 2,251,490 543,964,003
London 40% 15% 13% 5% 19% 7%SE not London 43% 16% 21% 0% 10% 8%South West 43% 17% 20% 0% 12% 4%The North 38% 11% 26% 1% 20% 1%Scotland 29% 31% 10% 0% 28% 0%
26

8. The costs of fund-raising
A. How much should organisations spend on fundraising?
The amount of money charities spend on fundraising is a sensitive issue. We observe two schools of thought in the charitable sector about fundraising. One group sees fundraising costs as an embarrassment to be minimized as far as possible or better eliminated. Charity work here is synonymous with voluntarism, with giving freely and not counting the cost. Their measure of success is keeping the sector’s own costs should be as small as possible. The ideal fund raising ratio is infinity.
Another group measures success by the change achieved, and is prepared to pay to achieve those goals. This recognizes that the smallest possible expenditure on fundraising does not always yield the best results. In fact the opposite is true in that, in most walks of life, spending more than the minimum results in excellence in companies, Universities, sports teams, armies, hospitals, schools etc etc. Good charity is not cheap. Good charity is worth paying for. Cheap charity is not by definition good, it is just cheap.
This school believes that fundraising success is not measured by its costs; it is strategic, tailored to specific goals. Fundraisers’ success is measured in meeting income targets, which are determined by operational criteria. If returns per pound spent decline as costs rise, then this will not be a problem if the revenue targets are met. If £1 million is required for new hospital equipment then it is better to reach that target by spending £500,000 than to miss it and merely raise £50,000 from an expenditure of £200.
These two schools of thought are different, but they could compatibly co-exist in one sector:
The ‘voluntarists’ are found in smaller organisations where part of the ethos is to take part freely. The happiness and satisfaction of the volunteers is one of the criteria of success. Additionally it could include organisations who are too small to apply the accounting procedures that could properly account for fundraising costs. These organisations will look like voluntarists, without necessarily believing that it is the right course of action.
The ‘revenue strategists’ are more likely to be found in larger organisations which are trying to achieve, or catalyse, significant change at scale. For these organisations the well-being of volunteers in the UK is less important than the interests of partners with whom they work in development contexts.
We will see in the data below that both schools of thought are clearly present. However we are unable to explore success according to the criteria preferred by revenue strategists, as their measure (income raised compared to income needed) is not available in these data. We therefore use fundraising ratio (ie return on investment) but do not do so because it is the correct measure to use, just the only measure available.
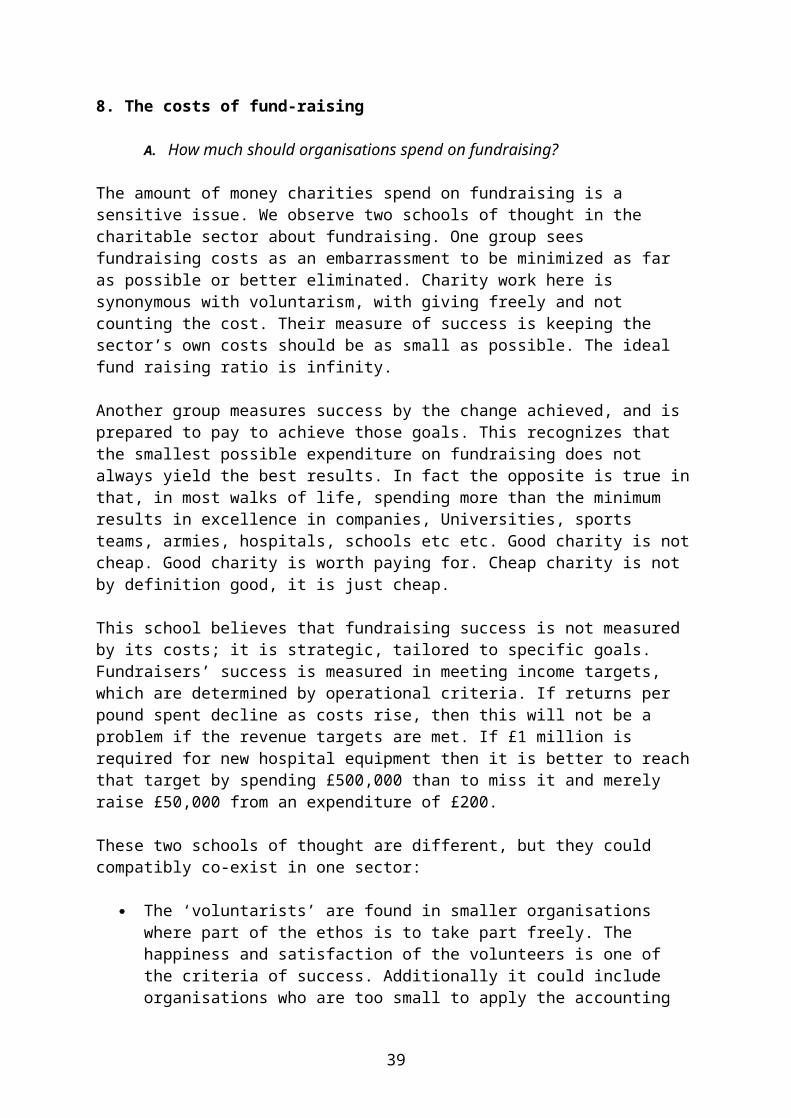
The dual approach to fundraising, the voluntarists and the revenue strategists, becomes clear if one compares money invested in fundraising (as a proportion of last year’s income) against money raised by it (fundraising ratio for this year’s income). This
27

demonstrates the classic inverted ‘J’ (Figure 8). The figures on the left hand side of the graph where returns exceed 10:1, and often substantially so, are from those organisations which are minimizing fundraising costs. Those on the right hand side, spending more than 15% of their income on fundraising, are taking a less voluntaristic approach to counting the cost of fundraising. Instead they are investing a significant proportion of their income in fundraising. As they are taking fundraising seriously, and invest a higher proportion of the organisation’s resources into it, it is unsurprising that they count its costs more carefully (and accurately) and produce a higher quantity of return.
Note that it is not appropriate to conclude from this graph that the organisations on the left hand side of the graph are more successful because they are more efficient and can raise money more cheaply. That thinking applies a voluntarist interpretation to fundraising which may be entirely inappropriate. The appropriate measure of success may be how much money is needed, not how efficiently it is raised. As we will show below, larger organisations need more money which they gain while achieving respectable fundraising ratios in the process. Another way of putting this point is that either fundraising strategy – those on the left of the graph and those on the right – can be advisable depending on the type of organisation and its needs.
Figure 8: Investment in fundraising and the fundraising ratio (N = 1894)
This graph does not include organisations spending nothing on fundraising and excludes outliers.
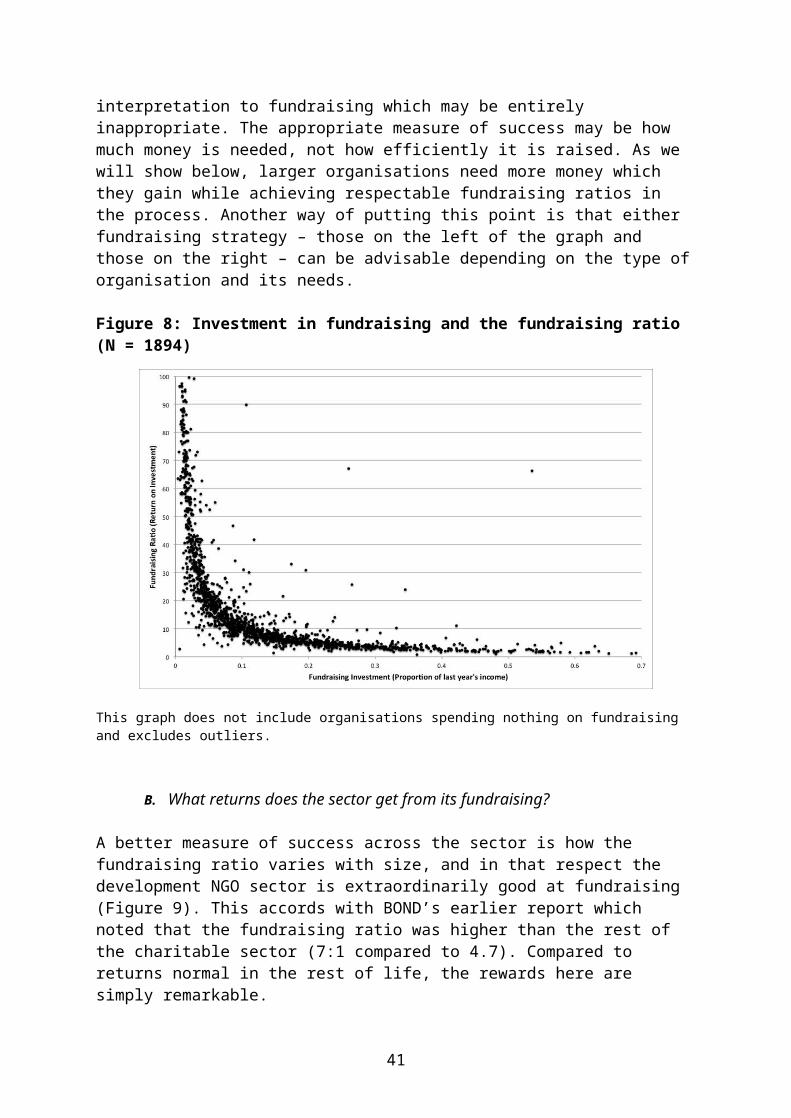
B. What returns does the sector get from its fundraising?
A better measure of success across the sector is how the fundraising ratio varies with size, and in that respect the development NGO sector is extraordinarily good at fundraising (Figure 9). This accords with BOND’s earlier report which noted that the fundraising ratio was higher than the rest of the charitable sector (7:1 compared to 4.7). Compared to returns normal in the rest of life, the rewards here are simply remarkable.
28

Figure 9: Total funds raised and money spent on fundraising per organisation for UK based development NGOs 2009-2014 (N = 2402)
The red line indicates a fundraising ratio of 1:1; dark pink 2:1; light pink 5:1; blue 10:1.
Rates of returns diminish as more money is spent (Figure 10). This is to be expected given the size of the operations involved. Returns are also highly variable, with a range of about two orders of magnitude between expenditures of £10,000 and £500k. Note the implausibly high returns on the left hand side of both graphs on this page. This is likely to reflect the influence of voluntarist organisations.
Figure 10: Fundraising Ratios (RoI) of Development NGOs in the UK 2009-2014 (N=2402)
C. Variations in fundraising by region and size class
29

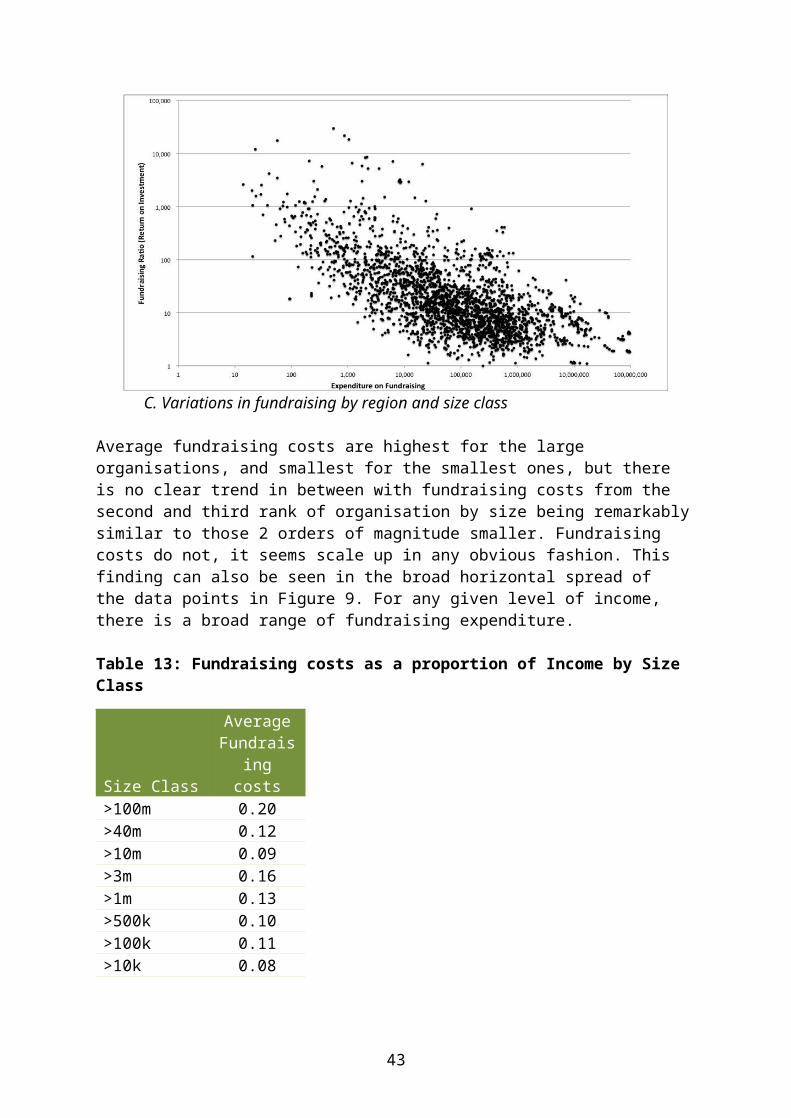
Average fundraising costs are highest for the large organisations, and smallest for the smallest ones, but there is no clear trend in between with fundraising costs from the second and third rank of organisation by size being remarkably similar to those 2 orders of magnitude smaller. Fundraising costs do not, it seems scale up in any obvious fashion. This finding can also be seen in the broad horizontal spread of the data points in Figure 9. For any given level of income, there is a broad range of fundraising expenditure.
Table 13: Fundraising costs as a proportion of Income by Size Class
Size Class
Average Fundraising
costs>100m 0.20>40m 0.12>10m 0.09>3m 0.16>1m 0.13>500k 0.10>100k 0.11>10k 0.08
Nor is there any obvious pattern in the geographical distribution of costs, except that in Scotland expenditure on fundraising appears to be rather low. This is not due to any particular concentration of smaller organisations in that region. Indeed some of the largest Scottish organisations there spend the least on fundraising.
Table 14: Fundraising costs as a proportion of Income by Region
Region
Average Fundraising
costsLondon 0.13SE not London 0.12South West 0.10The North 0.11Scotland 0.06
30

C. What about organisations that spend nothing on fundraising?
One of the peculiarities of these data is that there appear to be a large number of organisations who spend nothing on fundraising. It is possible to imagine some circumstances where this could be true (such as organisations how enjoy substantial endowments). But we do not think that this is actually occurring on the scale we have found in these data. For a surprisingly large number of years a number of organisations reported putting no resources in fundraising costs – no staff time, no publicity, no events, no appeals, no advertising etc (Table 15 below). What is more, during the six period these organisations, while spending nothing at all, were able to raise more than £1.4 billion (!). The only thing other thing in the world of which we are aware that earns as much money, while being so inactive, is the nice side of some of the world’s more prominent politicians. This whole scenario seems implausible to us, but nonetheless it is valuable as it makes it possible to indulge in a thought experiment. What would happen to those organisations if they set out to invest in fundraising in order to grow their income?
Table 15: Years with and without fundraising costs
Size ClassYears without
costsYears with
costs Total>100m 42 42>40m 2 105 107>10m 27 230 257>3m 84 336 420>1m 99 569 668>500k 113 387 500>100k 193 500 693>10k 190 233 423Total 708 2,402 3,110
We can use these years of no fundraising costs to model the possibilities of choosing to invest in fund-raising using the practices and returns which are general to the sector, in addition to their own free activities. There are obvious caveats and cautions for this exercise: investment in fundraising does not necessarily yield returns. Nevertheless it generally does and the figures that follow are useful ball parks.
To construct this model we separated the income of NGOs which were not paying for fundraising into size classes. For each size class we took the portion of income that was standard for fundraising that group, and ‘invested’ it, applying reduced versions of the fundraising ratios that are standard for each size class. We invested the extra returns from each year into more fundraising using the same principles.
The results were surprising and are summarized in Figure 11. This model suggests that these organisations could have raised over £2 billion during this period, ie an additional £640 million pounds. Or, to put this polemically, these NGOs are losing up to one third of their potential income by failing to invest in fundraising.
31
A critic would object that fundraising cannot be so elastic, there are ceilings to the amount that can be raised and organisations may well end up competing for the same pounds, rather than new income. But, as the data we have presented earlier show, if these barriers of limited public support were to be reached, then they would do so for the first time. There is no evidence of funding available from the public declining or reaching such limits. Meanwhile income from other sources has been growing. The sector has been growing its income and it is likely that organisations which have invested in fundraising have fuelled that growth.
Does the development NGO sector need this ‘extra’ money, if indeed it does exist? It is possible that it does not. This would be the case for voluntarist organisations who exist, in part, not to count the costs, and certainly not the opportunity costs, of their activities. Alternatively this might apply where revenue strategists are already raising enough for their needs. Our suspicion, however, is that these revenues could be usefully used by development organisations and there is a case for taking the opportunity costs of not fund-raising more seriously.
Figure 11: Comparing income with different scenarios of fundraising investment
This graph assumes that returns on investment in fundraising will be 10% of the standard for the sector in the first year, 30% in the second year, 50% in the third, 70% in the fourth and only reach normal levels in the fifth year.
32

Conclusion
In the first instance we need to return to the premise upon which we beganThis report is a study of UK-based development NGOs as a sector, a collective. It only makes sense to do so if these organisations can be grouped together as we have done. In reflecting on whether this report and approach is at all useful it is important to ask how good the list is that we have constructed – what does it miss out? We must also consider how it is constructed and internally constituted – what divisions and differences within this sector make it difficult to talk about the sector as a whole?
If it is the case that in fact all organisations we have amalgamated are somehow different then generalization and analyses of collectives that we have attempted here will be impossible. If there are commonalities then we need to consider then what they might be? Is ‘international development’ too broad a moniker? Would we be better thinking up smaller issues, or areas of interest, or regions of operation? Answering these questions will help development NGOs to determine to what extent they are able to learn from this sort of research project, and what questions they would like it next to address.
We believe that generalisations we have produced are useful in part because so many of the organisations upon which we have reported see themselves as part of a collective. The main source for our data has been different already-existing collectives, which share similar purposes. We have simply joined them together.
Having done so we were surprised by what we found. We knew that the sector was unequal in terms of its command of resources, but not as unequal as we found it to be, nor so dramatically concentrated on London.
We were also surprised by the growth in numbers, income and expenditure that our data showed. Our understanding of the general mood music was that support for international development was waning and we expected the figures to show that. The growth in public support surprised us, as did the evidence which suggests that there may be further room to grow, despite the apparent rivalry.
There is something rather remarkable about the development NGO sector as we have described it here. In the face of static or declining publicly-available funds it grows financial returns from the public. In an era of Brexit, growing insularism, anxiety about refugees and pressure on the Aid budget, the number of charities which work on famine relief and overseas poverty increases at double the rate of other charities. Perhaps this is not a sector which should be understood in terms of what average Britons think or believe, or even dominant political discourses. Perhaps this is the outpouring of a rather deep vein of cosmopolitanism and concern for distant strangers that runs deep in such a significant minority of people that the creativity and resources of that minority are yet to be exhausted. Perhaps the sector, by virtue of its growth and vigour, creates the very markets and audiences that it seeks funding and support from.
We do not think that this growth, vigour and flourishing is necessarily always a good thing in itself. The relationship between NGOs and good development outcomes is a complicated one. In some of our other work we have in fact spent considerable time
33

demonstrating that NGO activity produces at best indifferent outcomes, and at worst disempowerment and immiseration. Growth in development NGOs could result in more development failures. But we also serve NGOs as board members and trustees, or have worked for development NGOs professionally, and continue to advise and engage with them. We believe that this is a sector which could produce a great deal of beneficial change.
For that reason, welcome as this overview has been, we are a little dissatisfied with results so far. We feel there is much more to be learnt by exploring further which regions of the world the sector works in, on what activities and with what sorts of partnerships. We feel there is much more to be learnt about the changing patterns in giving and fundraising activities. We look forward to the next set of activities that can now begin, using this database, to explore patterns and trends within the sector, the better to understand what makes drives the most effective pursuit of social justice and egalitarian societies.
34

Acknowledgements
This project would have been impossible without the support, hardwork and consideration of a large number of colleagues. In particular we want to thank Laura Dempsey, Samah Ibrahim and Sarah Illingworth for their tireless and good humoured data entry. David Hulme, Mark Waddington, Andrew Kingman and Milagre Nvunga provided numerous intellectual challenges and practical objections. Mike Wright at BOND, Jane Salmonson at the Scotland’s International Development Alliance and Marc Lawson at the NCVO have also offered advice and support, variously contacting members, providing data and commenting on findings. Many other academics and NGO professionals have volunteered their time and wisdom in ways we cannot properly record.
We gratefully acknowledge the support of the University of Sheffield SPIKE team and the ESRC Future Leaders award to Nicola Banks (ES/K009729/1).
All mistakes are our own.
35

Methodological Annexes
1. NCVO Data
The Civil Society Almanac data is a stratified random sample of NGOs as shown in Table 16 below.
Table 16: The Constitution of the Civil Society Almanac
2014/15 Micro Small Medium Large Major Super-major TotalGeneral Charities 67,803 48,674 19,250 4,141 551 41 140,460Sample 57 1222 2816 3207 494 41 7,837Sample ( of general charities) 0.1 2.5 14.6 77.4 89.7 100 5.6
Source: This webpage
Each entry for each NGO each year contains the records of two financial years. The ‘current year’ ie the present financial year, and the ‘previous year’ that preceded it. If an organisation was present in the sampled in the financial years 2011-12 and 2013-14, but missing in the intervening year, then the absence can be rectified using the ‘previous year’ data for 2013-14.
In our calculations we have used ‘previous year’ data where no other data were available, and ‘current year’ data wherever possible.
NCVO data are presented in financial years which run from 1st May until 30th April. However few organisations actually present their data in this format. To cope with this the NCVO has simply allocated an organisation’s data to its own predetermined financial years according to the last date of the organisation’s own financial year. So if an organisation’s financial year finished on May 31st 2014, then those data are attributed to the financial year May 1st 2014 – April 30th 2015. In other words, they are attributed to the wrong financial year.
With respect to the financial year problem, we have used each organisation’s actual financial years to construct calendar years.
36

2. NCVO income categoriesThe NCVO collect income data from charities based on a complex series of categorisations of the different ways of raising money. We have reproduced the graphic which explains what these categorisations mean below. We have show below that in the table, the ways in which we have amalgamated NCVO data to produce our classifications.
Figure 12: The Meaning of NCVO classifications
Source: https://data.ncvo.org.uk/a/almanac16/income-sources/
37

Table 17: The Amalgamations of NCVO classifications
The bold headings represent those used in the analysis for this document. Underneath each are the NCVO headings and codings as presented in their data.
Business SectorGenerating Funds: Business Sector IG300IR, charitiable activities: Business Sector IC300Voluntary income: Business Sector IV300
Fundraising ExpenditureExpenditure: cost of voluntary incomeExpenditure: fundraising and pubExpenditure: investment managementExpenditure: trading subsidiary
GovernmentGenerating Funds: Central Governmment IG110Generating Funds: Devolved Government IG180Generating funds: Government Sector IG100Generating Funds: Local Government IG121Generating funds: Regional Government IG125Generating funds: Town and Parish Councils IG132IR, charitiable activities: Central Government IC110IR, charitiable activities: Devolved Governments IC180IR, charitiable activities: Government Sector IC100IR, charitiable activities: Local Government IC121IR, charitiable activities: Regional Government IC125IR, charitiable activities: Town and Parish Councils IC132Voluntary income: Central Government IV110Voluntary income: Devolved Governments IV180Voluntary income: Government Sector IV100Voluntary income: Local Government IV121Voluntary income: Regional Government IV125Voluntray income: Town & Parish Councils IV132
Independent Government Funded BodiesGenerating Funds: Arts Council IG175Generating Funds: NHS Trusts IG140Generating Funds: Public Corporations IG171IR, charitiable activities: NHS Trusts IC140IR, charitiable activities: Public Corporations IC171IR, charitiable activities: Universities IC175Voluntary income: Arts Council IV172Voluntary income: Universities IV175Voluntray income: NHS Trust IV140Voluntray income: Public Corporations IV171
InvestmentsInvestments IGI
National LotteryVoluntray income: National Lottery IV200
Non Profit SectorGenerating Funds: Nonprofit Sector IG500
38
Generating Funds: Trading Subsidaries IG330IR, charitiable activities: Nonprofit sector IC500Voluntary income: Nonprofit Sector IV500
Overseas GovernmentsGenerating Funds: European Government IG161Generating Funds: Foreign Governments IG163Generating Funds: International Government Agencies IG162IR, charitiable activities: European Government IC161IR, charitiable activities: Foreign Governments IC163IR, charitiable activities: International Government Agencies IC162Voluntary income: European Government IV161Voluntary income: International Government Agencies IV162Voluntray income: Foreign Government IV163
PublicGenerating Funds: General Public IG600IR, charitiable activities: General Public IC600Voluntary income: General Public IV600Voluntary income: Legacies IV620
unclassifiedIncoming resources unclassified I-unclassifiedOther income IO
3. Correction for Inflation All the figures presented in this report, unless otherwise stated, have been corrected for inflation and report figures in pounds as valued in 2015. We have done so using the procedures described on this page.
Year Constant
20041.2368430
82
20051.2047902
46
20061.1702476
24
20071.1412007
71
20081.1096316
02
20091.0930753
68
20101.0764842
03
20111.0552530
5
20121.0392849
72
20131.0198566
08
39

20141.0033411
262015 1
1
40
4. Excluded OrganisationsNote that, although data are available for them, we have excluded a number of organisations as they constitute outliers which distort underlying patterns either to the data as a whole or to their size classes.
These are:
1. The British Council, which is by far the largest organisation, appears to be raising extraordinary sums from the Public. Including those figures in the tables distorts the sector.
2. STC International has restructured its operations such that sums from different Save offices globally are now sent to its London operations. This appears to produce a massive leap in donations from the non-profit sector which again distorts the sectoral pattern.
3. Amnesty has done the opposite from STC, sending money to overseas based affiliates. This distorts data for organisations of its size class.
4. The Children’s Investment Fund Foundation derives huge revenues from its investments, having received a large donation from the private sector, which would again have a distorting effect, particularly on organisations of its size class.
5. The Fia Foundation for the Automobile and Society, Salvation Army International Trust and Diana Princess of Wales Memorial Fund all demonstrate unusually high investment income for their size classes. The former two count for nearly 60 of all investment income in their size class. The Salvation Army also accounts for 17 of all non-profit sector income in its size class.
The relevant figures are presented in Table 18 below. Table 19 provides a complete breakdown by region and size class of the data available.
41

Table 18: Income details for excluded organisations
Org’nBusiness
Sector Gov’tInd Govt
F’d Bodies InvestmentsNatLot
Non Profit Sector
Overseas Govts Public unclassified Total
Amnesty Int
2009-10 - 917,724 - 99,800 - 25,174,484 - 18,930,492 - 45,122,500
2010-11 - 1,630,779 - 12,790 - 14,918,963 - 19,483,013 - 36,045,545
2011-12 - 1,659,921 - 6,284 - 2,470,508 - 17,063,154 - 21,199,867
2012-13 - 1,493,907 - 5,148 - 132,815 - 10,213,342 - 11,845,212
2013-14 - 716,212 - 3,035 - 160,844 - 3,307,928 - 4,188,019
STC Int
2009-10 6,172,691 - - 38,376 - 7,218,164 - 2,509 - 13,431,740
2010-11 14,925 - - 4,931 - 12,214,589 - 8,338,842 - 20,573,288
2011-12 14,066,470 - - 12,772 - - - 66,498,806 1 80,578,050
2012-13 22,916,187 - - 99,275 - 257,726,985 - 197,122 34,227 280,973,795
2013-14 7,013,743 - - 169,999 - 743,382,270 - 471,648 62,055 751,099,714
The Brit Coun’l
2009-10 - 1,186,629,759 - 4,422,647 - - - 272,699,536 - 1,463,751,942
2010-11 - 1,185,072,176 - 4,238,960 - - - 299,751,036 2,647,618 1,491,709,789
2011-12 - 710,778,336 - 5,501,304 - 1,990,858 - 773,316,005 7,542,431 1,499,128,935
2012-13 - 693,064,843 - 5,994,161 - 3,440,826 - 852,239,576 9,993,014 1,564,732,421
2013-14 - 702,066,811 - 5,663,942 - 2,313,527 31,360 949,083,069 5,506,133 1,664,664,840
CIFF
2009-10 557,895,523 3,710,330 - 40,572,484 - - - - - 602,178,337
2010-11 - - - 54,503,226 - - - 52,081,417 - 106,584,643
2011-12 - - - 55,519,919 - - - 49,399,679 - 104,919,599
2012-13 - - - 120,905,587 - - - 40,899,700 - 161,805,286
2013-14 - - - 180,646,591 - - - 25,215,529 - 205,862,121
Sal Arm IT
42
2009-10 - - - 6,246,162 - 55,443,095 633,511 2,654,456 1,041,389 66,018,613
2010-11 - - 374,120 3,650,600 - 57,793,529 - 7,311,859 1,620,120 70,750,228
2011-12 - - 256,581 3,956,582 - 59,138,234 - 7,561,282 3,759,696 74,672,375
2012-13 - - 82,366 5,738,828 - 57,500,499 - 6,057,995 3,572,611 72,952,297
2013-14 - 2,037,360 - 5,554,689 - 68,550,997 - 1,055,098 - 77,198,144
Fia FAST
2009-10 34,834,644 - - 16,625,020 - - - 452,458 (1) 51,912,121
2010-11 - 50,145 - 13,001,596 - 64,471 830,240 232,301 1 14,178,754
2011-12 - 366,568 19,393 11,444,554 - 161,722 1,387,521 325,803 (1) 13,705,561
2012-13 236,801 251,215 2,059 14,584,900 - 585,826 679,517 719,670 - 17,059,988
2013-14 488,787 691,152 - 12,827,646 - 73,178 143,914 241,832 1 14,466,510
DPWMF
2009-10 536,966 - - 2,552,487 - - - 374,249 - 3,463,702
2011-12 280,668 - - 525,729 - - - 471,271 - 1,277,668
43
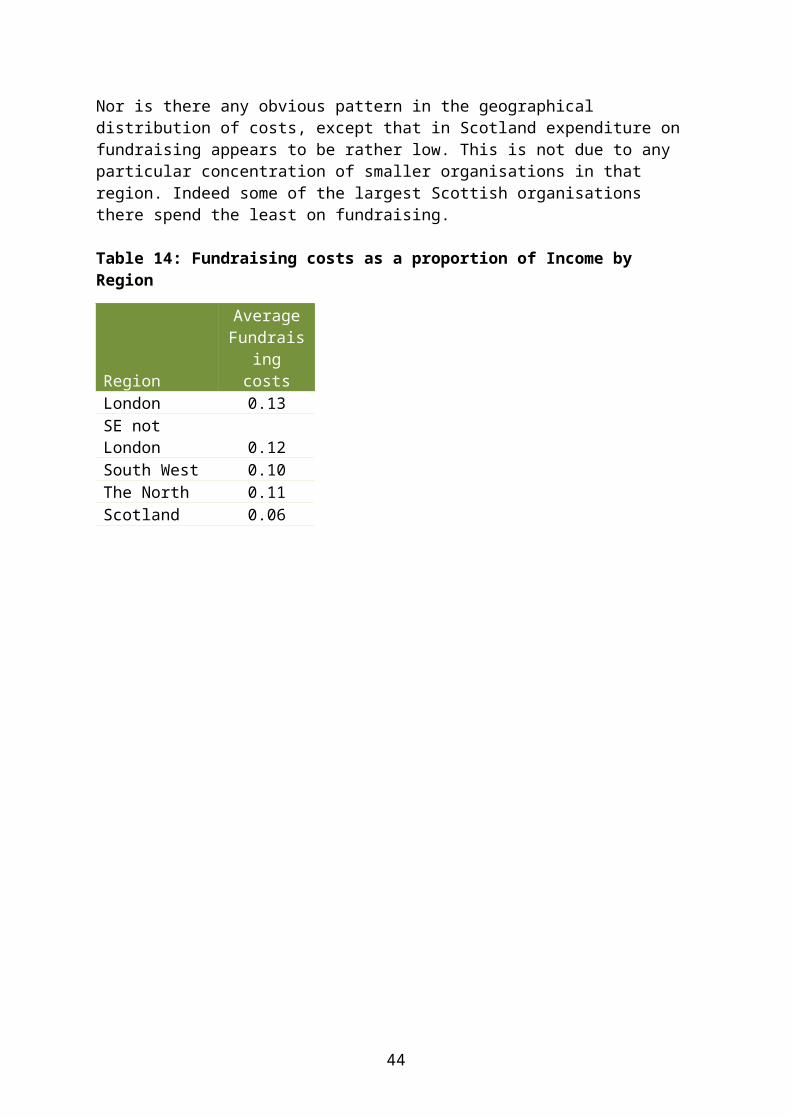
Table 19: A breakdown of available and unavailable NCVO data by size and region
Category No NCVO Data NCVO Data AvailableLondon
>100m 5>40m 14>10m 28>3m 1 47>1m 3 69>500k 17 53>100k 60 46>10k 35 34
London Total 116 296SE not London
>100m 2>40m 2>10m 7>3m 1 10>1m 2 27>500k 6 17>100k 31 26>10k 20 17
SE not London Total 60 108South West
>10m 1 2>3m 5>1m 3 7>500k 1 7>100k 18 21>10k 19 15
South West Total 42 57The North
>40m 1>10m 1 5>3m 2 9>1m 1 13>500k 6 12>100k 23 25>10k 24 21
The North Total 57 86Scotland
>40m 1>10m 2 2>3m 2>1m 1 4>500k 4 1>100k 16 12>10k 18 11
Scotland Total 41 33Total 316 580
44