introduction to wind energy systems -...
TRANSCRIPT

Introduction to Wind Energy Systems
Dr. Ali M. Eltamaly
King Saud University

Agenda
Historical Development of WT
Current Status and Future Prospects of Wind
Energy
Types of Wind Turbine Generators (WT)
Orientation of WT
Sizes and Applications of WT
Components of WT
Wind Power Calculations

Historical Development
The Babylonian emperor Hammurabi planned to use wind power for
his ambitious irrigation project during seventeenth century B.C.
The wind wheel of the Greek engineer Heron of Alexandria in the
1st century AD is the earliest known instance of using a wind-
driven wheel to power a machine
Wind-driven wheel was the prayer wheel, which was used in
ancient Tibet and China since the 4th century
Wind has been used by people for over 3000 years for grinding grain, sailboats, and pumping water Windmills were an important part of life for many communities beginning around 1200 BC.
Wind was first used for electricity generation in the late 19th century.
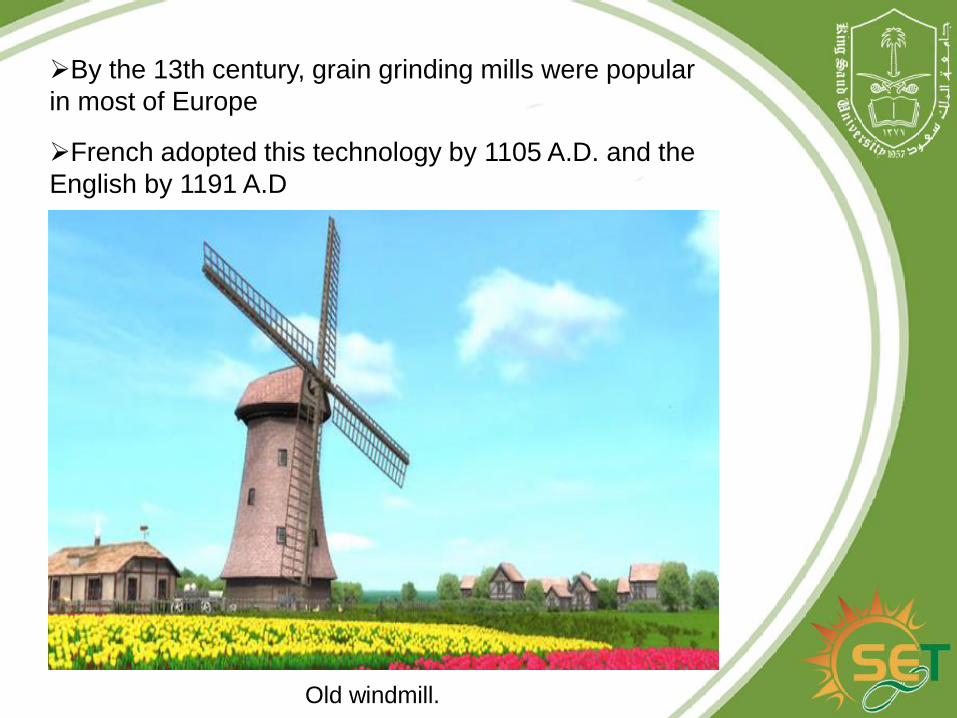
By the 13th century, grain grinding mills were popular
in most of Europe
French adopted this technology by 1105 A.D. and the
English by 1191 A.D
Old windmill.
The era of wind electric generators began
close to 1900’s.
The first modern wind turbine, specifically
designed for electricity generation, was constructed
in Denmark in 1890.
The first utility-scale system was installed in
Russia in 1931.
A significant development in large-scale
systems was the 1250 kW turbine fabricated by
Palmer C. Putman.

Built around a central post
June 19 – 20, 2007 Wind Energy

Smith Putnam Machine
1941
Rutland, Vermont
1.25 MW
53 meters (largest turbine for 40 years)
Structural steel
Lost blade in 1945

Mod-5B Horizontal axis wind turbine.
Darrieus wind turbine is vertical axis wind turbine.
Current status and future prospects
Spain also celebrates in Nov. 10, 2010 when the wind energy
resources contribute 53% of the total generation of the
electricity.
For example, the European Union targets to meet 25 per cent
of their demand from renewable by 2012.
Wind is the world’s fastest growing energy source
today
The global wind power capacity increases at least 40%
every year.
Over 80 percent of the global installations are in Europe.
Installed capacity may reach a level of 1.2 million
MW by 2020

The installed capacity from the wind worldwide.

Installed capacity in different regions in the world, 2010.


(a) SWAY 10MW.

Enercon E126, 7.5MW, 126 diameter
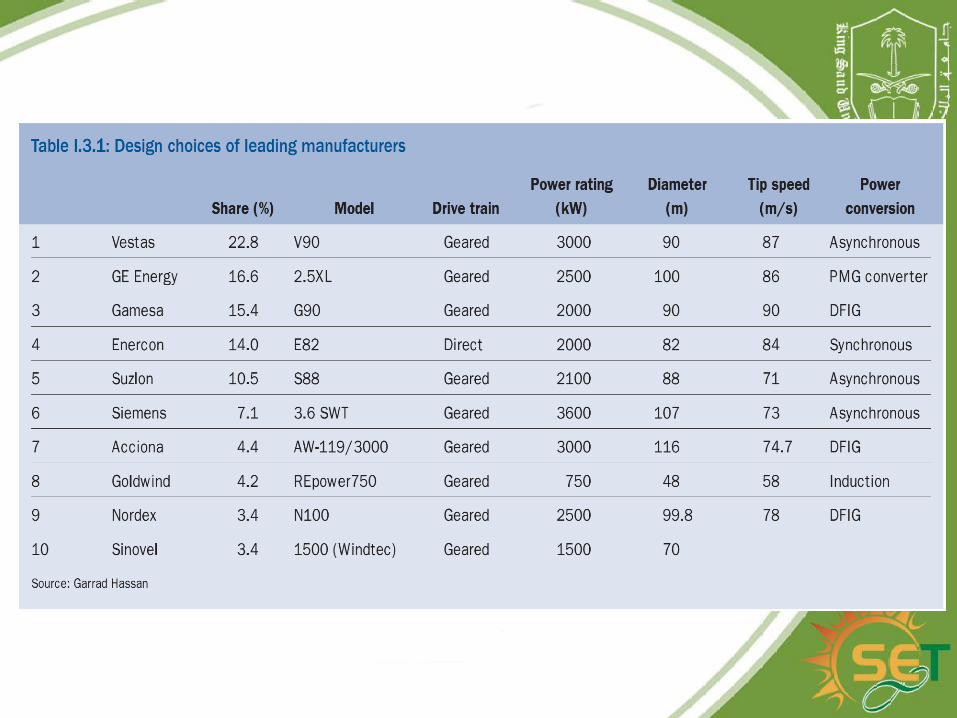

Top ten manufacturers of WTs, 2009.

Types of Wind Turbine Generators (WT)
1. Horizontal Axis WTs (HAWTs)
The HAWT configurations

Vertical Axis WTs (VAWTs)
The VA-WTs Configurations

Orientation of WT
Turbines can be categorized into two overarching classes based on the orientation of the rotor
Vertical Axis Horizontal Axis

Vertical Axis TurbinesAdvantages• Omnidirectional
– Accepts wind from any angle• Components can be mounted at ground level
– Ease of service– Lighter weight towers
• Can theoretically use less materials to capture the same amount of wind
Disadvantages• Rotors generally near ground where wind
poorer• Centrifugal force stresses blades &
components• Poor self-starting capabilities• Requires support at top of turbine rotor• Requires entire rotor to be removed to
replace bearings• Overall poor performance and reliability/less
efficient• Have never been commercially successful
(large scale)
Windspire
Savonious
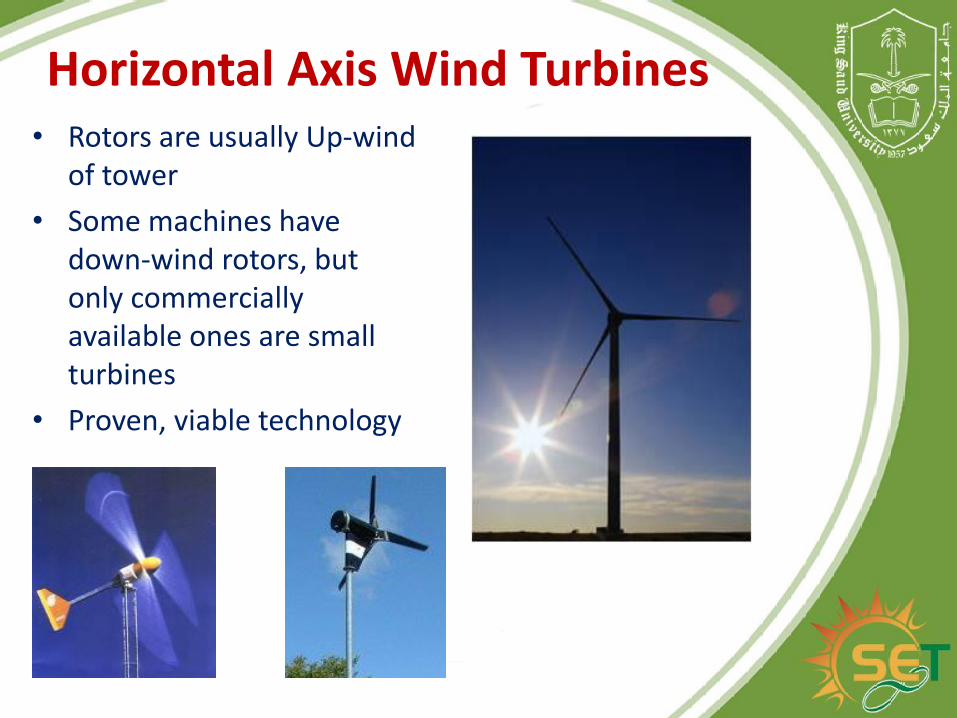
Horizontal Axis Wind Turbines• Rotors are usually Up-wind
of tower
• Some machines have down-wind rotors, but only commercially available ones are small turbines
• Proven, viable technology

Comparison between HA-WTs and VA-WTs.
Items HA-WTs VA-WTs
Output power Wide range Narrow range
Starting Self starting Need starting means
Efficiency Higher Lower
Cost Lower Higher
Wind direction Need redirected when the Wind change its direction
Does not needs redirected into the wind direction
Generator and gear box At the top of the tower At the ground level
Maintenance Difficult Easy

Upwind and Dawnwind WT

Upwind turbines have the rotor facing the wind as shown in
Fig.1.11 (a). This technique has the following features:
• Avoids the wind shade that the tower causes which improve the
power quality of the generated voltage and reduces the spicks in
power when the blades move in front of the tower specially in
constant speed systems.
• Fewer fluctuations in the power output.
• Requires a rigid hub, which has to be away from the tower.
Otherwise, if the blades are bending too far, they will hit the tower.
• This is the dominant design for most wind turbines in the MW-
range

Downwind WT have the rotor on the flow-side as shown in
Fig.1.11 (b). It may be built without a yaw mechanism if the nacelle
has a streamlined body that will make it follow the wind.
■Rotor can be more flexible: Blades can bend at high speeds,
taking load off the tower. Allow for lighter build.
■Increased fluctuations in wind power, as blades are affected by
the tower shade.
■Only small wind turbines.

1.3.4Number of Rotor Blades
Influence of the number of blades on the rotor power coefficient
(envelope) and the optimum tip-speed ratio.

shows one blade WT.

Sizes and Applications
Small (10 kW)• Homes
• Farms• Remote Applications
(e.g. water pumping, telecom sites, icemaking)
Intermediate
(10-250 kW)
• Village Power
• Hybrid Systems
• Distributed Power
Large (660 kW - 2+MW)
• Central Station Wind Farms
• Distributed Power
• Community Wind

Large and Small Wind Turbines
Large Turbines (600-2000 kW)
• Installed in “Windfarm” arrays totaling 1 - 100 MW
• $1,300/kW
• Designed for low cost of energy (COE)
• Requires 6 m/s (13 mph) average wind speed
• Value of Energy: $0.02 - $0.06 per kWh
Small Turbines (0.3-100 kW)
• Installed in “rural residential” on-grid and off-grid
applications
• $2,500-$8,000/kW
• Designed for reliability / low maintenance
• Requires 4 m/s (9 mph) average wind speed
• Value of energy: $0.06 - $0.26 per kWh

Small Wind Turbines
• Blades: Fiber-reinforced plastics,
fixed pitch, either twisted/tapered,
or straight (pultruded)
• Generator: Direct-drive
permanent magnet alternator, no
brushes, 3-phase AC, variable-
speed operation
• Designed for:– Simplicity, reliability
– Few moving parts
– Little regular maintenance required
50 kW10 kW
400 W900 W

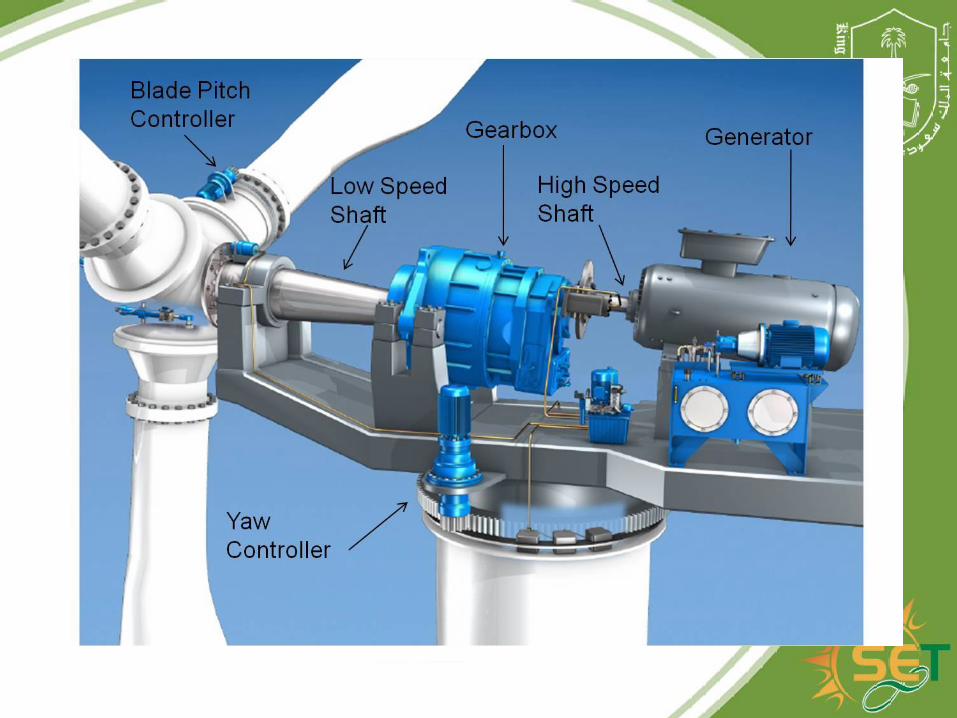
Wind Turbine components
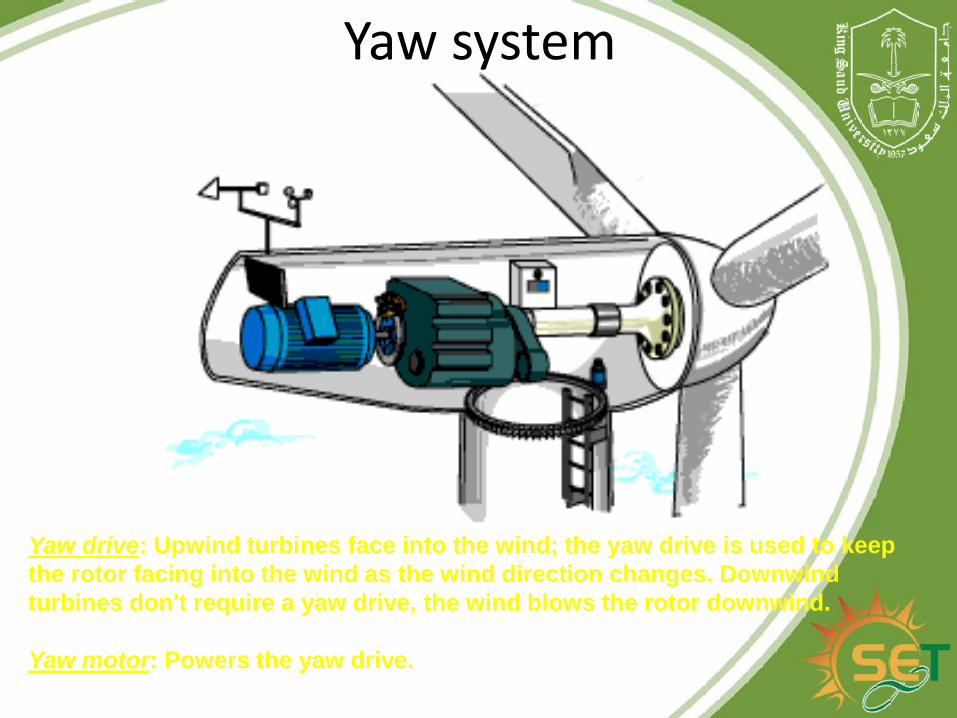
Yaw system
Yaw drive: Upwind turbines face into the wind; the yaw drive is used to keep
the rotor facing into the wind as the wind direction changes. Downwind
turbines don't require a yaw drive, the wind blows the rotor downwind.
Yaw motor: Powers the yaw drive.

YAW MECHANISM
It is used to turn the turbine
against the wind..
If the turbine is not perpendicular
to the wind, then the power
flowing is lower.
Almost all HAWT use forced
yawing, i.e they use electric
motors and gearbox.
Wind turbine running with yaw
error are running with hiher
fatigue loads.
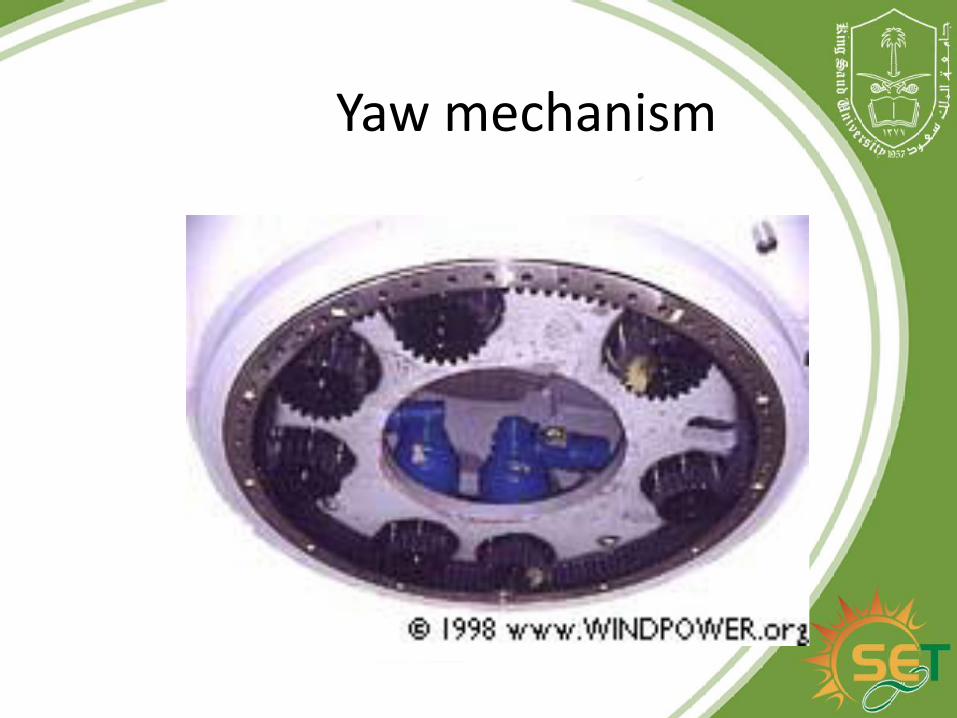
Yaw mechanism

1.3.5 Aerodynamics of Wind Turbines
Important parameters of an airfoil
2
2
1VACL aL
2
2
1VACD aD
where CL and CD are the lift and drag coefficients respectively.

Airfoil Shape
Just like the wings of an airplane, wind turbine blades use the airfoil shape to create lift and maximize efficiency.
The Bernoulli Effect

Lift & Drag Forces
• The Lift Force is perpendicular to the direction of motion. We want to make this
force BIG.
• The Drag Force is parallel to the direction of motion. We want to make this force small.
α = low
α = medium<10 degrees
α = HighStall!!


Effect of angle of attack on airfoil lift

KidWind Project | www.kidwind.org
Pitch Control Mechanisms

BRAKING MECHANISM
It essential for turbines to stop
automatically in case malfunction of
components.
Thus, it is necessary to have an over speed
safety system.
There are two types of braking:-
1.aerodynamic braking system
2.mechanical breaking system

1.Aerodynamic braking system
It consists of turning the rotor blades or
tips about 900 about the longitudinal
axis.
They are spring operated and thus work
even in case of power failure.
They have a very gentle and secure way
of stop the rotor thus avoiding the
damage.
They are extremely safe .
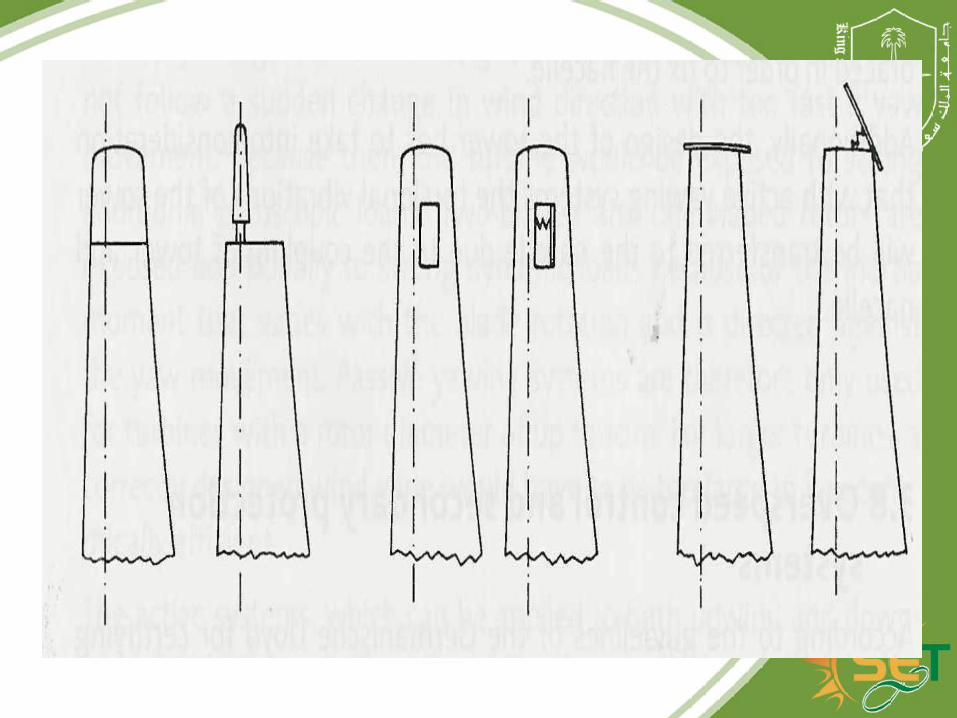

MECHANICAL BRAKING SYSEM
they act as back-up for other
mechanism.

Control Mechanisms
Its purpose is to:
■Optimize aerodynamic efficiency,
■Keep the generator with its speed and
torque limits and rotor and tower within
strength limits,
■Enable maintenance, and,
■Reduce noise.

Stalling (Losing power) Principle: Increased angle of attack results in decreasing lift-to-drag ratio.
The schematic representing the Stalling control regulator.

Passive: Blades are at a fixed pitch that starts to stall when
the wind speed is too high.
■Active: motor turns the blades towards stall when wind
speeds are too high.
■Hybrid: Pitch can be adjusted manually to reflect site's
particular wind regime.
■Disadvantages:
1- Stalled blades cause large vibration and therefore noise.
2- The aerodynamic power on the blades is limited. Such
slow aerodynamic
power regulation causes less power fluctuations than a fast-
pitch power regulation.
3-lower efficiency at low wind speeds
4- It needs startup means.

Pitch Control Principle: Decrease angle of attack also results in decreasing lift-to-drag ratio.
The schematic representing the pitch control regulator.

Always active control: Blades rotate out of the wind when wind speeds are too high.
The advantages of this technique are:•good power control,•No need for startup means.• It can be combined with emergency stop means.
The main disadvantage of this technique is the extra complexity arising from the pitch mechanism and the higher power fluctuations at high wind speeds.
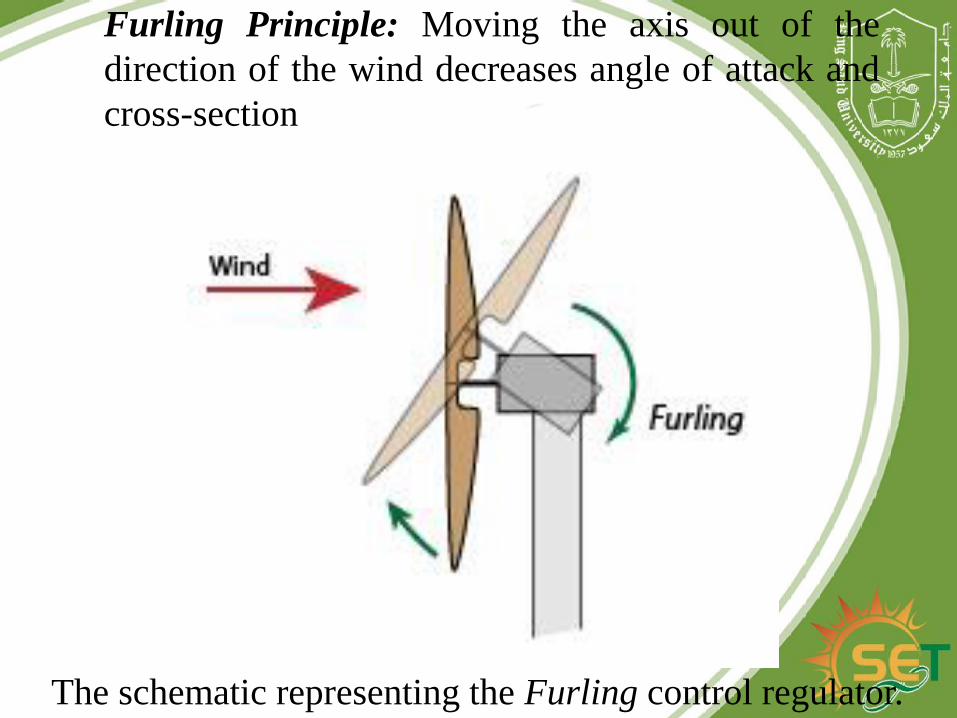
Furling Principle: Moving the axis out of the
direction of the wind decreases angle of attack and
cross-section
The schematic representing the Furling control regulator.

■Requires active pitch control: Pitch angle of the
blades needs to be minimized first, otherwise the torque on the rotor would be too big for furling. ■Active: Vertical furling (as diagram) with
hyrdraulic, spring-loaded or electric motor driven.
■Passive: Horizontal furling with yaw.

Illustration of stall, active-stall and pitch effects.


GENERATOR
They are a bit different than other turbines b'cozthey have to handle changing mechanical torque.
They usually produce around 690 V, 50 or 60 Hz, 3 phase ac.
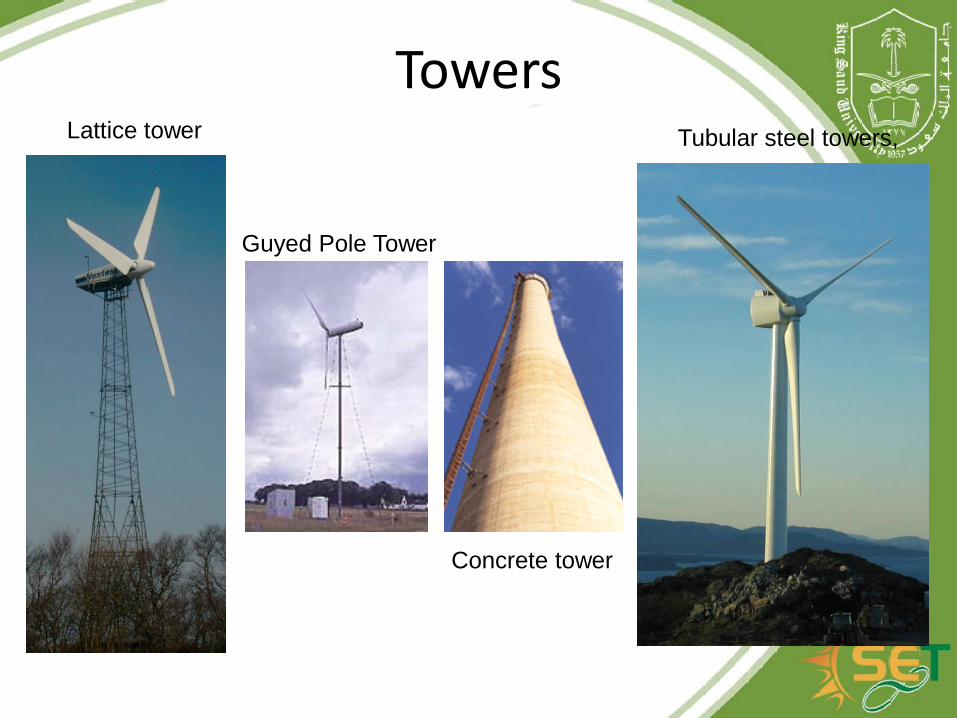
Towers
Guyed Pole Tower
Lattice tower Tubular steel towers,
Concrete tower
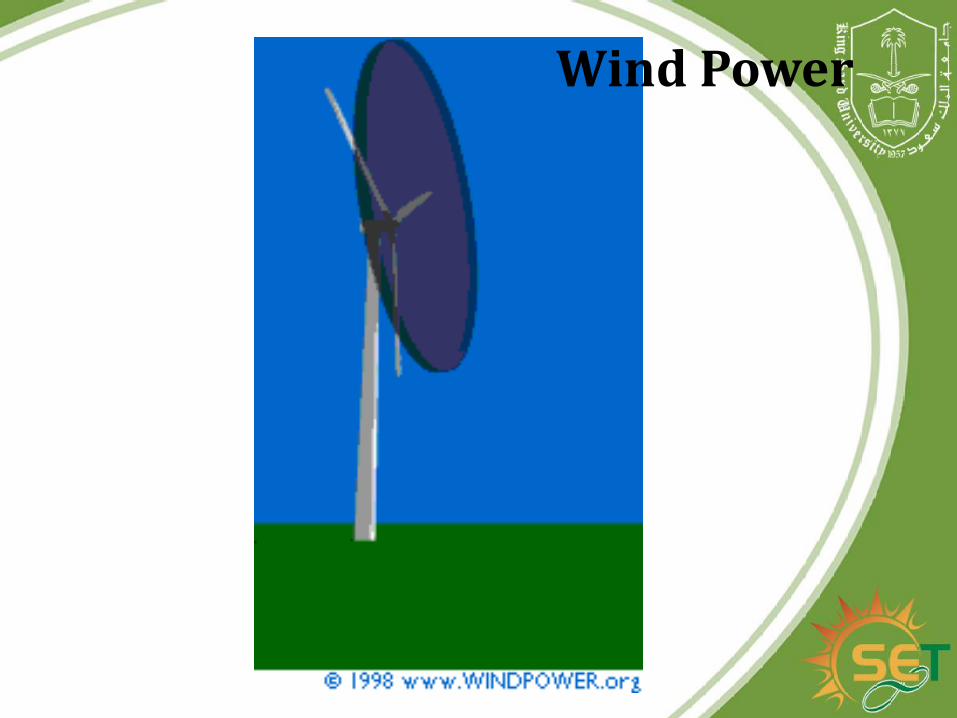
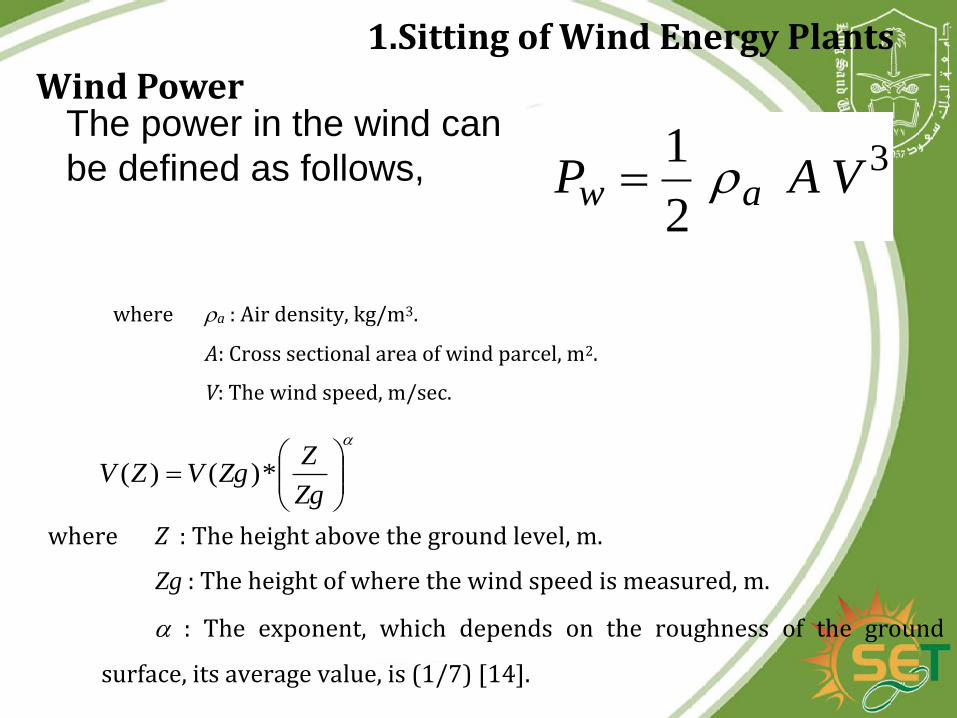
Wind Power
1.Sitting of Wind Energy Plants
Wind PowerThe power in the wind can
be defined as follows, 3
2
1VAP aw
Zg
ZZgVZV *)()(
where Z : The height above the ground level, m.
Zg : The height of where the wind speed is measured, m.
: The exponent, which depends on the roughness of the ground
surface, its average value, is (1/7) [14].
where a : Air density, kg/m3.
A: Cross sectional area of wind parcel, m2.
V: The wind speed, m/sec.

Fig. 1.22 Actual WT output power with the wind speed.

Betz' Law
Betz: law says that you can only convert less than 16/27 (or
59%) of the kinetic energy in the wind to mechanical energy
using a wind turbine.

Tip-Speed RatioTip-speed ratio is the ratio of the
speed of the rotating blade tip to the speed of the free stream wind.
There is an optimum angle of attack which creates the highest lift to drag ratio.
Because angle of attack is dependant on wind speed, there is an optimum tip-speed ratio
ΩRV
TSR =Where,
Ω = rotational speed in radians /sec
R = Rotor Radius
V = Wind “Free Stream” Velocity
ΩR
R

Performance Over Range of Tip Speed Ratios
• Power Coefficient Varies with Tip Speed Ratio
• Characterized by Cp vs Tip Speed Ratio Curve

Betz LimitAll wind power cannot be
captured by rotor or air would be completely still behind rotor and not allow more wind to pass through.
Theoretical limit of rotor efficiency is 59%
Most modern wind turbines are in the 35 – 45% range

Over-Speed Protection During High Winds
Upward Furling: The rotor tilts back during high winds
Angle Governor: The rotor turns up and to one side

Rotor Design
1. Radius of the rotor (R)
2. Number of blades (B)
3. Tip speed ratio of the rotor at the design point (λD)
4. Design lift coefficient of the airfoil (CLD)
5. Angle of attack of the airfoil lift (α)
3
2
DagdPD
D
VC
PR
TV
ER
Das
A3
2

Fig.1.23. Number of blades and design tip speed ratio

Example
Design the rotor for a WT develop 100 W at a wind speed of 7 m/s.
NACA 4412 airfoil may be used for the rotor.
Let us take the design power coefficient as 0.4 and the combined drive train and
generator efficiency 0.9. Taking the air density as 1.224 kg/m3, from Equation (1.7),
the rotor radius is:

Weibull Statistics
1,0,0,exp
1
cukc
u
c
u
c
kuf
kk
Weibull density function f(u) for scale parameter c = 1.
0.35.112.1 kuc

Example
The Weibull parameters at a given site are c = 6 m/s and k = 1.8. Estimate the
number of hours per year that the wind speed will be between 6.5 and 7.5 m/s.
Estimate the number of hours per year that the wind speed is greater than or equal
to 15 m/s. From Eq. (1.25), the probability that the wind is between 6.5 and 7.5 m/s
is just f(7), which can be evaluated from Eq. (1.21) as:
0907.06
7exp
6
7
6
8.17
8.118.1
f
This means that the wind speed will be in this interval 9.07 % of the time, so
the number of hours per year with wind speeds in this interval would be;
0.0907*8760=794 hr.
From Eq. (1.24), the probability that the wind speed is greater than or equal to 15
m/s is
0055.06
15exp15
8.1
uP
which represents
0.0055*8760=48 h/year

Determining the Weibull Parameters086.1
uk
1
/11
/2111
21
2
2222
k
ku
kkc
k
uc
/11 0.35.1,12.1 kuc
k
Fk
c
k
R
k
R
k
ceReave cu
cucu
cucuPP /exp
//
/exp/exp
eave
avL
P
PNWT

Design of Wind Energy System
Data of
available WTs
Hourly Wind-
speed data of
available sites
Hourly load
data
Weibull
statistical
analysis
Energy balance
analysis
Cost analysis Output results
Summarized block diagram of the analysis

Start
Read
Input number of sites, N1
Input number of WTG, WTG
Read all The data of WTG
Read Load (e,d)
Subrotine #1
Calculation of Weibull parameters
Subrotine #2
Calculation of Capacity Factor
Subrotine #3
Calculation of Energy Balance
Subrotine #4
Calculation of ECF
Subrotine #5
Printing the results
Read Hourly Wind Speed
and Frequency of Each
Speed for All Sites
End
Flowchart of the main computer program.

Project Development
element of wind farm % of total cost
Wind Turbines 65
Civil Works 13
Wind farm electrical infrastructure 8
Electrical network connection 6
Project development and management
costs
8

Wind Farms

A 'wind farm is a group of wind turbines in the same location used for production of electric power.
Individual turbines are interconnected with a medium voltage (usually 34.5 kV) power collection system and communications network.
At a substation, this medium-voltage electrical current is increased in voltage with a transformer for connection to the high voltage transmission system
A large wind farm may consist of a few dozen to several hundred individual wind turbines, and cover an extended area of hundreds of square miles (square kilometers), but the land between the turbines may be used for agricultural or other purposes.
A wind farm may be located off-shore to take advantage of strong winds blowing over the surface of an ocean or lake.

Location
Wind speed
Altitude
Wind park effect
Environmental and
aesthetic impacts
Effect on power grid

Types of Wind Farms
Off-Shore
On-Shore
Near-Shore
Air borne

Off-shore On-shore

Onshore
Onshore turbine installations in hilly or mountainous regions tend to be on
ridgelines generally three kilometers or more inland from the nearest
shoreline. This is done to exploit the so called topographic acceleration as
the wind accelerates over a ridge.
Nearshore
Nearshore turbine installations are on land within three kilometers of a
shoreline or on water within ten kilometers of land. These areas are good
sites for turbine installation, because of wind produced by convection due to
differential heating of land and sea each day. Wind speeds in these zones
share the characteristics of both onshore and offshore wind, depending on
the prevailing wind direction.

OffShore
Offshore wind development zones are generally considered to be ten
kilometers or more from land. Offshore wind turbines are less
obtrusive than turbines on land, as their apparent size and noise is
mitigated by distance.
In stormy areas with extended shallow continental shelves, turbines
are practical to install.
Offshore installation is more expensive than onshore but this
depends on the attributes of the site.
Airborne
Airborne wind turbines would eliminate the cost of towers and might
also be flown in high speed winds at high altitude. No such systems
are in commercial operation.

Utility Interface Options for Wind,
Photovoltaic and Fuel Cell Energy
Systems

IGMachine
side
converter
Utility
side
converter
VR V
I
Utility
Interconnection of Induction Generator with Electric
Utility

Scheme #1
Self Excited Induction Generator Equipped with Diode Rectifier /
LCI Inverter
VR
VI
Rectifier LCI
IG
UGIo

c
ab
DC/DC
Converter
IG
SCR
InverterElectric
Utility
Diode rectifier
DC-Link Voltage Control

VR
VI
Rectifier LCI
IG
UGIo
Scheme #2
Self Excited Induction Generator Equipped with SCR Rectifier / LCI
Inverter
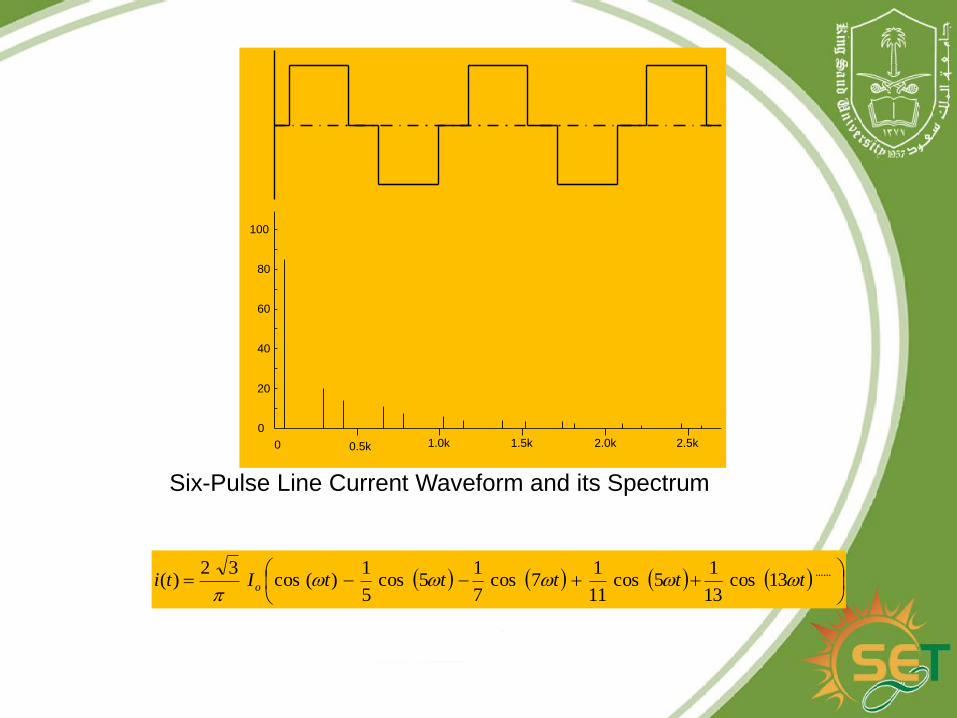
0 0.5k 1.0k 1.5k 2.0k 2.5k
20
40
60
80
100
0
Six-Pulse Line Current Waveform and its Spectrum
......13cos
13
15cos
11
17cos
7
15cos
5
1)(cos
32)( tttttIti o

Induction
GeneratorRectifier
LCI
Inverter
12-pulse
transformer
Three-phase
utility
Vd
-
+Ia
Ib
Ic
Twelve pulse inverter

)23(sin
23
1)13(sin
13
1)11sin(
11
1)sin(
32ttttII oa

SCR
Inverter
Vd
UGIsolation
Transformer
Two Step down DC-
DC converters
If
o
Harmonic reduction in LCI inverter by two-step down DC-DC
converters.

0 0 .0 0 5 0 .0 1 0 .0 1 5
-1 .5
-1
-0 .5
0
0 .5
1
1 .5
t im e
Uti
lity
lin
e c
urr
en
t
The utility line current with reinjection technique.

462
135
a
b
c
Io
If/2
If/2
Io-I
f/2
Io+I
f/2
d
Vd
Ia
. . .If/3
C
L
If/3
If/3
The reinjection technique using three-LC branches

Scheme #3
Self Excited Induction Generator Equipped with Diode Rectifier /
PWM Inverter
IG
VR
VI
Rectifier Electric
UtilityPWM
Utility interfacing of SCIG via diode rectifier and PWM inverter

Scheme #4
Induction Generator Equipped with PWM Rectifier / LCI
Inverter
S1
S2
S3
S4
S5
S6
C
ab
Variable frequency
PWM Converter DC Link
IG
LCI InverterElectric
Utility
Ia
Ib
Ic
Variable speed WTG equipped PWM / LCI inverter cascade

Lo
ab
c
IGVariable frequency
PWM ConverterDC
Link
Constant Frequency
PWM ConverterThree Phase
utility
AC
G.Wind
WTG
Gear
Box
Connection of Cage IG to electric utility via two voltage sources PWM.
Scheme #5
Induction Generator Equipped with PWM Rectifier / PWM Inverter
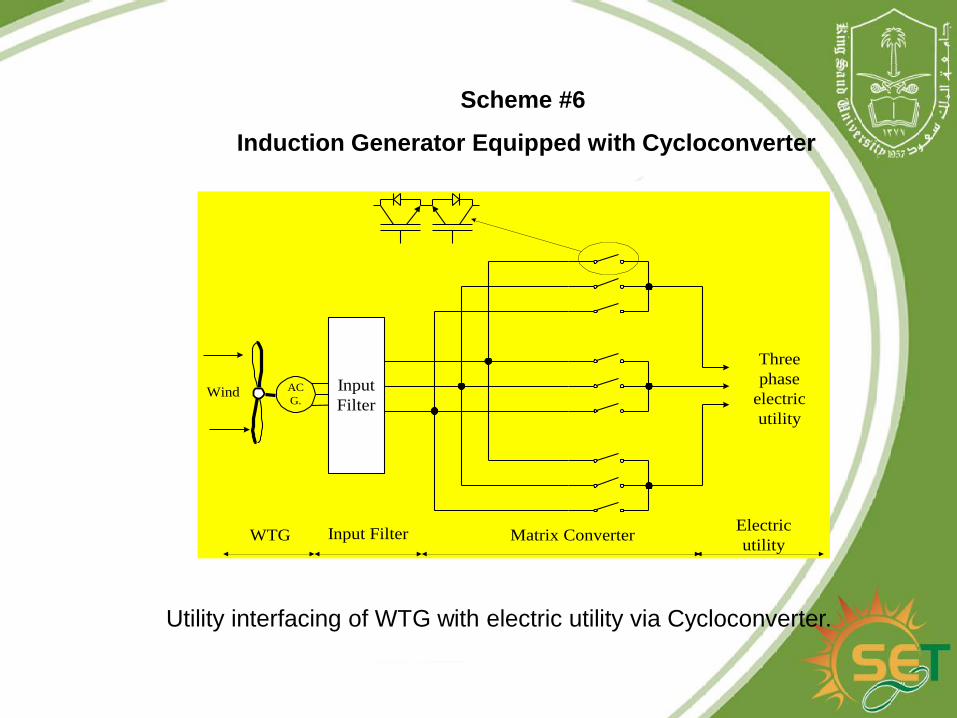
Scheme #6
Induction Generator Equipped with Cycloconverter
WTG Input Filter Matrix ConverterElectric
utility
AC
G.Wind Input
Filter
Three
phase
electric
utility
Utility interfacing of WTG with electric utility via Cycloconverter.