introduction to section 3 contents operations management...
TRANSCRIPT

Section 3 Contents
Session 117. Compute Inventory Performance□ 7.1 Newsvendor Model
□ 7.2 Mismatch Cost Computation
Next: 7.3 Types of Stocks7.4 Improvement Ideas
Experience Inventory Flow in a Supply chain
8. Generate Supply Chain Improvements
Introduction toOperationsManagementProf. Apurva JainOPMGT 502
Flow Model: Focus on Inventory
Aug 2017 US retail inventory: 625,351 m$CSCMP’s estimate of inventory carrying cost: 19%
How do we improve inventory performance measures?

Inventory Planning: Nordstrom1. Create Sales Plans for each channel
2. Determine How Much Inventory is Needed to Support Sales
3. Overestimate Sales: Too much inventoryUnderestimate Sales: Too little inventory
4. Too much inventory: Reprice, Return, MarkdownToo little inventory: Expedite orders, Move $s elsewhere
Metrics: Sales, Inventory Turns (YTD Net Sales/Avg Inventory)Stock to Sales(STS) (Beg. Month Stock/ Month End Sales)
The most important decision is 2. How Much Inventory?
Our Model to Understand and Improve this decision:
Newsvendor Model
Nordstrom invests in supply chain software firm. July 2016. BI
.. to develop new initiatives, like using historical inventory data to predict future
stock levels, further reducing the potential for stock shortages.
A Thought Experiment
Period Order-Size(a)
Dem-and
Sold(b)
Excess(c)
Short-age
Cost$80*(a)
Revenue$100*(b)
Salvage$30*(c)
Profit=100*(b) – 80*(a) + 30 *(c)
Example 4 5 4 0 1 320 400 0 80
Example 4 3 3 1 0 320 300 30 10
1
2
3
4
Demand in a period can be any number between 1 and 6 with equal probability. Buy a unit for $80. If you can sell it, you will get a per unit revenue of $100. If it does not sell in that period, discount it for a salvage value of $30. Each period is independent; no inventory carried between periods.
What order size decision will maximize average profit across periods?

Developing Newsvendor Model:
Decision: How much to order/What is the starting inventory= 3Exp. Values are sum of (probability*value) in each case
Possible cases of demand values 1 2 3 4 5 6 Exp. Demand = 3.5
Probability of each case 1/6 1/6 1/6 1/6 1/6 1/6
Service level is the fraction of cases where all demand is met.
Meet all demand? Yes Yes Yes No No No Service Level = 50.00%
How much Sales? 1 2 3 3 3 3 Exp. Sales = 2.5
How much Shortage? 0 0 0 1 2 3 Exp. Shortage = 1
How much Excess? 2 1 0 0 0 0 Exp. Excess = 0.5
Expected Profit = 100 * Exp. Sales – 80 * Order Size + 30 * Exp. Excess= 100* 2.5 – 80 * 3 + 30* 0.5 = 25
Mismatch Cost (see next slide)
= (100–80) * 3.5 – [ (100–80) * 1 + (80-30) * 0.5 ]
= Profit without Uncertainty-
Defining Service Level, Mismatch Cost
Newsvendor model: a single-period problem in which demand is uncertain Decision: How much to order at the beginning of period or equivalently how much inventory to have at the start of the period Objective: Maximize Exp. Profit
Service Level: For a given decision, what is the fraction of possible demand cases in which we can meet all demand.
Exp. Profit = revenue* Exp. Sales – cost*order + salvage* Exp. ExcessMaximizing Exp. Profit is the same as Minimizing Mismatch cost
Mismatch Cost = (revenue-cost)*Exp. Shortage + (cost-salvage)*Exp. Excess
Marginal cost of shortage
Cs=revenue-cost
Marginal cost of excess
Ce=cost- salvage
Mismatch cost is the total cost of not being able to match demand & supply
due to uncertainty

Marginal Costs of Shortage & Excess
Marginal Cost of shortage (understocking)cost of making a mistake of buyingone less than necessary.Cs = revenue r – cost c
Marginal Cost of excess (overstocking)cost of making a mistake of buyingone more than necessary.Ce = cost c – salvage s
Definition remains the same but, depending on the context, formulas may change.
Reinforcing DefinitionsA publisher’s per-book publishing/delivery cost is $9; sales price is $15.What is Cs?
A mobile phone’s mfg./delivery cost is $150. If not sold in six months, unsold units are sold in Asia at $110 net. What is Ce?
A retailer operates at a targeted 98% service level for fresh milk. What isthe chance that, on a late night grocery-run, you will find no milk?

Newsvendor model: Service Level Optimization
Mismatch CostTo Maximize Exp. Profit or To Minimize Mismatch Cost:
Optimal service level = (Cs / (Cs + Ce) )
Optimal inventory level (order size):(newsvendor decision rule)
Order minimum quantity that matchesor exceeds the optimal service level
Trade-off: Shortage Cost vs. Excess Cost
Our Experiment: Optimal Service Level
Order 1 2 3 4 5 6
Demand Prob. 1/6 1/6 1/6 1/6 1/6 1/6
Service level
1/6=0.167
2/6=0.33
3/6=0.5
4/6=0.67
5/6=0.83
6/6=1
Per unit: revenue r=100, cost c=80, salvage s=30.
Step 1:Compute Cs, Ce, and optimal service level= Cs=100=80=20, Ce=80-30=50, Optimal S.L.=20/(20+50)=0.285
Step 2: (Discrete demand) compute service levels for different order sizes
Step 3: Use newsvendor decision rule to find optimal order quantity2 is the minimum order quantity at which the service levelmeets or exceeds Optimal S.L. ; therefore buy and stock 2.

A Moment of Reflection
Can you think of a decision you or your company makes in which theoutcome is uncertain and cost-implications are asymmetrical?
Section 3 Contents
Session 117. Compute Inventory Performance□ 7.1 Newsvendor Model
Marginal Costs of Shortage/ExcessOptimal Service Level
□ 7.2 Mismatch Cost Calculation
Introduction toOperationsManagementProf. Apurva JainOPMGT 502

Newsvendor model
Demand follows normal distribution
Normal ProbabilityDensityFunction
CumulativeProbability
orService level
Use spreadsheet to analyze newsvendor model with normal demand.
Start with Inputs:- Demand Average (Mean), Std. Dev.- Marginal cost of shortage Cs- Marginal Cost of Excess Ce
Decisions:Spreadsheet computes optimal service level and optimal inventory level. You can then input your chosen inventory level.
Outputs:Spreadsheet computes service level and mismatch cost corresponding to your inventory level.
Practicing Newsvendor ModelA publisher’s per-book publishing/delivery cost is $6; sales price is $12. Unsold books can be salvaged at $3. Demand is normally distributed with mean 6.5 and standard deviation 1.11 What is the optimal inventory level and corresponding mismatch cost? [Decimals ok.]
Determine Inputs for spreadsheet:Marginal Marginal
Demand Demand Shortage ExcessAverage Std.Dev. Cost Cs Cost Ce
Decisions:
Outputs: (performance of your order quantity)
Service Exp. Exp. Mismatch Exp.Level Shortage Excess Cost Profit
Read Outputs:
Optimal YourOrder Order
Optimal Quantity / Quantity /Service leve Inventory Inventory=Cs/(Cs + Ce) Level Level
What is the effect of reducing demand standard deviation on mismatch cost?

Estimating Inputs in Practice:
Estimating Demand Standard Deviation:
- When it is a new product, the variation in experts’ opinions is a great predictor of demand variability
- When it is an old product, then the historical forecast error (actual – forecast) is a great predictor of demand variability.
Estimating Marginal Costs of Shortage Cs and Excess Ce:
- Depending on the context, the basic definitions may change.- For example, if there is a possible cost of losing a
dissatisfied customer’s future business, Cs will increase. If there is sales commission, Cs will decrease.
Sport Obermeyer

Improvement Idea: Quick Response: Reduce Leadtime Reduce demand variability Reduce Mismatch cost
Section 3 Contents
Session 117. Compute Inventory Performance□ 7.1 Newsvendor Model
Marginal Costs of Shortage/ExcessOptimal Service Level
□ 7.2 Mismatch Cost CalculationSpreadsheet Sport Obermeyer Introduction
Next: Spreadsheet, Survey, Practice7.3 Types of Stocks7.4 Improvement Ideas
Experience Inventory Flow in a Supply chain
8. Generate Supply Chain Improvements
Introduction toOperationsManagementProf. Apurva JainOPMGT 502
Understand the fundamental trade-off in inventory: too much vs. too little and how optimal service level resolves it. Many other contexts and decisions under uncertainty have similar structure.

Examples Publishing, Electronics
Overbooking in Airlines
Blood Bank Stock
NFL Merchandise
Fast Fashion: Zara
….
Matching Supply with Demand in an Uncertain World: Newsvendor Model
iPhone X supplycrunch mean youmay wait tillFebruary to getone…Sep 2017
A mammoth first printing of 1.5 million copies has been ordered.

Overbooking in Airlines: Improvement Idea: Optimize overbooking level
No-ShowDistribution
overbookinglevel
Bumping costUnused seat
Blood Bank Stock:Improvement idea: Optimize collection levels
DemandDistribution
Stock level
PerishabilityUnmetDemand

NFL Merchandise Supply Chain
How much inventory?
Superbowl Merchandise:Improvement idea: Increase Salvage Value
The NFL used to destroy all the loser merchandise, but thanks to a partnership with Federal Way-based World Vision it now goes to needy people all over the world.
This reduces Ce and Mismatch cost. Also increases the optimal service level.
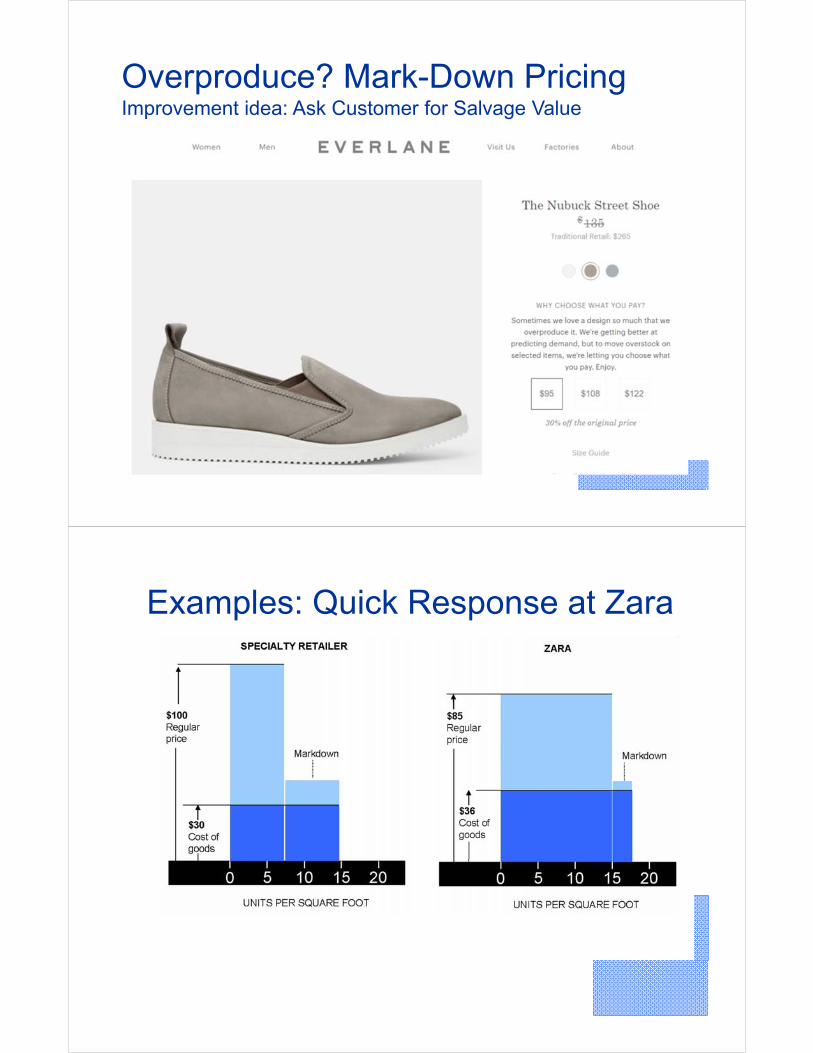
Overproduce? Mark-Down PricingImprovement idea: Ask Customer for Salvage Value
Examples: Quick Response at Zara

Practicing Newsvendor ModelA publisher’s per-book publishing/delivery cost is $6; sales price is $12. Unsold books can be salvaged at $3. Demand is normally distributed with mean 6.5 and standard deviation 1.11 What is the optimal order quantity and corresponding mismatch cost? [Decimals ok.]Inputs: (in green cells)
Marginal MarginalDemand Demand Shortage ExcessAverage Std.Dev. Cost Cs Cost Ce
6.5 1.11 6 3
Outputs: (performance of your order quantity)
Service Exp. Exp. Mismatch Exp.Level Shortage Excess Cost Profit0.666667 0.244227 0.722334 3.632362 35.36764
Optimal Optimal YourService levOrder Order=Cs/(Cs + Quantity Quantity0.666667 6.978107 6.978107