introduction to scival
TRANSCRIPT

| 0
Introduction to SciVal Introduction to SciVal (6 min):
https://www.brighttalk.com/webcast/13819/196781
| 1
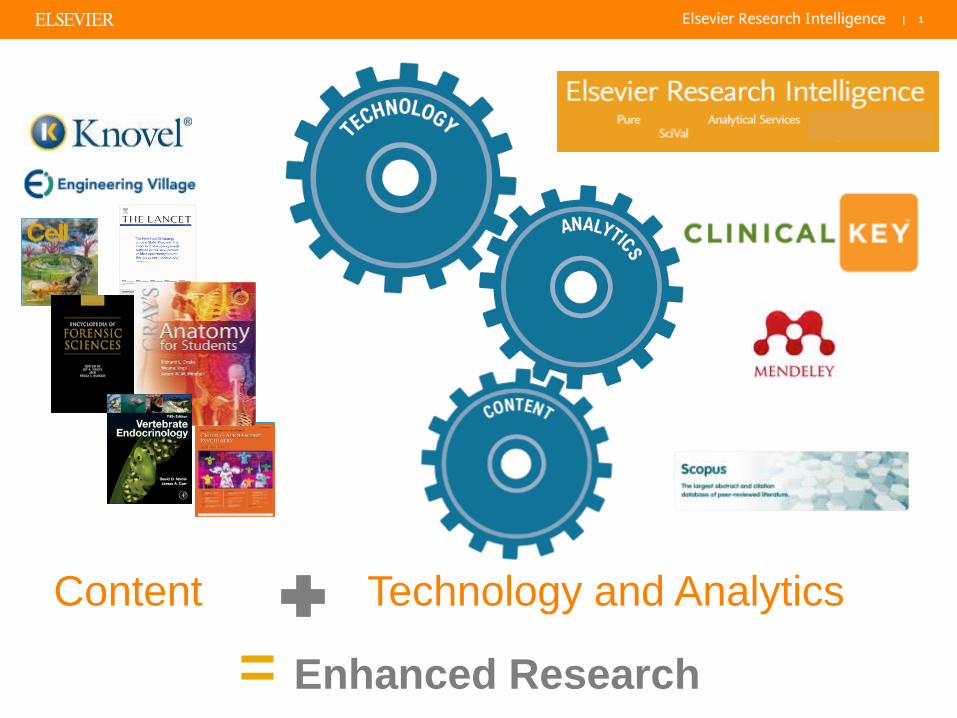
Technology and Analytics
= Enhanced Research
Content

| 2 | | 2
Reference: International Comparative Performance of the UK Research Base 2013
The world of research is becoming more competitive – leading to challenges for research management
• R&D budgets
• More researchers
+output growth
• Emerging research
nations (India,
China, Brazil)
• Economic
development
• Faster pay-offs
• Accountability &
transparency
Identify strengths and shortcomings to inform research
decisions Accelerate collaboration Secure more funding
Retain and hire best-in-class researchers
Trends Expectations
Needs

| 3
Reference Manager
Networking Tool
Library
Document Manager
Research Information
Management System to streamline research
administration
Customized analysis,
reports and services to meet your research
management needs.
Analytical tool to explore research
performance globally
Rich data assets
External view Internal view Custom analysis
Researcher productivity
Elsevier Research Intelligence portfolio
The largest abstract and
citation database of
peer-reviewed literature; research.
Aimed to improve your ability to Establish, Execute and Evaluate research strategy.

| 4 | | 4
What is SciVal?
4
Research
Performance
Management
Tool
Traditional
Flexible set-up, view and interrogation
Detailed / granular
Updated weekly
Researchers & groups
Show everything
Publications – Articles, conference proceedings, review articles, etc.
Productivity and “impact” as reflected by metrics and indicators
Informs decision-making about policy, CPIs, funding distribution, incentives, recruitment
Combination of metrics, various output methods, visualisation of results

| 5 | 5 | 5 | 5 | | 5
The layers of SciVal
Using advanced data analytics super-computer technology, SciVal
allows you to instantly process an enormous amount of data to
generate powerful data visualizations on-demand, in seconds.
Query around 110 trillion metric values

| 6 | 6 | 6 | 6 | | 6
Modular and Integrated
SciVal offers quick, easy access to the research performance of 220
nations and 6,000 research institutions worldwide, and groups of
institutions
Visualize
research
performance
Benchmark
your progress
Develop
collaborative
partnerships
Ready-made-at a
glance snapshots
of any selected
entity
Flexibility to create
and compare any
research groups
Identify and analyze
existing and potential
collaboration
opportunities
Analyze
research
trends
Analyze research
trends to discover the
top performers and
rising stars

| 7
Different use cases
7
SciVal supports the needs of a broad range of institutional users by providing
ready-made, at-a-glance snapshots for flexible, institution-specific insight
Find more use cases on our website: https://www.elsevier.com/research-intelligence/case-studies
Executive
Management
Research
Administrators
Department
Heads
Researchers
• Create management-level reports
• Accelerate collaboration
• Data to support and win large grants
• 360 degree Overview
• Identify institution’s strengths and short-comings
• Evaluate researchers
• Model-test scenarios
• Highlight achievements
• Expand networks
• Locate collaborators and mentors

| 8 | | 8
What are the questions addressed using SciVal?
“I want to benchmark my institute,
and my departments want to
benchmark themselves. How can
we all do this according to our
different realities?”
“How can we demonstrate
excellence in a way that best shows
our unique strengths to secure
funding and attract students?”
“My VC is going to China; who do
our academics collaborate with
there and how can we expand?”
“I want to explore the various
scenarios I’m considering to set up
a centre of excellence. How can
the data provide me with insights?”
| 9
Components of SciVal

| 10 | 10 | 10
Basket of Metrics
Snowball Metric: www.snowballmetrics.com/metrics
Productivity metrics
Scholarly Output
Outputs in Top Percentiles
Publications in Top Journal
Percentiles
Citation Impact metrics
Citation Count
Citations per Publication
Cited Publications
Number of Citing Countries
h-indices (h, g, m)
Field-Weighted Citation Impact
Collaboration metrics
Collaboration (geographical)
Collaboration Impact (geographical)
Academic-Corp Collaboration
Academic-Corp Collaboration Impact
Disciplinary metrics
Journal count
Journal category count
Plus
Views &
Patent-citations
Filter by: document type, subject limited, normalized, self-citation,
absolute numbers vs percentages

| 11
SciVal pre-defines 6,300 institutions and 250 nations, and allow users to
group those institutions and entities on-demand.
• Access to pre-defined 6300+ institutions, 250 countries and groups (i.e. EU28, US states, German Bundesländer, Russell group and more)
• Ability to create any desired grouping of entities, researcher groups or documents
Flexibility
Ready-to-use & Create your own
Predefined and customised entities
Institutions (+ groups)
Countries (+ groups)
Research Areas
• Search terms
• Entities
• Competencies
Researchers (+ groups)
Publication sets (+ groups)

| 12
Login Access: www.scival.com
Same login credentials as
ScienceDirect/Scopus
can be used
Click here if you forgot
your password
Click here to create a new login
| 13 | | 13
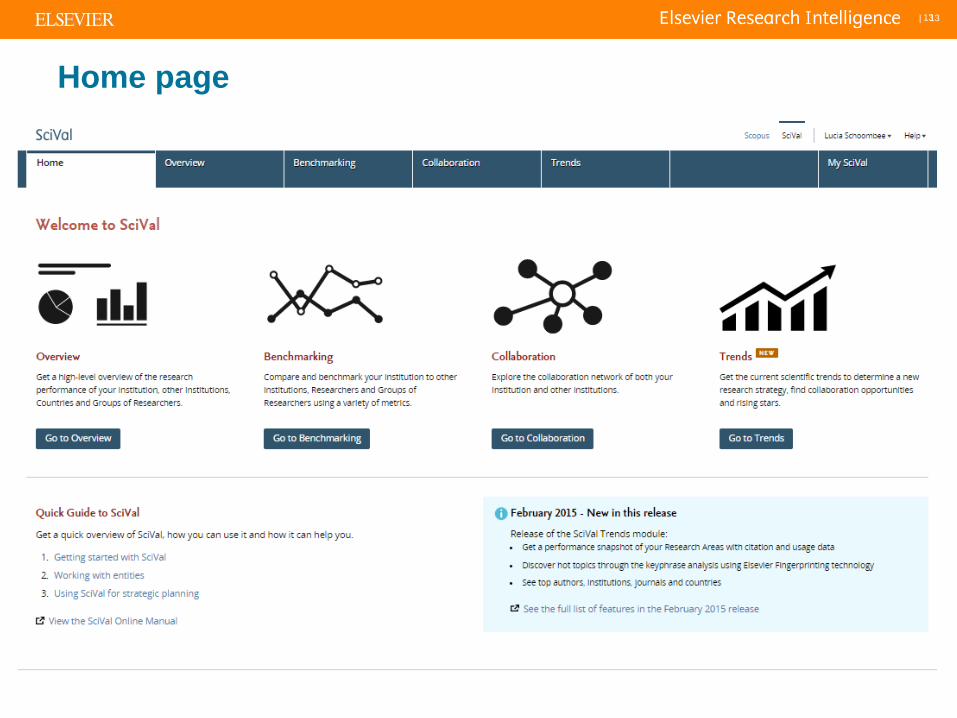
Home page
13

| 14 | | 14
Finding Help

| 15 | | 15
Thank you