introduction to sar remote sensing · september 3, 2007 lecture d1la1 introduction to sar remote...
TRANSCRIPT
Introduction to SAR Remote Sensing
Thuy Le Toan
September 3, 2007 Lecture D1La1

September 3, 2007 Lecture D1La1 Introduction to SAR remote sensing Thuy Le Toan
• Introduction to radar remote sensing• The Synthetic Aperture Radar• Geometric properties of SAR images • Statistic properties of SAR measurements• Physical content of SAR data
Contents
September 3, 2007 Lecture D1La1 Introduction to SAR remote sensing Thuy Le Toan
• Introduction to radar remote sensing• The Synthetic Aperture Radar• Geometric properties of SAR images • Statistic properties of SAR measurements• Physical content of SAR data
Contents

September 3, 2007 Lecture D1La1 Introduction to SAR remote sensing Thuy Le Toan
Non-Imaging (ex. Microwave radiometer, magnetic sensor)
Imaging (ex: cameras, optical mechanical scanner, spectrometer, microwave radiometer)
PASSIVE SENSORSDetect the reflected or emitted electromagnetic radiation from natural sources.
ACTIVE SENSORSDetect reflected responses from objects irradiated by artificially-generated energy sources.Non-Imaging ( ex: microwave radiometer, microwave altimeter, laser)
Imaging (Real Aperture Radar, SyntheticAperture Radar)
RADAR: Radio Detection and Ranging
SLAR: Side Looking Airborne Radar, developed during the World War II, for allweather and day and night aircraft operations over land and sea,
SAR: Synthetic Aperture Radar, airborne systems developed in 1950’s
SAR: Active microwave imaging system
September 3, 2007 Lecture D1La1 Introduction to SAR remote sensing Thuy Le Toan
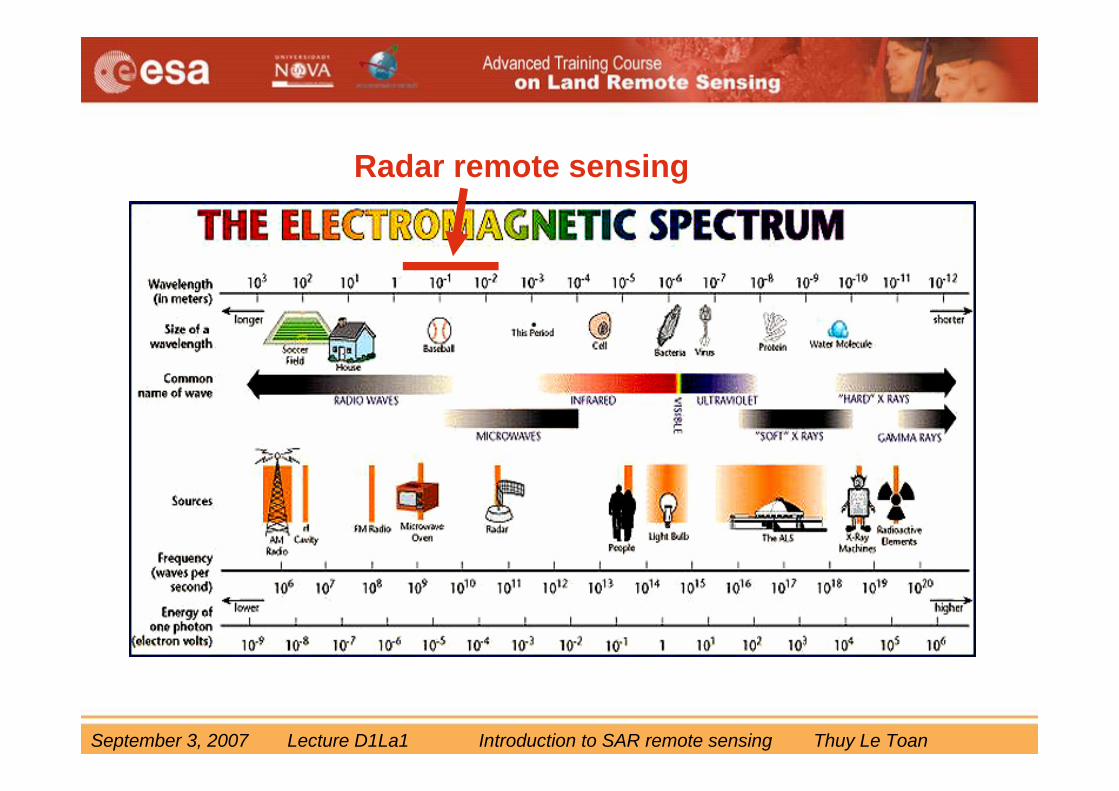
Radar remote sensing
September 3, 2007 Lecture D1La1 Introduction to SAR remote sensing Thuy Le Toan
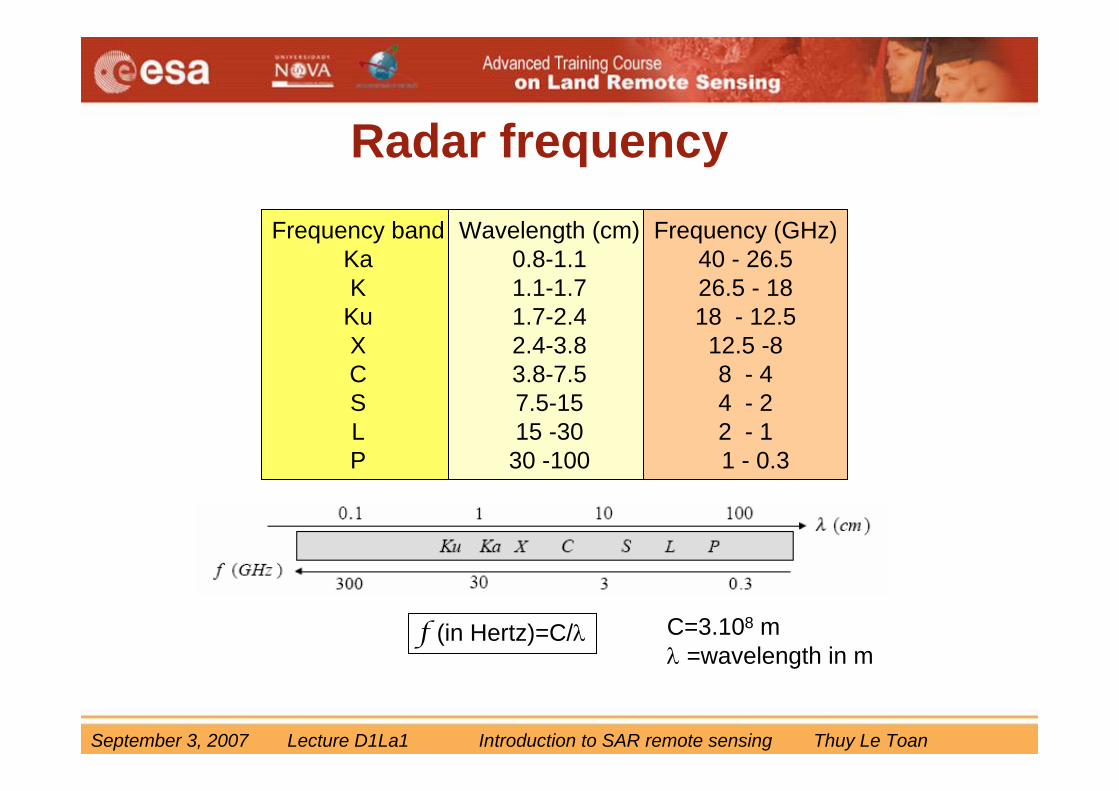
Frequency bandKaKKuXCSLP
Wavelength (cm)0.8-1.11.1-1.71.7-2.42.4-3.83.8-7.57.5-1515 -30
30 -100
Frequency (GHz)40 - 26.526.5 - 1818 - 12.512.5 -88 - 44 - 22 - 11 - 0.3
Radar frequency
f (in Hertz)=C/λ C=3.108 mλ =wavelength in m
September 3, 2007 Lecture D1La1 Introduction to SAR remote sensing Thuy Le Toan
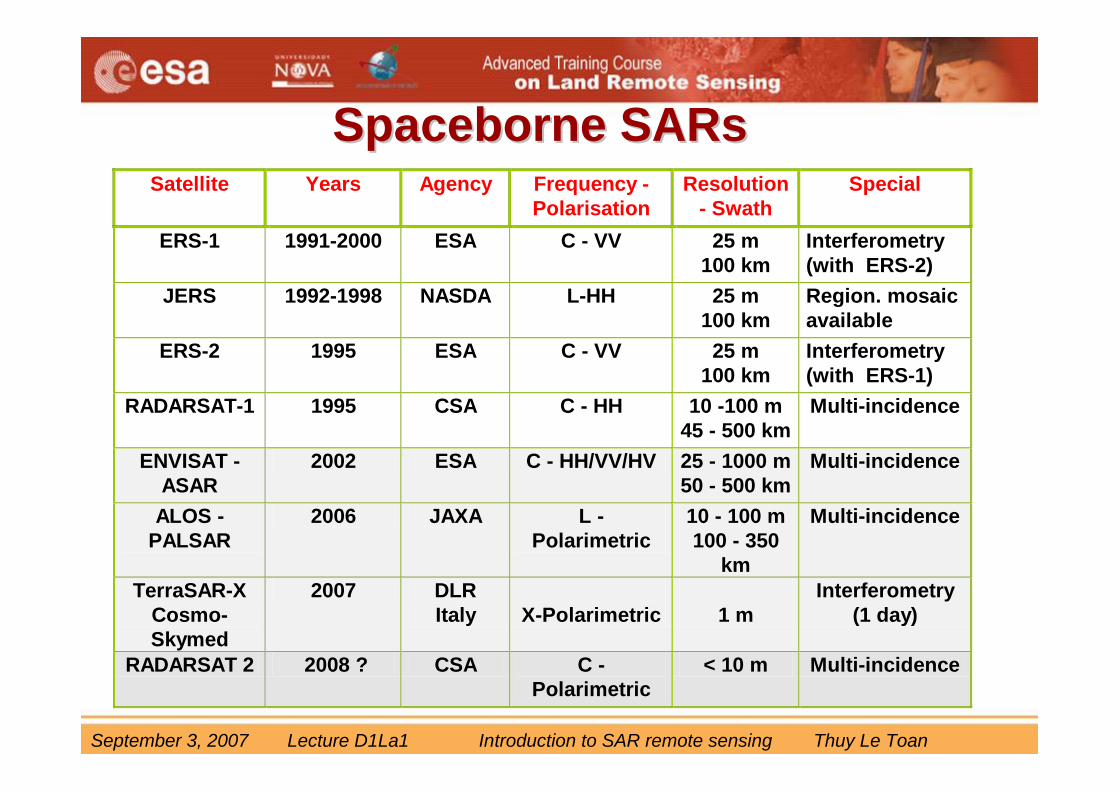
SpaceborneSpaceborne SARsSARsSatellite Years Agency Frequency -
Polarisation Resolution
- Swath Special
ERS-1 1991-2000 ESA C - VV
25 m 100 km
Interferometry (with ERS-2)
JERS 1992-1998 NASDA L-HH 25 m 100 km
Region. mosaic available
ERS-2 1995 ESA
C - VV
25 m 100 km
Interferometry (with ERS-1)
RADARSAT-1 1995 CSA C - HH 10 -100 m 45 - 500 km
Multi-incidence
ENVISAT - ASAR
2002 ESA C - HH/VV/HV 25 - 1000 m50 - 500 km
Multi-incidence
ALOS - PALSAR
2006 JAXA L - Polarimetric
10 - 100 m 100 - 350
km
Multi-incidence
TerraSAR-X Cosmo-Skymed
2007 DLR Italy
X-Polarimetric
1 m
Interferometry (1 day)
RADARSAT 2 2008 ? CSA C - Polarimetric
< 10 m Multi-incidence
September 3, 2007 Lecture D1La1 Introduction to SAR remote sensing Thuy Le Toan
Characteristics of radar remote sensingAdvantages compared to optical remote sensing
all weather capability (small sensitivity of clouds, light rain)
day and night operation (independence of sun illumination)
no effects of atmospheric constituents (multitemporal analysis)
sensitivity to dielectric properties (water content , biomass, ice)
sensitivity to surface roughness ( ocean wind speed)
accurate measurements of distance (interferometry)
sensitivity to man made objects
sensitivity to target structure (use of polarimetry)
subsurface penetration

September 3, 2007 Lecture D1La1 Introduction to SAR remote sensing Thuy Le Toan
Characteristics of radar remote sensing
Inconvenients
complex interactions (difficulty in understanding, complex processing)
speckle effects (difficulty in visual interpretation)
topograhic effects
effect of surface roughness
September 3, 2007 Lecture D1La1 Introduction to SAR remote sensing Thuy Le Toan
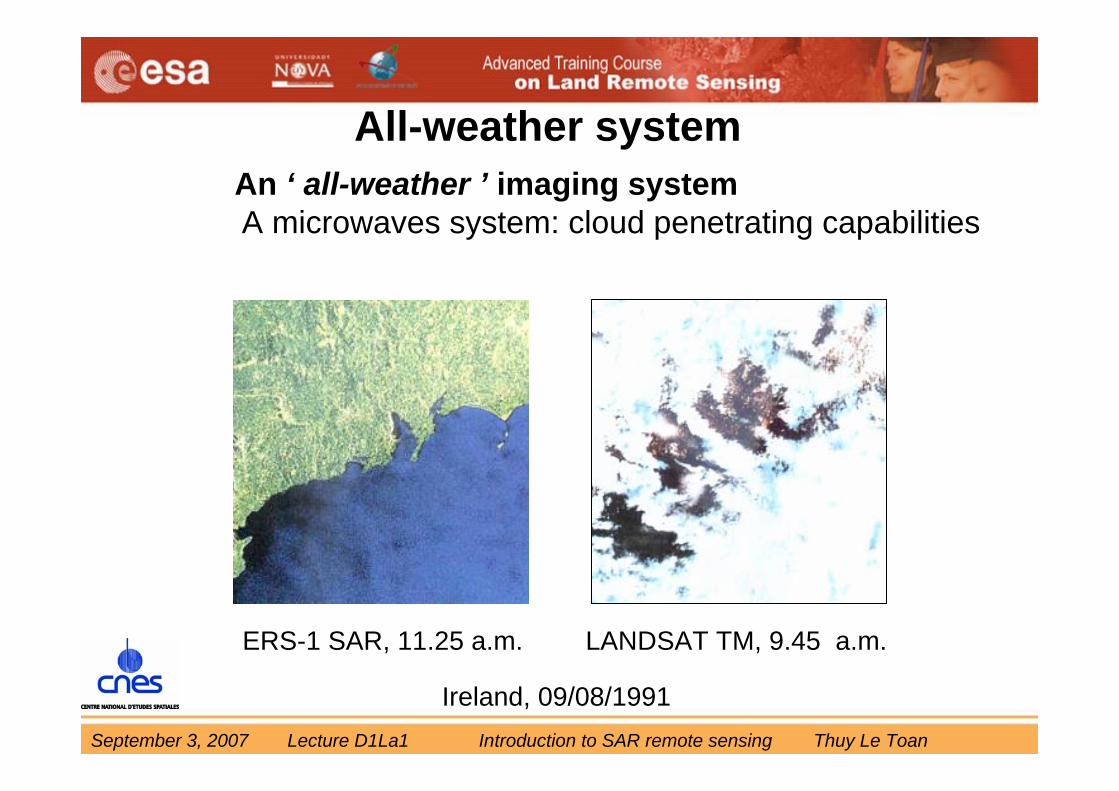
All-weather system
ERS-1 SAR, 11.25 a.m. LANDSAT TM, 9.45 a.m.
Ireland, 09/08/1991
An ‘ all-weather ’ imaging systemA microwaves system: cloud penetrating capabilities
September 3, 2007 Lecture D1La1 Introduction to SAR remote sensing Thuy Le Toan
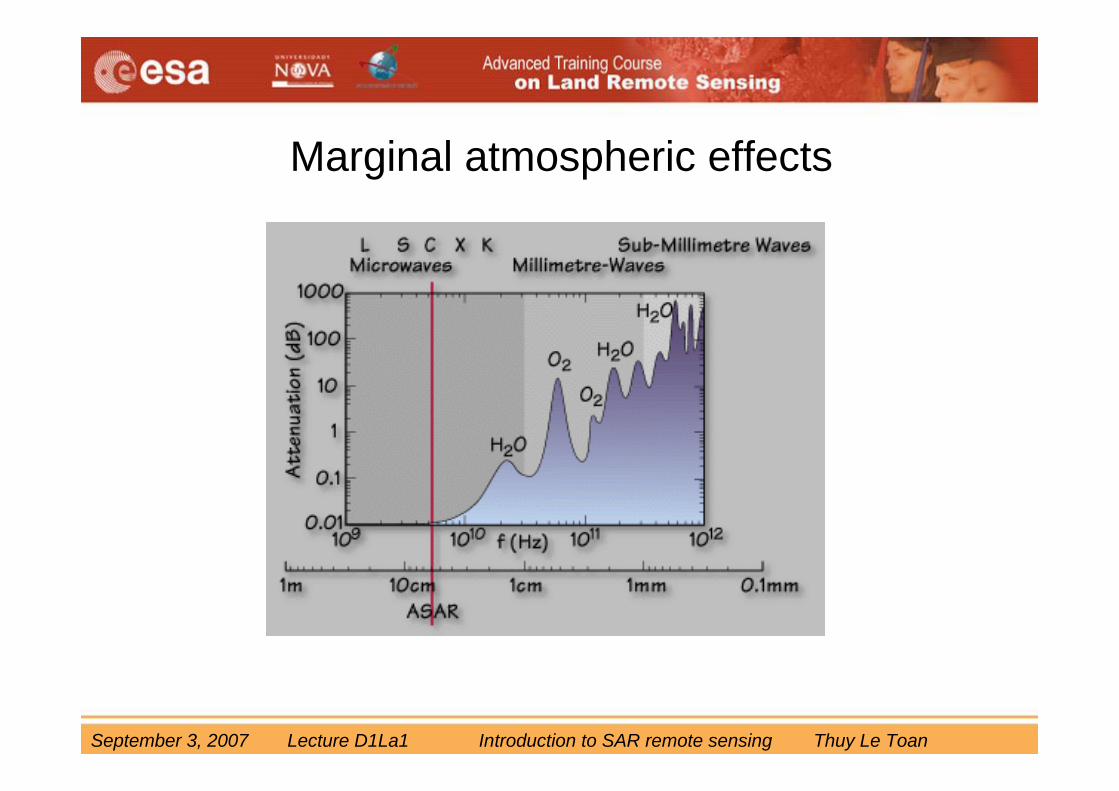
Marginal atmospheric effects
September 3, 2007 Lecture D1La1 Introduction to SAR remote sensing Thuy Le Toan
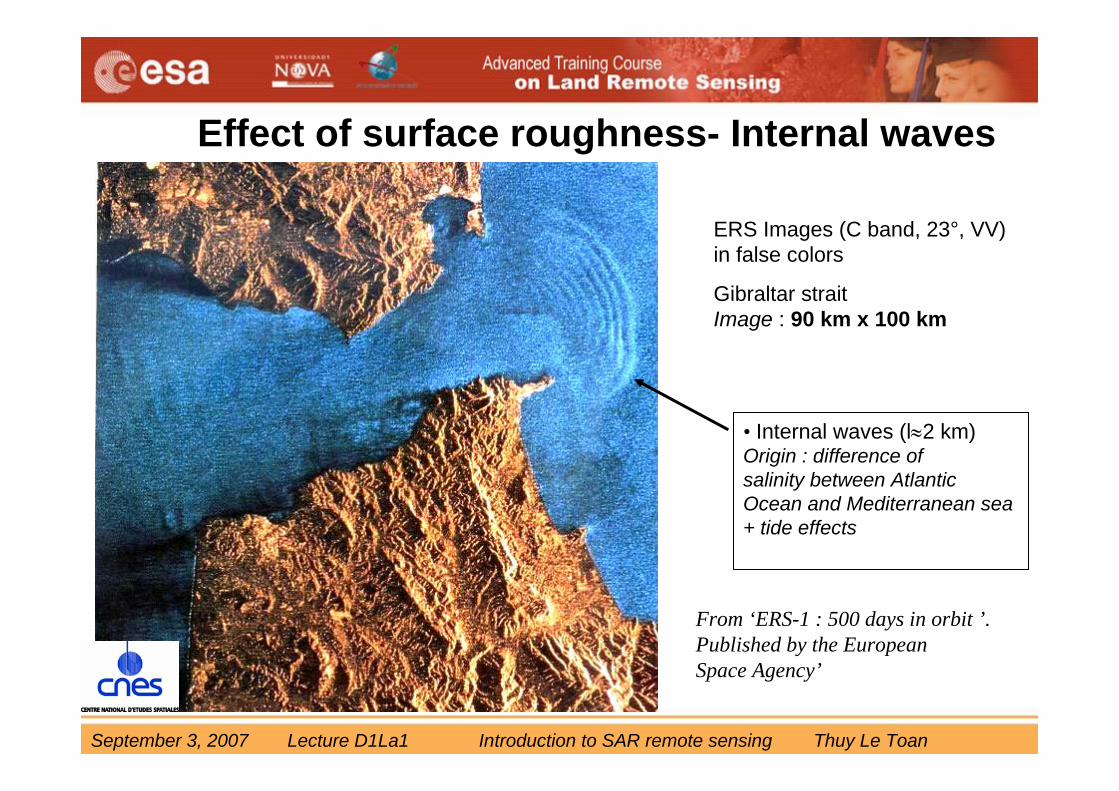
From ‘ERS-1 : 500 days in orbit ’. Published by the European Space Agency’
ERS Images (C band, 23°, VV)in false colors
Gibraltar straitImage : 90 km x 100 km
• Internal waves (l≈2 km) Origin : difference ofsalinity between Atlantic Ocean and Mediterranean sea + tide effects
Effect of surface roughness- Internal waves
September 3, 2007 Lecture D1La1 Introduction to SAR remote sensing Thuy Le Toan
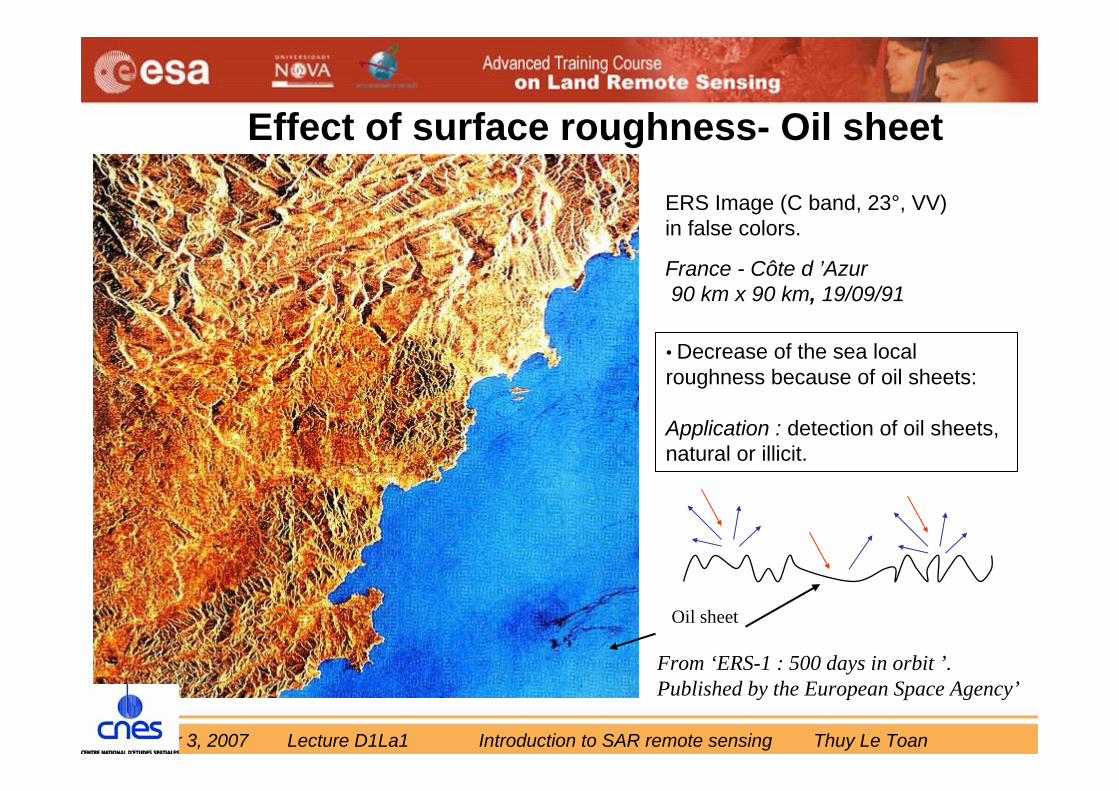
From ‘ERS-1 : 500 days in orbit ’. Published by the European Space Agency’
France - Côte d ’Azur90 km x 90 km, 19/09/91
Oil sheet
• Decrease of the sea local roughness because of oil sheets:
Application : detection of oil sheets, natural or illicit.
ERS Image (C band, 23°, VV)in false colors.
Effect of surface roughness- Oil sheet
September 3, 2007 Lecture D1La1 Introduction to SAR remote sensing Thuy Le Toan
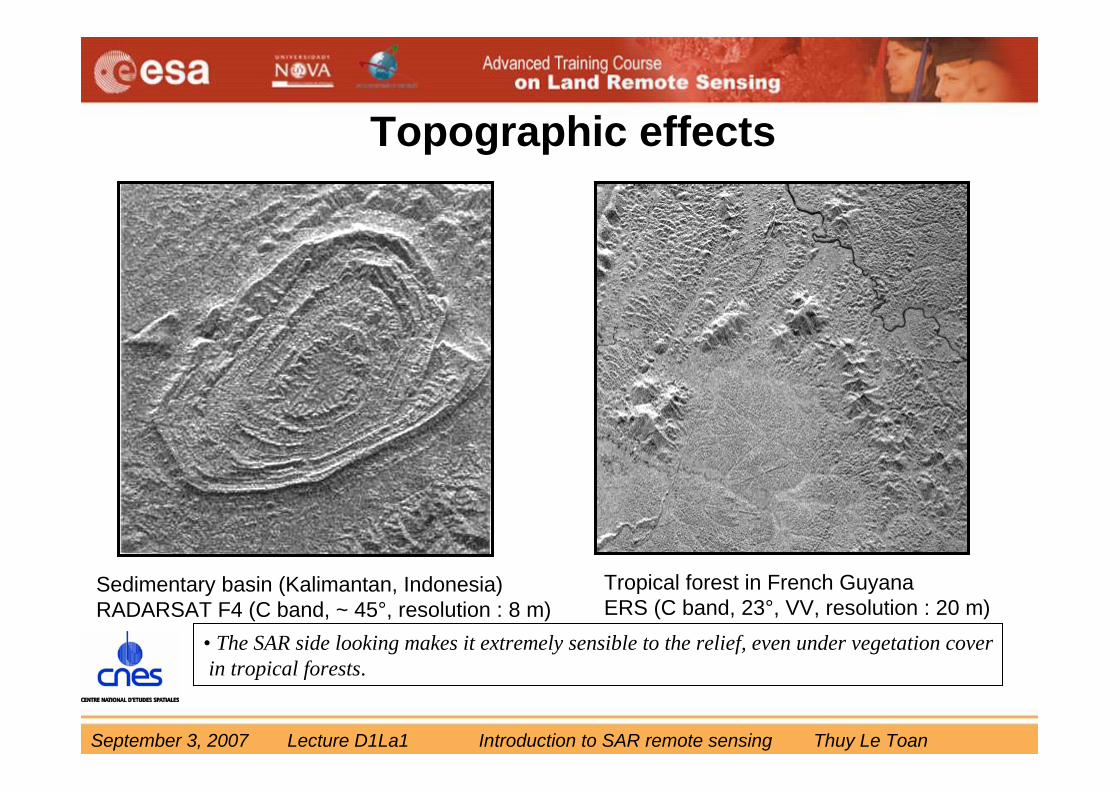
• The SAR side looking makes it extremely sensible to the relief, even under vegetation coverin tropical forests.
Sedimentary basin (Kalimantan, Indonesia)RADARSAT F4 (C band, ~ 45°, resolution : 8 m)
Tropical forest in French GuyanaERS (C band, 23°, VV, resolution : 20 m)
Topographic effects
September 3, 2007 Lecture D1La1 Introduction to SAR remote sensing Thuy Le Toan
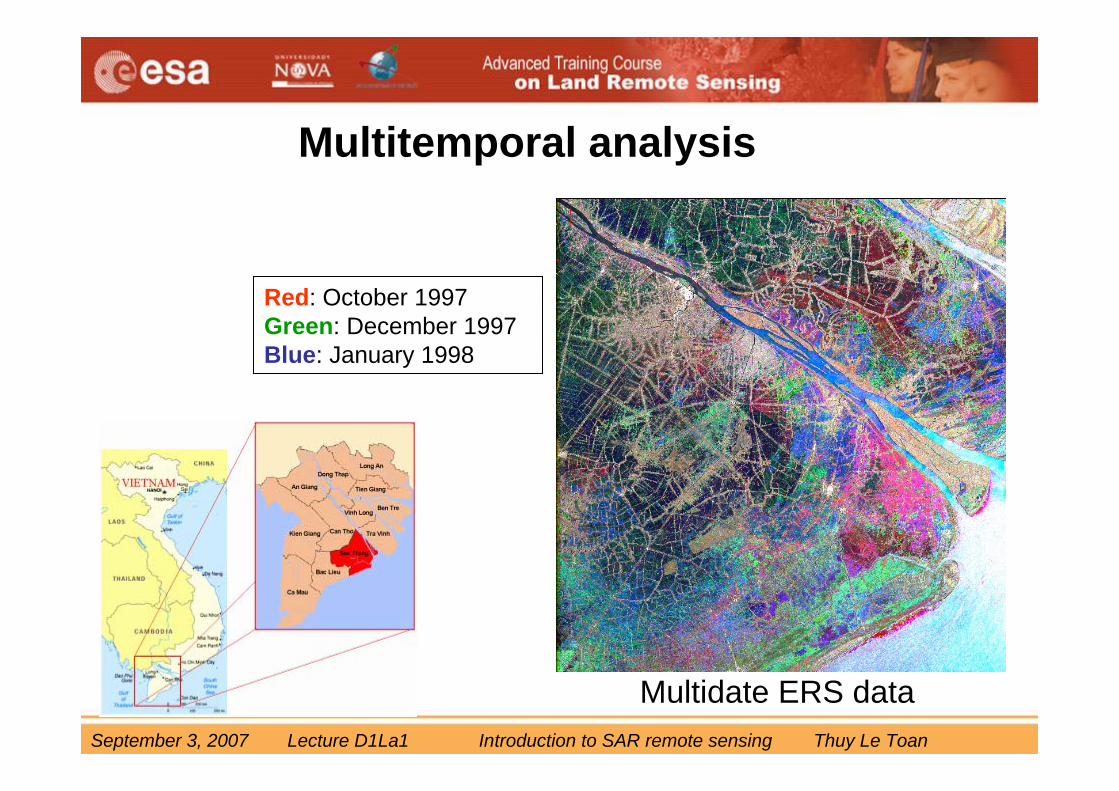
Multitemporal analysis
Multidate ERS data
Red: October 1997Green: December 1997Blue: January 1998
September 3, 2007 Lecture D1La1 Introduction to SAR remote sensing Thuy Le Toan
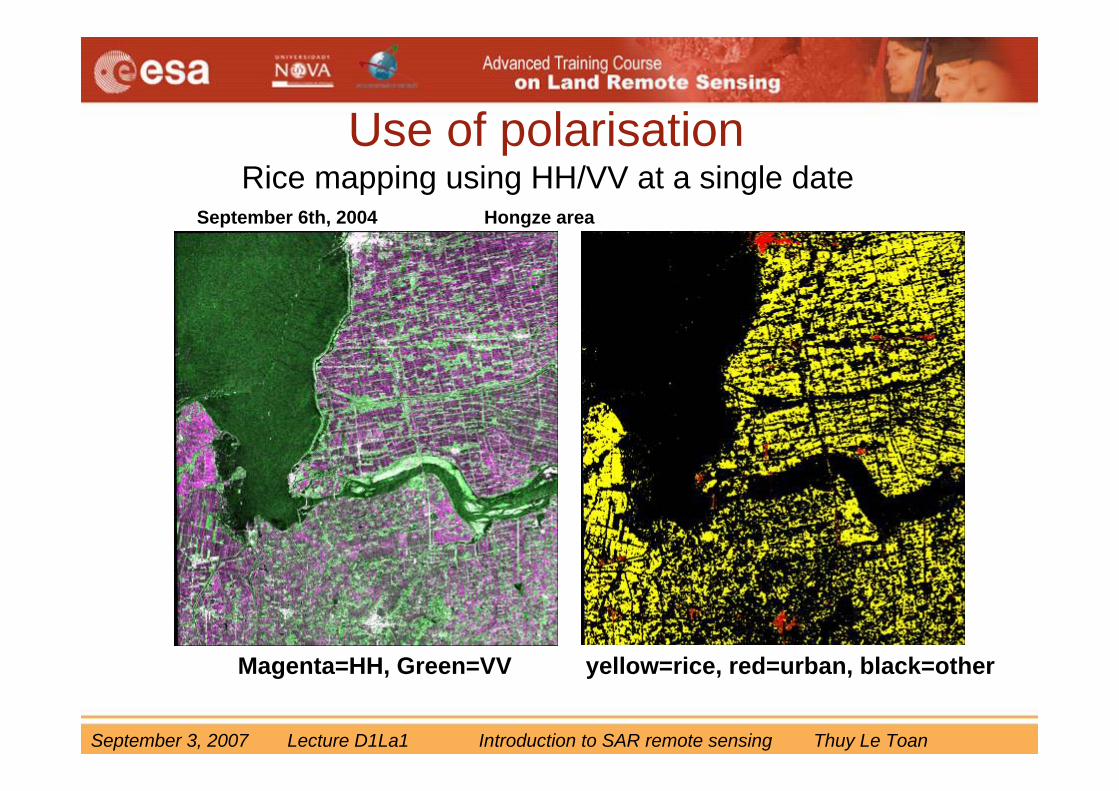
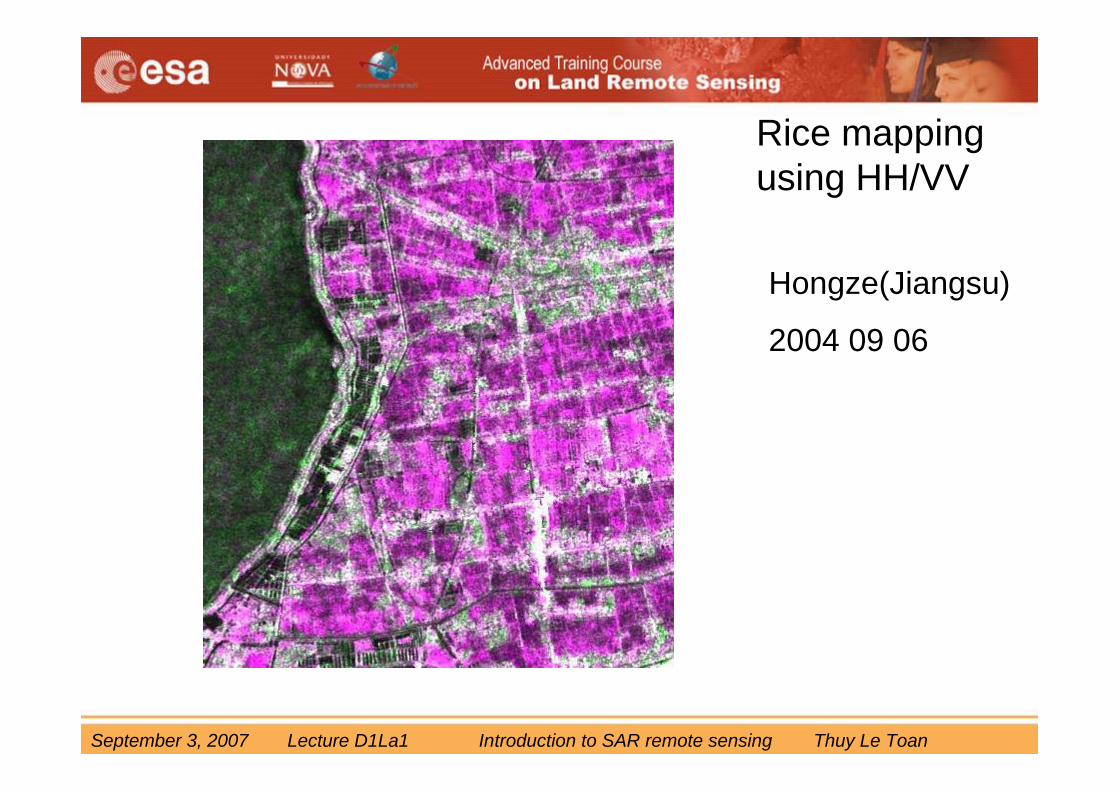
Magenta=HH, Green=VV
September 6th, 2004 Hongze area
yellow=rice, red=urban, black=other
Rice mapping using HH/VV at a single dateUse of polarisation
September 3, 2007 Lecture D1La1 Introduction to SAR remote sensing Thuy Le Toan
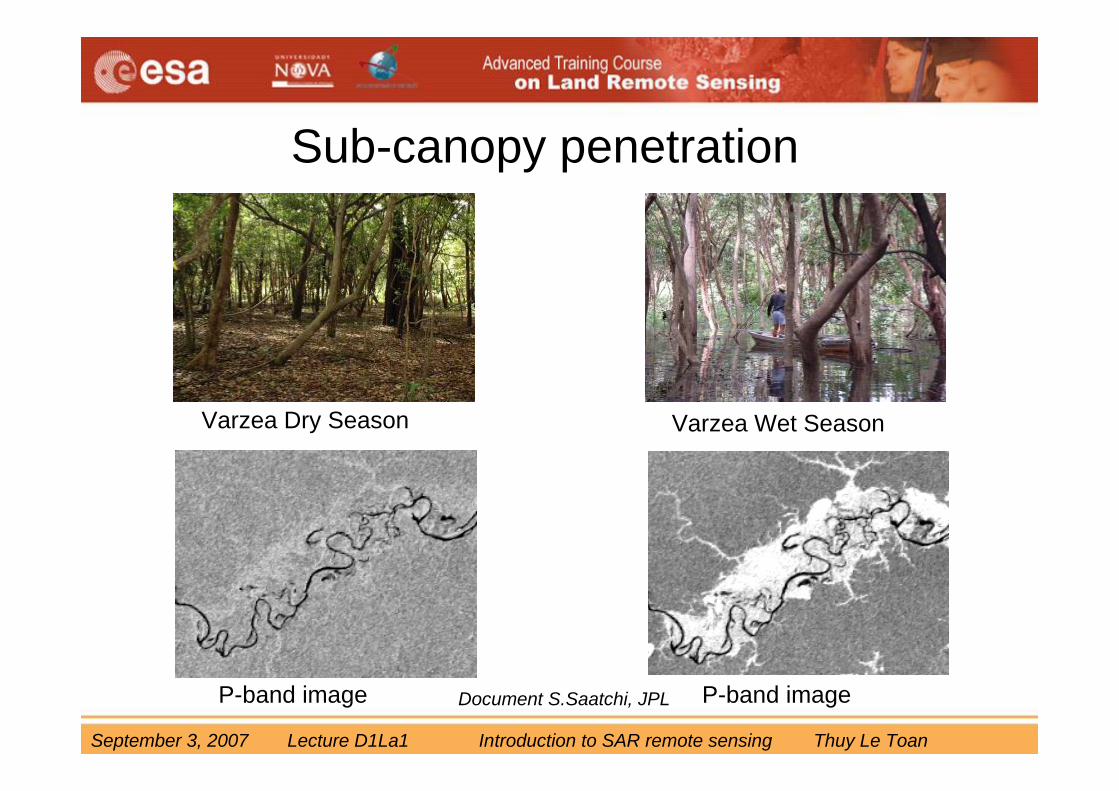
Varzea Dry Season Varzea Wet Season
P-band image P-band image
Sub-canopy penetration
Document S.Saatchi, JPL

September 3, 2007 Lecture D1La1 Introduction to SAR remote sensing Thuy Le Toan
Subsurface penetration
L-band
Document P. Paillou

September 3, 2007 Lecture D1La1 Introduction to SAR remote sensing Thuy Le Toan
Tree height inversion using Polarimetric Interferometry (PolinSAR)
Phas
e C
entre
hei
ght(
m)
Tree height
Ground level
HV
VVHH
Phas
e C
entre
hei
ght(
m)
Tree height
Ground level
HV
VVHH
Garestier, 2006
September 3, 2007 Lecture D1La1 Introduction to SAR remote sensing Thuy Le Toan
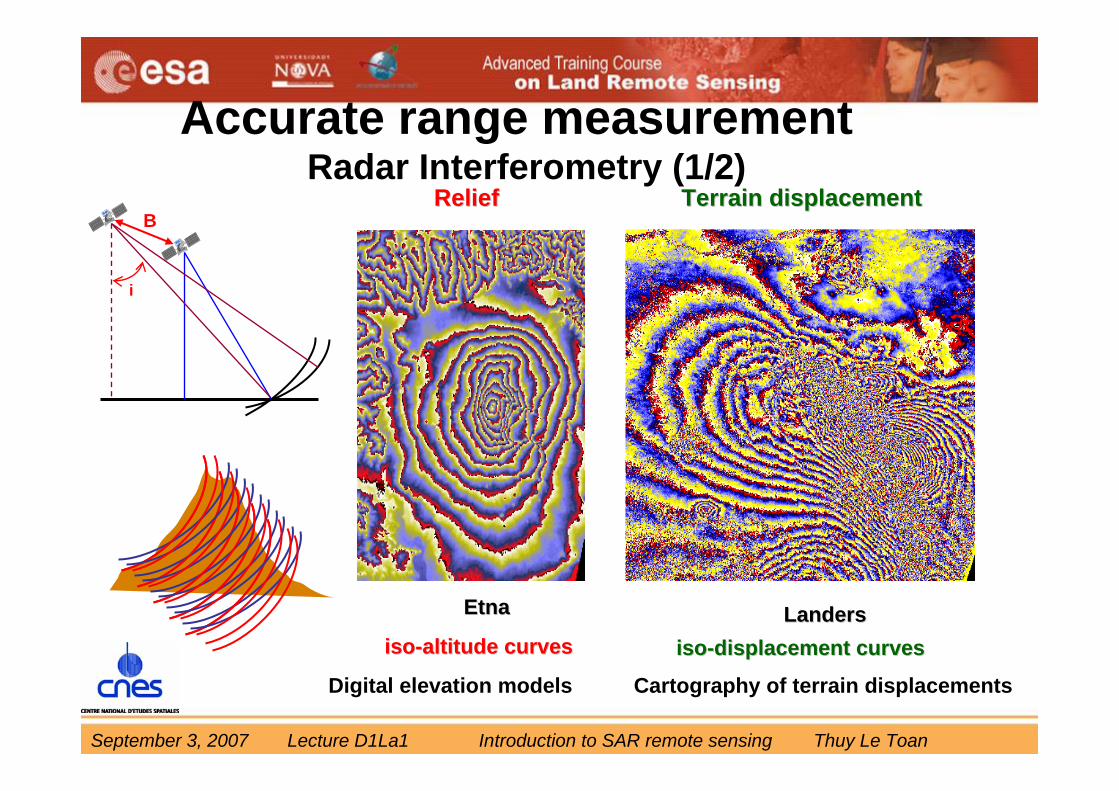
ReliefRelief Terrain displacementTerrain displacement
isoiso--displacement curvesdisplacement curvesisoiso--altitude curvesaltitude curves
EtnaEtna LandersLanders
i
B
Digital elevation models Cartography of terrain displacements
Accurate range measurementRadar Interferometry (1/2)

September 3, 2007 Lecture D1La1 Introduction to SAR remote sensing Thuy Le Toan
• Impact of a geothermal plant on the environment. Interferogram processed from two ERS images, acquired at two years interval. The fringes characterize the ground subsidence around the plant. One observe a subsidence of about 6 cm (2 fringes) which covers 17km x 8km.
ERS intensity image Interferogramme
Mesa, USA/ Mexico border
Radar Interferometry (2/2)
ERS Interferometry

September 3, 2007 Lecture D1La1 Introduction to SAR remote sensing Thuy Le Toan
• Introduction to radar remote sensing• The Synthetic Aperture Radar• Geometric properties of SAR images • Statistic properties of SAR measurements• Physical content of SAR data
Contents
September 3, 2007 Lecture D1La1 Introduction to SAR remote sensing Thuy Le Toan
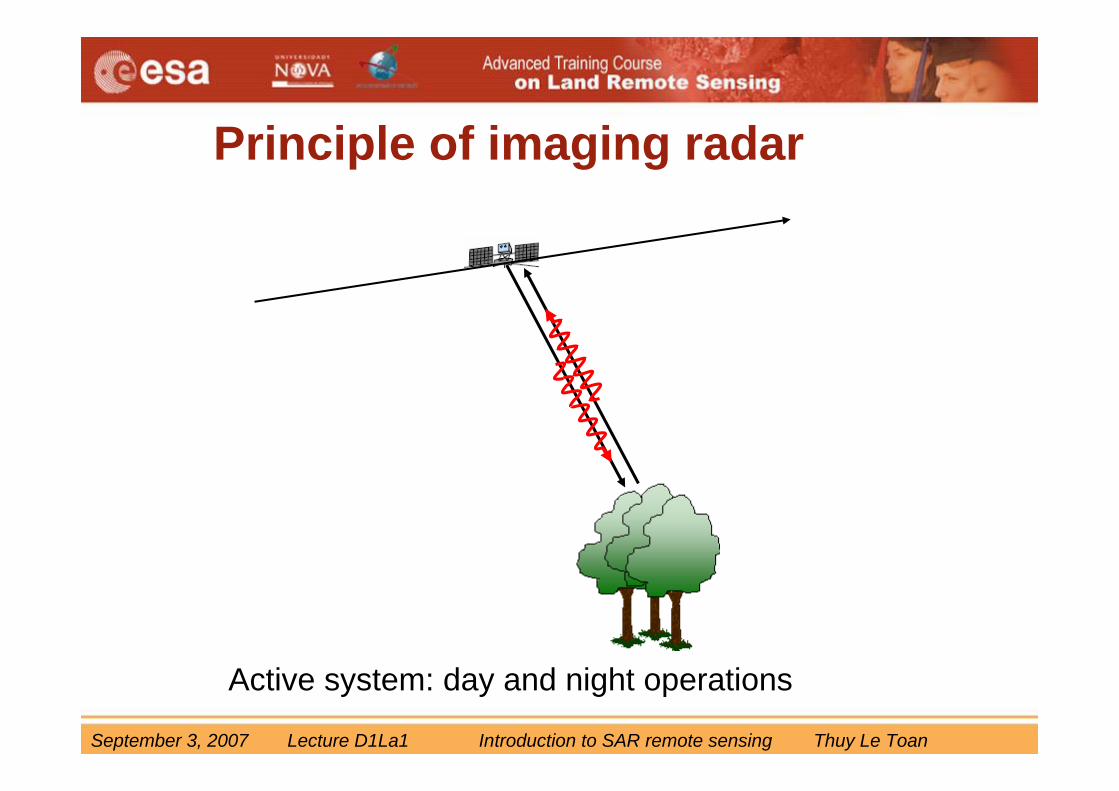
Active system: day and night operations
Principle of imaging radar
September 3, 2007 Lecture D1La1 Introduction to SAR remote sensing Thuy Le Toan
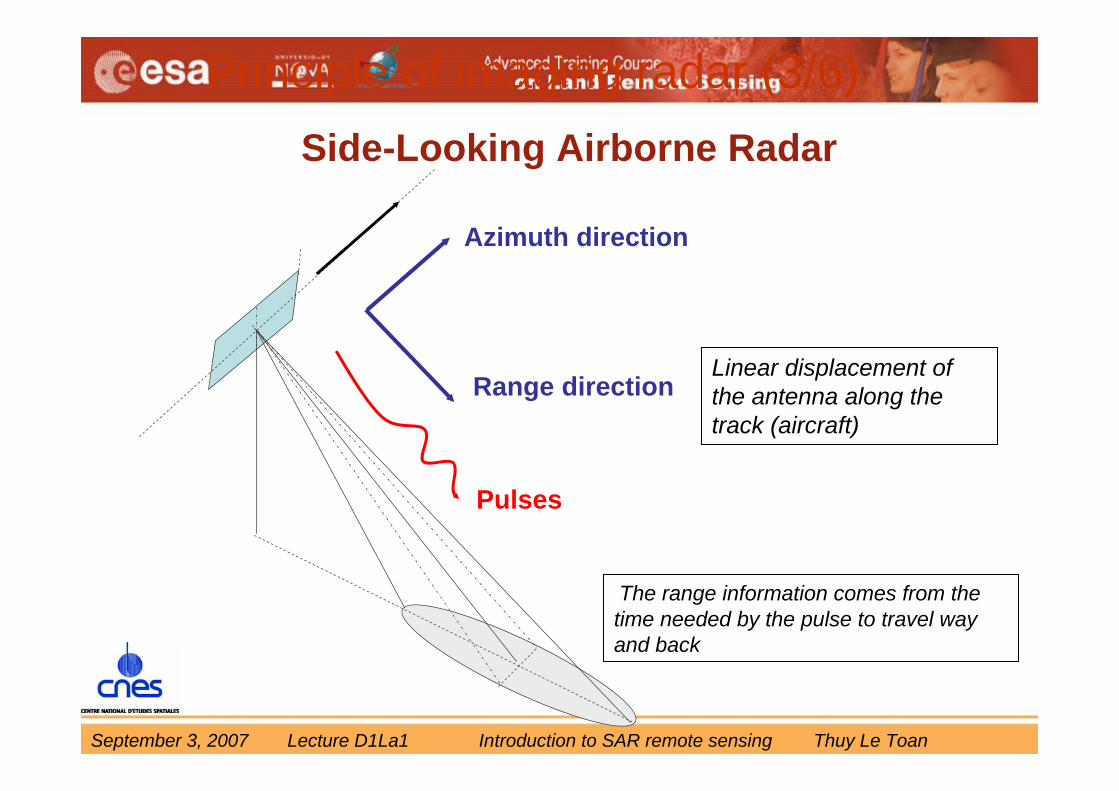
Side-Looking Airborne Radar
Linear displacement of the antenna along the track (aircraft)
Azimuth direction
Range direction
Pulses
Principle of imaging radar (3/6)
The range information comes from the time needed by the pulse to travel way and back
September 3, 2007 Lecture D1La1 Introduction to SAR remote sensing Thuy Le Toan
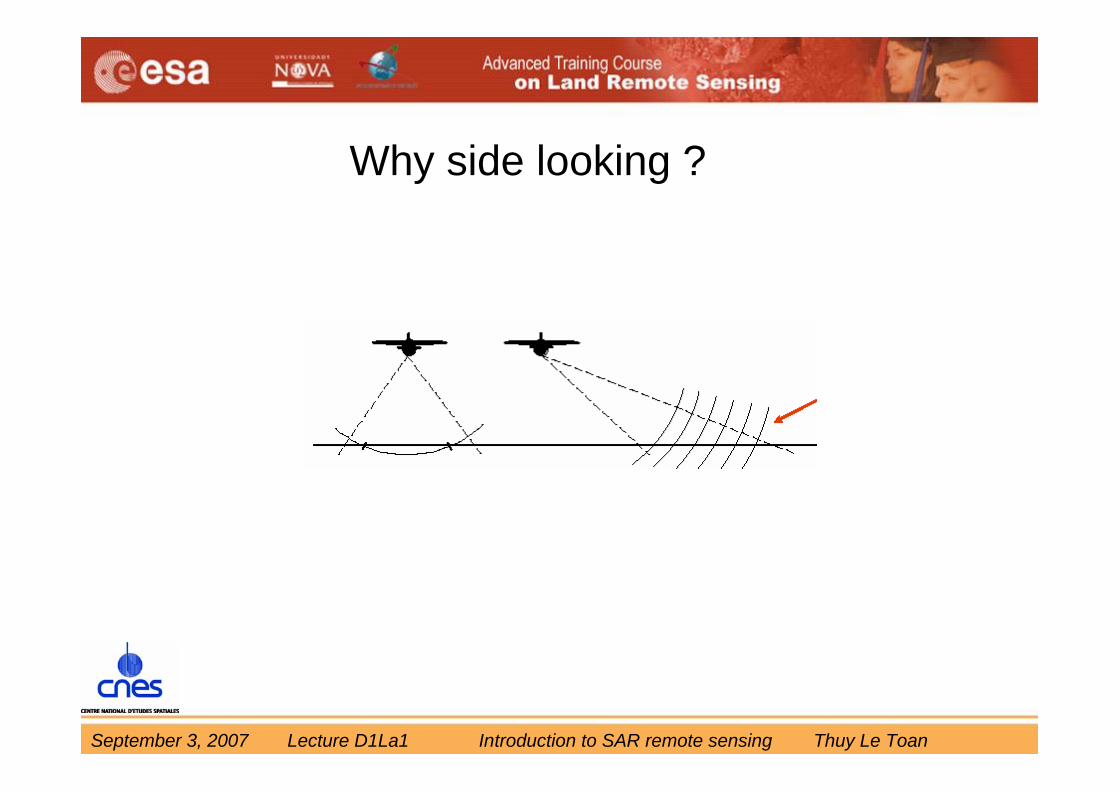
Why side looking ?
September 3, 2007 Lecture D1La1 Introduction to SAR remote sensing Thuy Le Toan
L
θ
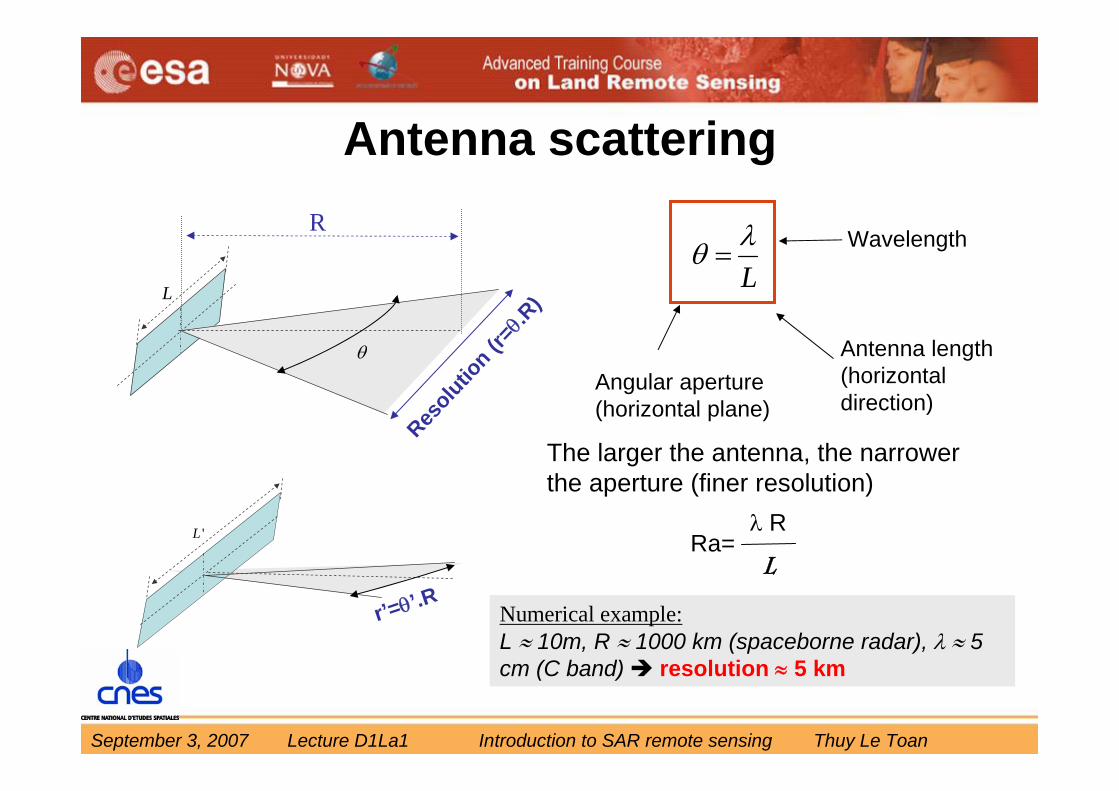
The larger the antenna, the narrower the aperture (finer resolution)
'L
Antenna scattering
Resolutio
n (r=θ.R
)
R
Numerical example:L ≈ 10m, R ≈ 1000 km (spaceborne radar), λ ≈ 5 cm (C band) resolution ≈ 5 km
Angular aperture(horizontal plane)
Lλθ =
Antenna length (horizontal direction)
Wavelength
r’=θ’.R
Ra=λ R
L
September 3, 2007 Lecture D1La1 Introduction to SAR remote sensing Thuy Le Toan
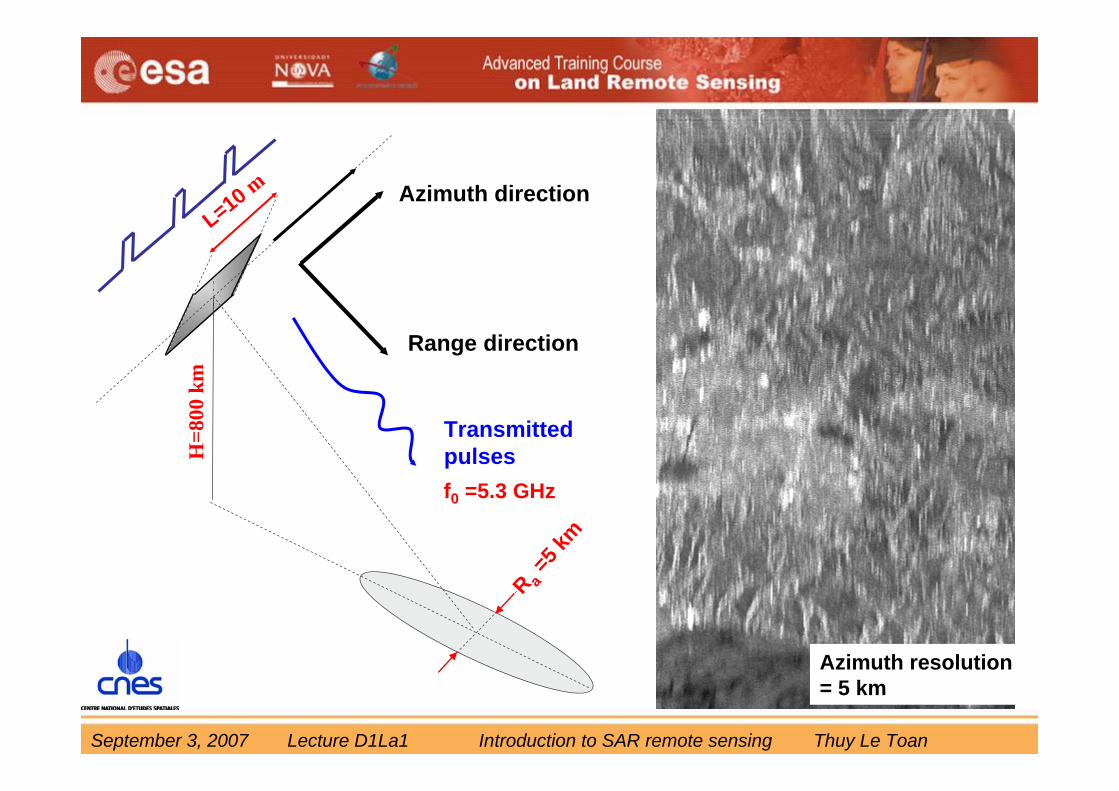
Azimuth direction
Range direction
TransmittedpulsesH
=800
km
R a=5
km
L=10 m
f0 =5.3 GHz
Azimuth resolution= 5 km

September 3, 2007 Lecture D1La1 Introduction to SAR remote sensing Thuy Le Toan
Synthetic aperture technique • An array of antennas is equivalent to a single antenna moving
along the flight line LS if the received signals are coherently recordedand added, and the target assumed to be static during the period
XnX2X1
P
LS
The echoes from X1, X2, ..Xnare recorded coherently (amplitudeAnd phase as a function of time)
Ra=λ RR
Azimuth resolution
Finest resolution: Ra=L
2LS
LS
September 3, 2007 Lecture D1La1 Introduction to SAR remote sensing Thuy Le Toan
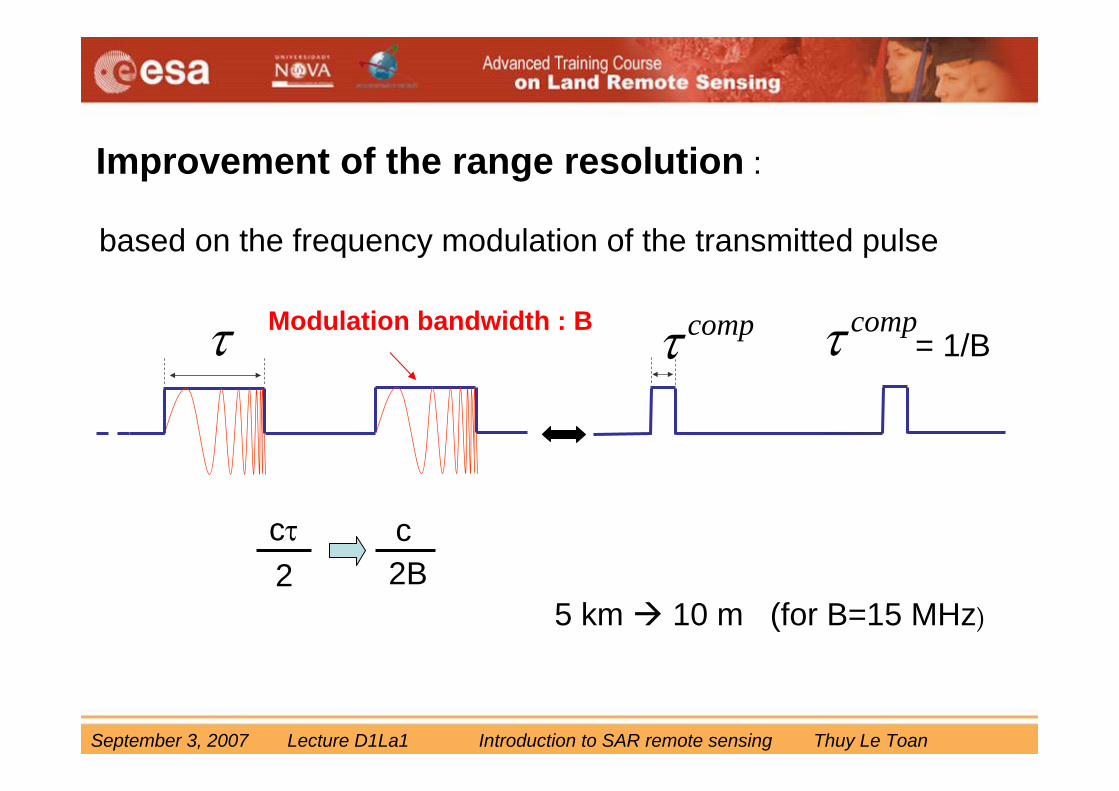
Improvement of the range resolution :
based on the frequency modulation of the transmitted pulse
5 km 10 m (for B=15 MHz)
τ Modulation bandwidth : B compτ compτ = 1/B
cτ2
c2B

September 3, 2007 Lecture D1La1 Introduction to SAR remote sensing Thuy Le Toan
The SAR image
Satellite orbit
Ground range
Azimuth
Look angleOff nadir Slant range

September 3, 2007 Lecture D1La1 Introduction to SAR remote sensing Thuy Le Toan
Azi
mut
h
Raw data Detected imageAfter range compression
September 3, 2007 Lecture D1La1 Introduction to SAR remote sensing Thuy Le Toan
• Introduction to radar remote sensing• The Synthetic Aperture Radar• Geometric properties of SAR images• Statistic properties of SAR measurements• Physical content of SAR data
Contents
September 3, 2007 Lecture D1La1 Introduction to SAR remote sensing Thuy Le Toan
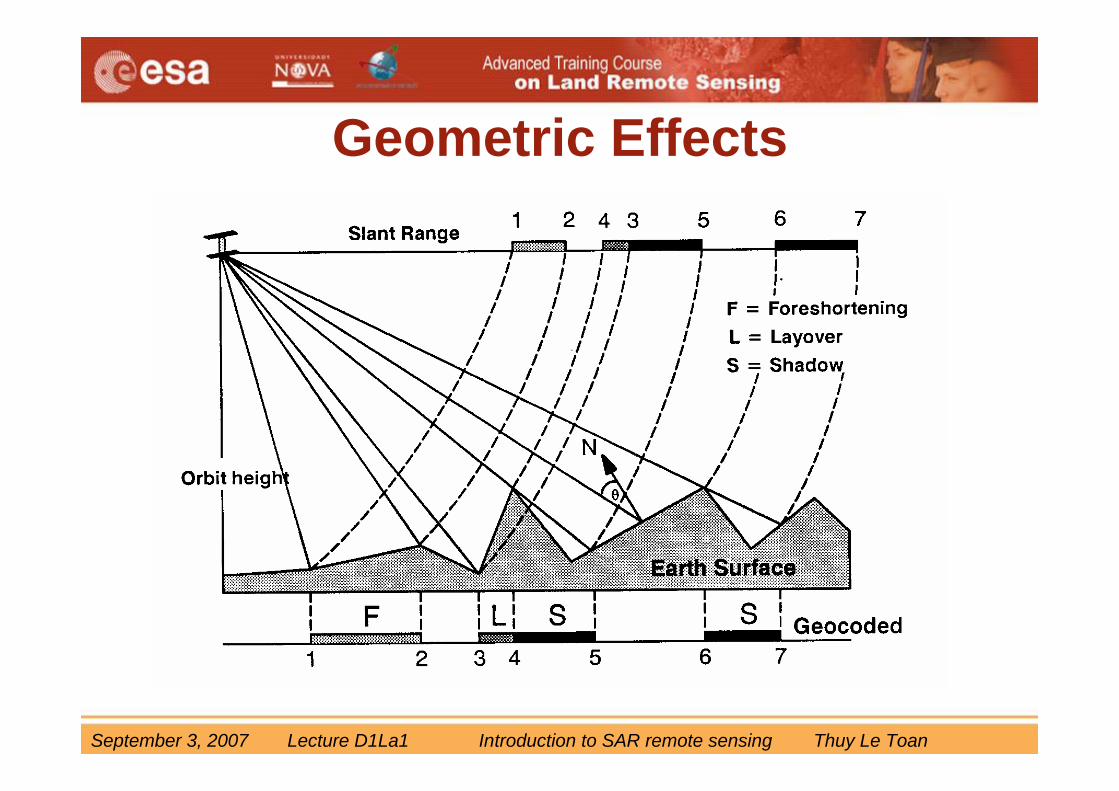
Geometric Effects
September 3, 2007 Lecture D1La1 Introduction to SAR remote sensing Thuy Le Toan
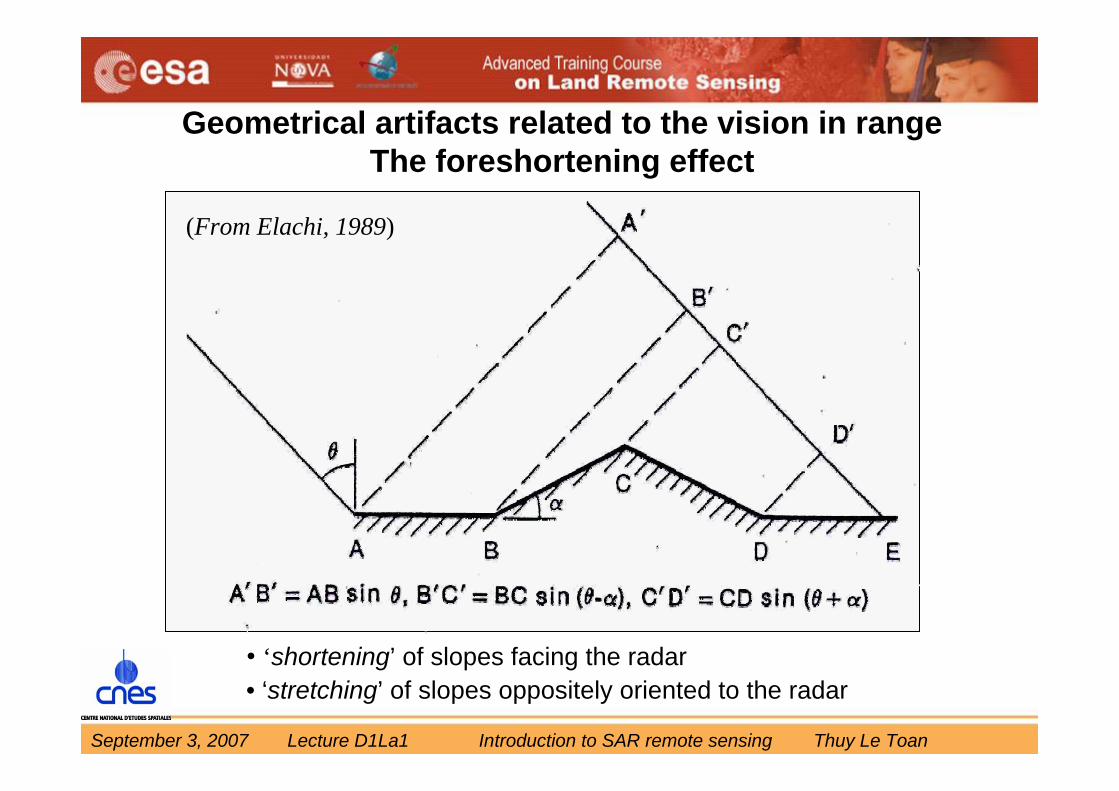
• ‘shortening’ of slopes facing the radar• ‘stretching’ of slopes oppositely oriented to the radar
Geometrical artifacts related to the vision in rangeThe foreshortening effect
(From Elachi, 1989)
September 3, 2007 Lecture D1La1 Introduction to SAR remote sensing Thuy Le Toan
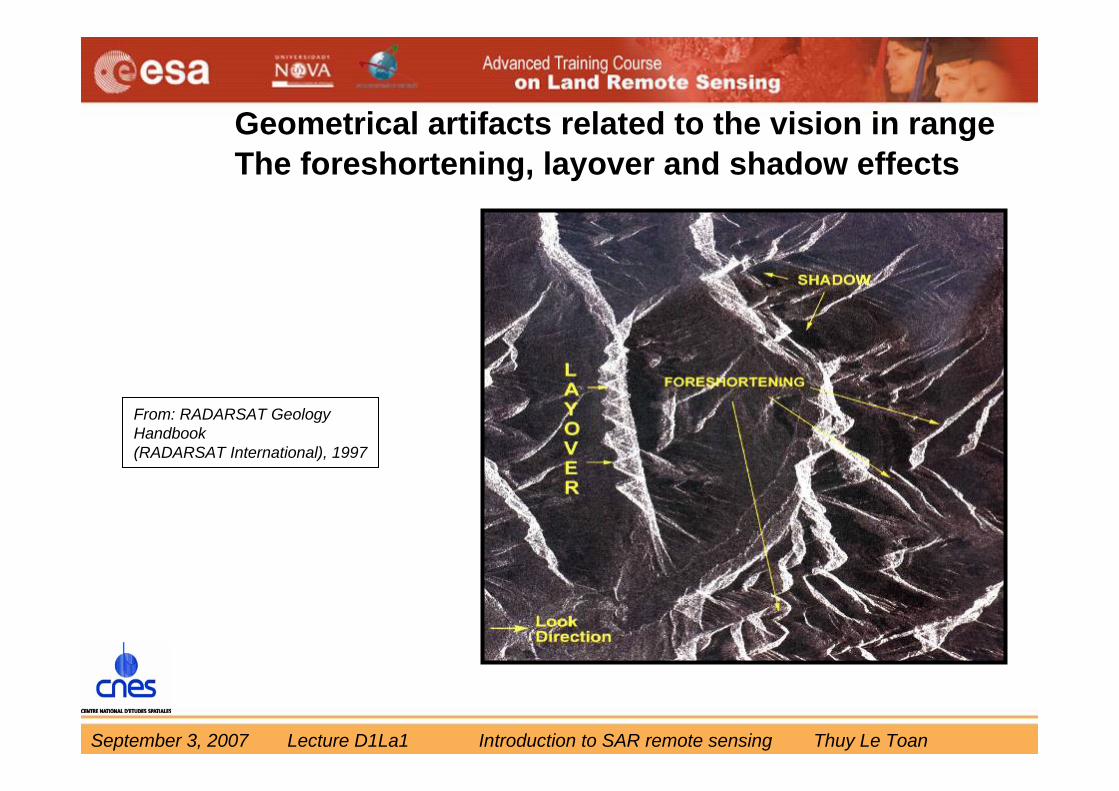
From: RADARSAT Geology Handbook(RADARSAT International), 1997
Geometrical artifacts related to the vision in rangeThe foreshortening, layover and shadow effects

September 3, 2007 Lecture D1La1 Introduction to SAR remote sensing Thuy Le Toan
• Introduction to radar remote sensing• Synthetic Aperture Radar• Geometric properties of SAR images • Statistic properties of SAR measurements• Physical content of SAR data
Contents
September 3, 2007 Lecture D1La1 Introduction to SAR remote sensing Thuy Le Toan
Basic measurement
The basic measurement made by a SAR is S (amplitude and phase). This is the complex image.
Main types of images:
A is the amplitude image.I = A2 is the intensity image.(the phase of a single image is not exploitable)
September 3, 2007 Lecture D1La1 Introduction to SAR remote sensing Thuy Le Toan
Exploitation of multiple images: multi temporal, polarisation, incidence, (frequency)
polarimetric images derived from S the complex image if the SAR system is polarimetric
interferometric images(coherence, phase) derived from S
multi polarisation intensity images
multitemporal intensity images
ASAR repeat pass
ASAR dual pol
ASAR
Measurements from multiple images
September 3, 2007 Lecture D1La1 Introduction to SAR remote sensing Thuy Le Toan
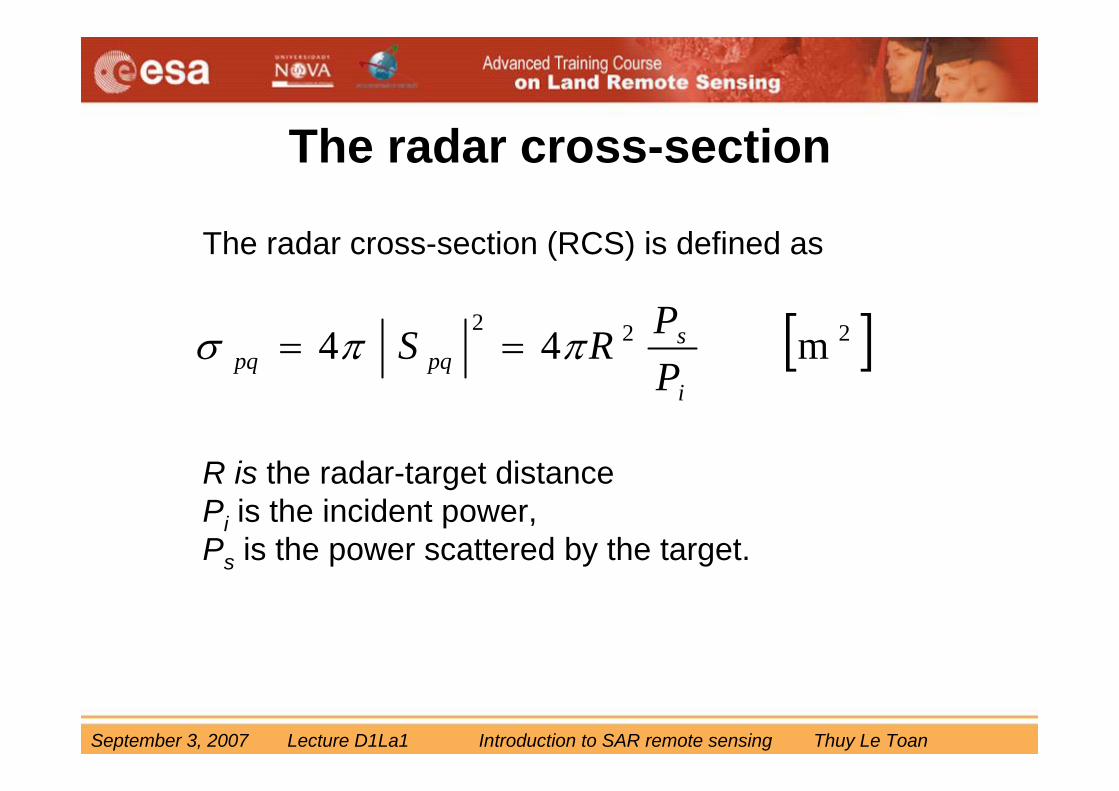
The radar cross-section
The radar cross-section (RCS) is defined as
R is the radar-target distancePi is the incident power, Ps is the power scattered by the target.
[ ]222m44
i
spqpq P
PRS ππσ ==
September 3, 2007 Lecture D1La1 Introduction to SAR remote sensing Thuy Le Toan
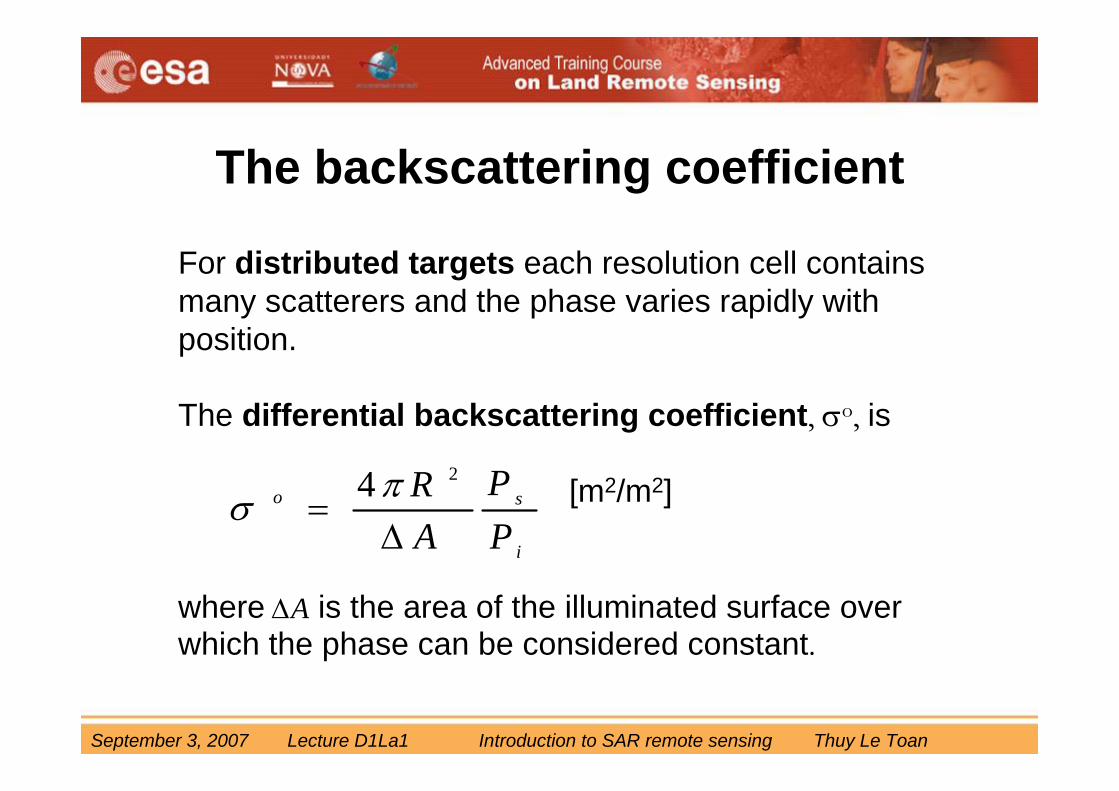
The backscattering coefficient
For distributed targets each resolution cell contains many scatterers and the phase varies rapidly with position.
The differential backscattering coefficient, σo, is
[m2/m2]
where is the area of the illuminated surface over which the phase can be considered constant.
i
so
PP
AR
Δ=
24 πσ
AΔ
September 3, 2007 Lecture D1La1 Introduction to SAR remote sensing Thuy Le Toan
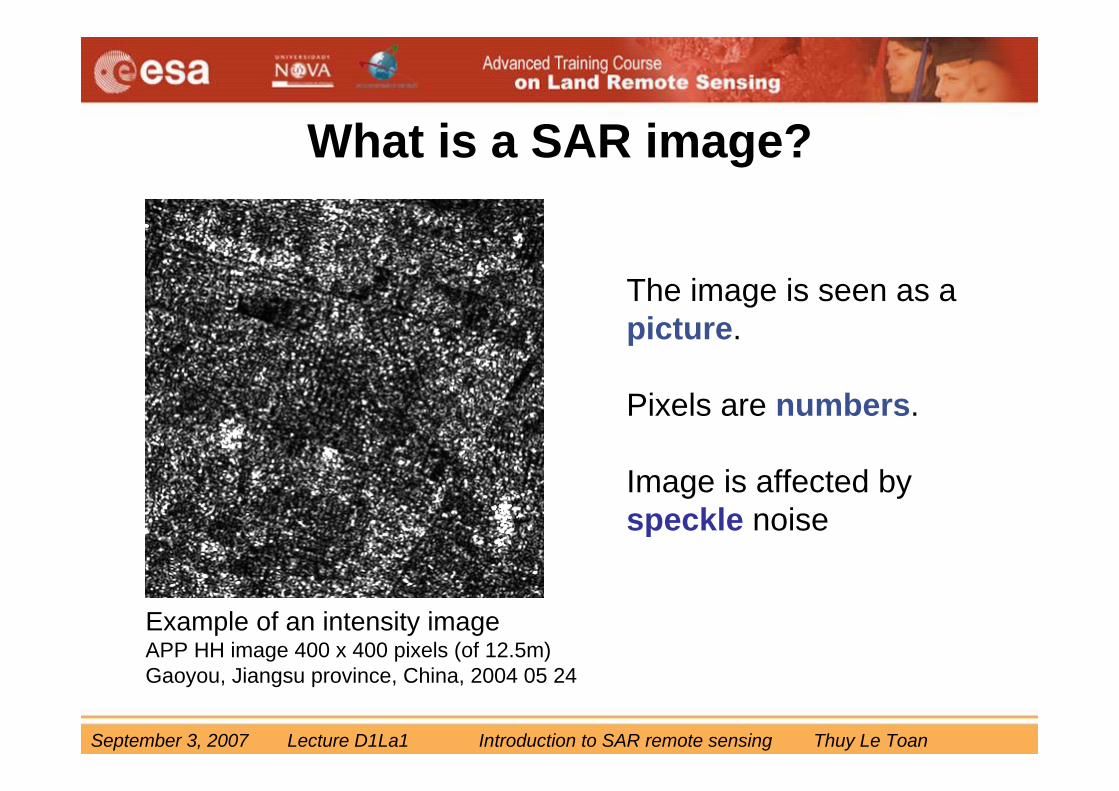
What is a SAR image?
The image is seen as a picture.
Pixels are numbers.
Image is affected by speckle noise
Example of an intensity imageAPP HH image 400 x 400 pixels (of 12.5m)Gaoyou, Jiangsu province, China, 2004 05 24
September 3, 2007 Lecture D1La1 Introduction to SAR remote sensing Thuy Le Toan
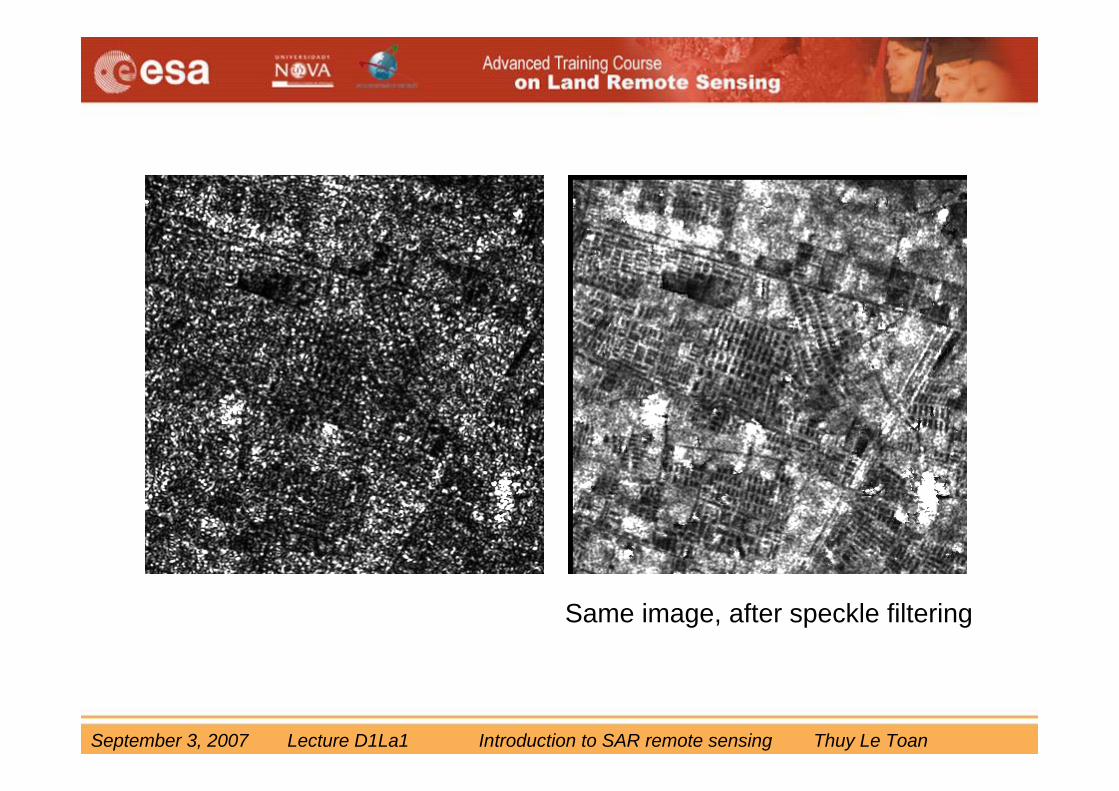
Same image, after speckle filtering

September 3, 2007 Lecture D1La1 Introduction to SAR remote sensing Thuy Le Toan
HH (magenta) and VV (green) images400 x400 pixels
Gaoyou, Jiangsu province2004 09 06
Initial HH and VV images HH and VV image after filtering
September 3, 2007 Lecture D1La1 Introduction to SAR remote sensing Thuy Le Toan
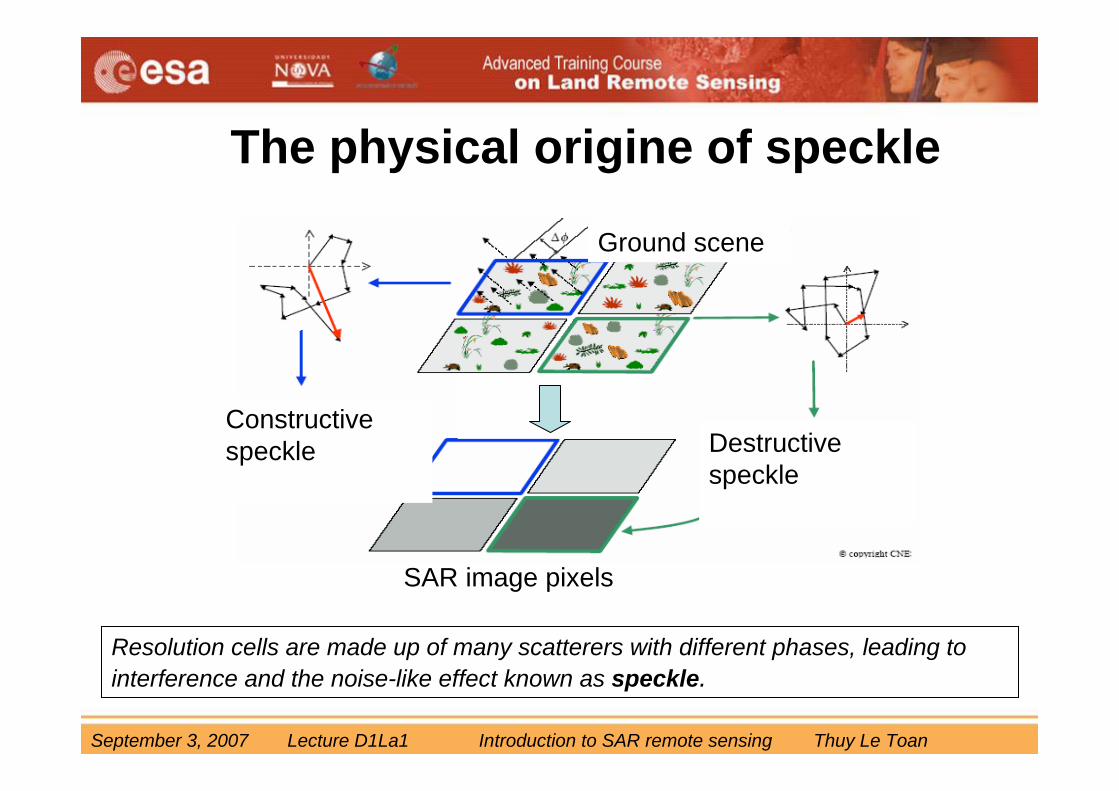
Ground scene
Constructive speckle Destructive
speckle
SAR image pixels
The physical origine of speckle
Resolution cells are made up of many scatterers with different phases, leading to interference and the noise-like effect known as speckle.
September 3, 2007 Lecture D1La1 Introduction to SAR remote sensing Thuy Le Toan
Prob
abili
tyde
nsity
func
tion
of th
e am
plitu
de A
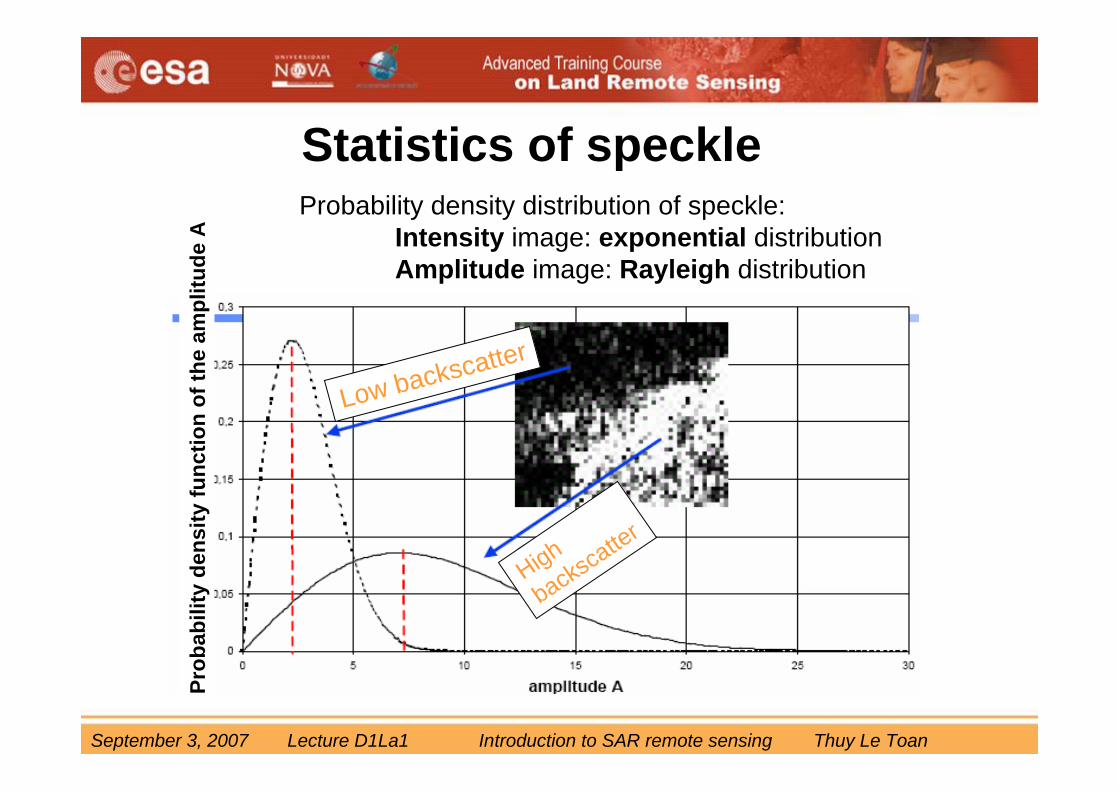
Low backscatter
High
backscatter
Statistics of speckleProbability density distribution of speckle:
Intensity image: exponential distributionAmplitude image: Rayleigh distribution
September 3, 2007 Lecture D1La1 Introduction to SAR remote sensing Thuy Le Toan
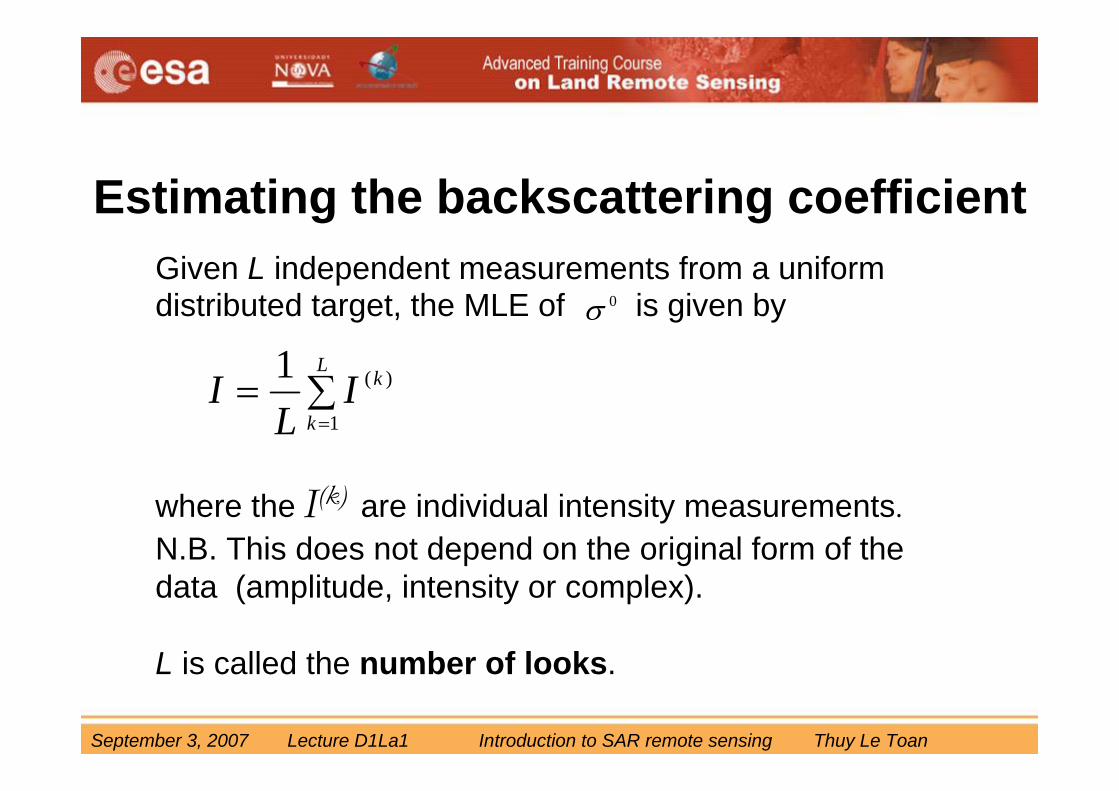
Estimating the backscattering coefficientGiven L independent measurements from a uniform distributed target, the MLE of is given by
where the I(k) are individual intensity measurements.N.B. This does not depend on the original form of the data (amplitude, intensity or complex).
L is called the number of looks.
∑==
L
k
kIL
I1
)(1
0σ
September 3, 2007 Lecture D1La1 Introduction to SAR remote sensing Thuy Le Toan
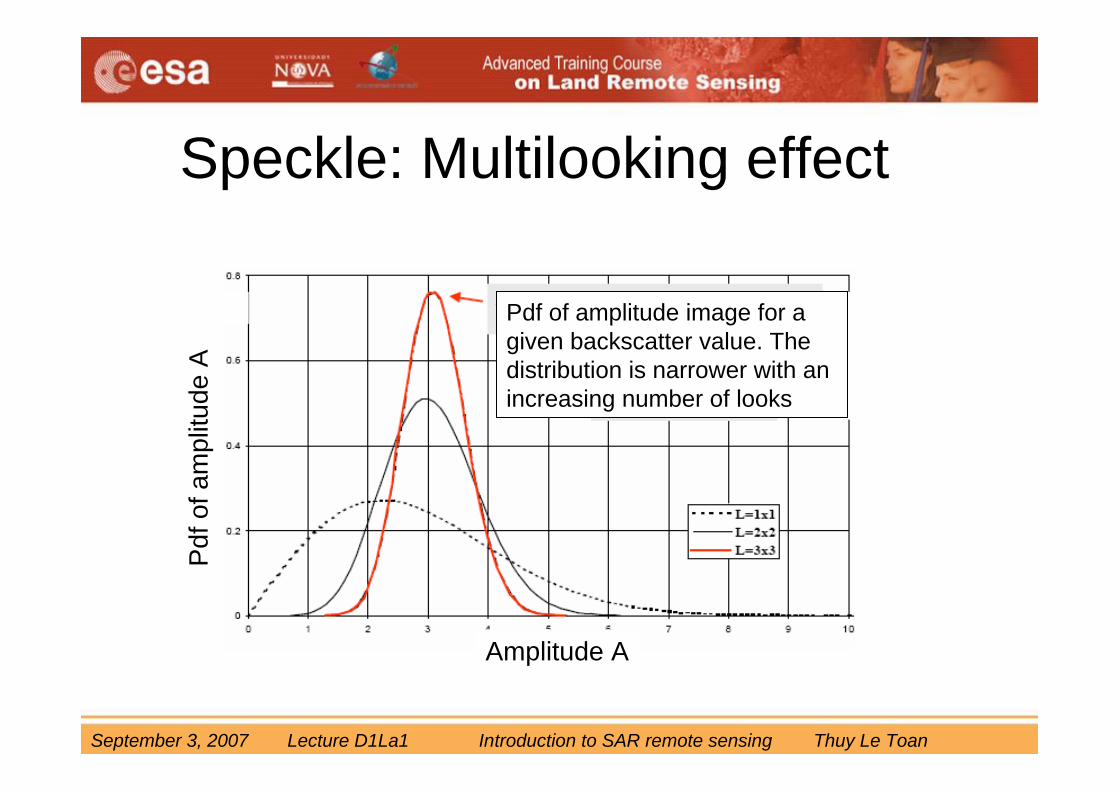
Pdf of amplitude image for a given backscatter value. The distribution is narrower with anincreasing number of looks
of a
mpl
itude
ASpeckle: Multilooking effect
Amplitude A

September 3, 2007 Lecture D1La1 Introduction to SAR remote sensing Thuy Le Toan
• Introduction to radar remote sensing• The Synthetic Aperture Radar• Geometric properties of SAR images • Statistic properties of SAR measurements• Physical content of SAR data
Contents
September 3, 2007 Lecture D1La1 Introduction to SAR remote sensing Thuy Le Toan
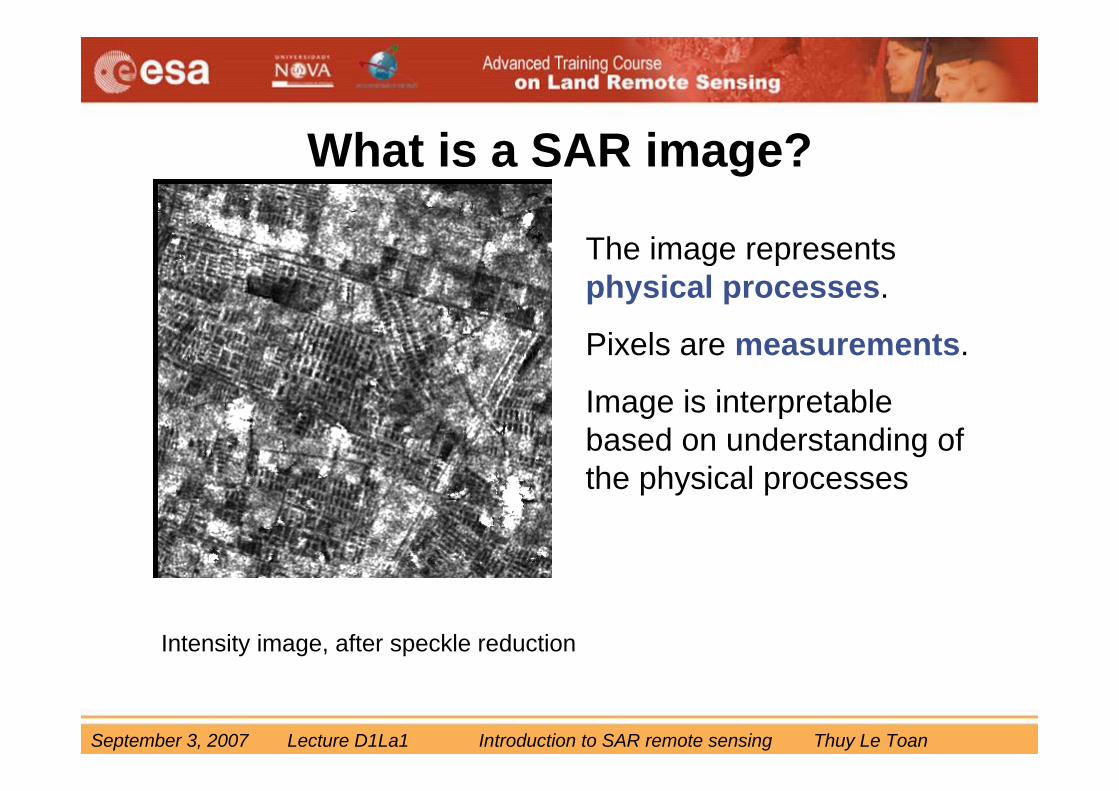
What is a SAR image?
The image represents physical processes.
Pixels are measurements.
Image is interpretable based on understanding of the physical processes
Intensity image, after speckle reduction

September 3, 2007 Lecture D1La1 Introduction to SAR remote sensing Thuy Le Toan
The radar scatteringIncident electric fieldEi
Backscatteredelectric field Es
i
ikr
s SEr
eE =
ijiijij eSS φ=
⎥⎦
⎤⎢⎣
⎡⎥⎦
⎤⎢⎣
⎡=⎥
⎦
⎤⎢⎣
⎡
ih
iv
hhhv
vhvvikr
sh
sv
EE
SSSS
re
EE
the amplitude, phase andpolarisation of Es are modifiedwith respect to Ei
The scattering matrix contains information on the nature and characteristics of the observed media
September 3, 2007 Lecture D1La1 Introduction to SAR remote sensing Thuy Le Toan
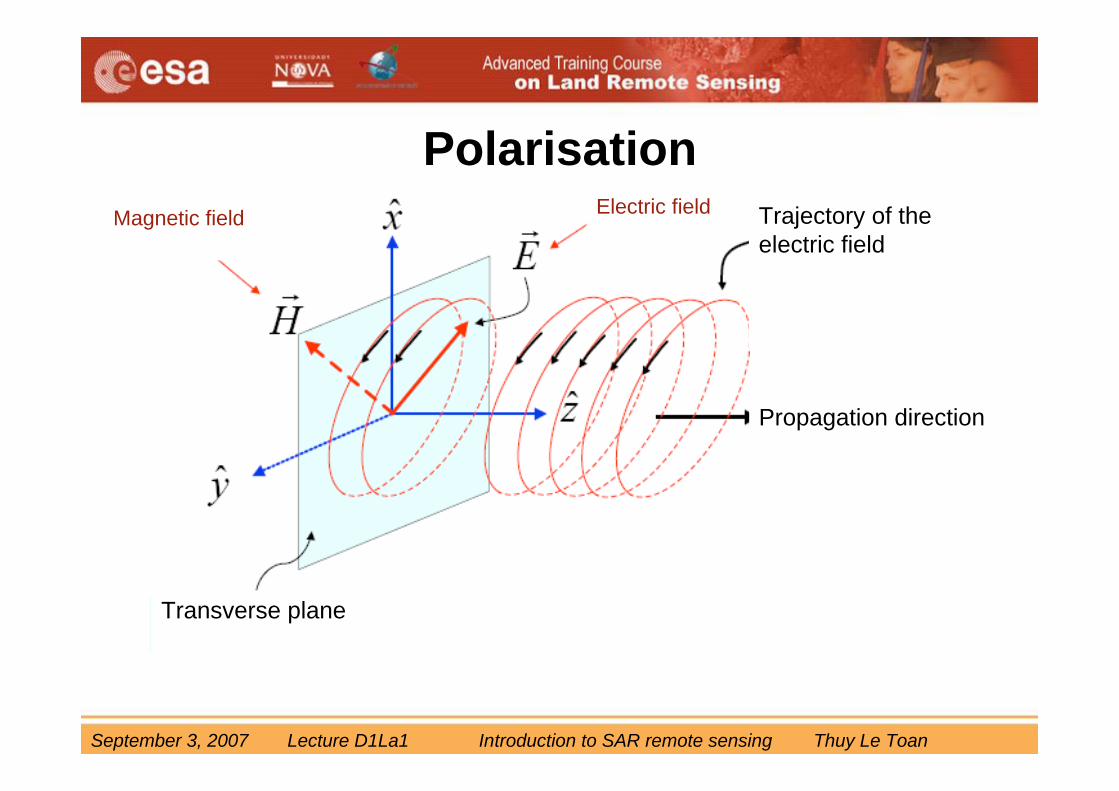
PolarisationMagnetic field Electric field Trajectory of the
electric field
Propagation direction
Transverse plane
September 3, 2007 Lecture D1La1 Introduction to SAR remote sensing Thuy Le Toan
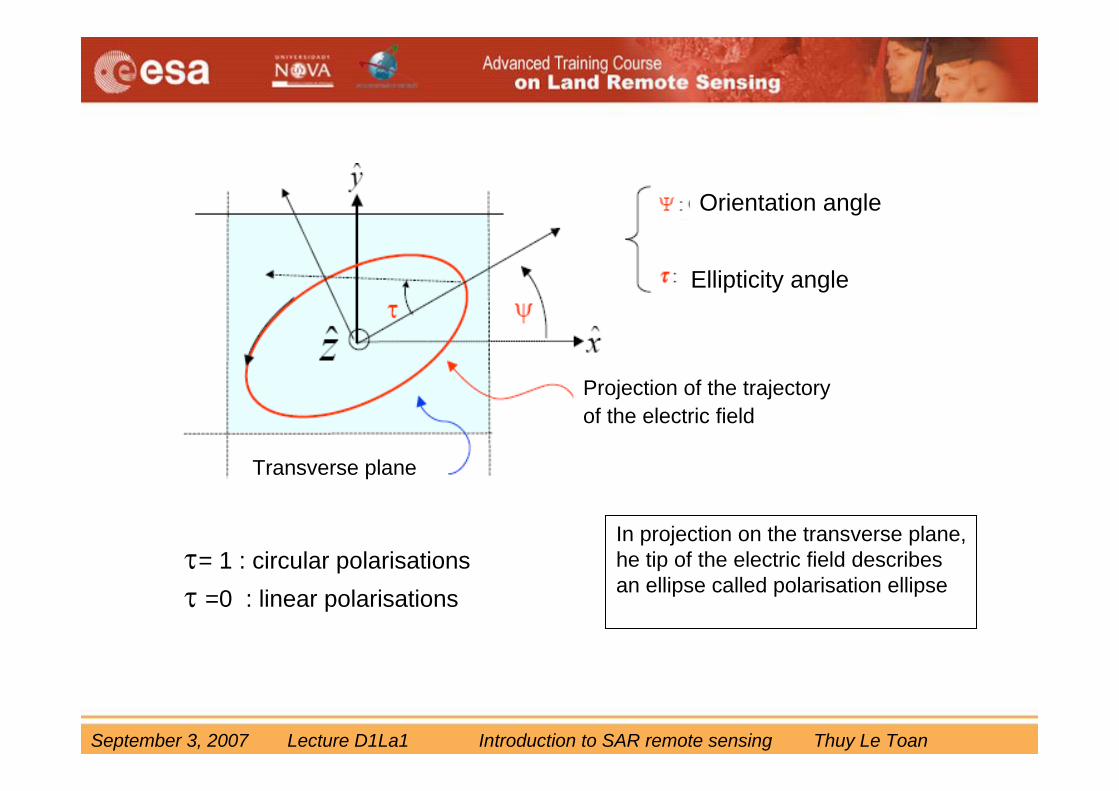
Transverse plane
Projection of the trajectoryof the electric field
Ellipticity angle
Orientation angle
In projection on the transverse plane,he tip of the electric field describesan ellipse called polarisation ellipse
τ= 1 : circular polarisationsτ =0 : linear polarisations
September 3, 2007 Lecture D1La1 Introduction to SAR remote sensing Thuy Le Toan
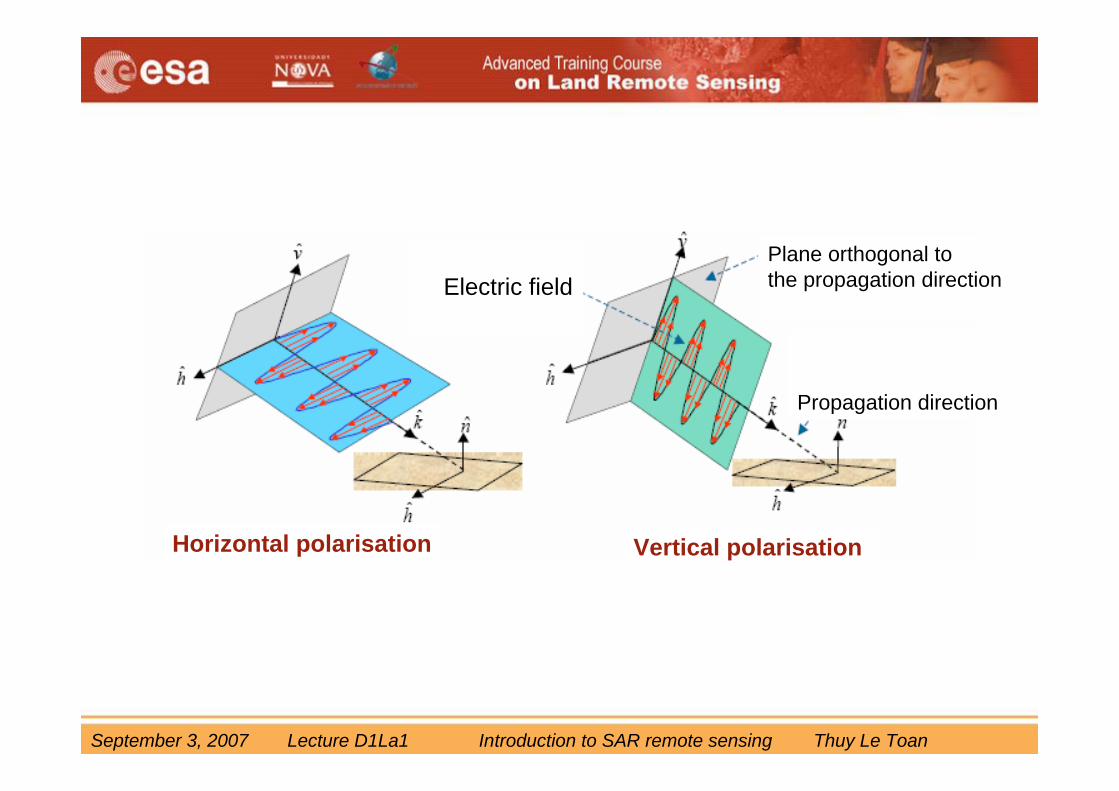
Plane orthogonal to the propagation direction
Propagation direction
Electric field
Horizontal polarisation Vertical polarisation
September 3, 2007 Lecture D1La1 Introduction to SAR remote sensing Thuy Le Toan
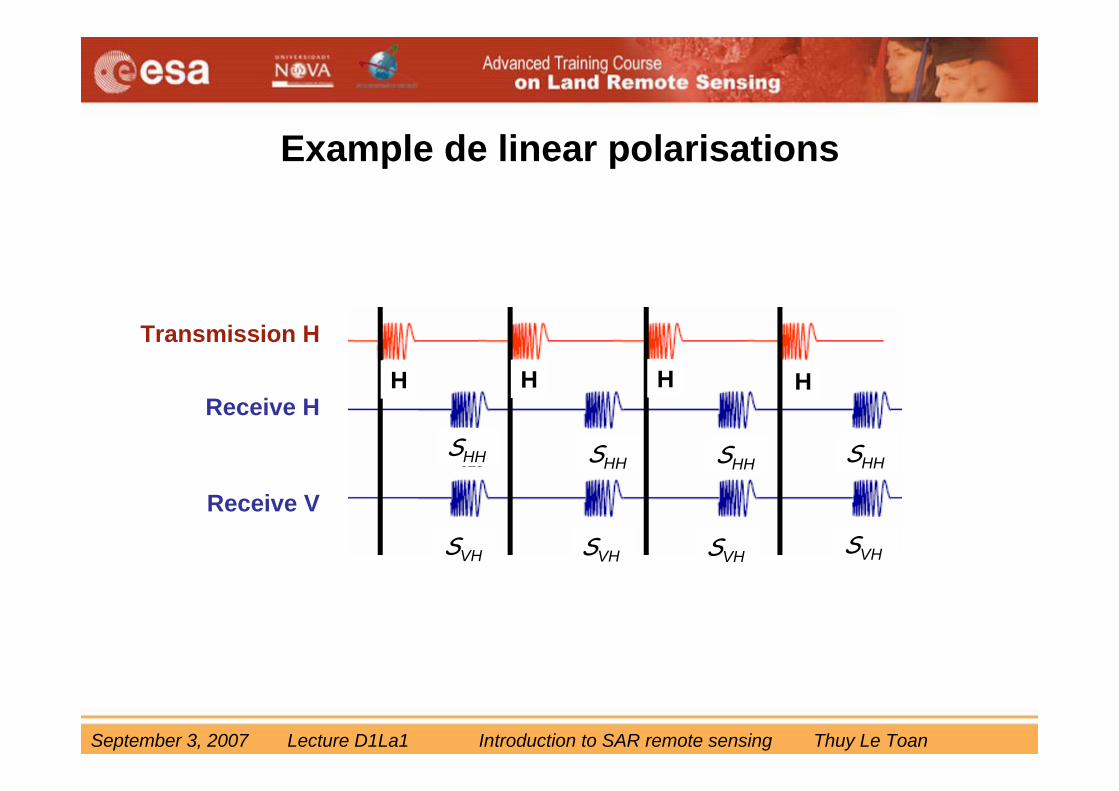
Example de linear polarisations
Transmission H
HHHHReceive H
SHH SHH SHH SHH
SVH SVH SVH SVH
Receive V

September 3, 2007 Lecture D1La1 Introduction to SAR remote sensing Thuy Le Toan
SIR-C images, L-band 24°, Ulan-Ude, Russia, 1994
September 3, 2007 Lecture D1La1 Introduction to SAR remote sensing Thuy Le Toan
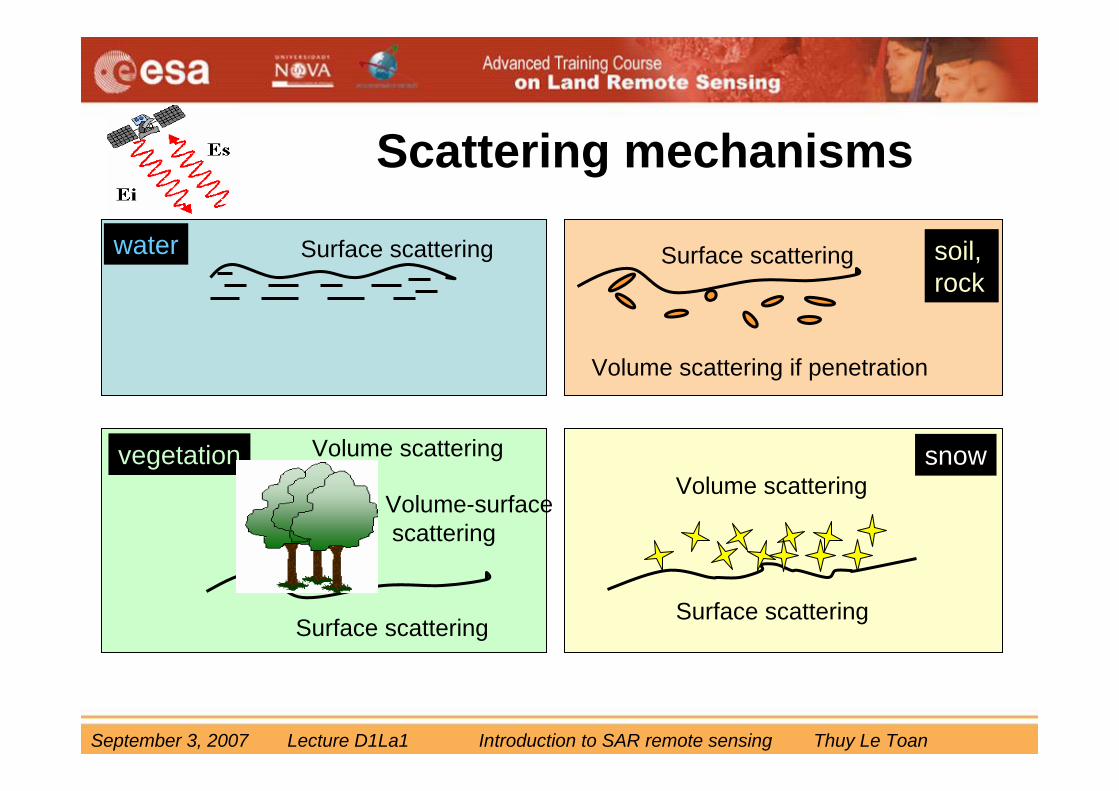
Scattering mechanisms
Surface scattering
Volume scattering if penetration
Surface scatteringwater
Volume scattering
Surface scattering
snow
soil, rock
Surface scattering
Volume scattering
Volume-surfacescattering
vegetation
September 3, 2007 Lecture D1La1 Introduction to SAR remote sensing Thuy Le Toan
Scattering MechanismsThe backscattered signal results from:
- surface scattering- volume scattering- multiple volume-surface scattering
The relative importance of these contributions depend on- surface roughness- dielectric properties of the medium
All of these factors depend on- the radar frequency- the polarisation- the incidence angle

September 3, 2007 Lecture D1La1 Introduction to SAR remote sensing Thuy Le Toan
Surface scattering
The roughness of the surface (wrt to the wavelength) governs the scattering pattern
εr2
Smooth surface Rough surface
The dielectric constant (moisture content) of the medium governsthe strength of the backscatter
εr1εr1
εr2
εr2 > εr1 medium 2 is wetter than medium 1
Wetter media
September 3, 2007 Lecture D1La1 Introduction to SAR remote sensing Thuy Le Toan
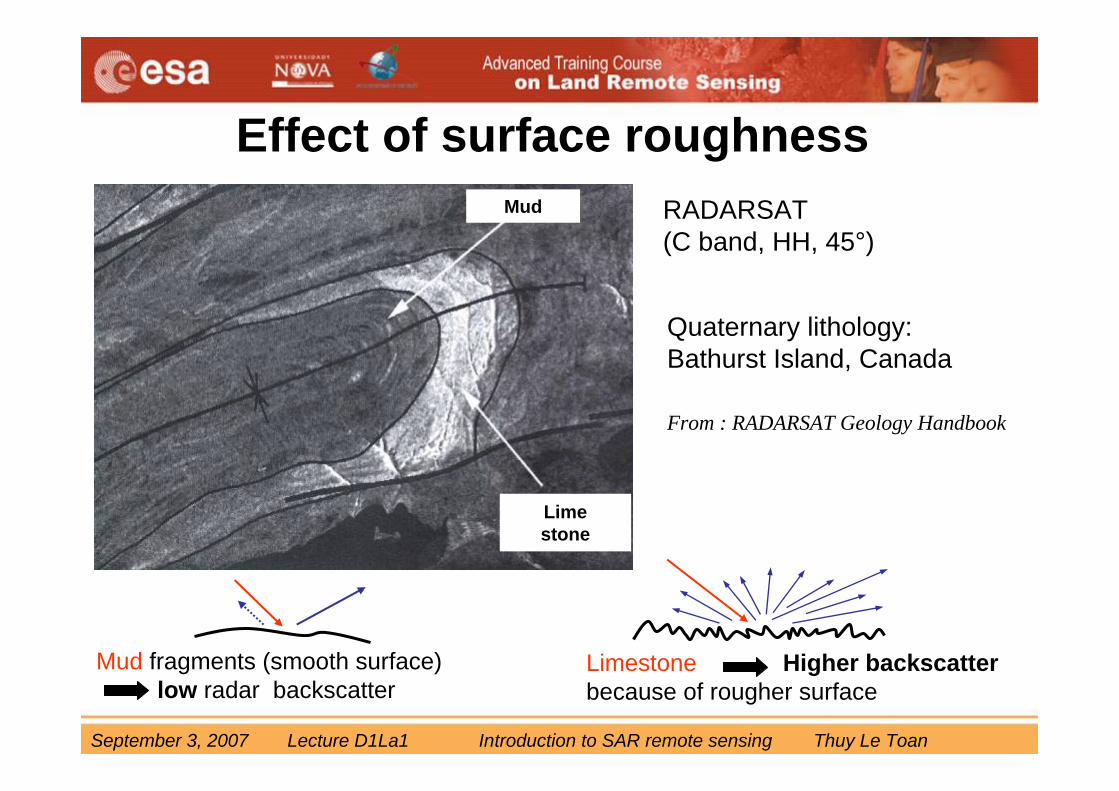
Effect of surface roughness
Quaternary lithology:Bathurst Island, Canada
RADARSAT (C band, HH, 45°)
Limestone Higher backscatterbecause of rougher surface
From : RADARSAT Geology Handbook
Mud fragments (smooth surface)low radar backscatter
Mud
Lime stone
September 3, 2007 Lecture D1La1 Introduction to SAR remote sensing Thuy Le Toan
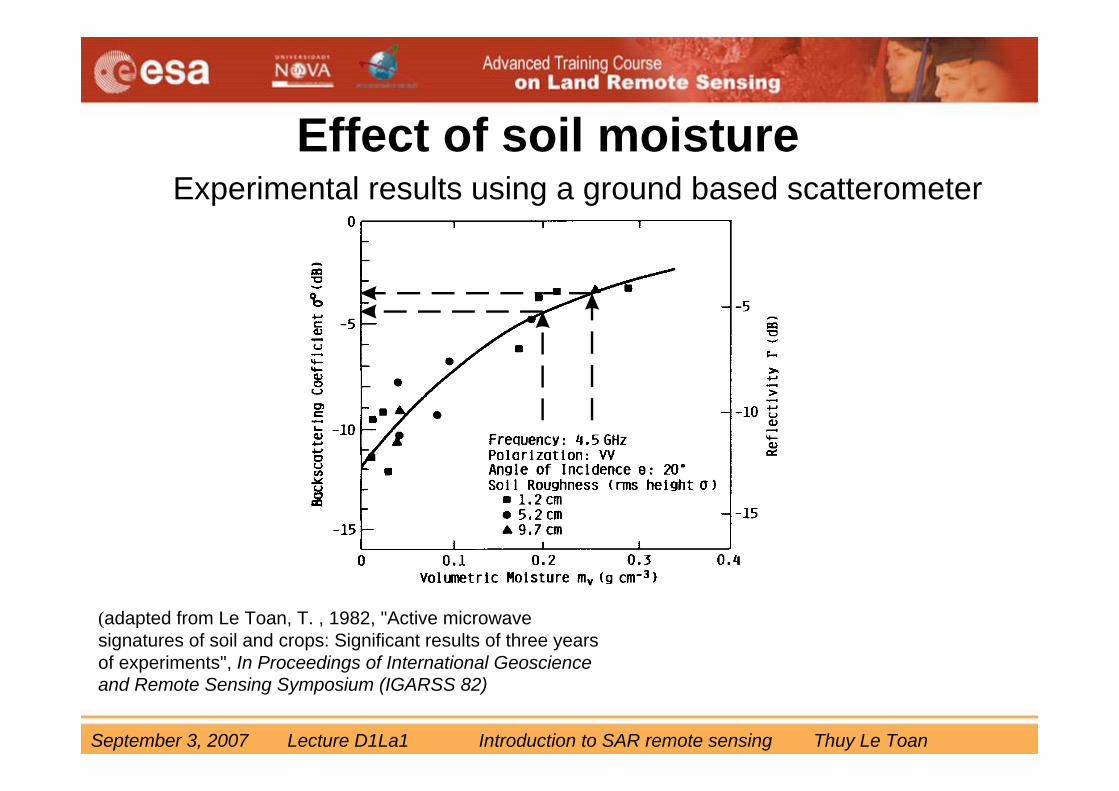
(adapted from Le Toan, T. , 1982, "Active microwave signatures of soil and crops: Significant results of three yearsof experiments", In Proceedings of International Geoscienceand Remote Sensing Symposium (IGARSS 82)
Effect of soil moistureExperimental results using a ground based scatterometer

September 3, 2007 Lecture D1La1 Introduction to SAR remote sensing Thuy Le Toan
Irrigated fields: higher backscatter
Effect of soil moisture

September 3, 2007 Lecture D1La1 Introduction to SAR remote sensing Thuy Le Toan
The relationship betweenradar backscatter at C band 23° VV and soilmoisture is modulated by surface roughness
Volumetric soil moiture content (%)
ER
S b
acks
catte
ring
coef
ficie
nt (d
B)
Effects of roughness and moiture
Mattia et al., 2000

September 3, 2007 Lecture D1La1 Introduction to SAR remote sensing Thuy Le Toan
Smooth surface (seed bed): Fractal
Rough surface (ploughed): Single scale
The surface roughness
September 3, 2007 Lecture D1La1 Introduction to SAR remote sensing Thuy Le Toan
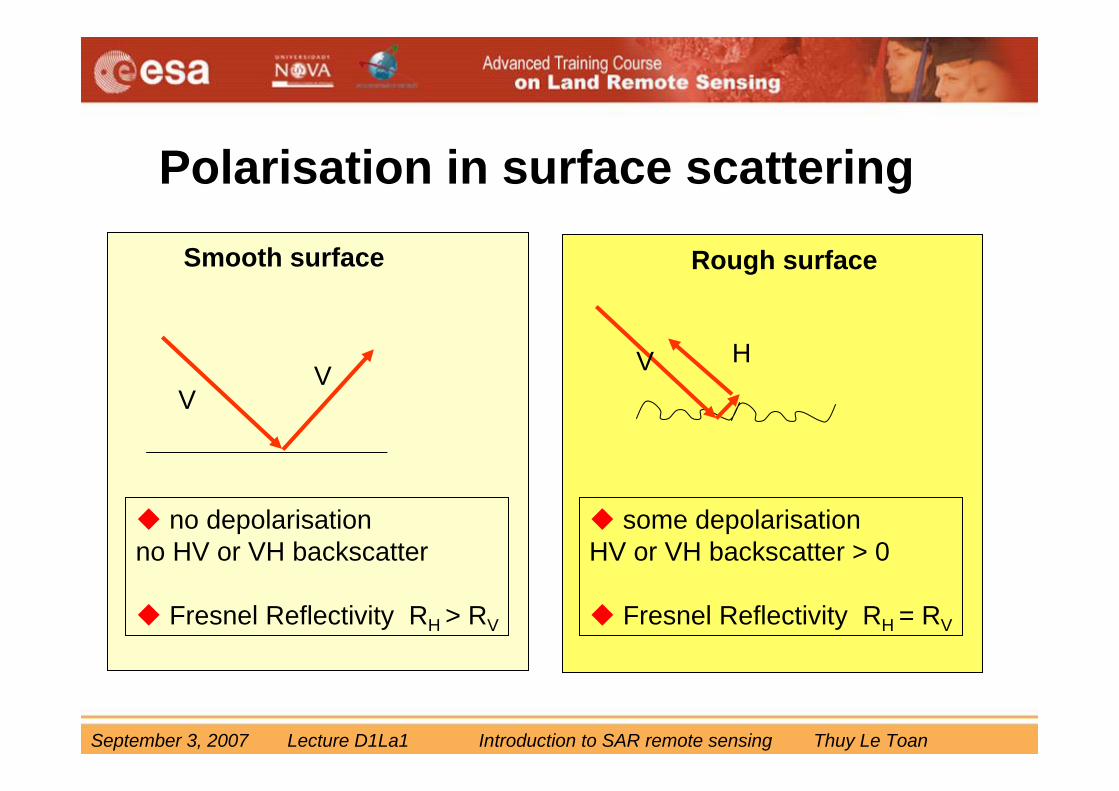
Polarisation in surface scattering
VV
no depolarisationno HV or VH backscatter
Fresnel Reflectivity RH > RV
V H
some depolarisationHV or VH backscatter > 0
Fresnel Reflectivity RH = RV
Smooth surface Rough surface
September 3, 2007 Lecture D1La1 Introduction to SAR remote sensing Thuy Le Toan
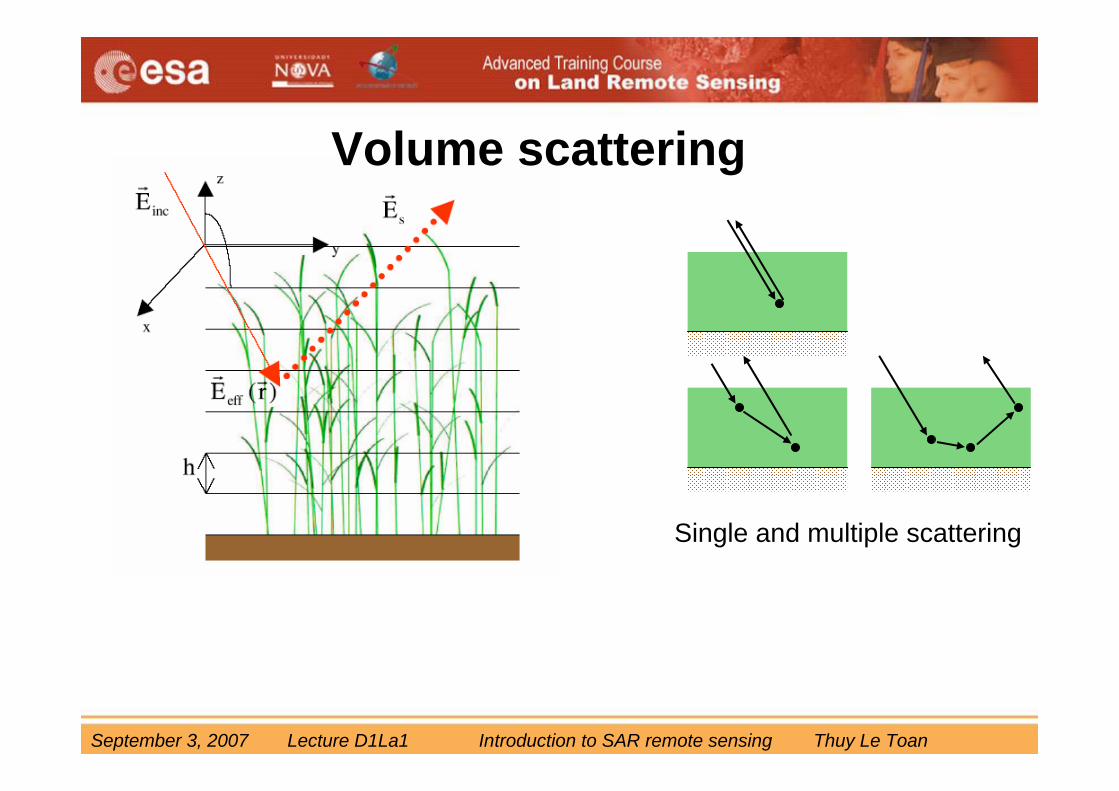
Volume scattering
Single and multiple scattering
September 3, 2007 Lecture D1La1 Introduction to SAR remote sensing Thuy Le Toan
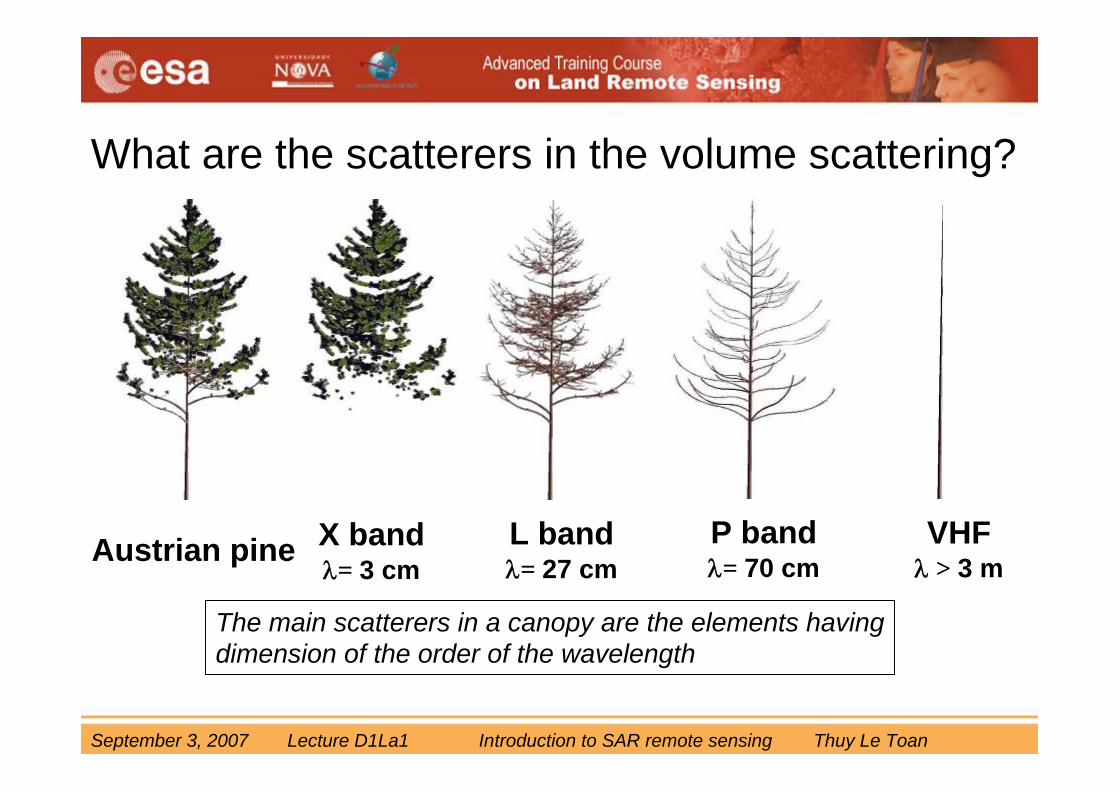
Austrian pine VHFλ > 3 m
P bandλ= 70 cm
L bandλ= 27 cm
X bandλ= 3 cm
The main scatterers in a canopy are the elements havingdimension of the order of the wavelength
What are the scatterers in the volume scattering?
September 3, 2007 Lecture D1La1 Introduction to SAR remote sensing Thuy Le Toan
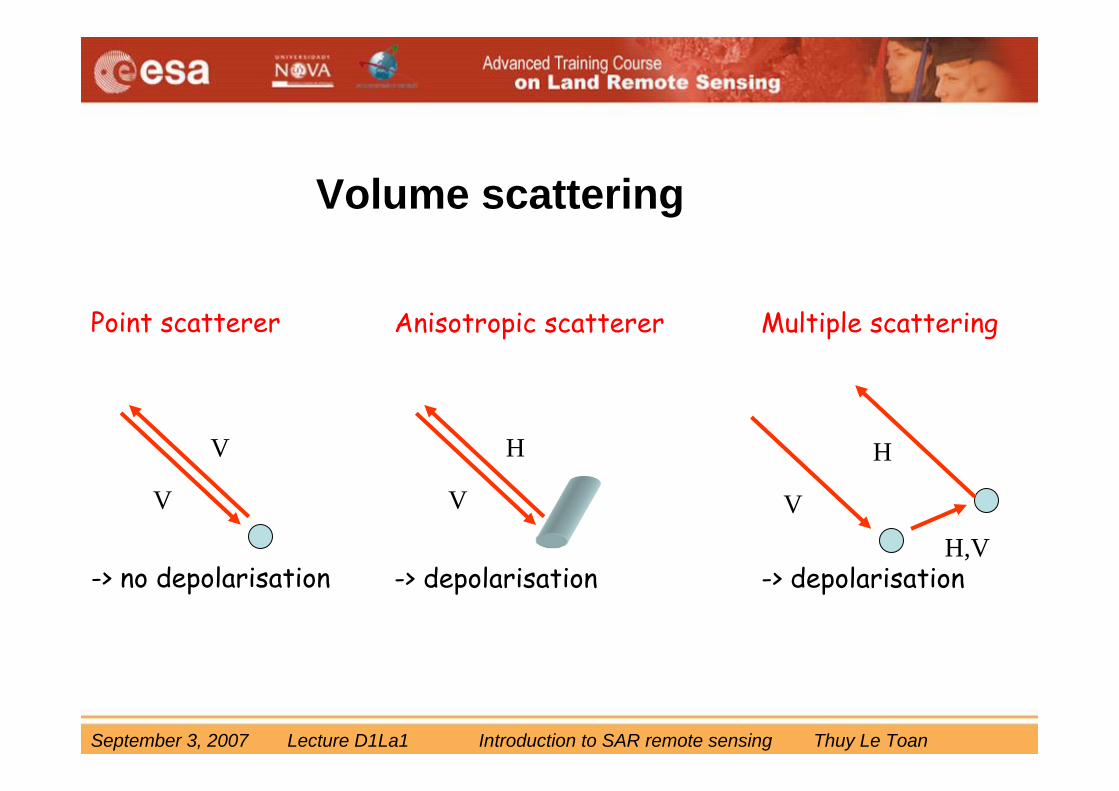
Volume scattering
V
V
V
H
Point scatterer
-> no depolarisation
Anisotropic scatterer
-> depolarisation
Multiple scattering
-> depolarisation
V
H
H,V
September 3, 2007 Lecture D1La1 Introduction to SAR remote sensing Thuy Le Toan
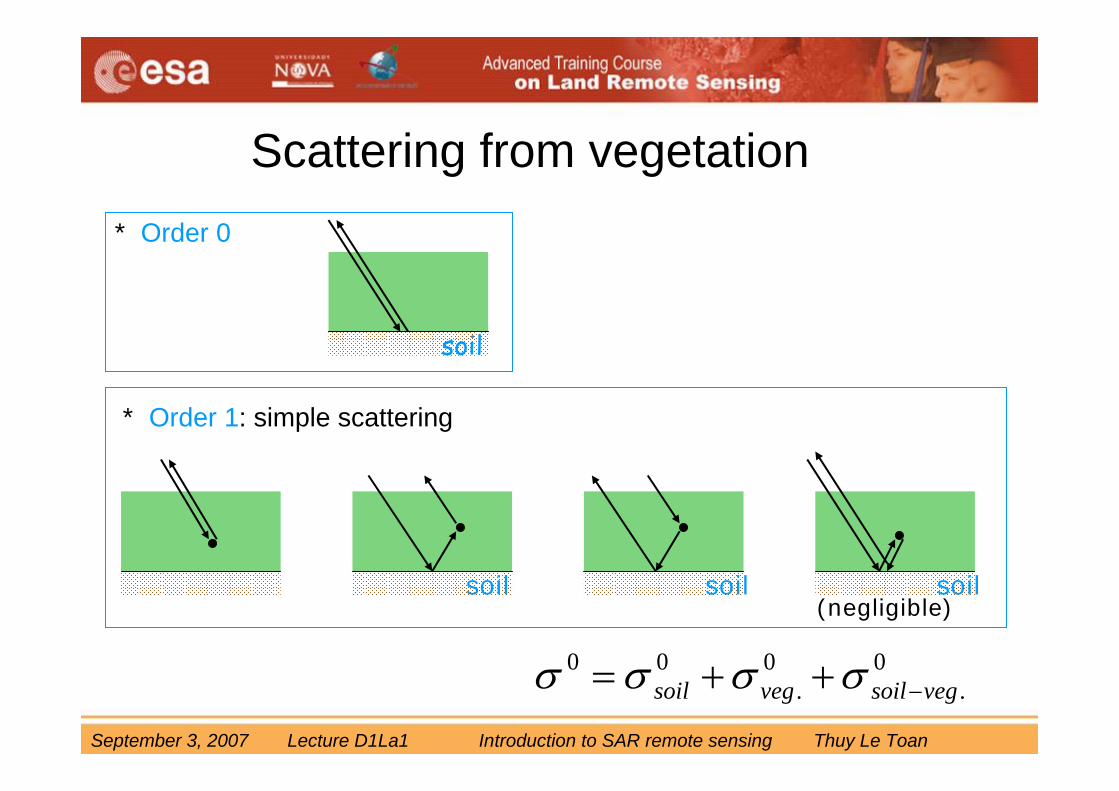
* Order 1: simple scattering
soil soilsoil(negligible)
* Order 0
soil
0.
0.
00vegsoilvegsoil −++= σσσσ
Scattering from vegetation
September 3, 2007 Lecture D1La1 Introduction to SAR remote sensing Thuy Le Toan
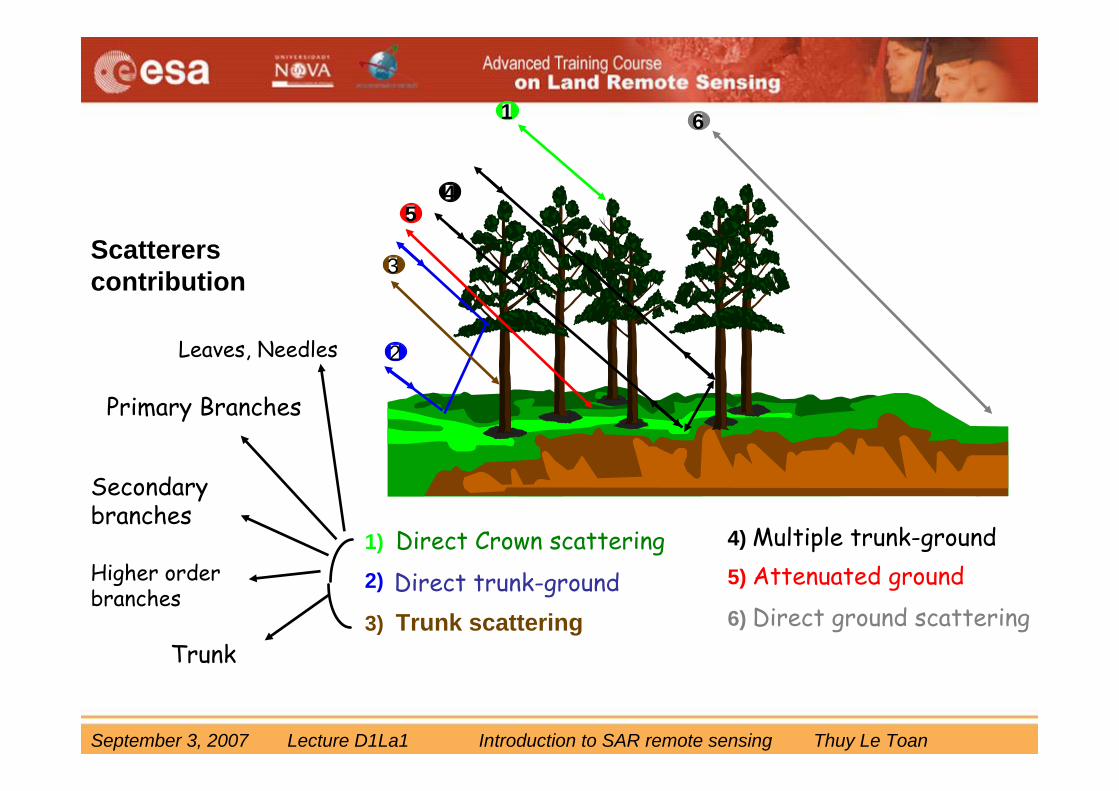
1) Direct Crown scattering
3) Trunk scattering
4) Multiple trunk-ground5) Attenuated ground6) Direct ground scattering
2)
2
3
54
1 6
Trunk
Primary Branches
Secondarybranches
Higher orderbranches
Leaves, Needles
Scattererscontribution
Direct trunk-ground

September 3, 2007 Lecture D1La1 Introduction to SAR remote sensing Thuy Le Toan
Scattering on leaves, ears
Attenuated ground scattering
Stem-ground interaction
Scattering from a cereal canopy
September 3, 2007 Lecture D1La1 Introduction to SAR remote sensing Thuy Le Toan
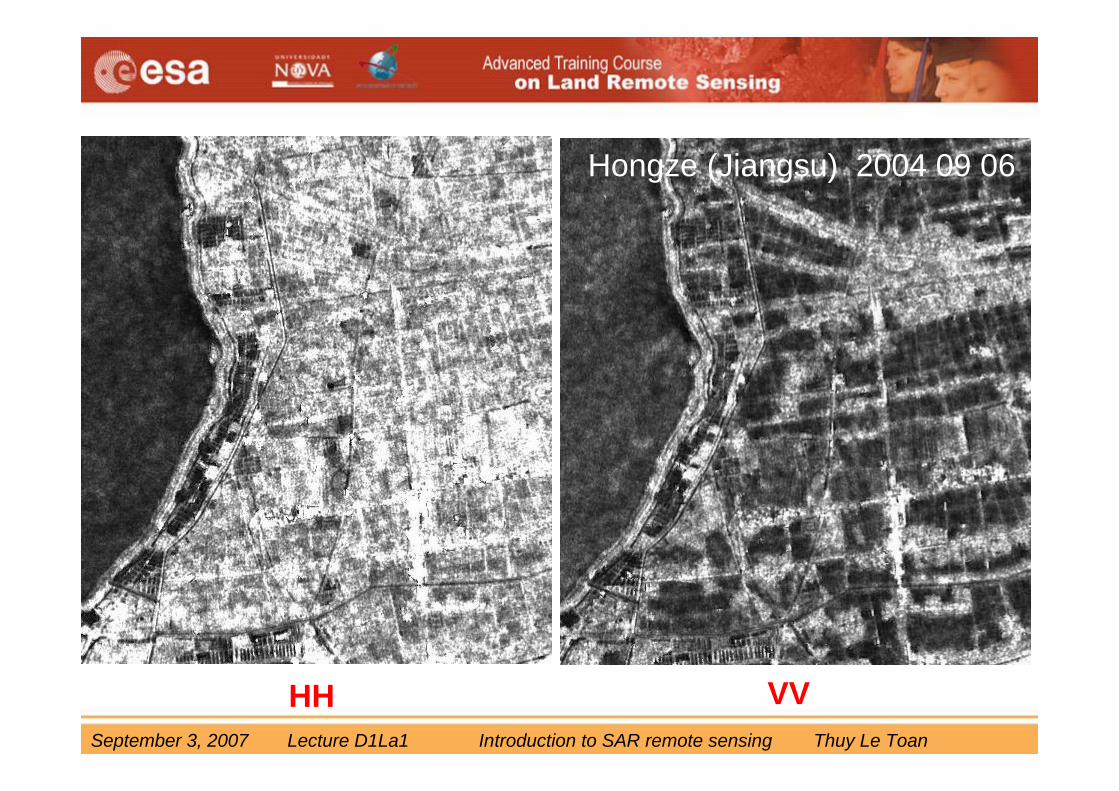
HH VV
Hongze (Jiangsu) 2004 09 06
September 3, 2007 Lecture D1La1 Introduction to SAR remote sensing Thuy Le Toan
Hongze(Jiangsu)
2004 09 06
Rice mappingusing HH/VV
September 3, 2007 Lecture D1La1 Introduction to SAR remote sensing Thuy Le Toan
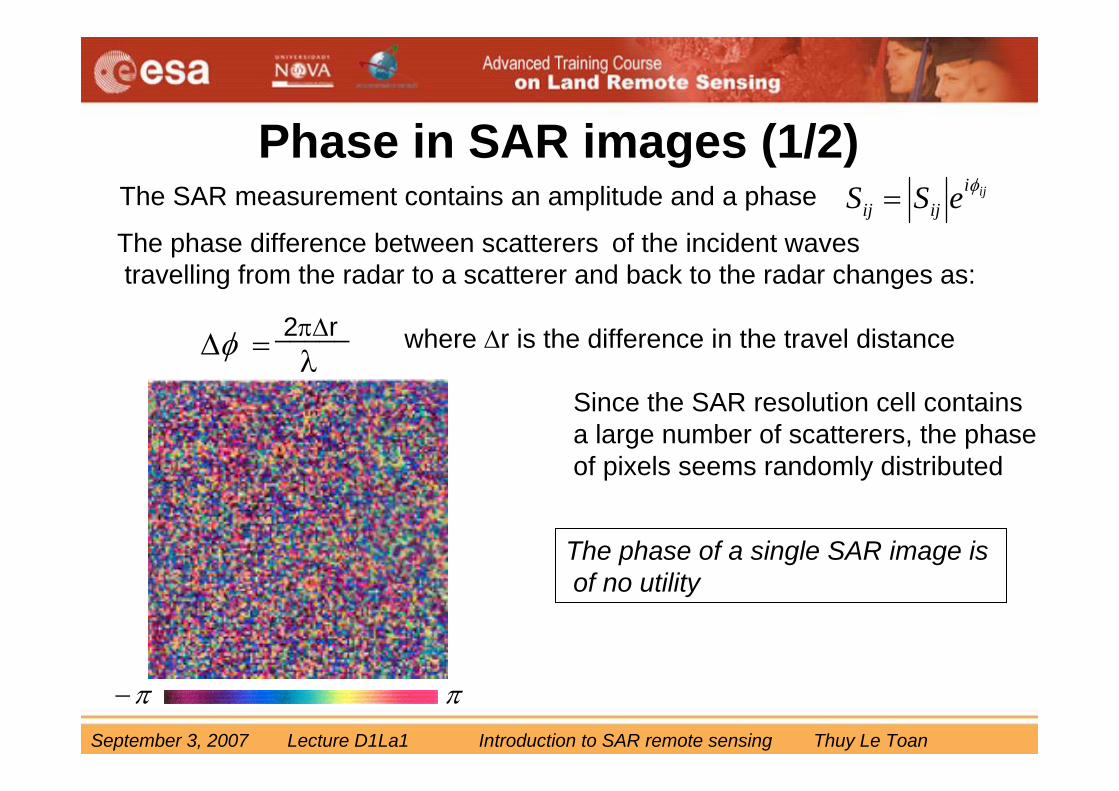
Phase in SAR images (1/2)iji
ijij eSS φ=The phase difference between scatterers of the incident wavestravelling from the radar to a scatterer and back to the radar changes as:
where Δr is the difference in the travel distance
Since the SAR resolution cell containsa large number of scatterers, the phaseof pixels seems randomly distributed
Δφ = 2πΔrλ
_____
ππ−
The phase of a single SAR image isof no utility
The SAR measurement contains an amplitude and a phase
September 3, 2007 Lecture D1La1 Introduction to SAR remote sensing Thuy Le Toan
Phase in SAR images (2/2)If the scene is observed in 2 images, in which the scatterersremain unchanged in the resolution cell, the phase differencebetween pixels of the 2 images can be exploited
Polarimetry: the radar measures at the same time HH, VV, HV, VH and their phase difference
Interferometry: 2 radars observe the scene with a small shift in the look angle; or the same radar at different dates from lightlyshifted orbit
Lectures on Polarimetry and interferometry