introduction to mplus - statmodel.com introduction to mplus! (0=no ability grouping, 1=ability...
TRANSCRIPT
Introduction to Mplus
Q. The Mplus analysis concerns a first, basic analysis of the LSAY math data. Run the type=basic run.The assignment is to create the input file and run a type=basic run and create a few graphics usingthe LSAY data.
Below is the M-plus output file:
Mplus VERSION 3.0 DEMO
MUTHEN & MUTHEN
04/11/2004 12:25 PM
INPUT INSTRUCTIONS
TITLE: This is a partial input file for HW1.
The variable names are for the data set lsay.dat
(Input File Name: LSAY_asgn01.inp)
! TITLE is the only command that does not require a
! semi-colon (;) at the end.
DATA: FILE IS C:\Ed.231E\Assignment_01\lsay.dat;
! The location of the data file should be the same as
! that of the input file (*.inp).
!
! In addition to raw data, matrices can also be
! read into the program for analysis.
! The VARIABLE command reads in all the variables that are
! present in the dataset.
!
! Maximum length of variable name is 8.
!
! The variables must be listed in the same order as in the
! original dataset.
VARIABLE: NAMES ARE lsayid schcode
!lsayid = student id
!schcode = 7th grade school code
classize urban tracking ntracks
!classize = 7th grade school size
!urban = 7th grade community type
! (1=urban, 2=suburban, 3=rural)
!tracking = 7th grade math tracking indicator
1
2 INTRODUCTION TO MPLUS
! (0=no ability grouping, 1=ability grouping)
!ntracks = # of 7th grade math ability levels
mthlvl female mthflg7-mthflg12 mothed fathed mothsei
fathsei homeres race
!mthlvl = 7th grade ability ranking
! (0 = no groups, 1=low, 2=middle, 3=high)
!female
! (0=male, 1=female)
!mthflg7-mthflg12 = math test availability
! (0=not available, 1=available)
!mothed = mother’s education
! (1=LT HS diploma, 2=HS diploma, 3=Some college,
! 4=4yr college degree, 5=advanced degree)
!fathed = father’s education
! (1=LT HS diploma, 2=HS diploma, 3=Some college,
! 4=4yr college degree, 5=advanced degree)
!mothsei = mother’s SEI
!fathsei = father’s SEI
!homeres = Home math and science resources
!race
! (1=Hispanic, 2=Black, 3=White, 4=Asian,
! 5=Native American, 6=other)
expect parapsh parcpsh parmpsh peerapsh peermpsh
!expect = Student’s educational expectations
! (1=HS only, 2=Vocational training,
! 3=some college, 4=Bachelor’s,
! 5=Master’s, 6=Dr,PhD) (7th grade)
!parapsh = parent academic push (7th grade)
!parcpsh = parant college push (7th grade)
!parmpsh = parent math push (7th grade)
!peerapsh = peer academic push (7th grade)
!peermpsh = peer math push (7th grade)
bas7 basse7 alg7 algse7 geo7 geose7
qlt7 qltse7 mth7 mthse7 mtha7 mthase7
bas8 basse8 alg8 algse8 geo8 geose8
qlt8 qltse8 mth8 mthse8 mtha8 mthase8
bas9 basse9 alg9 algse9 geo9 geose9
qlt9 qltse9 mth9 mthse9 mtha9 mthase9
bas10 basse10 alg10 algse10 geo10 geose10
qlt10 qltse10 mth10 mthse10 mtha10 mthase10
bas11 basse11 alg11 algse11 geo11 geose11
qlt11 qltse11 mth11 mthse11 mtha11 mthase11
bas12 basse12 alg12 algse12 geo12 geose12
qlt12 qltse12 mth12 mthse12 mtha12 mthase12
!bas7-bas12 = Basic math IRT scores
!basse7-12 = Basic math SE of IRT
!alg7-alg12 = Algebra IRT score
!algse7-12 = Algebra SE of IRT
!geo7-geo12 = Geometry IRT score
!geose7-geose12 = Geometry SE of IRT
!qlt7-qlt12 = Quantitative Literacy IRT
!qltse7-qltse12 = Quantitative Literacy SE of IRT

3
!mth7-mth12 = Aggregate math IRT, w/o aberrants
!mthse7-mthse12 = Aggreagte math IRT, w/o aberrrants
!mtha7-matha12 = Aggregate math IRT, w/ aberrants
!mtha7-mtha12 = Aggregate math SE of IRT, w/
! aberrants
mthcrs7-mthcrs12 mtrk10-mtrk12
!mthcrs7-mthcrs12 = Highest math course taken
! during each grade
! (0 = no course,
! 1 = low,basic, 2 = average,
! 3 = high, 4 = pre-algebra,
! 5 = algebra I, 6 = geometry,
! 7 = algebra II, 8 = pre-calc,
! 9 = calculus)
!
!mtrk10-mtrk12 = Highest math course taken through
! grades 10-12
! (1 = low,
! 2 = algebra I,
! 3 = algebra I & II,
! 4 = algebra and geometry,
! 5 = algebra I, II, and geometry,
! 6 = pre-calc,
! 7 = calculus)
totstud
lchfull lchpart parvis
!totstud = total # of students
! (9th)
!
!lchfull = % of student eligible for full lunch
! assitance
! (9th)
!lchpart = % of student eligible for partial
! lunch assitance
! (9th)
!parvis = % of parents that visit the school
! (9th)
mcirr mclub strat mstrat comp mcomp
!Mcirr = school provides math curriculum guide
! (1=yes, 2=no)
! (9th)
!Mclub = school has math club
! (1=yes, 2=no)
! (9th)
!STrat = ratio of student to Full Time teachers
! (9th)
!MSTrat= ratio of students to Full Time Math
! teachers
! (9th)
!comp = ratio of students to computers for
! instructional use
! (9th)

4 INTRODUCTION TO MPLUS
!Mcomp = ratio of students to computers for
! math instruction use
! (9th)
african hispan asian
!african = percent of african american students
! (9th)
!hispan = percent of hispanic students
! (9th)
!asian = percent of asian students
! (9th)
expel arrest dropot
!expel = Ever been expelled from school
! (0=no, 1=yes)
! (used in PROBLEM VAR)
! (7th Grd)
!arrest = Ever been arrested
! (0=no, 1=yes)
! (used in PROBLEM VAR)
! (7th grd)
!dropot = Have you EVER thought about dropping out
! (0=no, 1=yes)
! (used in PROBLEM VAR)
! (7th grd)
self worth other
!self = positive attitute toward self
! (1=strongly agree, 2=agree,
! 3=not sure, 4=disagree,
! 5=strongly disagree)
! (7th Grd)
!worth = person of worth
! (1=strongly agree, 2=agree,
! 3=not sure, 4=disagree,
! 5=strongly disagree)
! (7th Grd)
!other = able to do things as well as others
! (1=strongly agree, 2=agree,
! 3=not sure, 4=disagree,
! 5=strongly disagree)
! (7th grd)
satisf respect failure esteem problem cloctn
!satisf = generally satisfied w/self
! (1=strongly agree, 2=agree,
! 3=not sure, 4=disagree,
! 5=strongly disagree)
! (7th Grd)
!respect = wish I respected myself more
! (1=strongly agree, 2=agree,
! 3=not sure, 4=disagree,
! 5=strongly disagree)
! (7th Grd)
!failure = feel I am a failure

5
! (1=strongly agree, 2=agree,
! 3=not sure, 4=disagree,
! 5=strongly disagree)
! (7th Grd)
!esteem = average of self, worth, other, satisf,
! respect, failure
!problem = 1 if (expel=1 or arrest=1 or dropot=1),
! 0 otherwise
! (7th Grd)
!cloctn = Fall 88 respondent location
! (1=In orginal School,
! 2=Moved another school,
! 3=moved, not located,
! 4=dropped out of school,
! 5=early graduation,
! 6=Quit Study)
dloctn eloctn floctn gloctn hloctn iloctn jloctn
kloctn lloctn
!dloctn = Spring 89 respondent location
!eloctn = Fall 89 respondent location
!floctn = Spring 90 respondent location
!gloctn = Fall 90 respondent location
!hloctn = spring 91 respondent location
!iloctn = fall 91 respondent location
!jloctn = spring 92 respondent location
!kloctn = fall 92 respondent location
!lloctn = spring 93 respondent location
drink runawa suicid alc7 alc10 alc11 alc12
!drink = "Have you ever taken a drink alcohol"
! (7th grade)
!runawa = "Have you ever thought about running
! away"
! (7th grade)
!suicid = "Have you ever considered suicide"
! (7th grade)
!alc7 = "Last summer, I had 6+ drinks."
! (7th grade)
!alc10-12 = "Last summer, I had 6+ drinks."
arest7
runa8 runa9 runa10 runa11 run12
suic8 suic9 suic10 suic11 suic12
drop7 drop8 drop9 drop10 drop11 drop12
fdrop8 fdrop9 fdrop10 fdrop11 fdrop12
!arest7 = "Last summer, I was picked up
! and arrested"
! (7th grade)
!runa8-12 = "Last summer, I thought about
! running away"
! (Asked in Fall)
!suic8-12 = "Last summer, I considered suicide"
! (Asked in FALL)
!drop7-12 = "This school yr, thought seriously
6 INTRODUCTION TO MPLUS
! about dropping out."
! (Asked in Spring)
!fdrop8-12 = "How many of your friends will
! drop out before graduating
! from high school"
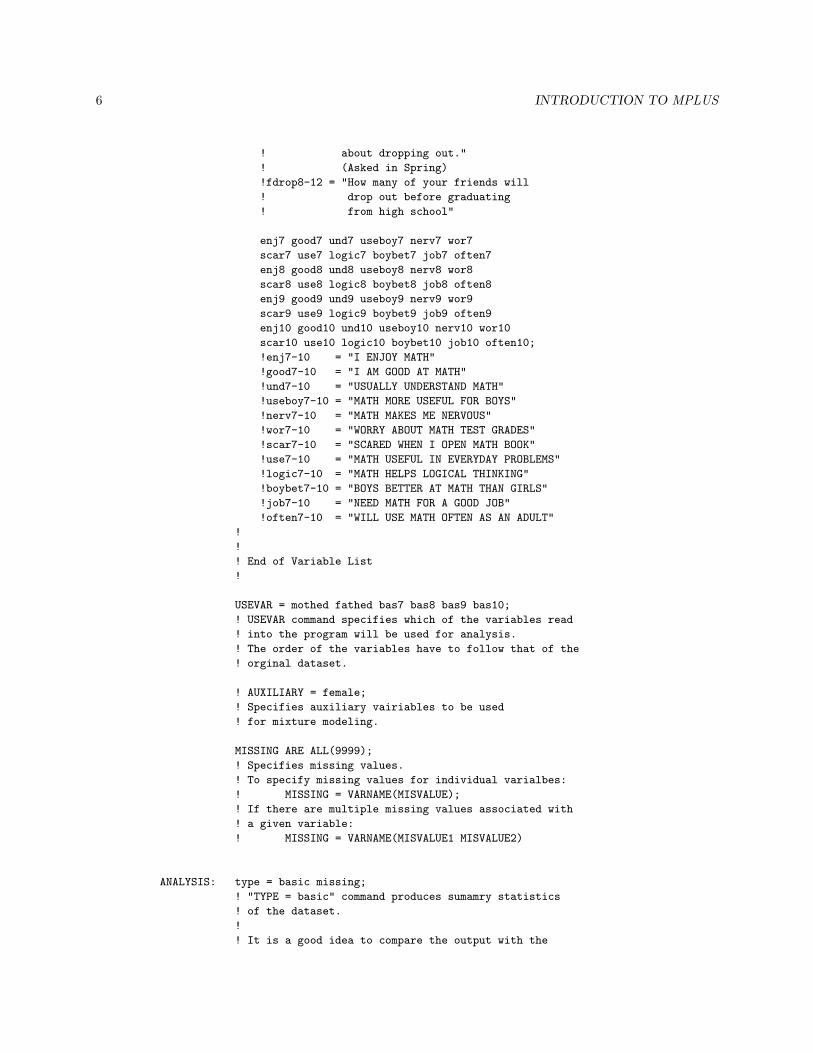
enj7 good7 und7 useboy7 nerv7 wor7
scar7 use7 logic7 boybet7 job7 often7
enj8 good8 und8 useboy8 nerv8 wor8
scar8 use8 logic8 boybet8 job8 often8
enj9 good9 und9 useboy9 nerv9 wor9
scar9 use9 logic9 boybet9 job9 often9
enj10 good10 und10 useboy10 nerv10 wor10
scar10 use10 logic10 boybet10 job10 often10;
!enj7-10 = "I ENJOY MATH"
!good7-10 = "I AM GOOD AT MATH"
!und7-10 = "USUALLY UNDERSTAND MATH"
!useboy7-10 = "MATH MORE USEFUL FOR BOYS"
!nerv7-10 = "MATH MAKES ME NERVOUS"
!wor7-10 = "WORRY ABOUT MATH TEST GRADES"
!scar7-10 = "SCARED WHEN I OPEN MATH BOOK"
!use7-10 = "MATH USEFUL IN EVERYDAY PROBLEMS"
!logic7-10 = "MATH HELPS LOGICAL THINKING"
!boybet7-10 = "BOYS BETTER AT MATH THAN GIRLS"
!job7-10 = "NEED MATH FOR A GOOD JOB"
!often7-10 = "WILL USE MATH OFTEN AS AN ADULT"
!
!
! End of Variable List
!
USEVAR = mothed fathed bas7 bas8 bas9 bas10;
! USEVAR command specifies which of the variables read
! into the program will be used for analysis.
! The order of the variables have to follow that of the
! orginal dataset.
! AUXILIARY = female;
! Specifies auxiliary vairiables to be used
! for mixture modeling.
MISSING ARE ALL(9999);
! Specifies missing values.
! To specify missing values for individual varialbes:
! MISSING = VARNAME(MISVALUE);
! If there are multiple missing values associated with
! a given variable:
! MISSING = VARNAME(MISVALUE1 MISVALUE2)
ANALYSIS: type = basic missing;
! "TYPE = basic" command produces sumamry statistics
! of the dataset.
!
! It is a good idea to compare the output with the
7
! summary statistics obtained from the original dataset
! in the original statistical package.
!
! MISSING command request for a plot of missing data
! pattern.
PLOT: TYPE IS plot1 plot2 plot3;
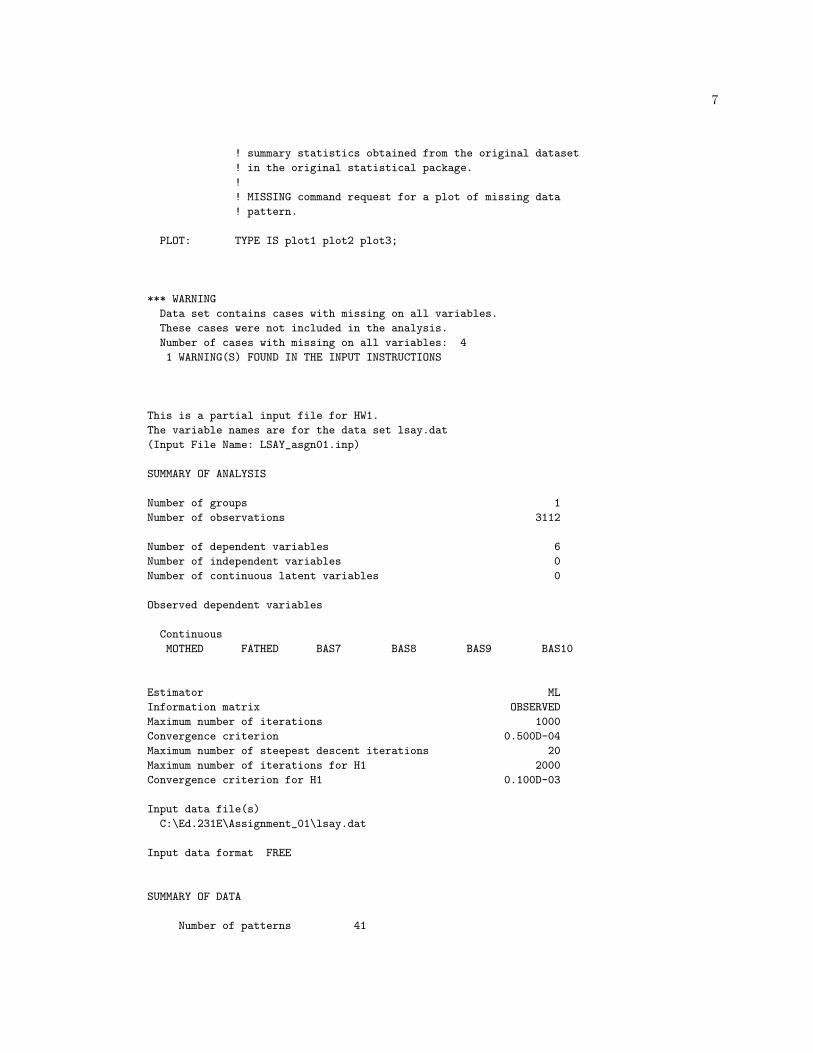
*** WARNING
Data set contains cases with missing on all variables.
These cases were not included in the analysis.
Number of cases with missing on all variables: 4
1 WARNING(S) FOUND IN THE INPUT INSTRUCTIONS
This is a partial input file for HW1.
The variable names are for the data set lsay.dat
(Input File Name: LSAY_asgn01.inp)
SUMMARY OF ANALYSIS
Number of groups 1
Number of observations 3112
Number of dependent variables 6
Number of independent variables 0
Number of continuous latent variables 0
Observed dependent variables
Continuous
MOTHED FATHED BAS7 BAS8 BAS9 BAS10
Estimator ML
Information matrix OBSERVED
Maximum number of iterations 1000
Convergence criterion 0.500D-04
Maximum number of steepest descent iterations 20
Maximum number of iterations for H1 2000
Convergence criterion for H1 0.100D-03
Input data file(s)
C:\Ed.231E\Assignment_01\lsay.dat
Input data format FREE
SUMMARY OF DATA
Number of patterns 41

8 INTRODUCTION TO MPLUS
SUMMARY OF MISSING DATA PATTERNS
MISSING DATA PATTERNS
1 2 3 4 5 6 7 8 9 10 11 12 13 14 15 16 17 18 19 20
MOTHED x x x x x x x x x x x x x x x x x x x x
FATHED x x x x x x x x x x x x x x x x
BAS7 x x x x x x x x x x x x
BAS8 x x x x x x x x x x x x
BAS9 x x x x x x x x x x
BAS10 x x x x x x x x x x
21 22 23 24 25 26 27 28 29 30 31 32 33 34 35 36 37 38 39 40
MOTHED x x x x x x x
FATHED x x x x x x x
BAS7 x x x x x x x x x x x x x x x x x
BAS8 x x x x x x x x x
BAS9 x x x x x x x x x x
BAS10 x x x x x x x x x x
41
MOTHED
FATHED
BAS7 x
BAS8
BAS9
BAS10
MISSING DATA PATTERN FREQUENCIES
Pattern Frequency Pattern Frequency Pattern Frequency
1 1526 15 2 29 2
2 320 16 9 30 1
3 151 17 95 31 1
4 331 18 32 32 1
5 124 19 8 33 2
6 45 20 33 34 5
7 43 21 13 35 22
8 210 22 7 36 1
9 15 23 9 37 11
10 6 24 20 38 6
11 1 25 2 39 4
12 4 26 3 40 2
13 1 27 1 41 24
14 3 28 16
COVARIANCE COVERAGE OF DATA
Minimum covariance coverage value 0.100

9
PROPORTION OF DATA PRESENT
Covariance Coverage
MOTHED FATHED BAS7 BAS8 BAS9
________ ________ ________ ________ ________
MOTHED 0.969
FATHED 0.897 0.906
BAS7 0.953 0.893 0.985
BAS8 0.812 0.763 0.819 0.829
BAS9 0.703 0.662 0.711 0.655 0.720
BAS10 0.639 0.605 0.649 0.590 0.585
Covariance Coverage
BAS10
________
BAS10 0.656
RESULTS FOR BASIC ANALYSIS
ESTIMATED SAMPLE STATISTICS
Means
MOTHED FATHED BAS7 BAS8 BAS9
________ ________ ________ ________ ________
1 2.349 2.623 50.376 54.803 59.362
Means
BAS10
________
1 63.118
Covariances
MOTHED FATHED BAS7 BAS8 BAS9
________ ________ ________ ________ ________
MOTHED 1.087
FATHED 0.606 1.562
BAS7 3.250 3.545 104.740
BAS8 3.222 3.830 89.633 132.627
BAS9 4.110 4.787 99.727 124.874 178.350
BAS10 4.265 5.032 100.104 120.635 155.931
Covariances
BAS10
________

10 INTRODUCTION TO MPLUS
BAS10 188.954
Correlations
MOTHED FATHED BAS7 BAS8 BAS9
________ ________ ________ ________ ________
MOTHED 1.000
FATHED 0.465 1.000
BAS7 0.305 0.277 1.000
BAS8 0.268 0.266 0.760 1.000
BAS9 0.295 0.287 0.730 0.812 1.000
BAS10 0.298 0.293 0.712 0.762 0.849
Correlations
BAS10
________
BAS10 1.000
MAXIMUM LOG-LIKELIHOOD VALUE FOR THE UNRESTRICTED (H1) MODEL IS -43443.242
PLOT INFORMATION
The following plots are available:
Histograms (sample values)
Scatterplots (sample values)
Beginning Time: 12:25:28
Ending Time: 12:25:30
Elapsed Time: 00:00:02
Mplus VERSION 3.0 DEMO has the following limitations:
Maximum number of y-variables: 6
Maximum number of x-variables: 2
Maximum number of between variables: 2
Maximum number of latent class indicators: 4
MUTHEN & MUTHEN
3463 Stoner Ave.
Los Angeles, CA 90066
Tel: (310) 391-9971
Fax: (310) 391-8971
Web: www.StatModel.com
Support: [email protected]
Copyright (c) 1998-2004 Muthen & Muthen
11
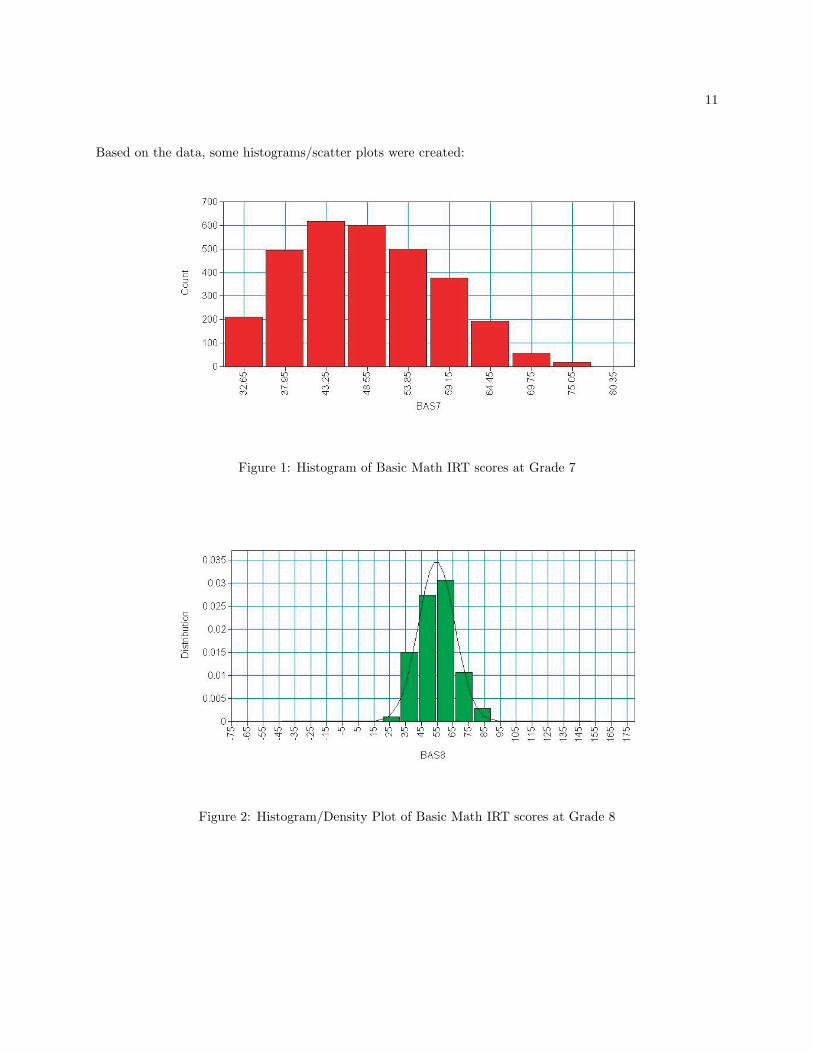
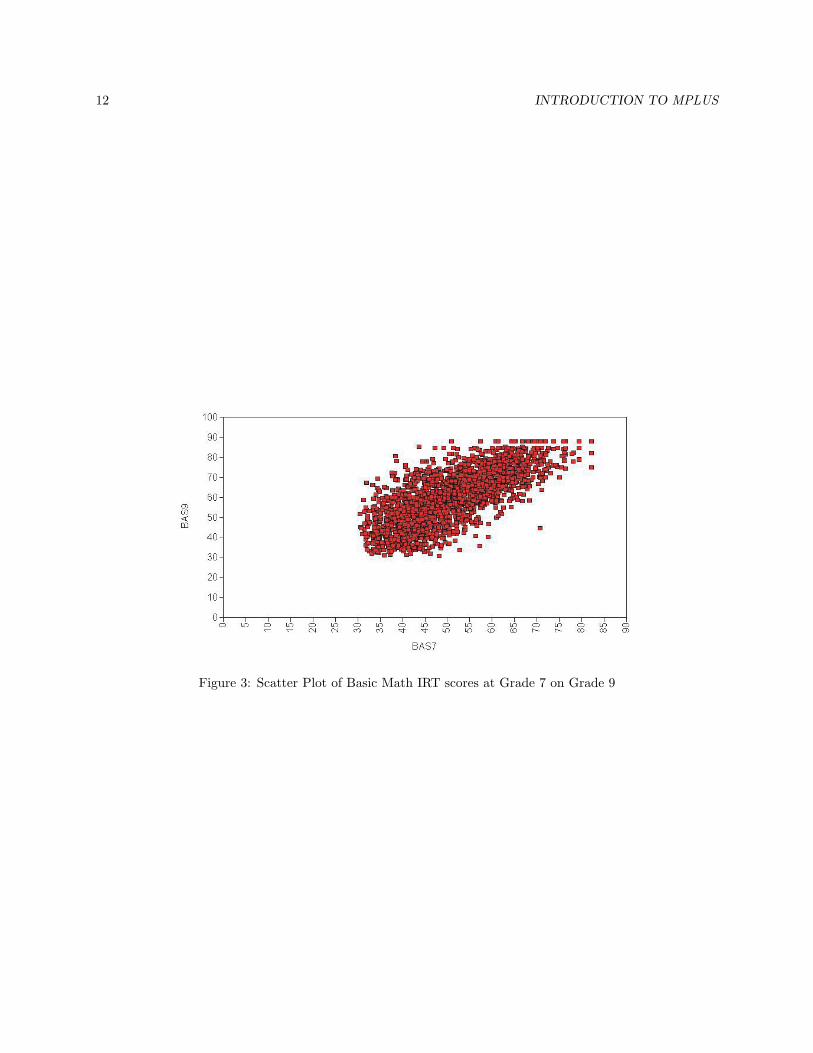
Based on the data, some histograms/scatter plots were created:
Figure 1: Histogram of Basic Math IRT scores at Grade 7
Figure 2: Histogram/Density Plot of Basic Math IRT scores at Grade 8
12 INTRODUCTION TO MPLUS
Figure 3: Scatter Plot of Basic Math IRT scores at Grade 7 on Grade 9