introduction to measurement methods guaging by current
TRANSCRIPT

PRINT VERSION MODULE
Introduction to measurement methods
• Discharge computations by Area
• Selection of vertical interval and number
• Measurement of width, horizontal distance or position in the horizontal
• Measurement of depth
Guaging by Current meters
• Type of Current meters
• Selection of Current meter
• Selection of points for velocity measurement
• Current meter guaging by wading
• Gauging from Cableways
• Gauging from Bridges
• Gauging from Boats
Special Conditions
• Drag ( Wetline / Dryline corrections )
• Oblique angle of flow
• Rapidly changing stage
Computation of Discharge
References
INTRODUCTION
One may wonder as to why a large number of stations located on various rivers across India operate all the year round to measure river discharge and concurrent any doubt, let us visualize the existence of a few structures that often open up before our eyes, such as Dams, Barrages, Rail and Road Bridges, Canals, and many more. Have you ever thought of extent of works involved in planning, design and execution of these structures? Or, have you ever imagined impact on us, if there were no such structures around us. Most likely, the answer is negative. Without debating the role of these structures for brevity, it is enough to stproportion of all such structures are largely dictated by analyses based on hydro
Introduction to measurement methods
Discharge computations by Area-Velocity Method Selection of vertical interval and number Measurement of width, horizontal distance or position in the horizontal
Measurement of depth
Guaging by Current meters
Type of Current meters Selection of Current meter Selection of points for velocity measurement Current meter guaging by wading
ging from Cableways Gauging from Bridges Gauging from Boats
( Wetline / Dryline corrections ) Oblique angle of flow Rapidly changing stage
One may wonder as to why a large number of stations located on various rivers across India operate all the year round to measure river discharge and concurrent water level. In order to steer clear of any doubt, let us visualize the existence of a few structures that often open up before our eyes, such as Dams, Barrages, Rail and Road Bridges, Canals, and many more. Have you ever thought of extent
d in planning, design and execution of these structures? Or, have you ever imagined impact on us, if there were no such structures around us. Most likely, the answer is negative. Without debating the role of these structures for brevity, it is enough to stproportion of all such structures are largely dictated by analyses based on hydro
Measurement of width, horizontal distance or position in the horizontal
One may wonder as to why a large number of stations located on various rivers across India operate water level. In order to steer clear of
any doubt, let us visualize the existence of a few structures that often open up before our eyes, such as Dams, Barrages, Rail and Road Bridges, Canals, and many more. Have you ever thought of extent
d in planning, design and execution of these structures? Or, have you ever imagined impact on us, if there were no such structures around us. Most likely, the answer is negative. Without debating the role of these structures for brevity, it is enough to stress here that proportion of all such structures are largely dictated by analyses based on hydro-meteorological

data collected at these stations. Secondly, since basin characteristics and river regime both exhibit continuous changes, it is equally important to gather data at judiciously adopted intervals. The Central Water Commission under Ministry of Water Resources, Govt of India alone maintains over 900 stations (For details, pl visit: http://www.cwc.nic.in ).
Whilst a wide range of techniques to record river discharge are available, in this module, our focus will be pointed to river discharge estimation by velocity-area method only. Alternative options, such as slope-area method, float method etc. are available, and can be engaged at a particular site, if velocity area method approach is limited by the geometric and hydraulic characteristics of the channel, and by the facilities and instruments available at the site.
Top of page
DISCHARGE COMPUTATION BY VELOCITY-AREA METHOD
As the name suggests, in this method, discharge is computed by measuring river depths and velocity at a number of regularly or irregularly spaced verticals as shown in figure below.

This set of information is eventually integrated by mid-section method to determine river discharge. This satisfies the equation Q = A * V. Succeeding paragraphs of this module elaborate these aspects in greater depth.
Top of page
SELECTION OF VERTICAL INTERVAL AND NUMBER

For rivers greater than 10 m wide it is recommended, in line with ISO 748 and other practice, that at least 20 verticals be used and that the discharge in any one segment does not exceed 10% of the total. Between 20 and 30 verticals will normally be used. Uncertainties in stream flow measurement are expressed as percentages. The percentage uncertainty of using say 25 verticals is of the same order for all widths of river, irrespective of the width of segments.
For small rivers less than 10 metres in width the following selection criteria are recommended:
Additional Conditions
Two additional verticals not included in the above are required close to each of the two water's edges (banks).
In all instances depths and velocities made at the waters edge are additional to above.
The difference in water depth between two adjacent verticals should not exceed 50% of the smaller.
The difference in velocity between nonadjacent verticals shall not exceed 50% of the smaller.
The linked image cannot be displayed. The file may have been moved, renamed, or deleted. Verify that the link points to the correct file and location.
For rivers greater than 10 m wide it is recommended, in line with ISO 748 and other practice, that at least 20 verticals be used and that the discharge in any one segment does not exceed 10% of the total.
will normally be used. Uncertainties in stream flow measurement are expressed as percentages. The percentage uncertainty of using say 25 verticals is of the same order for all widths of river, irrespective of the width of segments.
less than 10 metres in width the following selection criteria are recommended:
Two additional verticals not included in the above are required close to each of the two water's
In all instances depths and velocities made at the waters edge are additional to above.
The difference in water depth between two adjacent verticals should not exceed 50% of the
The difference in velocity between non-zero samples taken at the same proportion of depth in adjacent verticals shall not exceed 50% of the smaller.
For rivers greater than 10 m wide it is recommended, in line with ISO 748 and other practice, that at least 20 verticals be used and that the discharge in any one segment does not exceed 10% of the total.
will normally be used. Uncertainties in stream flow measurement are expressed as percentages. The percentage uncertainty of using say 25 verticals is of the same order
less than 10 metres in width the following selection criteria are recommended:
Two additional verticals not included in the above are required close to each of the two water's
In all instances depths and velocities made at the waters edge are additional to above.
The difference in water depth between two adjacent verticals should not exceed 50% of the
s taken at the same proportion of depth in
Top of page
MEASUREMENT OF WIDTH, HORIZONTAL DISTANCE OR POSITION IN THE HORIZONTAL
The measurement of the width of the channel and of individual segments or finding the position across the river relative to a fixed reference, are obtained by measuring the distance from or to a fixed reference point on the river bank. The technique selected depends on the width of the channel and the method of deployment used for gauging.
• Wading gauging
• Bridges
• Fixed cableways with bankside winch (unmanned instrument carriage) • Fixed cableways with cable car (winch and cradle/manned trolley) • If gauging is by boat, it includes following techniques:
o Pivot point method o Linear measurement methods o Angular method, or using Sextant o Stadia method, and o Geographic positioning system
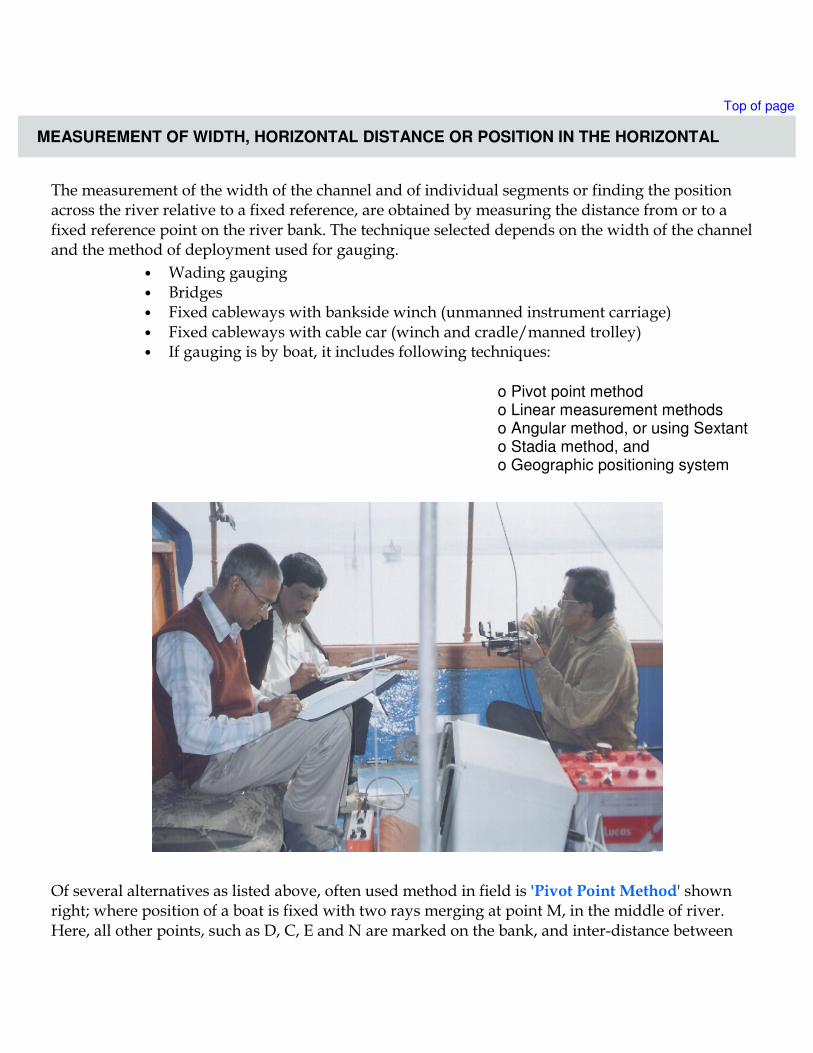
Of several alternatives as listed above, often used method in field is 'Pivot Point Method' shown right; where position of a boat is fixed with two rays merging at point M, in the middle of river. Here, all other points, such as D, C, E and N are marked on the bank, and inter-distance between

these points help estimate MD - the distance of vertical/boat from a benchmark point D. By switching the position of N, i.e. different CN values, boat position at other points can be easily determined. In another approach, an officer is seen here holding a sextant to determine the location of his boat along the measuring section.
Another layout of 'Pivot Point Method' shown here defines various positions of boats across the river by holding flags at E1, E2 - one by one. Either of the two methods can be used in field according to site condition.

Top of page
MEASUREMENT OF DEPTH
Once a team establishes its position at a pre-defined vertical in the middle of river, their next target is to measure river depth. The method of depth measurement during gauging depends on depth and velocity and whether done by wading, cableway, bridge or boat. Depth and position in the vertical are measured by rigid rod or by a sounding weight suspended from a cable provided that velocities are not too high. Regardless of what method is opted for, at least two observations of depth are suggested at each vertical and the mean of the two values used for area and discharge computation. Following instruments are commonly used in depth measurement:
o Wading rods o Sounding rods o Sounding reels and cables (including wet- and airline correction) o Echo-sounder
For a shallow river/stream, normally wading or sounding rods is used to measure depth. For deeper rivers, and where velocity is high, eco-sounder is commonly used instrument. The sounding transducer mounted underwater, releases bursts of ultrasonic energy at fixed intervals and the instrument measures the time required for these pulses of energy to travel to the stream bed and to be reflected and return to the transducer. With the known propagation velocity of sound in water,

the sounder computes and records the depth on a strip chart, dial, data logger or portable PC. Here, in the picture, observer is seen measuring the depth by wading rod.
Top of page
TYPE OF CURRENTMETERS
There are two types of current (point velocity) meter which are used in India.
1. Vertical-axis meter - cup/buckets
2. Horizontal-axis meters - helical screw (impeller)

Examples of both these types of meter are shown right. The vertical axis cup or bucket type meter is the most widely used current meter in India. Both types of meter have disadvantages. However, if they are maintained well and deployed correctly then they should give satisfactory performance and results. The rotating element current meter operates on the proportionality between local flow velocity and the local angular velocity of the meter rotor. The relationship between velocity and rotor speed is usually established experimentally by towing the meter at various velocities through sensibly still water and recording the revolutions of the rotor.
The calibration relationship is usually of the form:
v = a + bn where: v = water velocity (m/s)n = speed of impeller (revs/s)a, b = constants
Optionally, a calibration chart can also
Generally for most Indian applications it is recommended that an exposure time of 60 seconds be adopted. If the velocities are very low and there are less than 20 counts
Examples of both these types of meter are shown right. The vertical axis cup or bucket type meter is the most widely used current meter in India. Both types of meter have their advantages and disadvantages. However, if they are maintained well and deployed correctly then they should give satisfactory performance and results.
The rotating element current meter operates on the proportionality between local flow velocity and the local angular velocity of the meter rotor. The relationship between velocity and rotor speed is usually established experimentally by towing the meter at various velocities through sensibly still water and recording the revolutions of the rotor.
The calibration relationship is usually of the form:
where: v = water velocity (m/s) n = speed of impeller (revs/s)
Optionally, a calibration chart can also be used to read velocity against speed of impeller.
Generally for most Indian applications it is recommended that an exposure time of 60 seconds be adopted. If the velocities are very low and there are less than 20 counts in fifty seconds the exposure
Examples of both these types of meter are shown right. The vertical axis cup or bucket type meter is their advantages and
disadvantages. However, if they are maintained well and deployed correctly then they should give
The rotating element current meter operates on the proportionality between local flow velocity and the local angular velocity of the meter rotor. The relationship between velocity and rotor speed is usually established experimentally by towing the meter at various velocities through sensibly still
be used to read velocity against speed of impeller.
Generally for most Indian applications it is recommended that an exposure time of 60 seconds be in fifty seconds the exposure
time should be increased to 100 seconds.
Alternatively the time it takes to record 20 revolutions should be measured. In situations where the stage is varying rapidly it is possible that the exposure time could be reduced to 30 seconds.
Top of page
SELECTION OF CURRENT METER
A limited number of current meters (often 2) are available for gauging at a particular station, usually a standard larger diameter (100 to 125 mm diameter) and a smaller diameter Pygmy meter. The larger diameter meter will be used for bridge, cableway and boat measurement but for wading gauging the meter chosen will depend on the depth of flow.
The selected current meter should normally not be used in water less than four times the diameter of the impeller because the registration of the meter is affected by its proximity to the water surface and the bed. Thus a standard 100 mm diameter meter should not normally be used when the depth of water across the section is less than 0.4 metres. In addition, ISO 748 recommends that the horizontal axis of the current meter is situated at a distance not less than one and a half times the rotor height from the water surface or three times the rotor height from the bed. In particular no part of the meter should break the surface of the water. Where only a small number of verticals (< 4) exist on the river margins with a depth less than 0.4 m, it is usually not profitable to change to a smaller meter.
The miniature (Pygmy) meter is best suited for gauging in depths of less than 0.5 metres when the expected velocity is less than the meter's maximum calibration velocity (usually about 1 m/sec).
In general, meters should be selected which will operate within their calibration range, and particular consideration should be given to performance and the minimum speed of response in rivers with very low velocities.
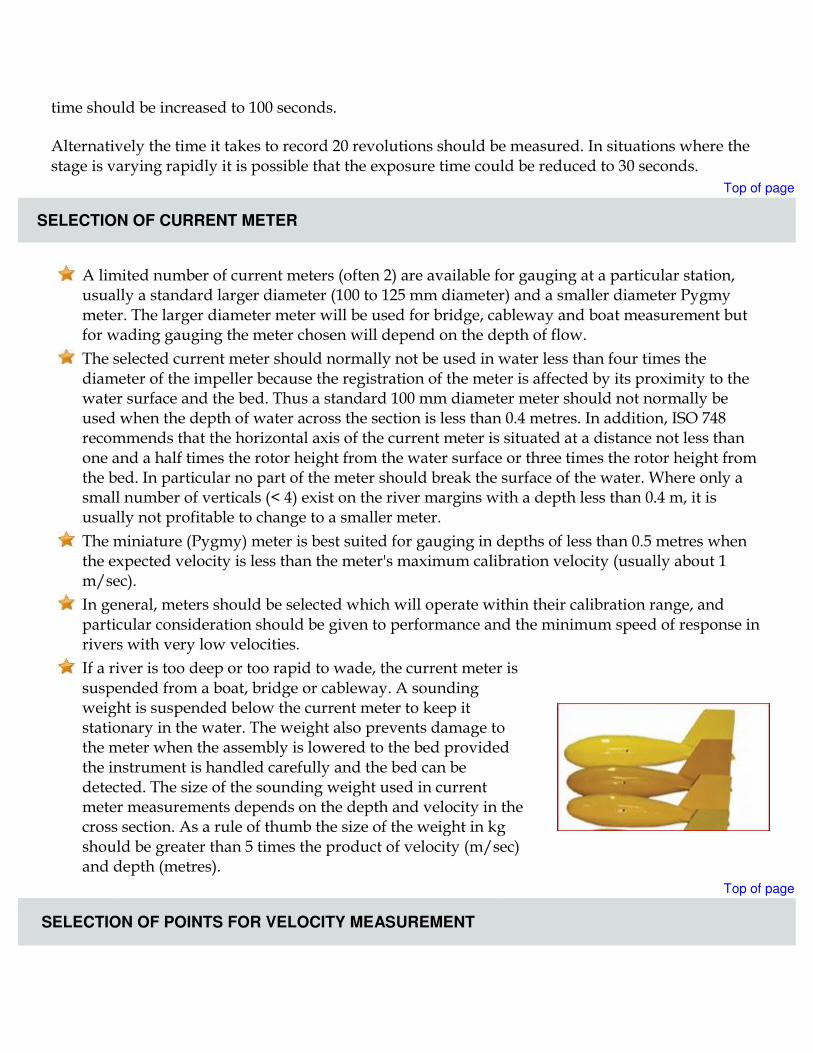
If a river is too deep or too rapid to wade, the current meter is suspended from a boat, bridge or cableway. A sounding weight is suspended below the current meter to keep it stationary in the water. The weight also prevents damage to the meter when the assembly is lowered to the bed provided the instrument is handled carefully and the bed can be detected. The size of the sounding weight used in current meter measurements depends on the depth and velocity in the cross section. As a rule of thumb the size of the weight in kg should be greater than 5 times the product of velocity (m/sec) and depth (metres).
Top of page
SELECTION OF POINTS FOR VELOCITY MEASUREMENT
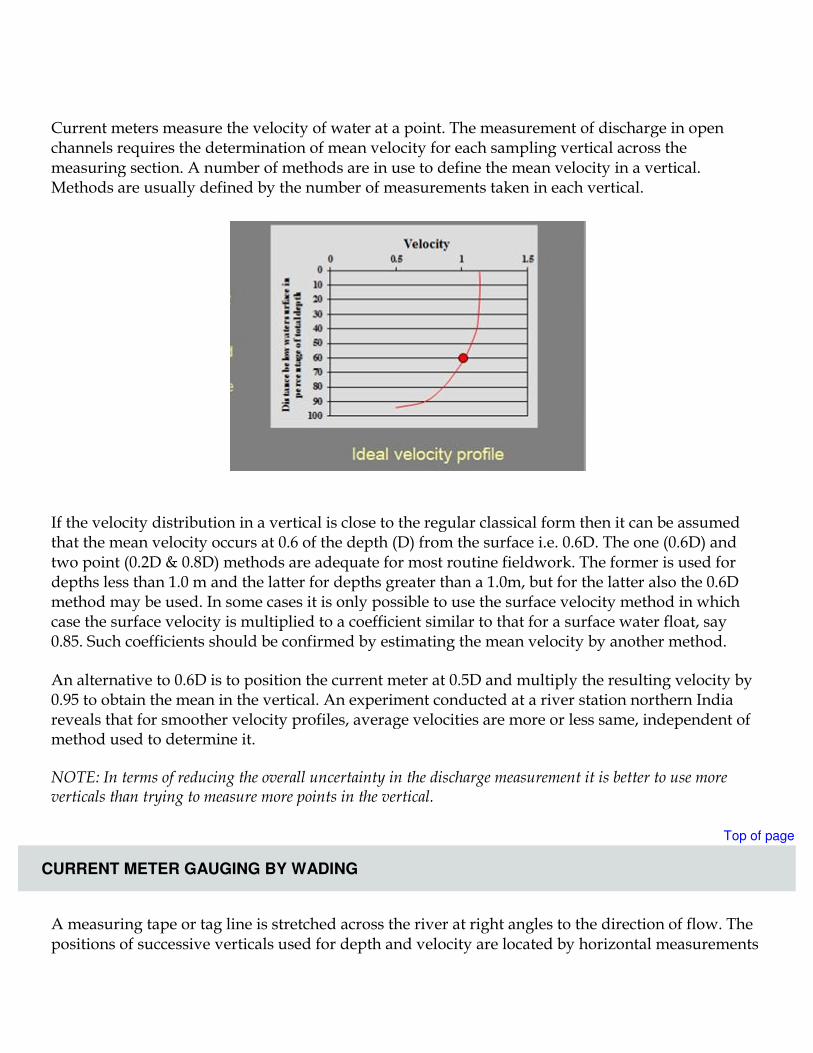
Current meters measure the velocity of water at a point. The measurement of discharge in open channels requires the determination of mean velocity for each sampling vertical across the measuring section. A number of methods are in use to define the mean velocity in a vertical. Methods are usually defined by the number of measurements taken in each vertical.
If the velocity distribution in a vertical is close to the regular classical form then it can be assumed that the mean velocity occurs at 0.6 of the depth (D) from the surface i.e. 0.6D. The one (0.6D) and two point (0.2D & 0.8D) methods are adequate for most routine fieldwork. The former is used for depths less than 1.0 m and the latter for depths greater than a 1.0m, but for the latter also the 0.6D method may be used. In some cases it is only possible to use the surface velocity method in which case the surface velocity is multiplied to a coefficient similar to that for a surface water float, say 0.85. Such coefficients should be confirmed by estimating the mean velocity by another method.
An alternative to 0.6D is to position the current meter at 0.5D and multiply the resulting velocity by 0.95 to obtain the mean in the vertical. An experiment conducted at a river station northern India reveals that for smoother velocity profiles, average velocities are more or less same, independent of method used to determine it.
NOTE: In terms of reducing the overall uncertainty in the discharge measurement it is better to use more verticals than trying to measure more points in the vertical.
Top of page
CURRENT METER GAUGING BY WADING
A measuring tape or tag line is stretched across the river at right angles to the direction of flow. The positions of successive verticals used for depth and velocity are located by horizontal measurements
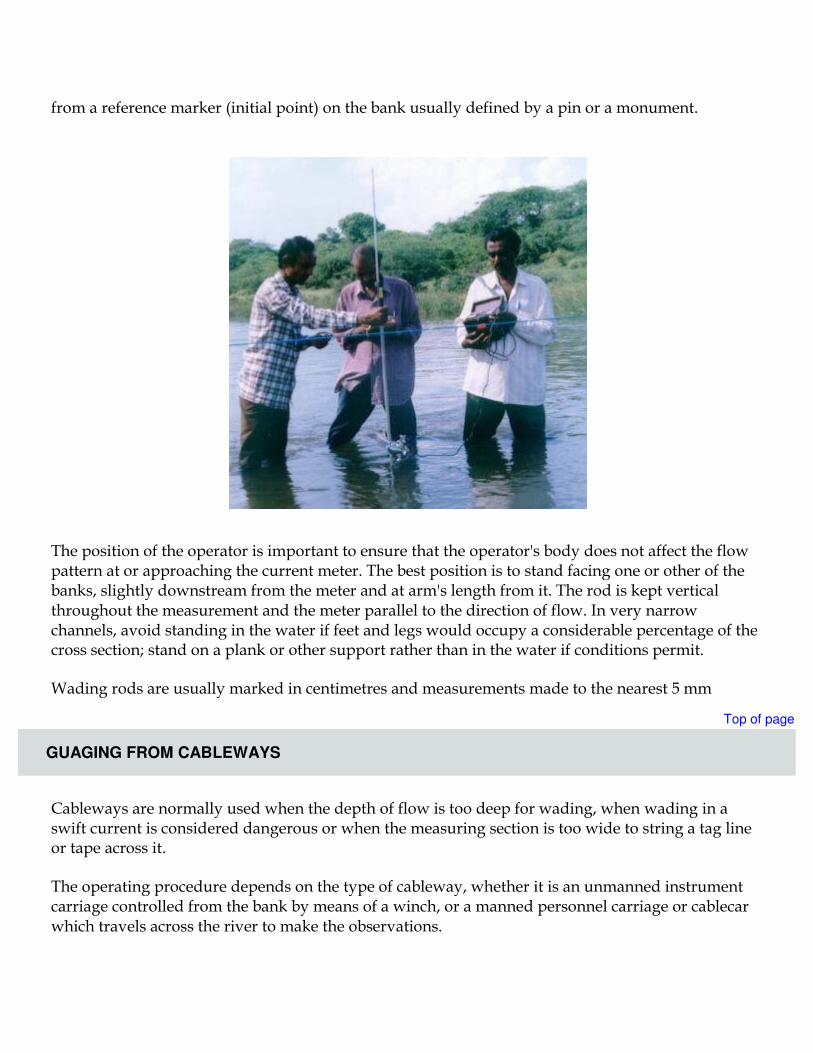
from a reference marker (initial point) on the bank usually defined by a pin or a monument.
The position of the operator is important to ensure that the operator's body does not affect the flow pattern at or approaching the current meter. The best position is to stand facing one or other of the banks, slightly downstream from the meter and at arm's length from it. The rod is kept vertical throughout the measurement and the meter parallel to the direction of flow. In very narrow channels, avoid standing in the water if feet and legs would occupy a considerable percentage of the cross section; stand on a plank or other support rather than in the water if conditions permit.
Wading rods are usually marked in centimetres and measurements made to the nearest 5 mm
Top of page
GUAGING FROM CABLEWAYS
Cableways are normally used when the depth of flow is too deep for wading, when wading in a swift current is considered dangerous or when the measuring section is too wide to string a tag line or tape across it.
The operating procedure depends on the type of cableway, whether it is an unmanned instrument carriage controlled from the bank by means of a winch, or a manned personnel carriage or cablecar which travels across the river to make the observations.
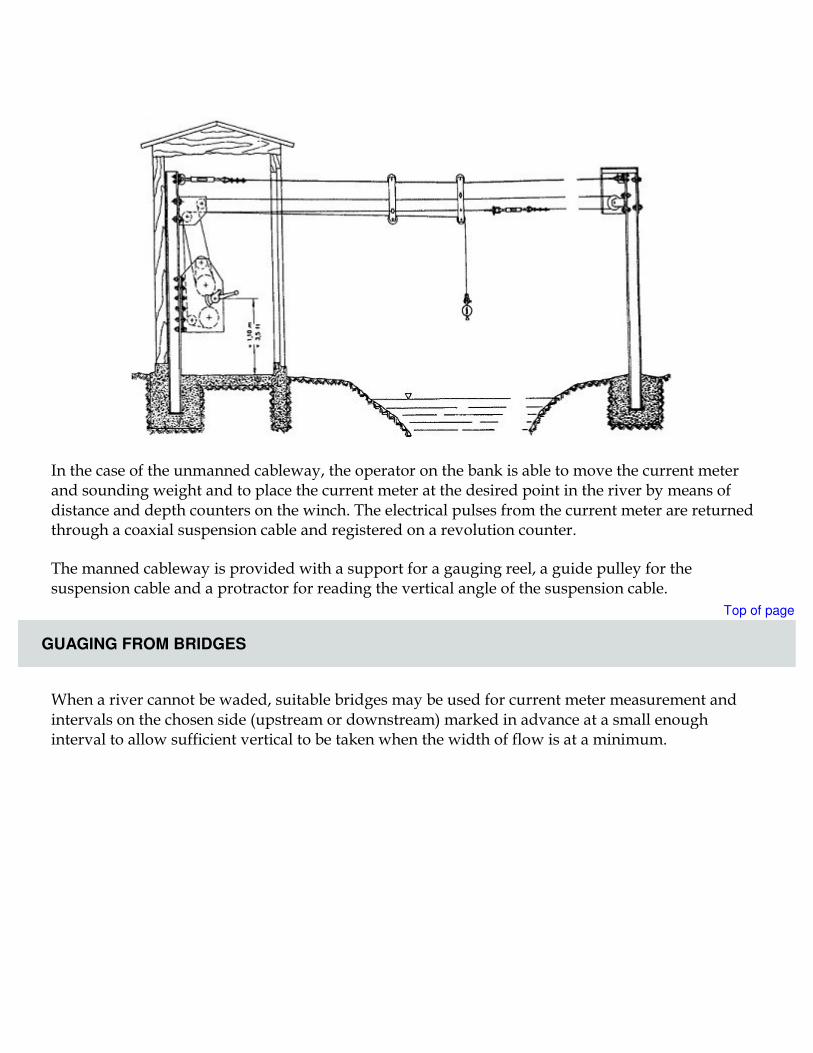
In the case of the unmanned cableway, the operator on the bank is able to move the current meter and sounding weight and to place the current meter at the desired point in the river by means of distance and depth counters on the winch. The electrical pulses from the current meter are returned through a coaxial suspension cable and registered on a revolution counter.
The manned cableway is provided with a support for a gauging reel, a guide pulley for the suspension cable and a protractor for reading the vertical angle of the suspension cable.
Top of page
GUAGING FROM BRIDGES
When a river cannot be waded, suitable bridges may be used for current meter measurement and intervals on the chosen side (upstream or downstream) marked in advance at a small enough interval to allow sufficient vertical to be taken when the width of flow is at a minimum.

Low footbridges can sometimes be used on a small stream with rod suspension with extension rods. The procedure in low velocities is the same as for a wading measurement but the procedure for obtaining the depth in higher velocities should be modified to eliminate errors caused by the water piling up on the upstream face of the rod as follows:
• For each selected vertical, a point is established on the bridge
• The distance from this point to the water surface is measured by lowering the rod until the base plate just touches the water.
• The rod is then lowered to the bed and the reading again noted at the index point. The difference in these readings is the depth of water in the vertical.
For road bridges care must be taken to ensure that road traffic does not endanger the gauging team or other road users. Particular precaution must be taken on narrow bridges without pedestrian walkways. Warning signs should be set up at appropriate distances on both approaches and the area of working clearly delimited by marker cones. Additional precautions should be taken when the section is subject to the passage of river traffic, with one team member stationed as a lookout to give warning of approaching craft with sufficient time to reel in the suspended equipment.
Top of page
GUAGING FROM BOATS
Discharge measurements are made from boats where no gauging cableways or suitable bridges are available and the river is too deep to wade. The boat is held in place in the measuring section either by fixing to a cable strung across the river (the boat/cableway method) or by using an adequately powered boat.
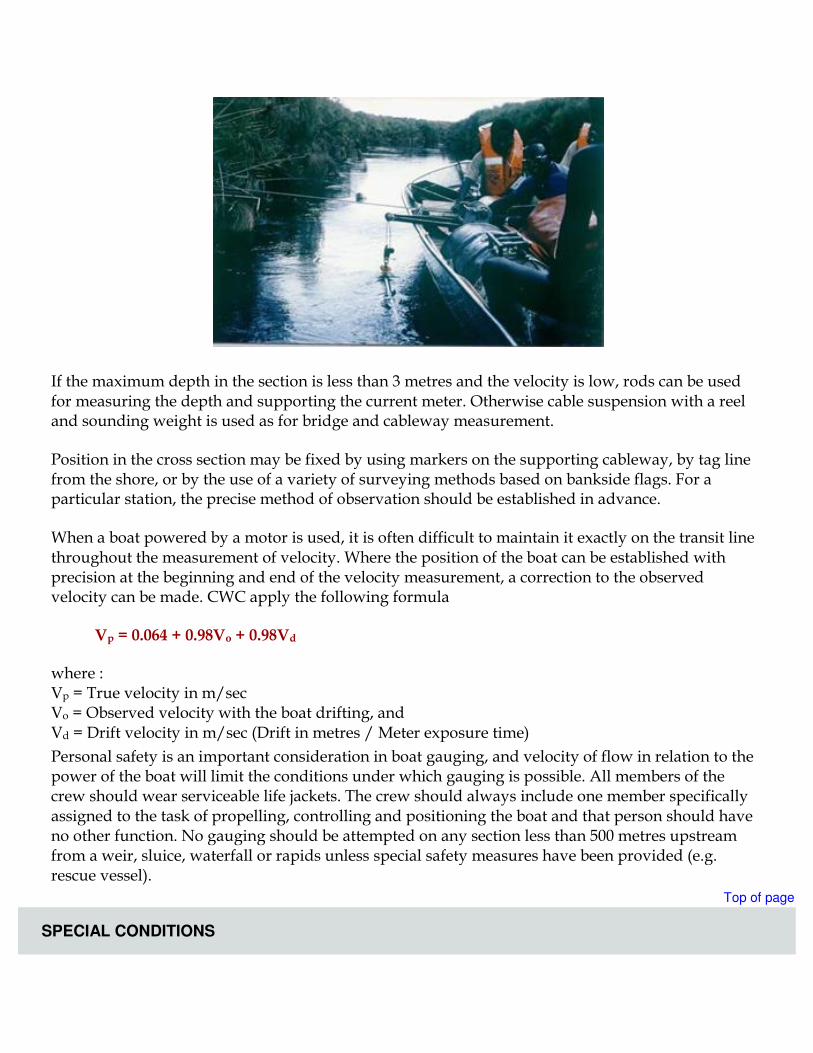
If the maximum depth in the section is less than 3 metres and the velocity is low, rods can be used for measuring the depth and supporting the current meter. Otherwise cable suspension with a reel and sounding weight is used as for bridge and cableway measurement.
Position in the cross section may be fixed by using markers on the supporting cableway, by tag line from the shore, or by the use of a variety of surveying methods based on bankside flags. For a particular station, the precise method of observation should be established in advance.
When a boat powered by a motor is used, it is often difficult to maintain it exactly on the transit line throughout the measurement of velocity. Where the position of the boat can be established with precision at the beginning and end of the velocity measurement, a correction to the observed velocity can be made. CWC apply the following formula
Vp = 0.064 + 0.98Vo + 0.98Vd where : Vp = True velocity in m/sec Vo = Observed velocity with the boat drifting, and Vd = Drift velocity in m/sec (Drift in metres / Meter exposure time)
Personal safety is an important consideration in boat gauging, and velocity of flow in relation to the power of the boat will limit the conditions under which gauging is possible. All members of the crew should wear serviceable life jackets. The crew should always include one member specifically assigned to the task of propelling, controlling and positioning the boat and that person should have no other function. No gauging should be attempted on any section less than 500 metres upstream from a weir, sluice, waterfall or rapids unless special safety measures have been provided (e.g. rescue vessel).
Top of page
SPECIAL CONDITIONS

There are a number of conditions associated with cableway, bridge and boat gauging which require additional measurement and computation. These include cableway drag and consequent depth corrections, corrections for oblique angle of flow and the effects of rapid changes in stage during the gauging.
Top of page
Drag (Wet line / Dry line corrections)
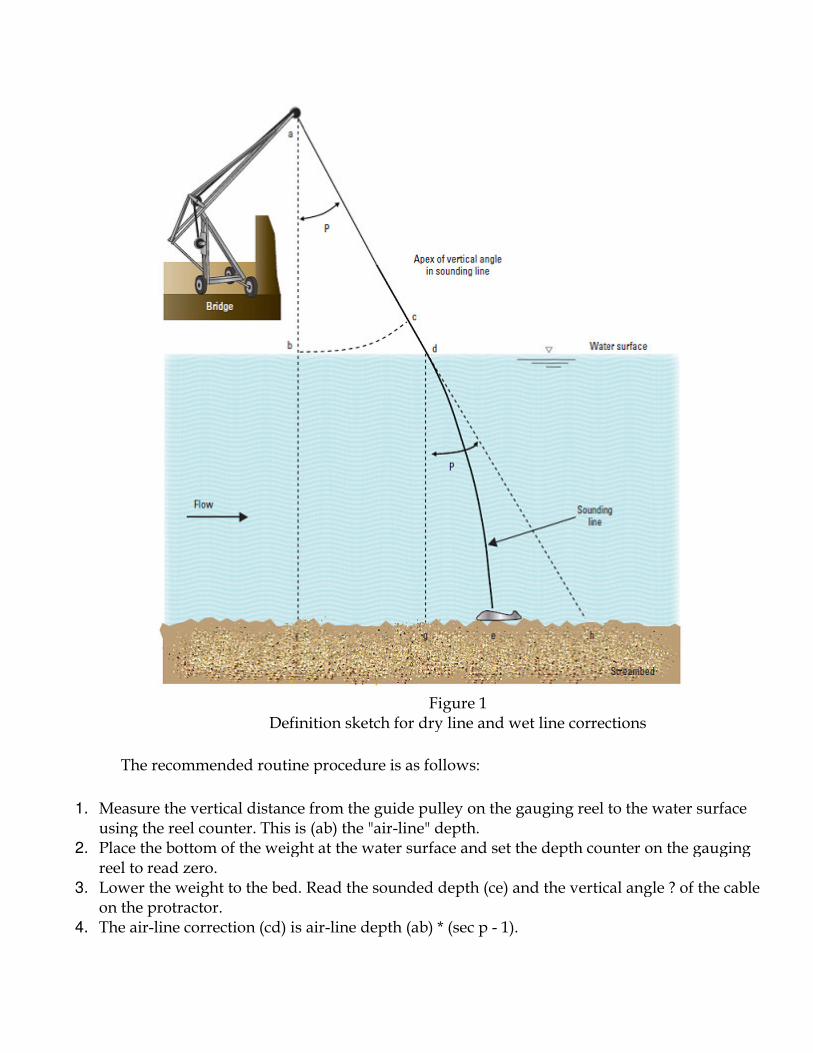
When measurements are made by suspending the current meter in deep swift water, it is carried downstream before the weight touches the bottom (Figure 1). The length of cable paid out is more than the true depth. In order to obtain the corrected depth, dry/air line and wet line corrections, which are functions of the vertical angle p, are applied to the observed depth, where the angle p is measured by a fixed protractor.
Definition sketch for dry line and wet line corrections
The recommended routine procedure is as follows:
1. Measure the vertical distance from the guide pulley on the gauging reel to the water surface using the reel counter. This is (ab) the "air
2. Place the bottom of the weight at the water surface and set the depth counter on the gauging reel to read zero.
3. Lower the weight to the bed. Read the sounded depth (ce) and the vertical angle ? of the cable on the protractor.
4. The air-line correction (cd) is air
Figure 1 Definition sketch for dry line and wet line corrections
The recommended routine procedure is as follows:
Measure the vertical distance from the guide pulley on the gauging reel to the water surface using the reel counter. This is (ab) the "air-line" depth. Place the bottom of the weight at the water surface and set the depth counter on the gauging
Lower the weight to the bed. Read the sounded depth (ce) and the vertical angle ? of the cable
s air-line depth (ab) * (sec p - 1).
Definition sketch for dry line and wet line corrections
Measure the vertical distance from the guide pulley on the gauging reel to the water surface
Place the bottom of the weight at the water surface and set the depth counter on the gauging
Lower the weight to the bed. Read the sounded depth (ce) and the vertical angle ? of the cable

5. Calculate the wet line length as (sounded depth - air line correction) (de = ce - cd) 6. The wet line correction for given angle p is shown in Table below. The correction is applied to
wet line depth.
7. Wet line depth minus wet line correction is true depth of water.
EXAMPLE : AIR LINE AND WET LINE CORRECTIONS
The total length of a sounding line when the sinker weight is touching the bed of a river = 7.55 m. The depth from guide pulley to surface = 3.0 m. The angle between the vertical and the sounding line at the point of suspension i.e. p = 20o . What is the true depth of the vertical? Solution: ce = ae - ab = 7.55 - 3.0 = 4.55
Air line correction, cd = (sec α - 1) x ab = (sec 20 -1) x 3 = (1.064 - 1) x 3.0= 0.19 m. Wet line depth, de = ce - cd = 4.55 - 0.19 = 4.36 m. Wet line % correction for p, 20 = 2.04% from Table Wet line correction = 2.04% x 4.36 = 0.0204 x 4.36 = 0.09 True depth = ce - air line corr. - wet line corr. = 4.55 - 0.19 - 0.09 = 4.27 m
Top of page
OBLIQUE ANGLE OF FLOW
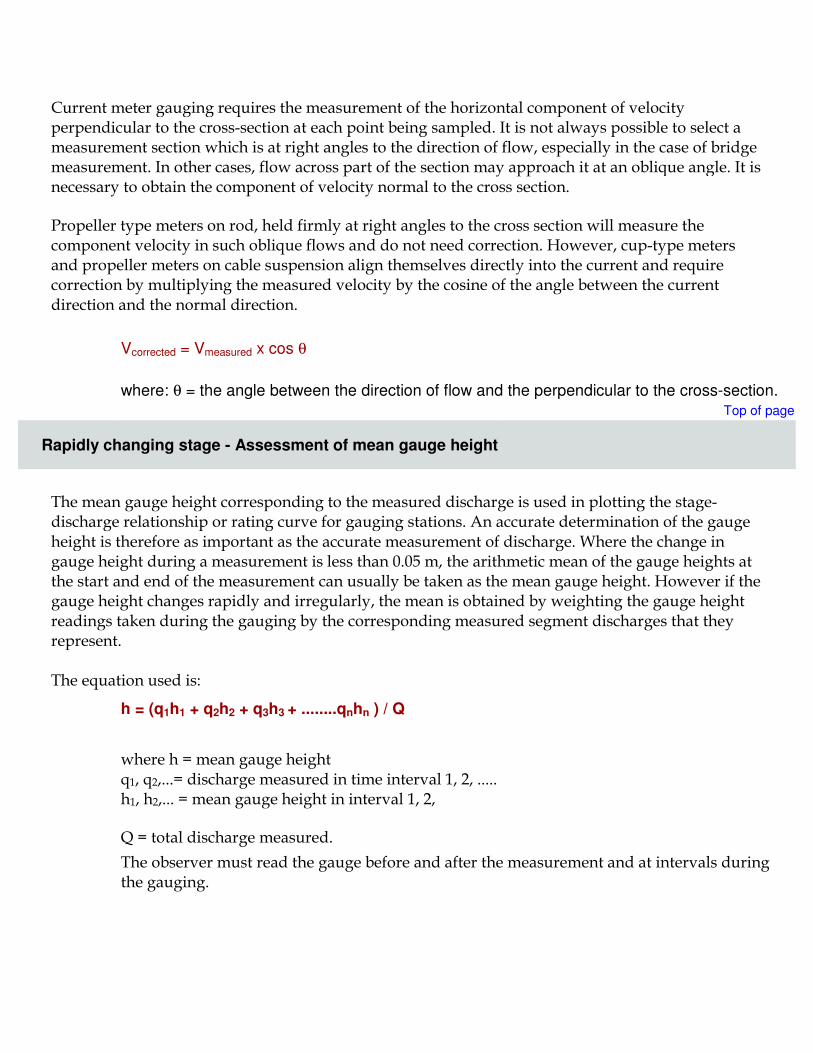
Current meter gauging requires the measurement of the horizontal component of velocity perpendicular to the cross-section at each point being sampled. It is not always possible to select a measurement section which is at right angles to the direction of flow, especially in the case of bridge measurement. In other cases, flow across part of the section may approach it at an oblique angle. It is necessary to obtain the component of velocity normal to the cross section.
Propeller type meters on rod, held firmly at right angles to the cross section will measure the component velocity in such oblique flows and do not need correction. However, cup-type meters and propeller meters on cable suspension align themselves directly into the current and require correction by multiplying the measured velocity by the cosine of the angle between the current direction and the normal direction.
Vcorrected = Vmeasured x cos θ
where: θ = the angle between the direction of flow and the perpendicular to the cross-section.
Top of page
Rapidly changing stage - Assessment of mean gauge height
The mean gauge height corresponding to the measured discharge is used in plotting the stage- discharge relationship or rating curve for gauging stations. An accurate determination of the gauge height is therefore as important as the accurate measurement of discharge. Where the change in gauge height during a measurement is less than 0.05 m, the arithmetic mean of the gauge heights at the start and end of the measurement can usually be taken as the mean gauge height. However if the gauge height changes rapidly and irregularly, the mean is obtained by weighting the gauge height readings taken during the gauging by the corresponding measured segment discharges that they represent. The equation used is:
h = (q1h1 + q2h2 + q3h3 + ........qnhn ) / Q
where h = mean gauge height q1, q2,...= discharge measured in time interval 1, 2, ..... h1, h2,... = mean gauge height in interval 1, 2,
Q = total discharge measured.
The observer must read the gauge before and after the measurement and at intervals during the gauging.

Rapidly changing stage - Quick Approach
Sometimes water level changes so rapidly, especially during rising flood conditions, which it is difficult to assign a mean gauge height to the gauging if the normal number of intervals and exposure time is adopted. In these circumstances it is legitimate to simplify the gauging such that it can be completed in less than 30 minutes. The following simplifications may be made, either singly or in combination.
• Reduce the number of vertical taken to about 15 to 18
• Reduce the velocity observation time to about 30 secs. • Use measurement only at 0.2 depth and multiply the measured velocities by 0.87 (or an
alternative value based on a previous full gauging at the site) to obtain mean velocity in the vertical
• Use a pre-surveyed cross section to assess depth at each vertical from the gauge height observed at each measurement vertical and hence to set the meter at the measurement depth without sounding.
Top of page
COMPUTATION OF DISCHARGE
The computation of discharge can be attempted by mid-section method. In India, agencies involved in collection of discharge observation activities use SWDES software - a freeware for computation of discharge, storage of a range of hydro-meteorological data and its primary validation. This software estimates discharge value following mid-section method. Secondary and basin level data validation and analyses are accomplished with HYMOS software.
Here below are steps enumerated for discharge section layout shown here. Water edge begins at relative distance(RD) 7.0m on left bank, and ends at RD 59m opposite bank. Schematic below displays RDs & corresponding depth. Velocity was recorded at 0.6d at each vertical.
Here below are steps enumerated for discharge estimation by Mid-section method for a river crosssection layout shown here. Water edge begins at relative distance(RD) 7.0m on left bank, and ends at RD 59m opposite bank. Schematic below displays RDs & corresponding depth. Velocity was
section method for a river cross-section layout shown here. Water edge begins at relative distance(RD) 7.0m on left bank, and ends at RD 59m opposite bank. Schematic below displays RDs & corresponding depth. Velocity was

1. Segment Width: Since the mid-section method assumes that the velocity sampled at each vertical represents a mean velocity in a segment, the segment width (and area) extends from half the distance from the preceding vertical to half the distance to the next. Here, in the current example, barring end segments on either ends, all verticals are 5m apart
2. Segment Area: Segment area is computed as below
ai = di * (bi+1 - bi-1) / 2
where, bi+1, bi-1 =distances from an initial (reference) point on the bank to verticals i +1 and i - 1, di = depth of flow at vertical. Let us denote first RD & its depth as bi-1 & di-1 respectively.
For instance, for first segment, d1 = 1 m, b0 = 7, & b2 = 15, hence, a1 = 1 * (15 - 7)/2 = 4 m2
For end sections on either bank, area is computed by
Aend = di-1 * (bi - bi-1) / 2
3. Segment Velocity: Velocity at a point is read from the appropriate current meter rating table for given revolutions and time. Corrections as required are made for skewed flow and drift. For measurements at 0.6d only, the vertical and segment velocity are the same as the point velocity. For 2-point measurement at 0.2 and 0.8 the segment velocity is the mean of the two velocities. However, when the cross section boundary is vertical at the edge (e.g. bridge abutments and piers), the segment velocity may not be zero and it is usually necessary to estimate the velocity at the end segments as a percentage of the velocity on the adjacent
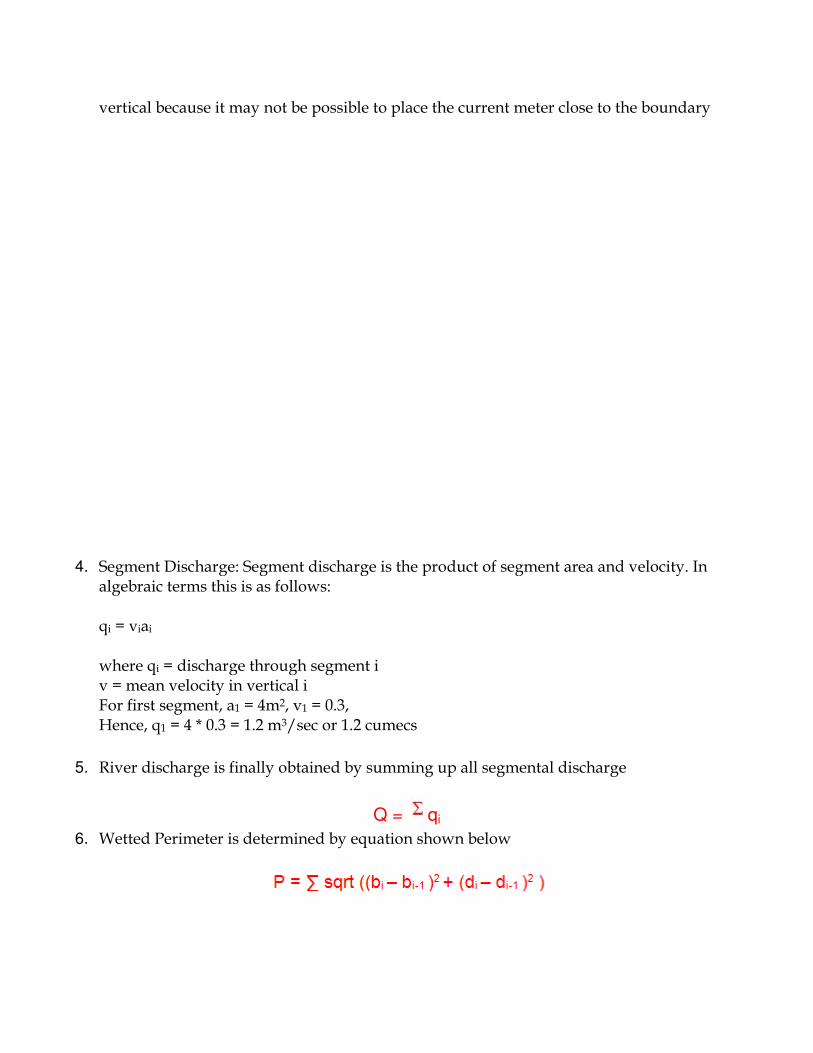
vertical because it may not be possible to place the current meter close to the boundary
4. Segment Discharge: Segment discharge is the product of segment area and velocity. In algebraic terms this is as follows: qi = viai where qi = discharge through segment i v = mean velocity in vertical i For first segment, a1 = 4m2, v1 = 0.3, Hence, q1 = 4 * 0.3 = 1.2 m3/sec or 1.2 cumecs
5. River discharge is finally obtained by summing up all segmental discharge
Q = qi
6. Wetted Perimeter is determined by equation shown below

7. A discharge computation sheet shown below presents calculations involved in estimation of discharge and other parameters by mid-section method. This sheet can be downloaded by users. A tiny triangle in red at upper right corner of few cells contains comments and hints that will guide users finish their assignment. User may upload a complete assignment sheet for its evaluation; once this particular assignment is over
Top of page
REFERENCES
1. Design and Field Manual of Hydrometry published under Hydrology Project Phase -I 2. World Meteorological Organization Document on Stream Gauging by Conventional Current
Meter Method
Module Developed by
Anup Kumar Srivastava
Director
National Water Academy

Pune, India