introduction to: light quantity and quality · introduction to: light quantity and quality ... as...
TRANSCRIPT

9/16/2004 2:10 PM
Introduction to: Light Quantity and Quality
By Dr. James Wood and Kelsie Jackson
Light and Color
Why are some things seen as red while others are seen as blue? For instance, why is the ocean blue while plants are often green? The answer has to do with light and the way it interacts with objects.
Light is a type of electromagnetic radiation. Electromagnetic radiation is made up of waves that transport energy. This energy travels in tiny packets known as photons. There are many different types of electromagnetic radiation, and together they make up the electromagnetic spectrum, which includes: radio waves, microwaves, infrared waves, visible light waves, ultraviolet waves, X-rays, and gamma rays. Waves can be measured by their wavelength (the size of the wave) and frequency (how many waves pass a point during a time interval). All of the energy inside a photon has its own wavelength and frequency.
(figure 1)
Photons of visible light (light that humans can see) have wavelengths of 400-700
nanometers (10-9 meter or billionths of a meter), and a frequency of 430-750 trillion (1012) cycles per second.
The light from the sun contains millions of photons of variable wavelength, not all of which are visible to humans. Within the range of wavelengths that make up visible light, different wavelengths correspond to different colors. The light seen from the sun appears white, as it contains all wavelengths and thus all colors. (Imagine a prism breaking white light into the colors of the rainbow.) When photons hit an object, they
9/16/2004 2:10 PM
may be absorbed, transmitted or reflected. An object appears a certain color when all other wavelengths are absorbed except the color being seen, which is reflected. For instance, plants appear green, as they contain chlorophyll, which absorbs red and blue light and reflects green light. Objects that appear white reflect all wavelengths, while objects that appear black absorb all wavelengths.
An interesting fact about color is that all the colors that humans see are made up of different amounts of red, green, and blue or RGB. This is because the receptor cells in human eyes, known as cones, only respond to red, green or blue. Since many cones are operating at once when viewing colors, humans can see more than simply red, green, or blue. This is also the way computer monitors and television screens work, by using a combination of RGB to produce all the colors seen.

9/16/2004 2:10 PM
Light in the Ocean
Light traveling through water is also absorbed, reflected and transmitted. At the surface of the ocean on calm days, the ocean can appear to be like a mirror., This is due to surface reflection. Reflection also occurs in the water when light hits particles and bounces back. Light being reflected off particles in the water may also pass back into the air. As the light passes through the water into the air, it is bent and objects sitting on the surface appear distorted. This is known as refraction. It is also the reason waves make patterns of light and dark on the sea floor.
Below the surface wavelengths of light begin to be absorbed as the water becomes deeper. The effect this has on the amount of light, and the spectrum of light wavelengths at various depths will be investigated in the following experiment. The Experiment Experiment 1: Measuring Wavelength Absorbance with Depth
A waterproof standardized color card was photographed at depths of 0, 1, 2, 3, 4, 5, 7.5, 10, 15, 20, 25, and 30 meters. This was done in the clear Caribbean waters surrounding Bonaire. Images were taken near noon in the summer; under these conditions the maximal amount of light enters the water (Church 1994).
Photographs were taken with a professional digital camera in an underwater housing. The camera was set to record the true colors observed and not to “correct” or alter images in any way. The images were analyzed using Photoshop and the relative amounts of Red, Green, and Blue (RGB) were recorded. Additional details of the methods are posted in the advanced section.
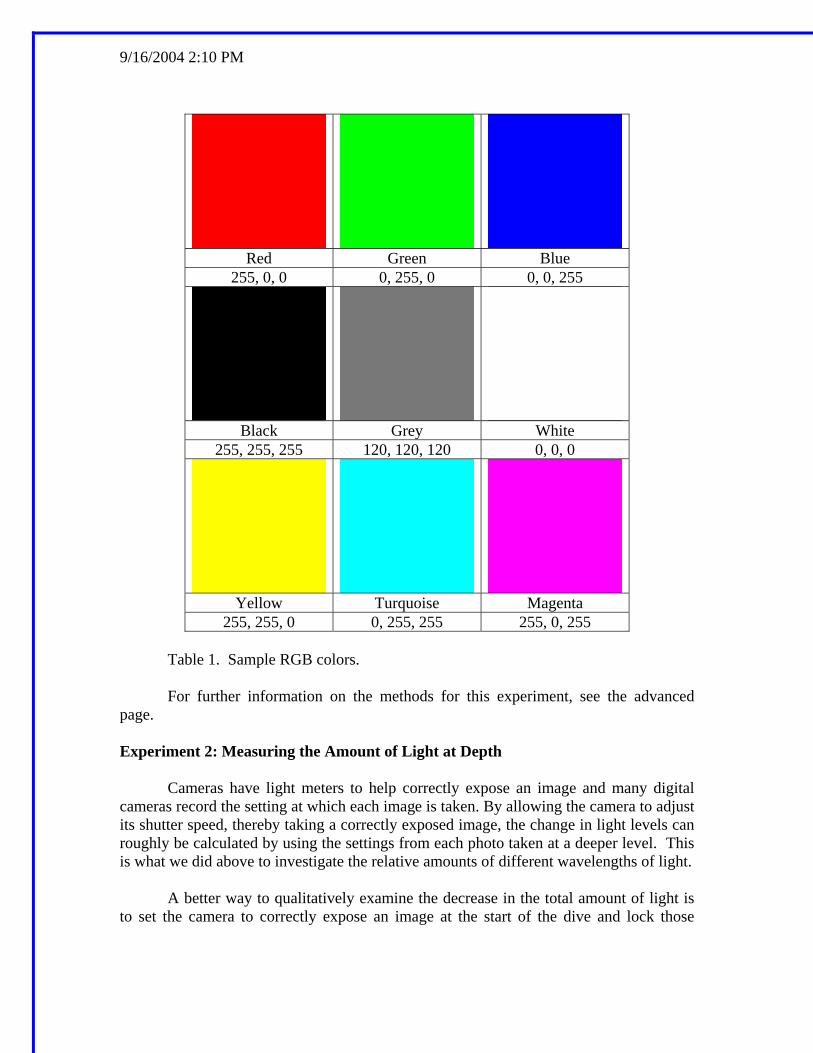
On an RGB scale, RGB values of 255, 255 and 255 is pure white while values of
0, 0 and 0 is black. For example, a pure bright red would have a value of 255, 0 and 0; a pure blue would 0, 0 and 255. When the RGB values are all equal, such as 120, 120 and 120 the color appears as a shade of grey. See table 1.
9/16/2004 2:10 PM
Red Green Blue
255, 0, 0 0, 255, 0 0, 0, 255
Black Grey White
255, 255, 255 120, 120, 120 0, 0, 0
Yellow Turquoise Magenta
255, 255, 0 0, 255, 255 255, 0, 255 Table 1. Sample RGB colors. For further information on the methods for this experiment, see the advanced
page. Experiment 2: Measuring the Amount of Light at Depth
Cameras have light meters to help correctly expose an image and many digital cameras record the setting at which each image is taken. By allowing the camera to adjust its shutter speed, thereby taking a correctly exposed image, the change in light levels can roughly be calculated by using the settings from each photo taken at a deeper level. This is what we did above to investigate the relative amounts of different wavelengths of light.
A better way to qualitatively examine the decrease in the total amount of light is to set the camera to correctly expose an image at the start of the dive and lock those

9/16/2004 2:10 PM
settings in. This time at deeper depths, the camera does not compensate for the changing light levels and the images get darker and darker.
By taking photos at different depths using these two methods, it was evident how the amount of light in the marine environment change as depth increased. Results of Experiment 1
Before looking at the photos and results from the two experiments described above, write form a hypothesis. What do you think may happen to the amount and spectrum of light as the divers descend? Why do you think this is? How do you think this affects how humans see color underwater?
Later in this section why the amount of light and spectrum of light at a certain depth changes from place to place will be revealed. This experiment was conducted near noon in very clear water on a calm day. What do you think would happen to the total amount of light in murky water? What do you think would happen to the amount of light in the early morning and late afternoon? This experiment was done near the equator. What do you think would be different near the poles?
How different colors contain different amounts of RGB was explained in an earlier section. How do you think the proportions of red, green, and blue change with depth and why? Write this response BEFORE starting.

9/16/2004 2:10 PM
Figure 2. Macbeth color card at the surface in the shade of the tropical sun of Bonaire.
9/16/2004 2:10 PM
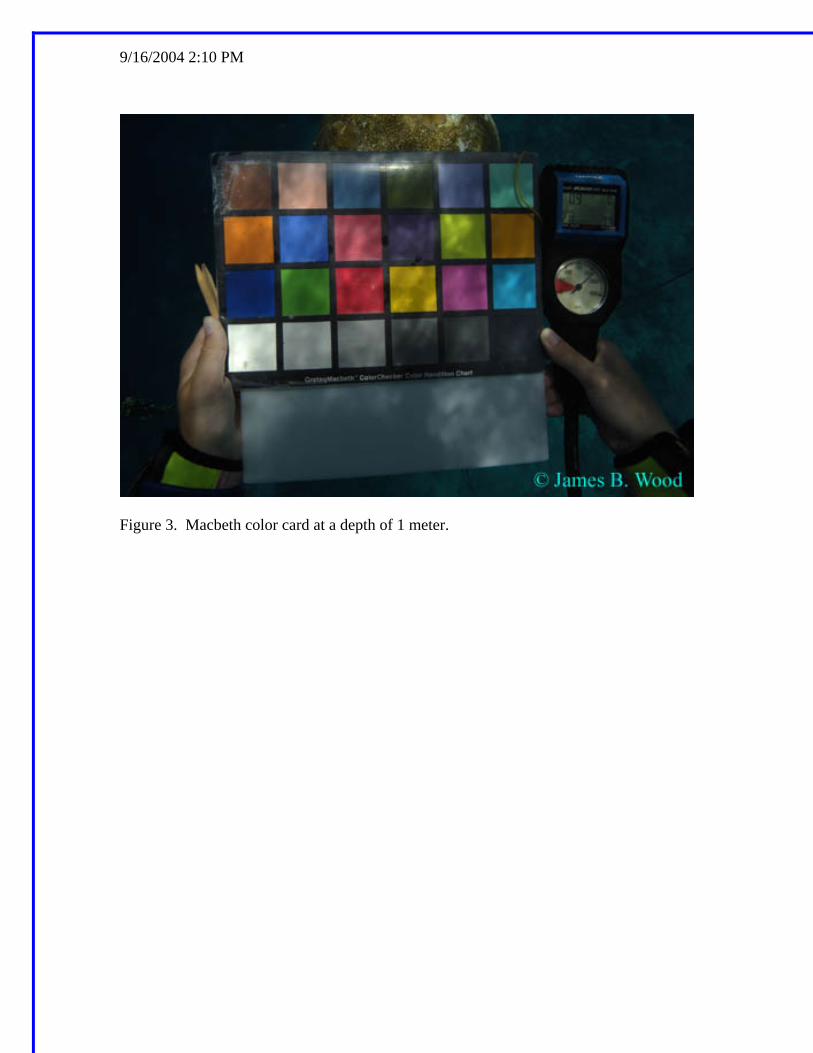
Figure 3. Macbeth color card at a depth of 1 meter.

9/16/2004 2:10 PM
Figure 4. Macbeth color card at a depth of 2 meters.
9/16/2004 2:10 PM
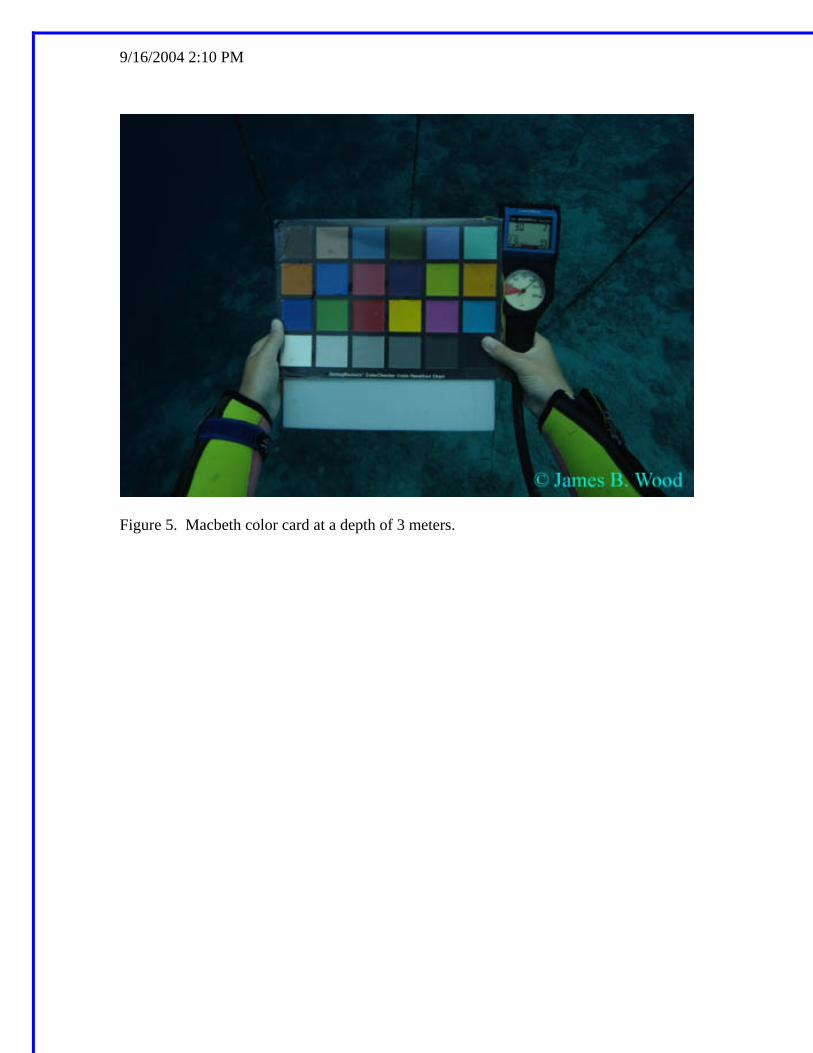
Figure 5. Macbeth color card at a depth of 3 meters.

9/16/2004 2:10 PM
Figure 6. Macbeth color card at a depth of 4 meters.

9/16/2004 2:10 PM
Figure 7. Macbeth color card at a depth of 5 meters.

9/16/2004 2:10 PM
Figure 8. Macbeth color card at a depth of 7.5 meters.

9/16/2004 2:10 PM
Figure 9. Macbeth color card at a depth of 10 meters.

9/16/2004 2:10 PM
Figure 10. Macbeth color card at a depth of 15 meters.

9/16/2004 2:10 PM
Figure 11. Macbeth color card at a depth of 20 meters.

9/16/2004 2:10 PM
Figure 12. Macbeth color card at a depth of 25 meters.

9/16/2004 2:10 PM
Figure 13. Macbeth color card at a depth of 30 meters.

9/16/2004 2:10 PM
Figure 14. Macbeth color card at a depth of 30 meters. This photograph was taken with duel underwater strobes (flashes).

9/16/2004 2:10 PM
Percentage of Primary Colors in Grey at the Surface
38.8%32.4% 28.8%
0.0%10.0%20.0%30.0%40.0%50.0%60.0%70.0%80.0%90.0%
100.0%
Red Green Blue
Primary Colors
Perc
ent
Figure 15
Percentage of Primary Colors in Grey at 1 Meter Deep
31.5% 34.7% 33.8%
0.0%10.0%20.0%30.0%40.0%50.0%60.0%70.0%80.0%90.0%
100.0%
Red Green Blue
Primary Colors
Perc
ent
Figure 16

9/16/2004 2:10 PM
Percentage of Primary Colors in Grey at 2 Meters Deep
25.5%36.8% 37.7%
0.0%10.0%20.0%30.0%40.0%50.0%60.0%70.0%80.0%90.0%
100.0%
Red Green Blue
Primary Colors
Perc
ent
Figure 17
Percentage of Primary Colors in Grey at 3 Meters Deep
21.9%
37.9% 40.2%
0.0%10.0%20.0%30.0%40.0%50.0%60.0%70.0%80.0%90.0%
100.0%
Red Green Blue
Primary Colors
Perc
ent
Figure 18

9/16/2004 2:10 PM
Percentage of Primary Colors in Grey at 4 Meters Deep
20.3%
39.0% 40.7%
0.0%10.0%20.0%30.0%40.0%50.0%60.0%70.0%80.0%90.0%
100.0%
Red Green Blue
Primary Colors
Perc
ent
Figure 19
Percentage of Primary Colors in Grey at 5 Meters Deep
15.9%
40.4% 43.7%
0.0%10.0%20.0%30.0%40.0%50.0%60.0%70.0%80.0%90.0%
100.0%
Red Green Blue
Primary Colors
Perc
ent
Figure 20

9/16/2004 2:10 PM
Percentage of Primary Colors in Grey at 7.5 Meters Deep
11.4%
42.4% 46.2%
0.0%10.0%20.0%30.0%40.0%50.0%60.0%70.0%80.0%90.0%
100.0%
Red Green Blue
Primary Colors
Perc
ent
Figure 21
Percentage of Primary Colors in Grey at 10 Meters Deep
9.5%
43.0% 47.5%
0.0%10.0%20.0%30.0%40.0%50.0%60.0%70.0%80.0%90.0%
100.0%
Red Green Blue
Primary Colors
Perc
ent
Figure 22
9/16/2004 2:10 PM
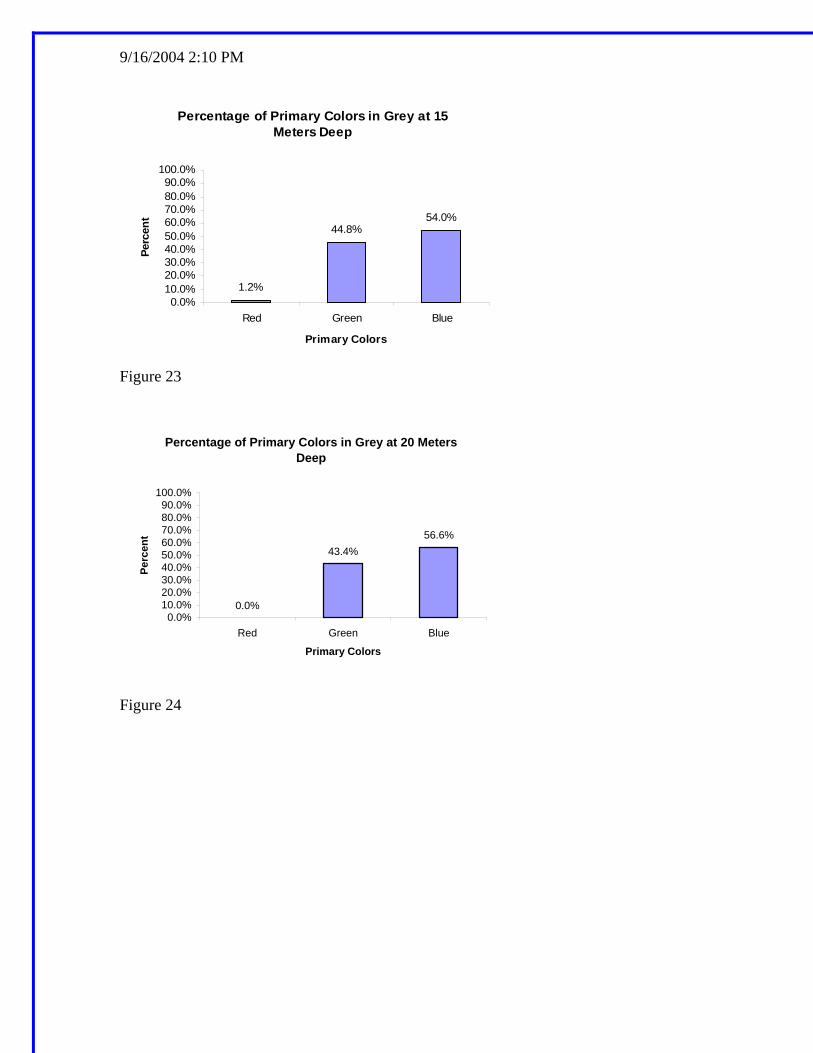
Percentage of Primary Colors in Grey at 15 Meters Deep
1.2%
44.8%54.0%
0.0%10.0%20.0%30.0%40.0%50.0%60.0%70.0%80.0%90.0%
100.0%
Red Green Blue
Primary Colors
Perc
ent
Figure 23
Percentage of Primary Colors in Grey at 20 Meters Deep
0.0%
43.4%56.6%
0.0%10.0%20.0%30.0%40.0%50.0%60.0%70.0%80.0%90.0%
100.0%
Red Green Blue
Primary Colors
Perc
ent
Figure 24

9/16/2004 2:10 PM
Percentage of Primary Colors in Grey at 25 Meters Deep
0.0%
42.7%
57.3%
0.0%10.0%20.0%30.0%40.0%50.0%60.0%70.0%80.0%90.0%
100.0%
Red Green Blue
Primary Colors
Perc
ent
Figure 26
Percentage of Primary Colors in Grey at 30 Meters Deep
0.0%
40.0%
60.0%
0.0%10.0%20.0%30.0%40.0%50.0%60.0%70.0%80.0%90.0%
100.0%
Red Green Blue
Primary Colors
Perc
ent
Figure 26
9/16/2004 2:10 PM
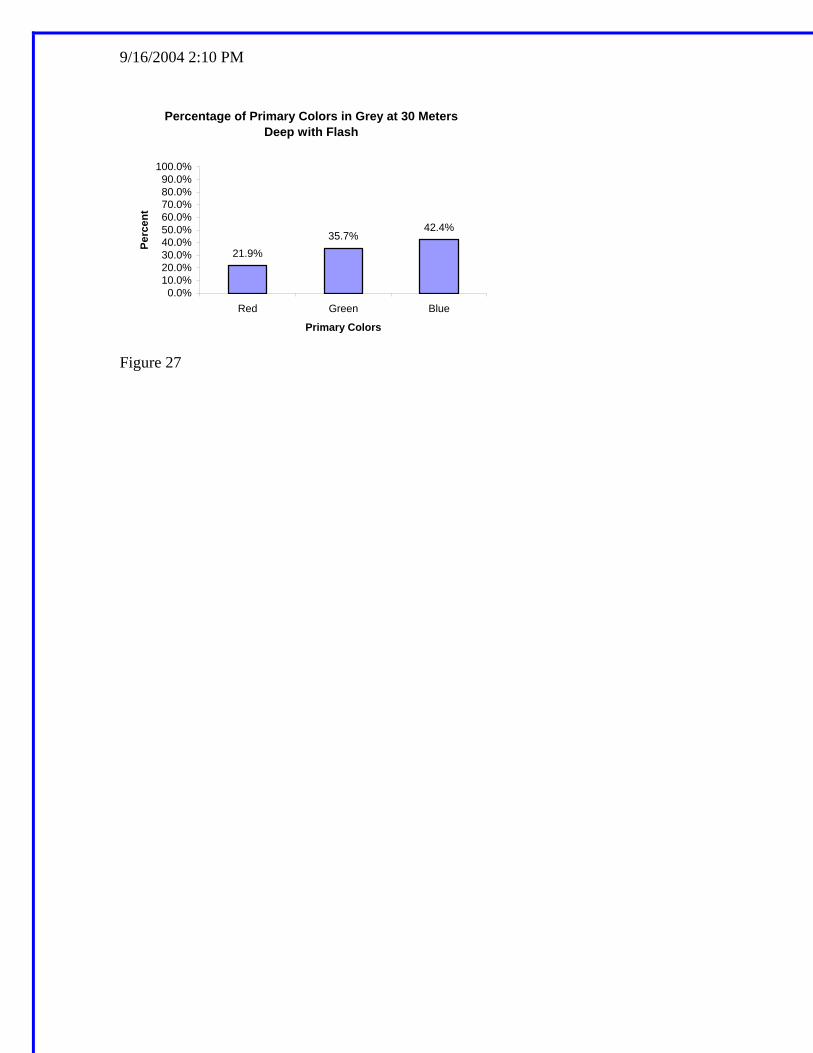
Percentage of Primary Colors in Grey at 30 Meters Deep with Flash
21.9%35.7%
42.4%
0.0%10.0%20.0%30.0%40.0%50.0%60.0%70.0%80.0%90.0%
100.0%
Red Green Blue
Primary Colors
Perc
ent
Figure 27
9/16/2004 2:10 PM
As light travels through water, it is absorbed. The longer the wavelength of light, the less energy the photons contain, and the quicker they are absorbed. This is why the loss of red light occurs first, as red wavelengths are long but contain less energy so they are absorbed first. Blue wavelengths contain the most energy in the visible light spectrum and are absorbed last. However, if an artificial light source is introduced, such as a dive light or camera flash, all the colors of the spectrum will be visible once more. Once a spectrum of light is no longer visible, objects that reflect that color will appear black. So a red object at a depth where red light is no longer visible will appear black unless an artificial light source is used to illuminate it.
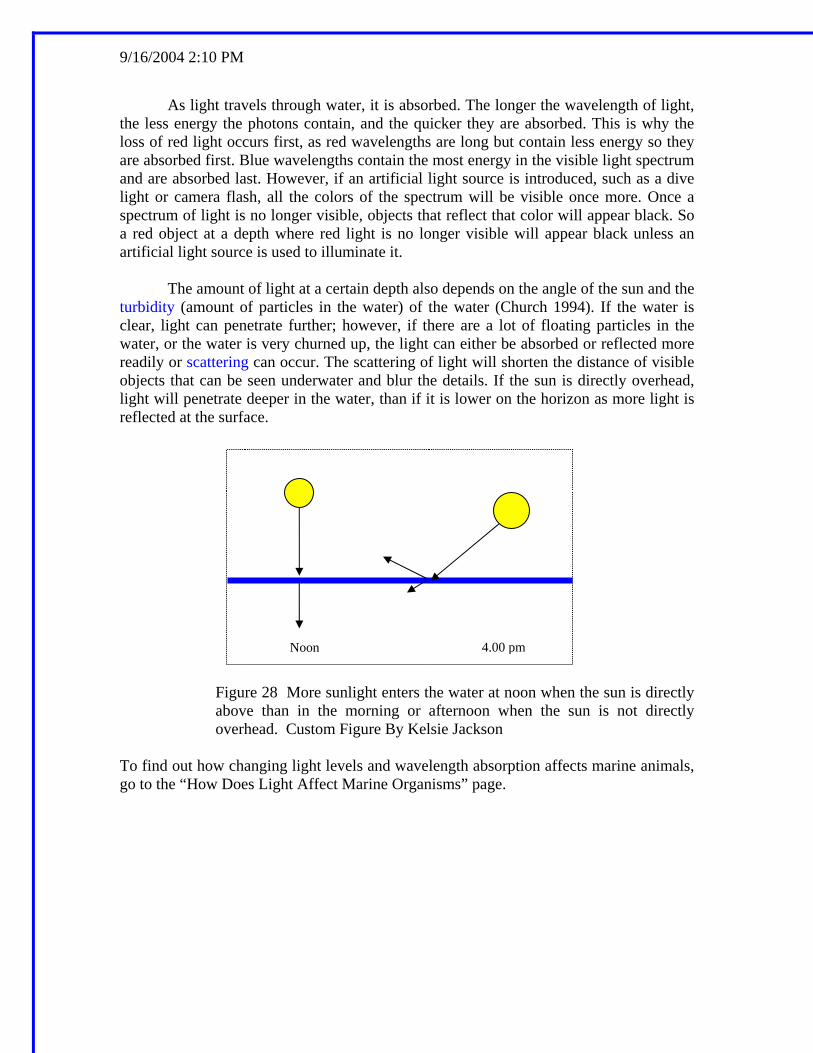
The amount of light at a certain depth also depends on the angle of the sun and the turbidity (amount of particles in the water) of the water (Church 1994). If the water is clear, light can penetrate further; however, if there are a lot of floating particles in the water, or the water is very churned up, the light can either be absorbed or reflected more readily or scattering can occur. The scattering of light will shorten the distance of visible objects that can be seen underwater and blur the details. If the sun is directly overhead, light will penetrate deeper in the water, than if it is lower on the horizon as more light is reflected at the surface.
Noon
Figure 28 More sunlight enters the water at noon when the sun is directly above than in the morning or afternoon when the sun is not directly overhead. Custom Figure By Kelsie Jackson
To find out how changing light levels and wavelength absorption affects marine animals, go to the “How Does Light Affect Marine Organisms” page.
4.00 pm

9/16/2004 2:10 PM
Light Quantity and Quality
By Dr. James Wood and Kelsie Jackson
Advanced Section Advanced Experiment Methods
This optional and much more detailed methods section is aimed at fellow underwater photographers and others who want a more comprehensive explanation of how these experiments were done. Measuring Wavelength Absorbance at Depth – Technical Specs
Digital images were recorded with a Fuji S2 digital camera and a 60 mm Nikon lens in an Ikelite housing. This system also had 2 Ikelite DS125 strobes that were not used unless noted. Images were recorded in RAW format. This format does not produce any of the usually desirable effects in camera image processing that improve the look of digital images but also which alters/enhances their colors.
RAW format images cannot be manipulated with in image editing programs. So these images were converted to 77 MB tiff files. The tiff files also retain the true colors recorded by the camera. All color image data analysis was done using these tiff images.
The series of photographs was taken at depths of 0, 1, 2, 3, 4, 5, 7.5, 10, 15, 20, 25, and 30 meters. The camera was set on an ISO of 200 and aperture priority so that the images in the series would all be exposed correctly. The camera chose f-stops of 13 (near the surface) to 8 (at 30 m).
Image color was analyzed in Photoshop. We picked a grey that had RGB values of 120, 120 and 120 in balanced daylight. For each depth, we analyzed the relative amounts of R, G, and B light.
A less scientific method that would lead to the same conclusion is to look at the Red, Green, and Blue colors on the card and note which colors turn to black the quickest.
Measuring the Amount of Light at Depth
Camera settings from the above series can be used to record the loss of light as photos were taken at deeper depths. A series of photos were taken with the camera on manual at the same settings. At greater depths there was less and less light and the images got darker and darker.

9/16/2004 2:10 PM
Each decrease in f-stop or shutter speed stop means there is half as much light. It was easy to calculate at each depth the amount of light from the camera settings.

9/16/2004 2:10 PM
Light Quality & Quantity – Teacher Resource
By Brian Goldstone, Valerie Cournoyer, Roger E. Goss, Nancy W. Goss, and Dr. James
B. Wood
Abstract Dr. Wood took a series of underwater photos of a Macbeth color card in the clear tropical waters of Bonaire. These digital images were analyzed and their RGB values and camera settings were recorded. This modular was designed to show that some wavelengths of light are absorbed more than others in sea water. Objects that are a color where that wavelength has been completely absorbed appear black. Students will analyze this data, create a line graph and correctly identify the independent and dependent variables.
Introduction Measuring Wavelength Absorbance at Depth
The clear Caribbean waters off the island of Bonaire offer an ideal location to demonstrate how the different wavelengths of light are absorbed by seawater. Around noon, when light penetration is highest, the author took a series of photographs of a Macbeth color card. This color card is used by the film industry to insure that colors are being recorded properly much like a ruler is a standard for measuring distances. This card is a standard for colors.
Dr. Wood, the author of this document, spray painted clear lacquer on the card, wrapped it in clear tape, and sprayed more paint on it to prevent the cardboard card from dissolving and the colors from altering during the experiment. Without this preparation the card would have turned to mush.
In the quality of light experiment the camera adjusted automatically to the amount of light as Dr. Wood dove deeper. The images taken at 1 meter were taken at 200 ISO F13, and 1/60th of a second. The image taken at 30 meters was correctly exposed at 200 ISO, F8, and 1/60th of a second. The amount of light that exposes an image is controlled by how long the shudder of the camera is open (which is called shutter speed) and how big the aperture is. (See Dr. Wood’s PowerPoints on Shutter Speed, Aperture, and Film Speed.)
Here is a formula that converts camera settings into actual SI units: Lux=50 x (fnumber)2/(exposure time in second x ISO film speed)

9/16/2004 2:10 PM
For Example: F8, 1/60th, ISO 100 Lux= (50x64) (1/60 x100) = 1920
Key Concepts
• Some wavelengths of light are absorbed more than others in sea water. For example, red light is absorbed faster than blue light.
• Objects that are a color where that wavelength has been completely absorbed appear black.
• At 200 meters essentially all wavelengths of light are eventually absorbed in sea water.
9/16/2004 2:10 PM
Student Learning Objectives
• To investigate light in the marine environment by looking at the relative amounts of RGB light at various depths.
• To investigate light in the marine environment by examining the total amount of light at various depths.
• To understand how the loss of one part of the visible light color spectrum will affect how an organism perceives the environment.
• To analyze scientific data and correctly graph the independent and dependent variables on a graph.
Conclusion
Right light is absorbed first, green second, while blue light is absorbed last as depth in the ocean increases. Red and green organisms appear black in the ocean when red and green wavelengths are absorbed. The data supports that essentially all light is absorbed by 200 meters.

9/16/2004 2:10 PM
Web Resources and Bibliography The physics of light and color
• Basic through to advanced lessons about light and color
http://science.howstuffworks.com/light.htm• Site about optics, including information about light, lasers, color, and activities to
do at home http://www.opticsforkids.org/index.cfm Color and light in the ocean
• How color and light are affected by the ocean
http://www.soc.soton.ac.uk/JRD/SCHOOL/mt/mt001a.html• Scuba diving page about light
http://physics.itsbaxter.com/light.html• Graphics showing which wavelengths drop out at which depths
http://www.ssl.umd.edu/projects/ControlStation/Personal/SCUBA/Physics&Phys/physics.html Cephalopods and color
• How cephalopods see and use polarized light
http://www.polarization.com/octopus/octopus.html• Article about cephalopod color changes and camouflage
http://www.dal.ca/~ceph/TCP/chroma1.html Bioluminescence
• Information about bioluminescence http://www.seasky.org/monsters/sea7a3.htmlhttp://www.lifesci.ucsb.edu/~biolum/ Animals and color
• Article about colors in reef fish http://www.abc.net.au/catalyst/stories/s703938.htmDeep sea creatures
• Information about many deep sea creatures
http://www.seasky.org/monsters/sea7a.html More links from the advanced section
• Discusses the wave and particle theories

9/16/2004 2:10 PM
http://www.thespectroscopynet.com/Educational/wave_particle_duality.htm • Example of Young’s slit experiment
http://www.colorado.edu/physics/2000/schroedinger/two-slit2.html• The Photoelectric effect
http://www.colorado.edu/physics/2000/quantumzone/photoelectric.html

9/16/2004 2:10 PM
Vocabulary Absorption: Substances absorb photons, converting their energy to heat. Different substances absorb photons containing different wavelengths. Photons that are not absorbed are either reflected or transmitted. Those that are reflected are the colors humans see objects as being. Aperture: The width of the iris opening in the lens which allows light into the camera. Aperture widths are expressed as f-stops. The higher the f-stop number, the smaller the aperture opening. Chemosynthesis: Making organic compounds by use of energy derived from chemical reactions. Chromatophores: Organs responsible for color changes in cephalopods. Each chromatophore is made up of a saccule containing pigment, as well as muscles, nerves and other cells. As the sac has elastic walls, it can be stretched by the muscles to show more pigment or contracted to show less. Electromagnetic radiation: Light is a type of electromagnetic radiation. ER is so named as it travels in both electric and magnetic fields. Electromagnetic spectrum: The full range or radiation from radio waves to gamma rays. Visible light makes up a small part of this spectrum. Film Speed: The ISO number that indicates how sensitive a film or CCD is to light. Common film speeds are 100, 200 and 400. Higher film speed numbers, such as 1600, are more sensitive to light and better for low light photography. Low film speed numbers have more resolution and better colors. F-stop: A number that refers to a specific aperture. Common f-stops are: f2.8, f4, f5.6, f8, f11, f16, f22. For each full stop the f-stop number increases, 50% less light reaches the focal plane. Frequency: Measurement of the speed a wave is traveling, i.e. how many waves pass a point in a given period of time, usually a second. Can be measured in Hertz (Hz) or cycles (waves per second). Hydrothermal vents: Openings in the sea floor that releases water heated to extreme temperatures by magma. Some vents can be found in areas of seafloor spreading such as the Galapagos. (Sometimes referred to as black smokers.) Photons: Tiny packets of energy of the same wavelength and frequency. Some wavelengths (400-700nm.) and frequencies (430-750 trillion cycles per second) and thus the photons that contain them are in the range of the electromagnetic spectrum known as visible light, and correspond to different colors.

9/16/2004 2:10 PM
Photosynthesis: Converting carbon dioxide and hydrogen into carbohydrates with the use of energy from the sun. Phototic Zone: The upper 200 meters of the ocean where there is visible light. Primary productivity: Production of plant tissue by photosynthesis. RAW: A digital format that records the image without altering it. Shooting in RAW format is especially useful in scientific applications where precise control of color is needed. Additionally, many professionals chose to shoot in RAW format as it records the maximum amount of data which can later be edited using photo software. Images stored in RAW format take up more space than those stored in .jpg format. Reflection: Photons may be reflected by some substances. Usually it is those photons that are reflected that are of wavelengths corresponding to the color of the substance in question. Refraction: Light reflected off particles in water may pass back into the air. As light passes from one medium to another, it is bent, and objects at the surface may appear distorted. This is also how lenses work. Scattering: Similar to reflection, photons hit an object or particle and bounce off in another direction. Shutter speed: The duration of time of the exposure; how long the film or CCD is exposed to light. Fast shutter speeds freeze action and minimize camera shake. Slow shutter speeds can be used to show motion, such as the effect of wind, water going over a waterfall or the path of stars. Transmission: Photons may pass through substances if of the right frequency and will continue on without being altered. As the photons are passing through unaltered and not being reflected, the colors corresponding to those frequencies will not be seen in the given object. Turbidity: The amount of particles in the water, i.e. how clear the water is. Wavelength: Measurement of the size of a wave, usually measured from peak to peak, or trough to trough of two successive waves. The longer the wavelength, the less energy it contains. Red wavelengths of visible light have longer wavelengths than blue light but also less energy.

9/16/2004 2:10 PM
Frequently Asked Questions Question Does light travel as a wave or a particle? What are waves?
How does light travel?. In the previous basic explanation light was traveling in the form of a wave. This explanation is very much simplified. In fact, scientists have been arguing for years about the ways in which light travels. Traditionally, there have been two theories, the wave theory and the particle theory, although today there are modern theories which combine both. As far back as the ancient Greeks, the particle theory has been used to explain the behavior of light. The particle theory suggests that light travels as particles in a straight line. This explains why light bounces off surfaces like mirrors. The wave theory was first introduced by Christian Huygens in the 1600’s. In 1807 this theory was backed up by Thomas Young, who experimented with proving this theory. Young devised an experiment where he shone light through a small slit. When the light hit a surface not far away, the small slit of light was visible as the particle theory would suggest. However, Young also noted that the slit of light projected on the surface was not well defined and noted that there was additional light which was not as bright around the slit. This supported his theory that light does not travel in a straight line but rather in waves.
After Young’s experiments scientists were leaning more toward the wave theory. However, in the 1900’s Einstein began experimenting with what is known as the photoelectric effect. The photoelectric effect happens when light hitting metal transfers energy into the metal atoms, causing them to release electrons which are emitted from the object. Experimenting with ultra violet light and the photoelectric effect lead Einstein to come up with the idea of light traveling in packets of energy called photons.
Today physicists believe light can travel as both a particle and a wave; however, both explanations are a little too simplified to truly describe the way light travels. New theories such as the quantum electrodynamics theory merge both the particle and wave theories and attempt to produce a more complete theory.
While discussing the idea of waves and particles, it is important to understand what exactly a wave is. A wave consists of energy moving through a medium. When looking at a wave in the ocean for example, it is not actually the water that is moving from one place to another, but rather the energy that is moving through the water. Electromagnetic radiation, on the other hand, needs no medium and can travel in a vacuum, which is why this form of energy can travel through space.

9/16/2004 2:10 PM
Question When light hits an object, why are certain wavelengths absorbed and others reflected?
Before looking at what happens when photons come in contact with an object, it is important to remember what is going on inside the object itself. Firstly, the atoms the object is made of contain electrons with their own specific vibrational frequency. Secondly, the atoms in the object will contain a set number of electrons which will dictate how readily they will give up or receive electrons.
When light hits an object, many photons of differing wavelengths and frequencies interact with the atoms in the object. If the frequency of the photons is close to or the same as the natural frequency of the electrons in the object, the energy in the photon will be taken into the atom, and the electrons will begin to vibrate. If the atoms are strong enough to hold onto their electrons, they will begin to speed up and collide with other atoms, and energy will be converted into heat. This is absorption.
If the material contains many free electrons because the atoms do not hold onto their electrons tightly, the atoms will not be able to absorb and pass on the energy from the incoming light to other atoms. Instead, the electrons vibrate and merely send the energy back as a light wave with the same frequency as when it came in. Because of this, energy cannot penetrate far into the object. This is known as reflection.
Transmission occurs when the frequency of the incoming light is much higher or lower than the frequency of the electrons in the material. As there is such a difference, the electrons are unable to hold the incoming energy, and it is passes through the object unchanged. Question Why can I see color and some animals cannot?
Light passes through human eyes and bounces off the retina, which contains all the receptor cells that are sensitive to light. In humans these receptors are rods and cones. The rods are responsible for night vision; the cones are responsible for colors and vision in high light environments. There are three types of cones: red, green and blue, referring to the colors to which they are sensitive. All colors humans see are a combination of red, green or blue. So one or more sets of cones may be working at once to see a certain color. In the animal kingdom color vision is usually a trade-off between being able to see in color and being able to see well in low light environments. For this reason, nocturnal animals will often have only a few if any cones and a large amount of rods. This makes sense as nocturnal animals do not experience as much color in their world as humans do and therefore have less need for color vision.
Most cephalopods are color blind. This is because they have only one type of pigment in their receptor cells, and color vision usually requires at least two. Unlike

9/16/2004 2:10 PM
humans, who have rods and cones, cephalopods have receptor cells that distinguish in grey scale, and can also see polarized light (see page on “Cephalopod Vision”).

9/16/2004 2:10 PM
Materials & Activities Methods Students will complete two activities in this module. One is on the quality of light; the other is on the quantity of light. Quality of light activity: Students will analyze light values (RGB) at various depths in the ocean. They will identify independent and dependent variable, take trail averages, and make a line graph. In order to complete this activity on quality of light, students will use data from Dr. James Wood’s Macbeth color chart experiment that was collected off the coast of Bonaire. Materials for Quality of Light Activity:
• Light quality vs. depth in meters data table from Dr. Wood’s experiment. RGB Data Table.
• Graph paper, rulers, pencils, and calculators if students are completing activity by hand.
• Computers with Excel if students are completing this activity digitally.
Students should realize that the deeper the depth the more color absorption. Quantity of light activity: Students will predict the loss of light at various depths in the ocean based on data. They will identify the independent and dependent variable, calculate the lost of light with depth, and graph the data. Using the same series of photographs for the light quality activity above, student will now analyze the total amount of light at each depth. Materials for Quantity of Light Activity:
• LUX (light intensity per square meter) data table • Graph paper, pencils, rulers, and calculator if students completing by hand. • Computer with Excel if students completing digitally.
Students learn that the deeper the depth, the less light there is available.

9/16/2004 2:10 PM
Answers to Light Quality Activity 1. What happens to red, green, and blue light as it travels deeper in the ocean? The red is absorbed first. The blue wavelengths are absorbed last. 2. What does a red fish look like at 30 meters? A red fish looks black at a depth of 30 meters. There is no red light at this depth. 3. What does a blue fish look like? A blue fish looks blue at 30 meters. Most of the light at this depth is in the blue wavelength. 4. What does the data tell you about the importance of being able to match all colors for camouflage at 30 meters? That is isn’t so important to match all colors at this depth since some of them are missing. Getting the right shade is probably much more important than getting the right color.
Answers to Light Quantity Activity Dependent variable is RGB values (Y axis) Independent variable is Depth (X axis) Answers for the Data Table:
Depth in meters LUX values 1 meter 2535 30 meters 960 60 meters 364 90 meters 138 120 meters 52 150 meters 20 180 meters 7 210 meters 3
9/16/2004 2:10 PM
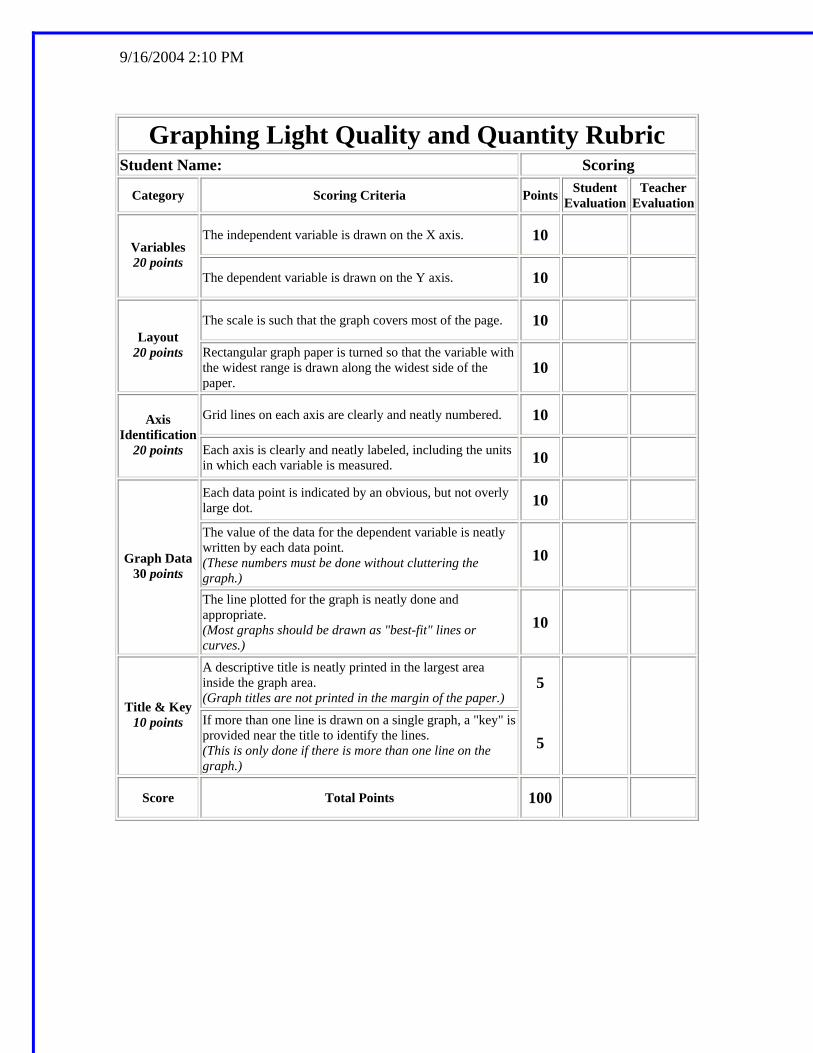
Graphing Light Quality and Quantity Rubric Student Name: Scoring
Category Scoring Criteria Points Student Evaluation
TeacherEvaluation
The independent variable is drawn on the X axis. 10
Variables
20 points The dependent variable is drawn on the Y axis. 10
The scale is such that the graph covers most of the page. 10
Layout
20 points Rectangular graph paper is turned so that the variable with the widest range is drawn along the widest side of the paper.
10
Grid lines on each axis are clearly and neatly numbered. 10
Axis
Identification 20 points Each axis is clearly and neatly labeled, including the units
in which each variable is measured. 10
Each data point is indicated by an obvious, but not overly large dot. 10
The value of the data for the dependent variable is neatly written by each data point. (These numbers must be done without cluttering the graph.)
10
Graph Data
30 points The line plotted for the graph is neatly done and appropriate. (Most graphs should be drawn as "best-fit" lines or curves.)
10
A descriptive title is neatly printed in the largest area inside the graph area. (Graph titles are not printed in the margin of the paper.)
5
Title & Key 10 points If more than one line is drawn on a single graph, a "key" is
provided near the title to identify the lines. (This is only done if there is more than one line on the graph.)
5
Score Total Points 100

9/16/2004 2:10 PM
Graphing Light Quality and Quantity Step What To Do How To Do It
1 Identify the variables
a. Independent Variable - (manipulated variable; controlled by the experimentor)
• Goes on the X axis (horizontal) • Should be on the left side of a data table.
b. Dependent Variable - (resultant variable; changes with the independent variable)
• Goes on the Y axis (vertical) • Should be on the right side of a data table.
2 Determine the variable range.
a. Subtract the lowest data value from the highest data value. b. Do each variable separately.
3 Determine the scale of the graph.
a. Determine a scale, (the numerical value for each square), that best fits the range of each variable.
b. Spread the graph to use MOST of the available space. c. Number axis incrementally
4 Number and label each axis.
• This tells what data the lines on your graph represent. • Include units of measure for each label
5 Plot the data points.
a. Plot each data value on the graph with a dot. b. You can put the data number by the dot, if it does not
clutter your graph.
6 Draw the graph. a. Draw a curve or a line that best fits the data points. b. Most graphs of experimental data are not drawn as
"connect-the-dots".
7 Title the graph. a. Your title should clearly tell what the graph is about. b. If your graph has more than one set of data, provide a
"key" to identify the different lines.
9/16/2004 2:10 PM
Student Activities: Light Quality Activity
By Brian Goldstein, Valerie Cournoyer, Roger E. Goss, Nancy W. Goss, and Dr. James B.Wood
Activity
Students will analyze light values (RGB) at various depths in the ocean. They will identify independent and dependent variables, take trial averages, and make a line graph. Description
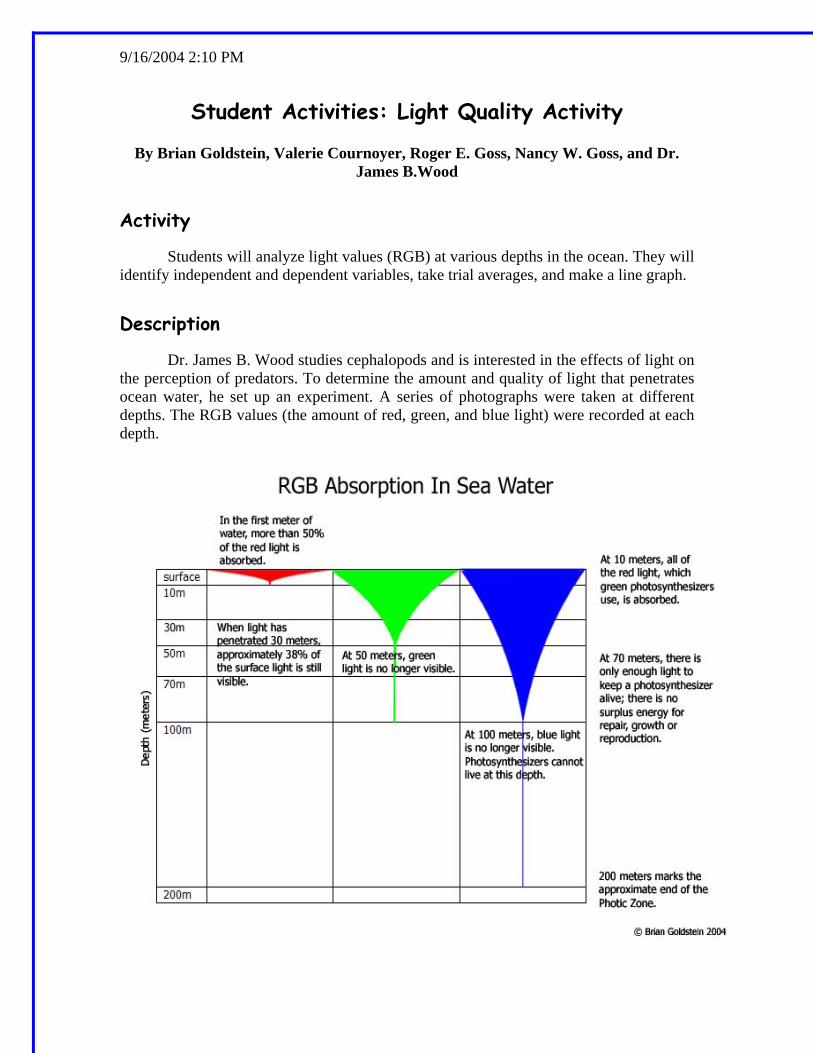
Dr. James B. Wood studies cephalopods and is interested in the effects of light on the perception of predators. To determine the amount and quality of light that penetrates ocean water, he set up an experiment. A series of photographs were taken at different depths. The RGB values (the amount of red, green, and blue light) were recorded at each depth.

9/16/2004 2:10 PM
Materials Light quality vs. depth in meters data table from Dr. Wood’s experiment. RGB Data
Table. Graph paper, rulers, pencils, and calculators if students are completing activity by hand. Computers with Excel if students are completing this activity digitally.
Procedure 1. Refer to the data table from Dr. Wood’s experiment. 2. What is the dependent variable? 3. What is the independent variable? 4. Calculate all the averages of all trials RGB value at each depth? 5. Make a line graph of the data using colored pencils or pens for the corresponding
colors. (For more information on graphing link to Line graph evaluation rubric and graphing
instructions.) Analyze Graph 1. What happens to red, green, and blue light as it travels deeper in the ocean? 2. What does a red fish look like at 30 meters? 3. What does a blue fish look like? 4. What does the data tell you about the importance of being able to match all colors for camouflage at 30 meters?
9/16/2004 2:10 PM
Student Activities: Light Quantity Activity
By Brian Goldstein, Valerie Cournoyer, Roger E. Goss, Nancy W. Goss, and Dr. James B.Wood
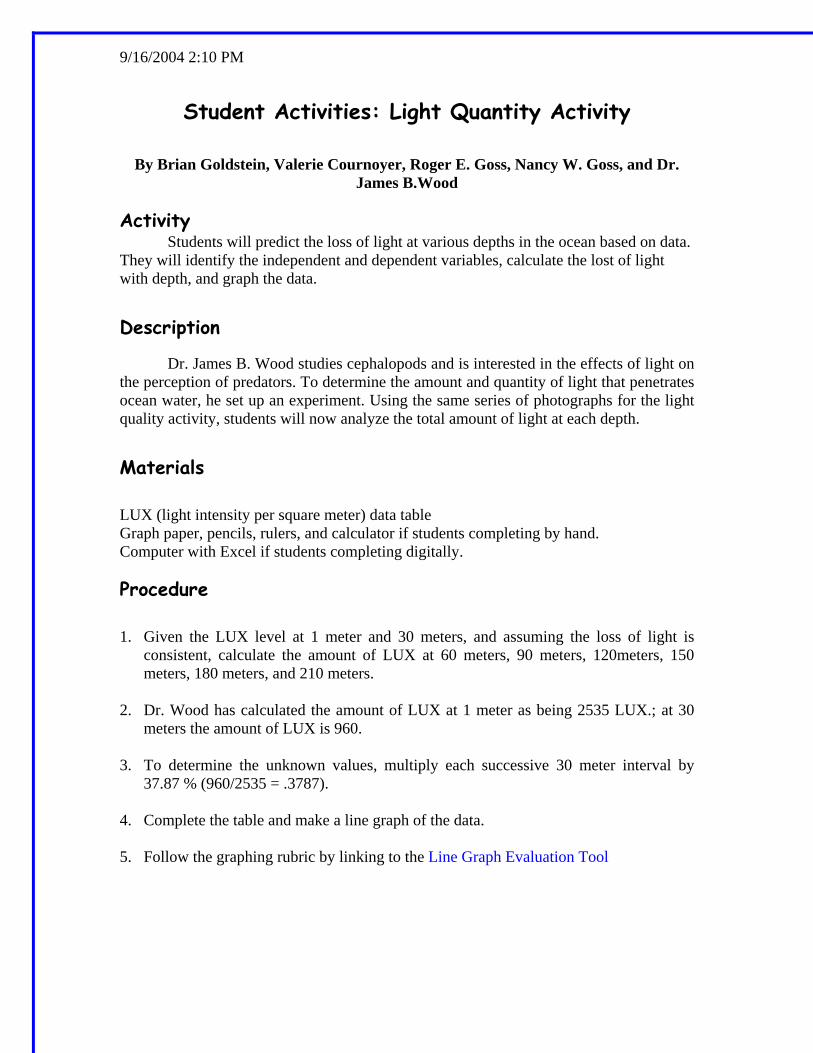
Activity Students will predict the loss of light at various depths in the ocean based on data. They will identify the independent and dependent variables, calculate the lost of light with depth, and graph the data. Description
Dr. James B. Wood studies cephalopods and is interested in the effects of light on the perception of predators. To determine the amount and quantity of light that penetrates ocean water, he set up an experiment. Using the same series of photographs for the light quality activity, students will now analyze the total amount of light at each depth. Materials LUX (light intensity per square meter) data table Graph paper, pencils, rulers, and calculator if students completing by hand. Computer with Excel if students completing digitally.
Procedure 1. Given the LUX level at 1 meter and 30 meters, and assuming the loss of light is
consistent, calculate the amount of LUX at 60 meters, 90 meters, 120meters, 150 meters, 180 meters, and 210 meters.
2. Dr. Wood has calculated the amount of LUX at 1 meter as being 2535 LUX.; at 30
meters the amount of LUX is 960. 3. To determine the unknown values, multiply each successive 30 meter interval by
37.87 % (960/2535 = .3787). 4. Complete the table and make a line graph of the data. 5. Follow the graphing rubric by linking to the Line Graph Evaluation Tool
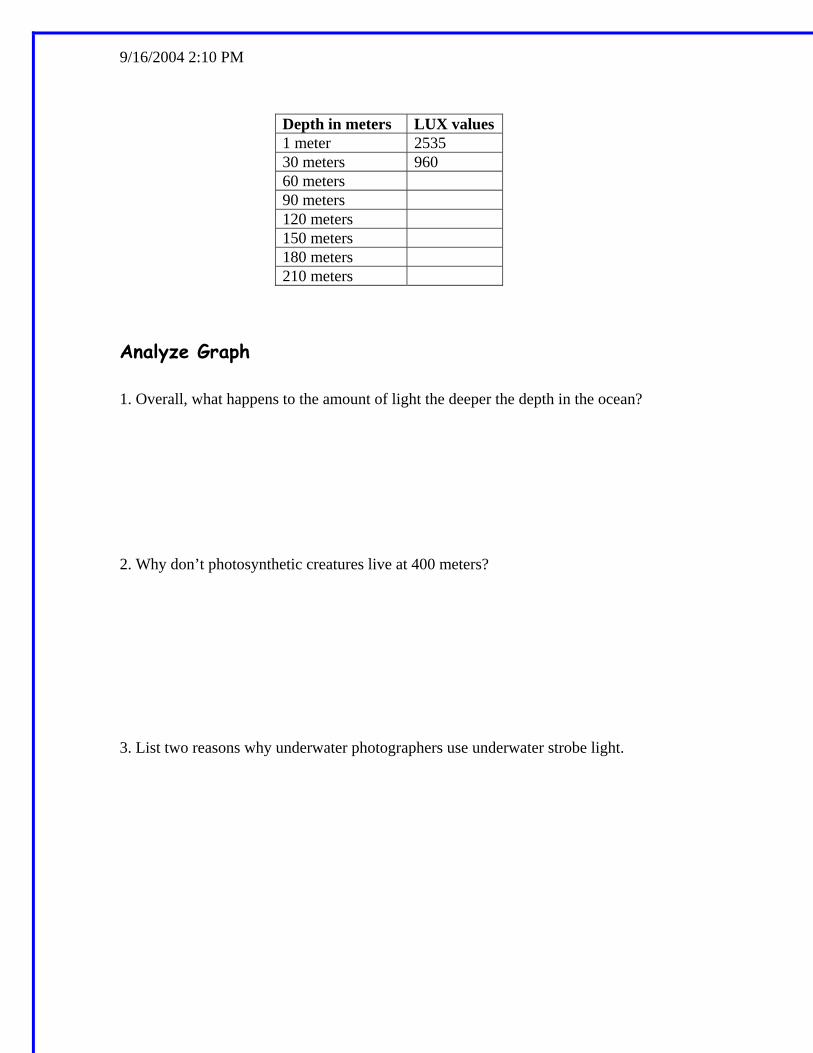
9/16/2004 2:10 PM
Depth in meters LUX values 1 meter 2535 30 meters 960 60 meters 90 meters 120 meters 150 meters 180 meters 210 meters
Analyze Graph 1. Overall, what happens to the amount of light the deeper the depth in the ocean? 2. Why don’t photosynthetic creatures live at 400 meters? 3. List two reasons why underwater photographers use underwater strobe light.