introduction to lca: the environmental performance yardstickinfohouse.p2ric.org/ref/37/36359.pdf ·...
TRANSCRIPT

Introduction to LCA: The Environmental Performance Yardstick
Municipal Scoping WorkshopInLCA/LCM 2003Rita SchenckInstitute for Environmental Research and Education
www.iere.org
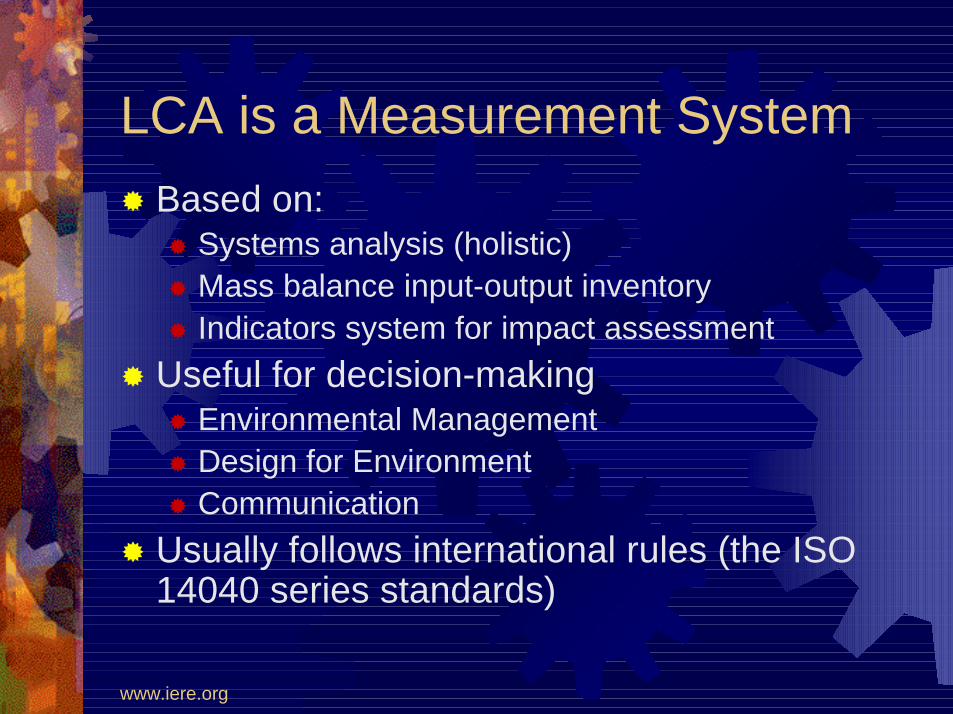
LCA is a Measurement System! Based on:
! Systems analysis (holistic)! Mass balance input-output inventory! Indicators system for impact assessment
! Useful for decision-making! Environmental Management ! Design for Environment! Communication
! Usually follows international rules (the ISO 14040 series standards)
www.iere.org
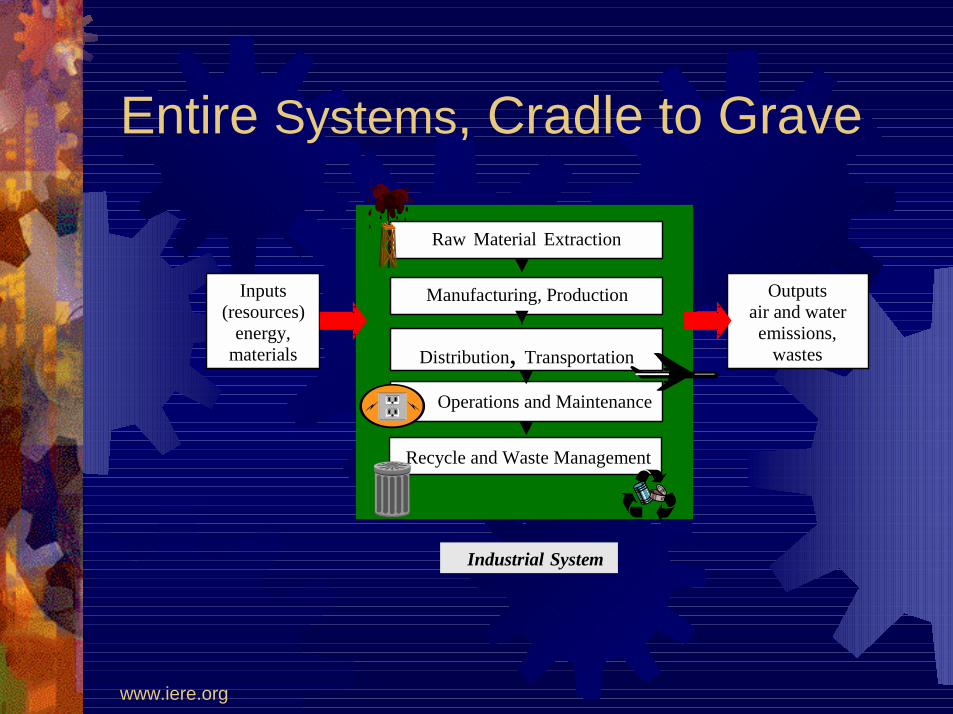
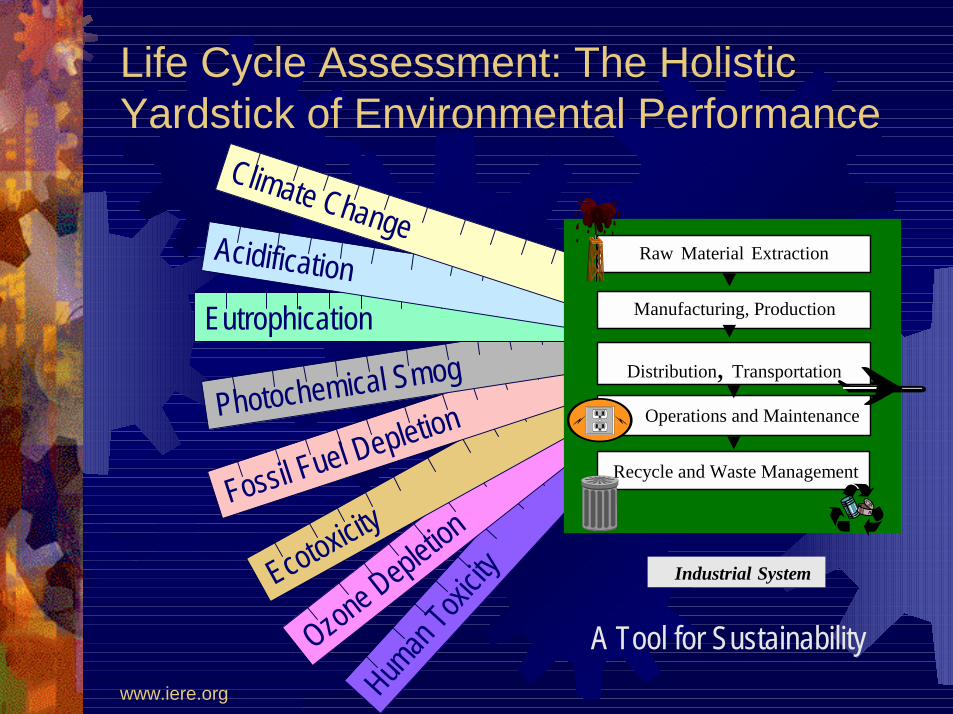
Entire Systems, Cradle to Grave
Industrial System
Raw Material Extraction
Manufacturing, Production
Distribution, Transportation
Operations and Maintenance
Recycle and Waste Management
Inputs(resources)
energy,materials
Outputsair and wateremissions,
wastes

www.iere.org
Indicators for All Impact Categories
Human
Toxicity
Ozone DepletionEcotoxicity
Fossil Fuel DepletionPhotochemical SmogEutrophication
Acidification
Climate Change
www.iere.org
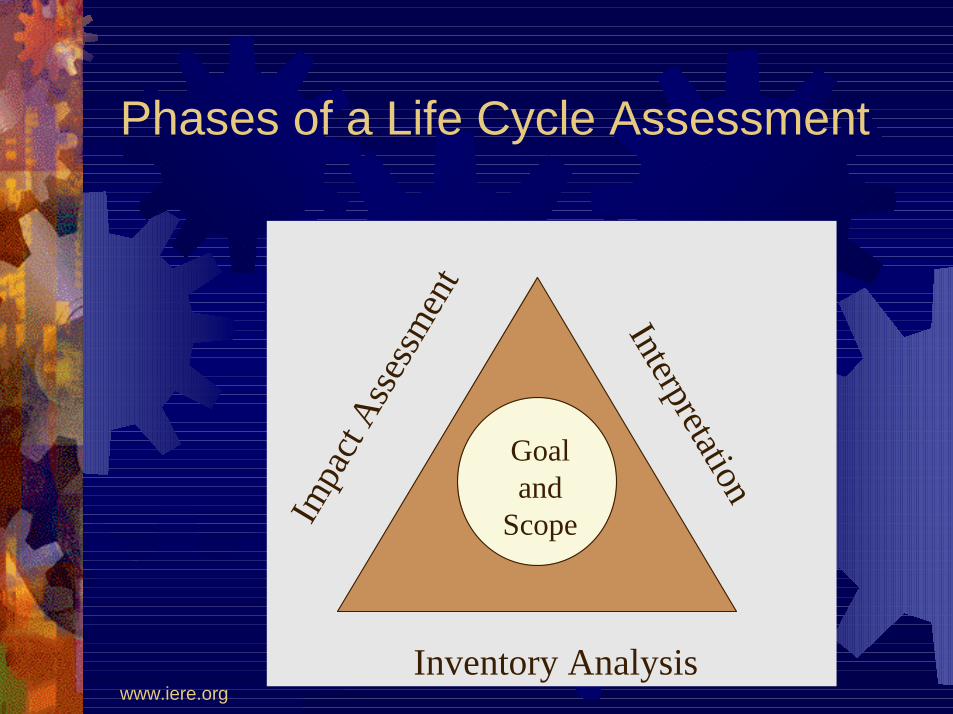
Phases of a Life Cycle Assessment
Goaland
ScopeImpa
ct As
sess
men
t
Inventory Analysis
Interpretation
www.iere.org
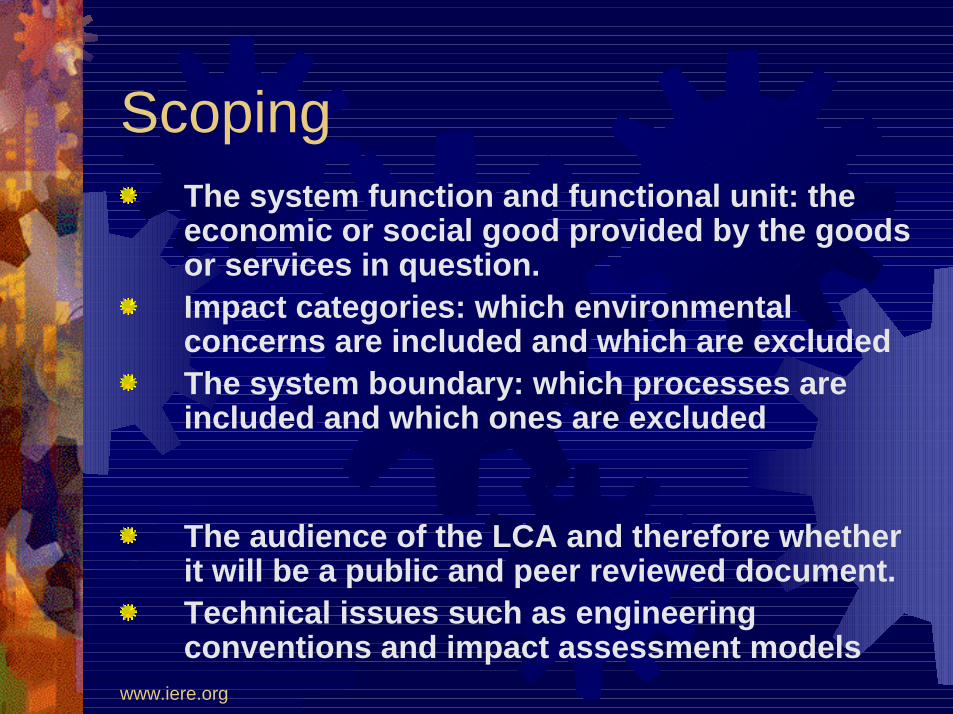
ScopingThe system function and functional unit: the economic or social good provided by the goods or services in question. Impact categories: which environmental concerns are included and which are excluded The system boundary: which processes are included and which ones are excluded
The audience of the LCA and therefore whether it will be a public and peer reviewed document.Technical issues such as engineering conventions and impact assessment models
www.iere.org
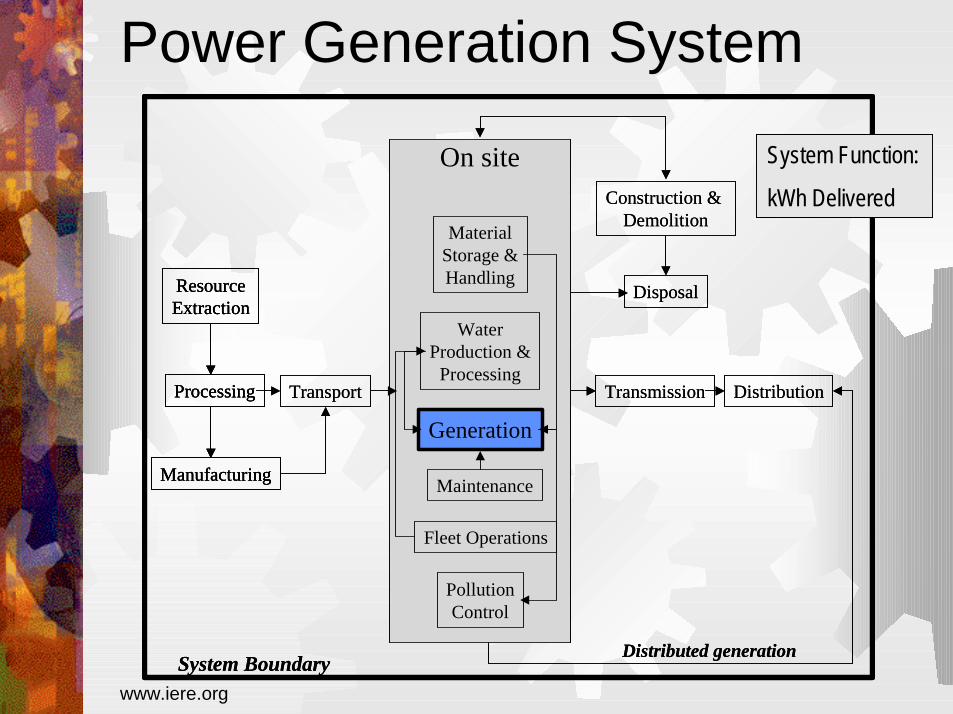
Power Generation System
On site
Transport
WaterProduction &
Processing
Generation
PollutionControl
MaterialStorage &Handling
Maintenance
Transmission Distribution
ResourceExtraction
Processing
Manufacturing
Distributed generation
Construction & Demolition
Disposal
Fleet Operations
System Boundary
On site
Transport
WaterProduction &
Processing
Generation
PollutionControl
MaterialStorage &Handling
Maintenance
Transmission Distribution
ResourceExtraction
Processing
Manufacturing
ResourceExtraction
Processing
Manufacturing
Distributed generation
Construction & Demolition
Disposal
Fleet Operations
System Boundary
System Function:
kWh Delivered
www.iere.org
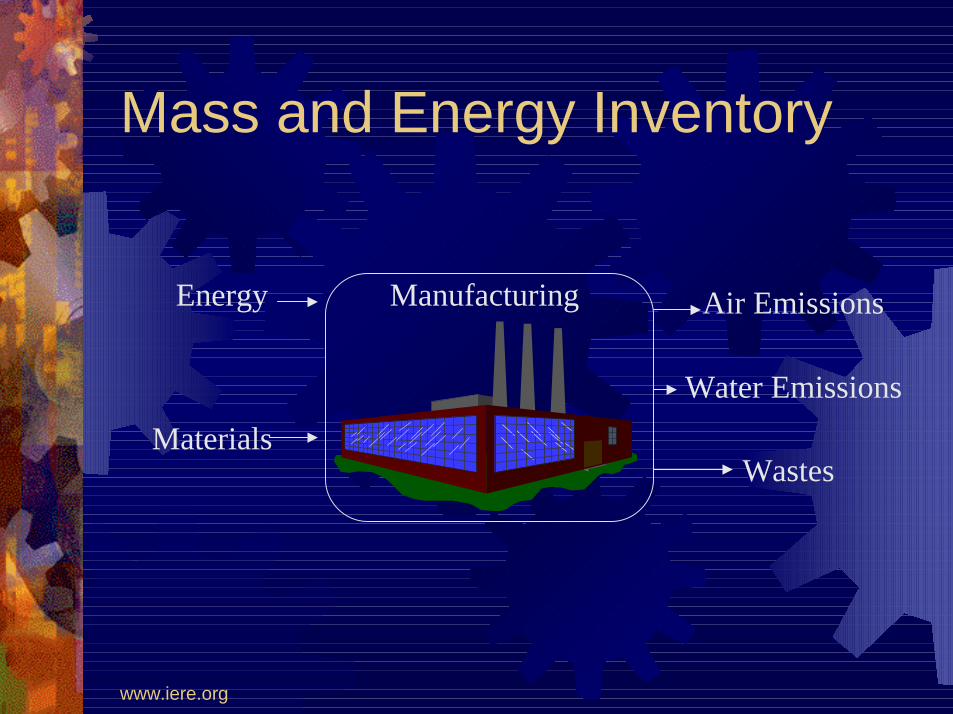
Mass and Energy Inventory
ManufacturingEnergy
Materials
Air Emissions
Water Emissions
Wastes

www.iere.org
Resources
•Electricity (location)•Water (location & type)•Fuel (in ground)•Minerals (in ground)•Biomass (harvested)•Land use (area & location)
Air
•CO2•CO•PM (10, 2.5)•CH4•SOX•NOX•NH3•Hg•Pb•VOC (NM)•Dioxin•PAH’s
Water
•COD•TDS•TSS•BOD (5,7,10)•Flow∆Temperature•NH3 (as N)•TKN (as N)•NO3, NO2 (as N)•PAH’s•Phosphates (as P)•Cu•Ni•As•Cd•Cr•Pb•Hg
Wastes•Solid waste
•Radioactive Waste (high, low, medium)
•Hazardous Waste
Not a comprehensive list, buta minimum list
FLOWS for Power Generation
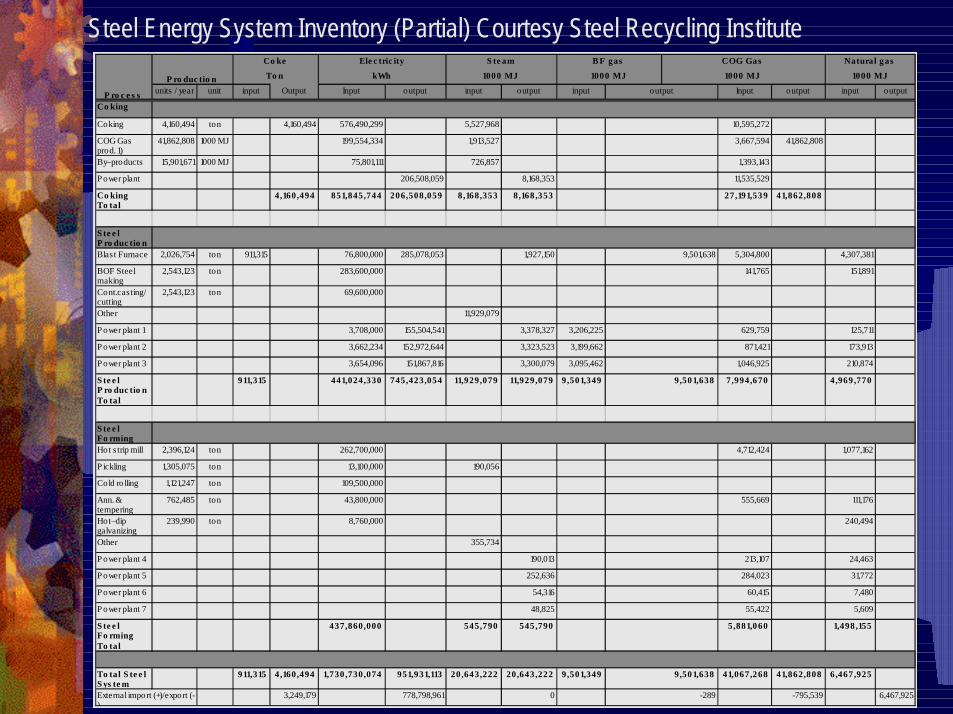
www.iere.org
units / year unit input Output Input output input output input Input output input output
Co king
Coking 4,160,494 ton 4,160,494 576,490,299 5,527,968 10,595,272
COG Gas prod. 1)
41,862,808 1000 MJ 199,554,334 1,913,527 3,667,594 41,862,808
By–products 15,901,671 1000 MJ 75,801,111 726,857 1,393,143
P ower plant 206,508,059 8,168,353 11,535,529
Co king To tal
4,160,494 851,845,744 206,508,059 8,168,353 8,168 ,353 27,191,539 41,862,808
S te e l P ro duc tio nBlast Furnace 2,026,754 ton 911,315 76,800,000 285,078,053 1,927,150 5,304,800 4,307,381
BOF Steel making
2,543,123 ton 283,600,000 141,765 151,891
Cont.casting/cutting
2,543,123 ton 69,600,000
Other 11,929,079
P ower plant 1 3,708,000 155,504,541 3,378,327 3,206,225 629,759 125,711
P ower plant 2 3,662,234 152,972,644 3,323,523 3,199,662 871,421 173,913
P ower plant 3 3,654,096 151,867,816 3,300,079 3,095,462 1,046,925 210,874
S te e l P ro duc tio n To tal
911,315 441,024,330 745,423,054 11,929,079 11,929,079 9,501,349 7,994,670 4,969 ,770
S te e l Fo rmingHot s trip mill 2,396,124 ton 262,700,000 4,712,424 1,077,162
P ickling 1,305,075 ton 13,100,000 190,056
Cold ro lling 1,121,247 ton 109,500,000
Ann. & tempering
762,485 ton 43,800,000 555,669 111,176
Hot–dip galvanizing
239,990 ton 8,760,000 240,494
Other 355,734
P ower plant 4 190,013 213,107 24,463
P ower plant 5 252,636 284,023 31,772
P ower plant 6 54,316 60,415 7,480
P ower plant 7 48,825 55,422 5,609
S te e l Fo rming To tal
437,860,000 545,790 545 ,790 5,881,060 1,498 ,155
To tal S te e l S ys te m
911,315 4,160,494 1,730 ,730,074 951,931,113 20,643,222 20,643,222 9,501,349 41,067,268 41,862,808 6,467 ,925
3,249,179 778,798,961 0 -795,539 6,467,925
P ro c e s s
P ro duc tio n
Co ke
To n
Ele c tric ity
kWh
S te am
1000 MJ
Natural gas
1000 MJ
output
B F gas
1000 MJ
COG Gas
1000 MJ
9,501,638
9,501,638
9,501,638
External import (+)/export (-)
-289
Steel Energy System Inventory (Partial) Courtesy Steel Recycling Institute
www.iere.org
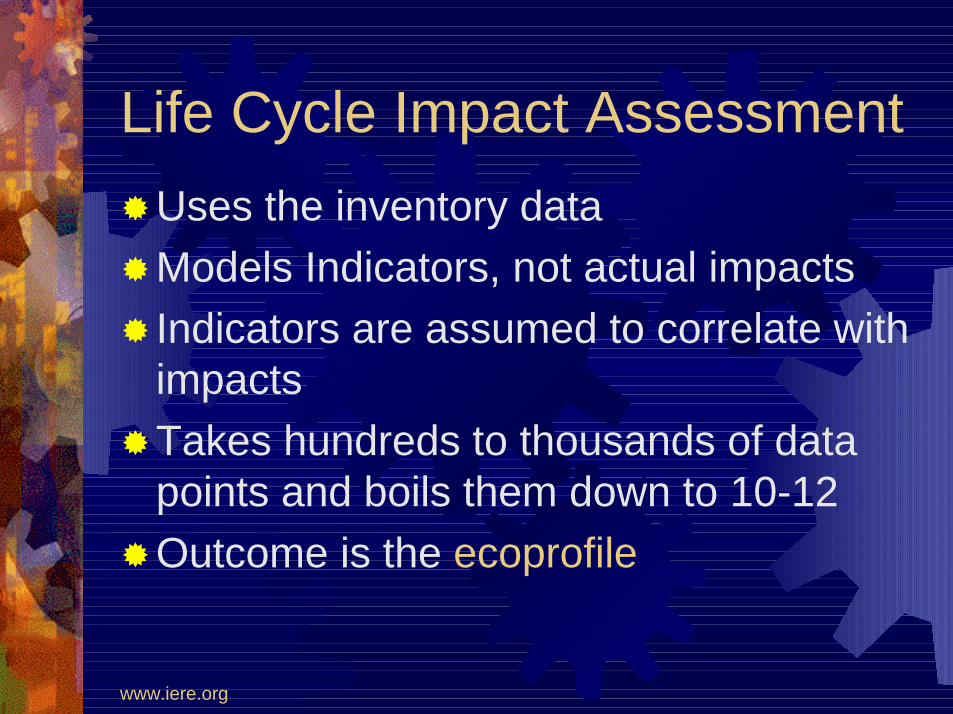
Life Cycle Impact Assessment!Uses the inventory data!Models Indicators, not actual impacts! Indicators are assumed to correlate with
impacts!Takes hundreds to thousands of data
points and boils them down to 10-12!Outcome is the ecoprofile

www.iere.org
! Water Resource Depletion
! Mineral Resource Depletion
! Fossil Fuel Depletion
! Land Use/Biodiversity
! Soil Conservation
Typical List ofEnvironmental Impacts Categories
! Climate Change! Stratospheric Ozone
Depletion ! Eutrophication! Photochemical
Smog! Acidification! Human Toxicity ! Eco-Toxicity
www.iere.org
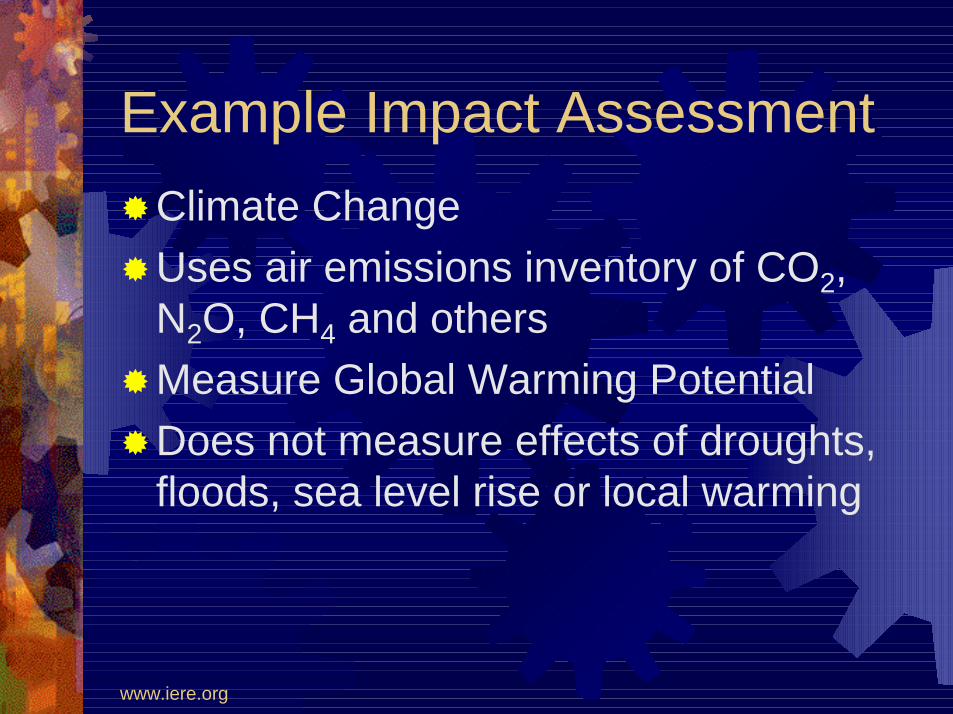
Example Impact Assessment!Climate Change!Uses air emissions inventory of CO2,
N2O, CH4 and others!Measure Global Warming Potential!Does not measure effects of droughts,
floods, sea level rise or local warming
www.iere.org
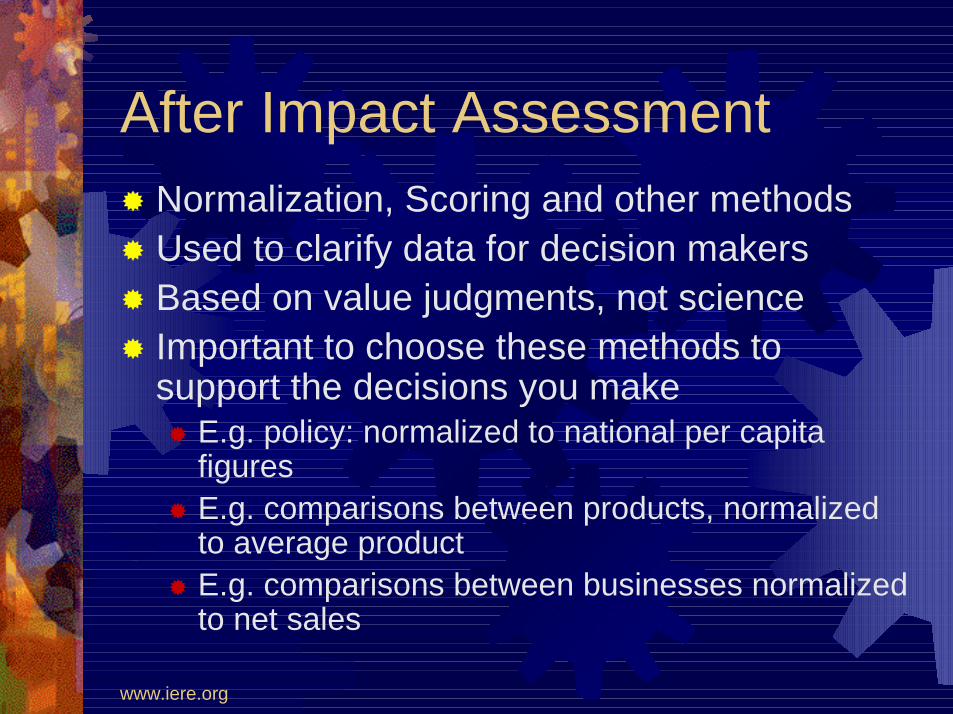
After Impact Assessment! Normalization, Scoring and other methods! Used to clarify data for decision makers! Based on value judgments, not science! Important to choose these methods to
support the decisions you make! E.g. policy: normalized to national per capita
figures! E.g. comparisons between products, normalized
to average product! E.g. comparisons between businesses normalized
to net sales

www.iere.org
Ecoprofile & Normalized Ecoprofile
Units
Grams per po und o f
meat
Percent o f U.S.
Averag e
Climate Chang e CO2 200 75
Strato s pheric Ozo ne Depletio n Freon 13 0.002 25
Eutro phicatio n P 50 70
Pho to chemical Smo g O3 40 50
Acidificatio n SO2 0.2 70
Airbo rne To xicity toxic volume 0.08 10
Waterbo rne To xicity toxic volume 0.01 5
www.iere.org
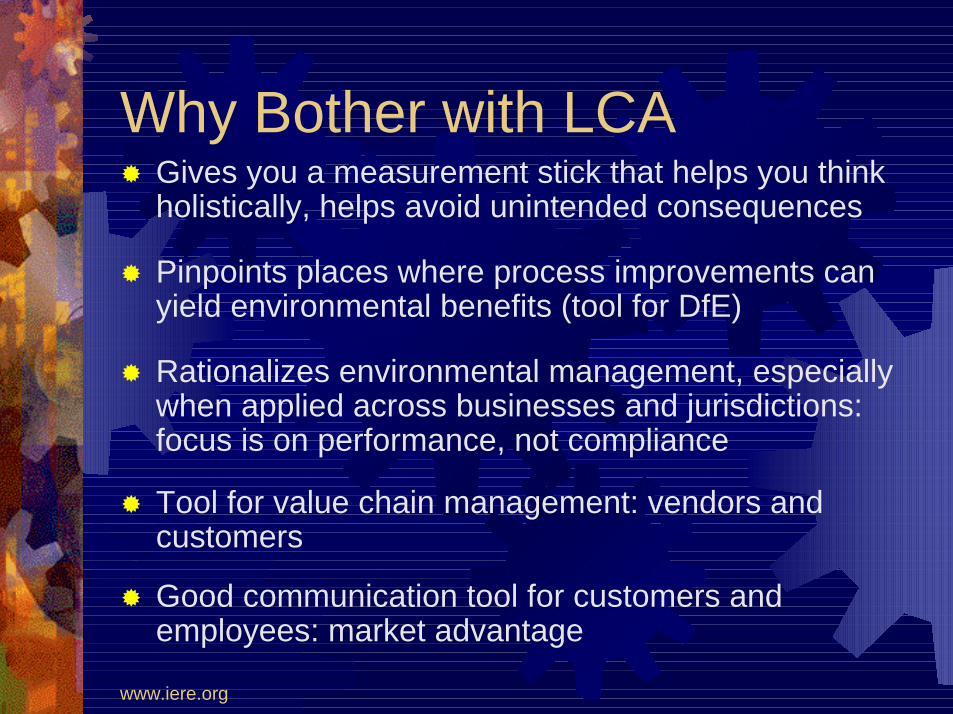
Why Bother with LCA! Gives you a measurement stick that helps you think
holistically, helps avoid unintended consequences
! Pinpoints places where process improvements can yield environmental benefits (tool for DfE)
! Rationalizes environmental management, especially when applied across businesses and jurisdictions: focus is on performance, not compliance
! Tool for value chain management: vendors and customers
! Good communication tool for customers and employees: market advantage

www.iere.org
Environmental Product Declarations (EPD)Radio Base Station Ericsson
Unit Manufact. Transport Use TotalGreenhouse Gases kg CO2- 11,400 1360 142000 155,000Ozone-Depleting Gases mg CFC11 100 0 39 139Ground Level Ozone g ethene 9610 1170 225,000 236,000Acidifying Gases mol H+ 2950 162 35,400 38,500Eutrophication potential kg O2 equi 535 32 2,300 2,870
www.iere.org
Interpretation Phase
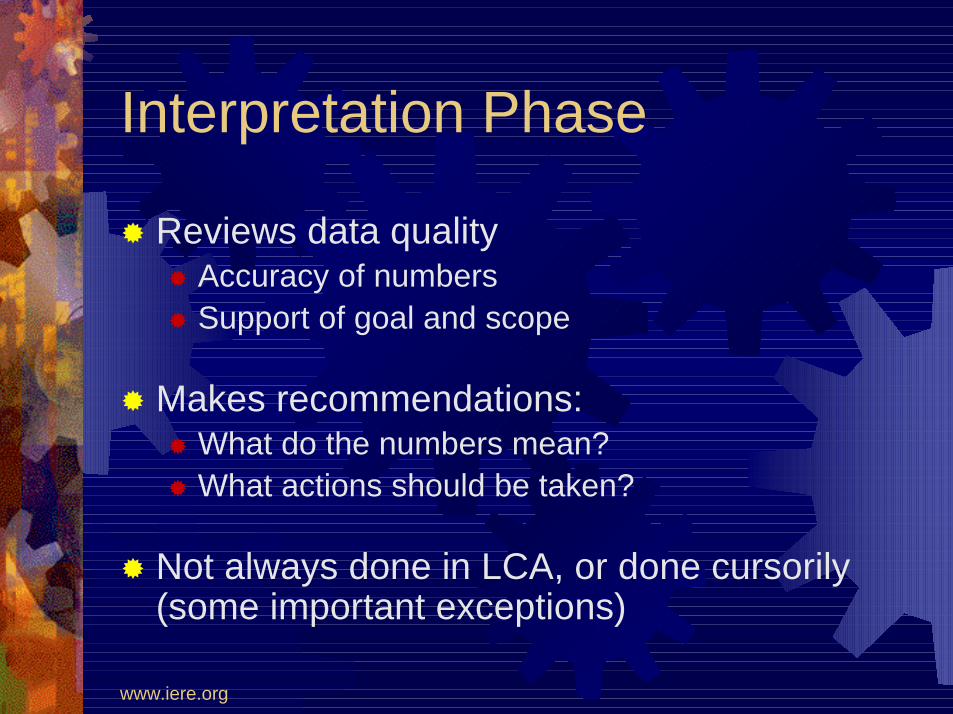
! Reviews data quality! Accuracy of numbers! Support of goal and scope
! Makes recommendations: ! What do the numbers mean? ! What actions should be taken?
! Not always done in LCA, or done cursorily (some important exceptions)
www.iere.org
Life Cycle Assessment: The Holistic Yardstick of Environmental Performance
Human
Toxicity
Ozone DepletionEcotoxicity
Fossil Fuel DepletionPhotochemical SmogEutrophication
Acidification
Climate Change
Industrial System
Raw Material Extraction
Manufacturing, Production
Distribution, Transportation
Operations and Maintenance
Recycle and Waste Management
A Tool for Sustainability

LCA Scoping: How to do it
Municipal Scoping WorkshopInLCA/LCM 2003Rita SchenckInstitute for Environmental Research and Education

www.iere.org
ScopingThe system function and functional unit: the economic or social good provided by the goods or services in question. Impact categories: which environmental concerns are included and which are excluded The system boundary: which processes are included and which ones are excluded
The audience of the LCA and therefore whether it will be a public and peer reviewed document.Technical issues such as engineering conventions and impact assessment models

www.iere.org
The System Function and Functional Unit!Functionality is about what benefits a
product or service provides!Many very different systems can
provide the same benefit!We need to be very clear about the
benefits we are seeking in order to make correct comparisons between products
www.iere.org
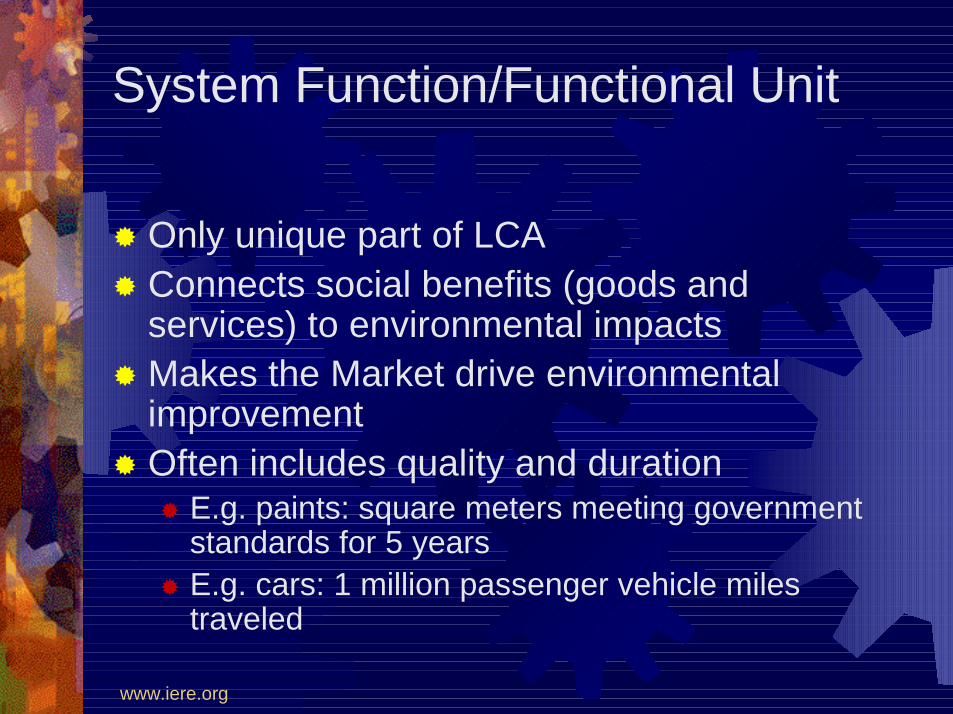
System Function/Functional Unit
! Only unique part of LCA! Connects social benefits (goods and
services) to environmental impacts! Makes the Market drive environmental
improvement! Often includes quality and duration
! E.g. paints: square meters meeting government standards for 5 years
! E.g. cars: 1 million passenger vehicle miles traveled

www.iere.org
Example System Function and Functional Unit! Products to extend the life of a road! Function: keep road travelable, at least
average condition: compare asphalt w/emulsion
! Functional unit: Area, time, quality=! 0ne lane-mile for 10 years at average condition
(via DOT rating system)
! Note: we didn’t look for non-product solutions
www.iere.org
Improvisational Theater:System function

www.iere.org
System Boundaries: what’s in, what’s out
!Decide which life cycle stages!Decide which unit processes!Decide which environmental issues
(a.k.a. impact categories)
www.iere.org
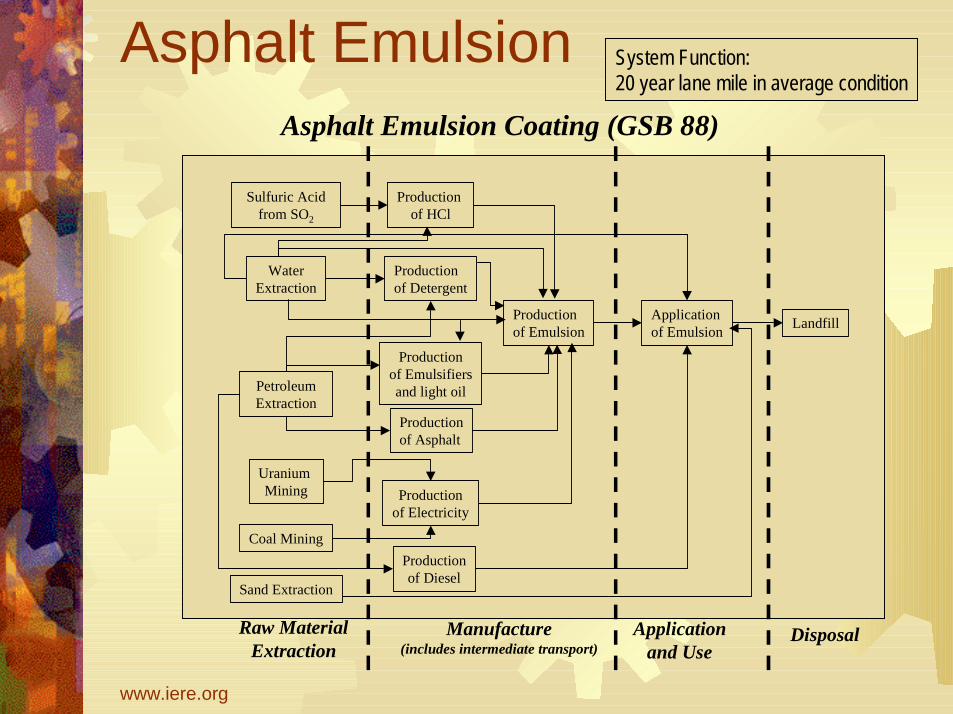
Asphalt Emulsion Coating (GSB 88)
Manufacture(includes intermediate transport)
Raw MaterialExtraction
Applicationand Use
PetroleumExtraction
Coal Mining
Uranium Mining
Productionof Asphalt
Productionof Detergent
Productionof Emulsifiersand light oil
WaterExtraction
Production of Emulsion
Productionof Electricity
Sulfuric Acidfrom SO2
Production of HCl
Productionof Diesel
Applicationof Emulsion
Sand Extraction
Disposal
Landfill
Asphalt Emulsion System Function:20 year lane mile in average condition
www.iere.org
More Improv: System boundaries

www.iere.org
System for Wooden Chairs
Extract petroleum
Manufacture Diesel
MakeElectricity
MillWood
Make Glue
Make fasteners
MakeVarnish
GrowTrees
HarvestTrees
AssembleChairs
VarnishChairs
UseChairs
Disposeof Chairs
System Boundary
www.iere.org
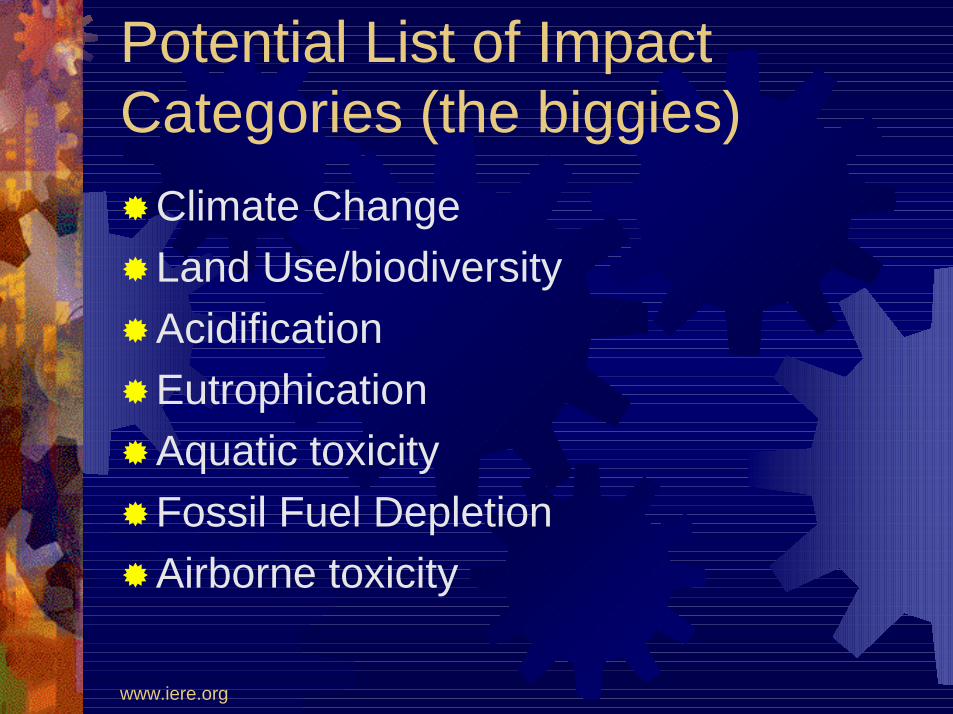
Potential List of Impact Categories (the biggies)!Climate Change!Land Use/biodiversity!Acidification!Eutrophication!Aquatic toxicity!Fossil Fuel Depletion!Airborne toxicity
www.iere.org
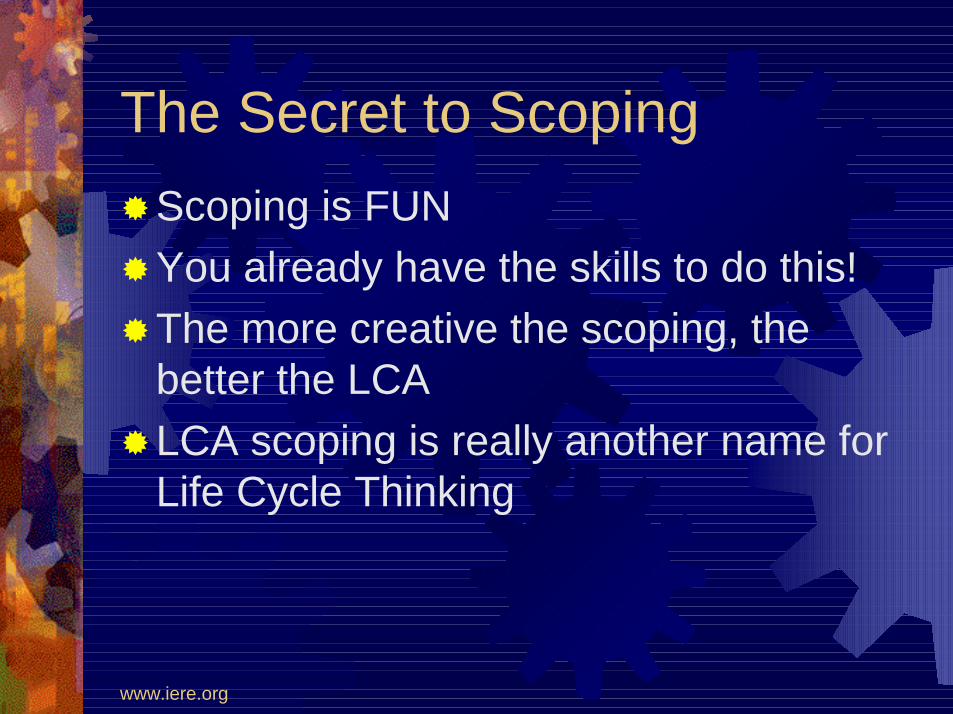
The Secret to Scoping!Scoping is FUN!You already have the skills to do this!!The more creative the scoping, the
better the LCA!LCA scoping is really another name for
Life Cycle Thinking