introduction to instrument standardization and calibration transfer · calibration models for...
TRANSCRIPT
Eigenvector Research, Inc.
Introduction to InstrumentStandardization andCalibration Transfer
Barry M. Wise
Eigenvector Research, Inc.830 Wapato Lake Road
Manson, WA 98831
©Copyright 1996-2000Eigenvector Research, Inc.No part of this material may be photocopied or reproduced in any form without prior written consent from Eigenvector Research, Inc.
Eigenvector Research, Inc.
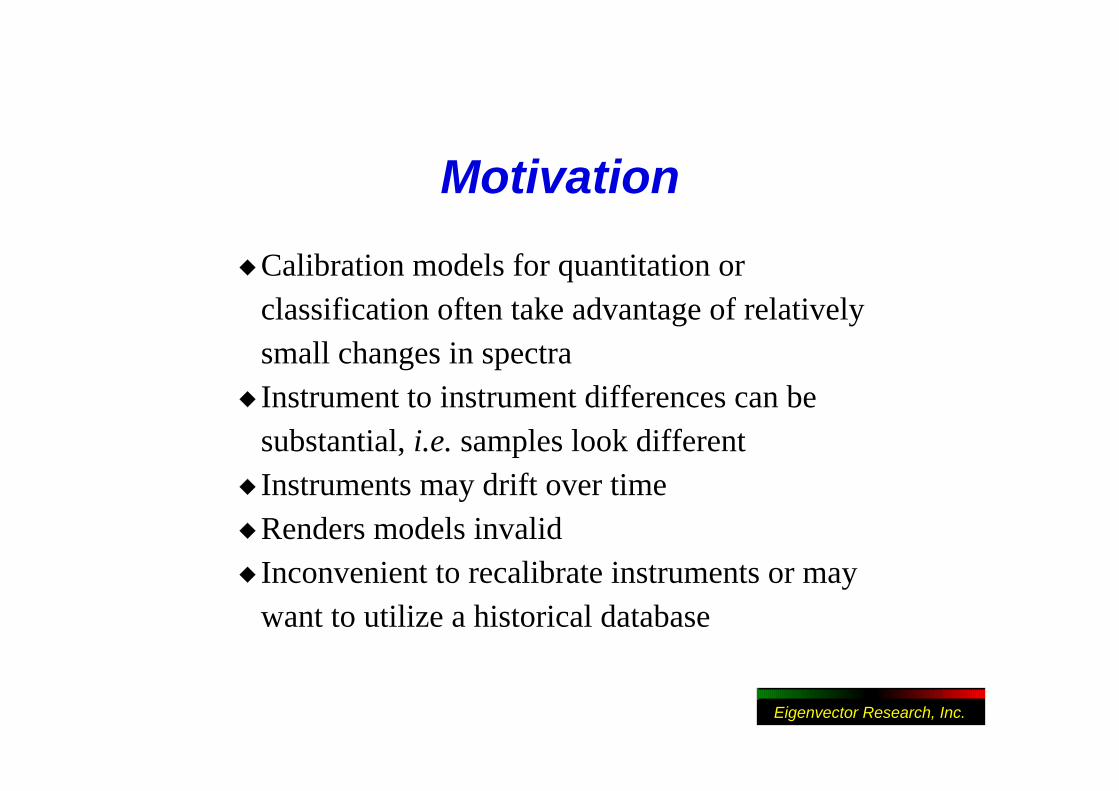
Motivation
Calibration models for quantitation or classification often take advantage of relatively small changes in spectraInstrument to instrument differences can be substantial, i.e. samples look differentInstruments may drift over time Renders models invalidInconvenient to recalibrate instruments or may want to utilize a historical database
Eigenvector Research, Inc.
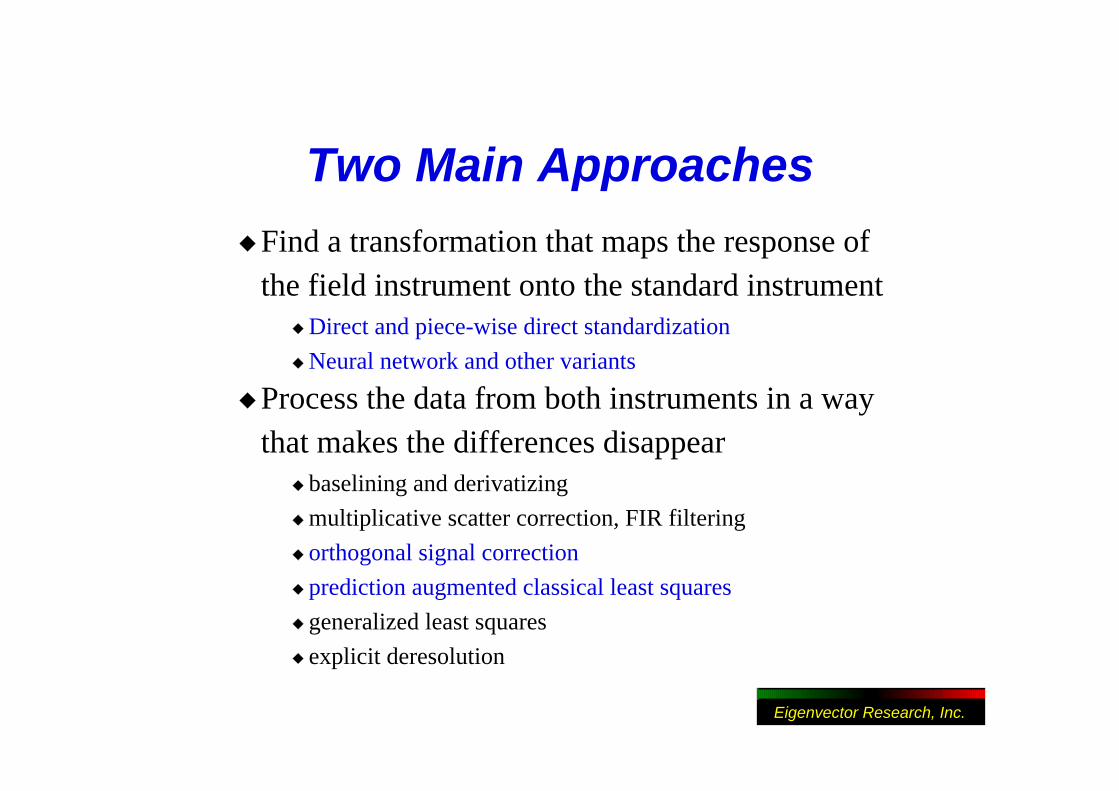
Two Main Approaches
Find a transformation that maps the response of the field instrument onto the standard instrument
Direct and piece-wise direct standardization
Neural network and other variants
Process the data from both instruments in a way that makes the differences disappear
baselining and derivatizing
multiplicative scatter correction, FIR filtering
orthogonal signal correction
prediction augmented classical least squares
generalized least squares
explicit deresolution
Eigenvector Research, Inc.
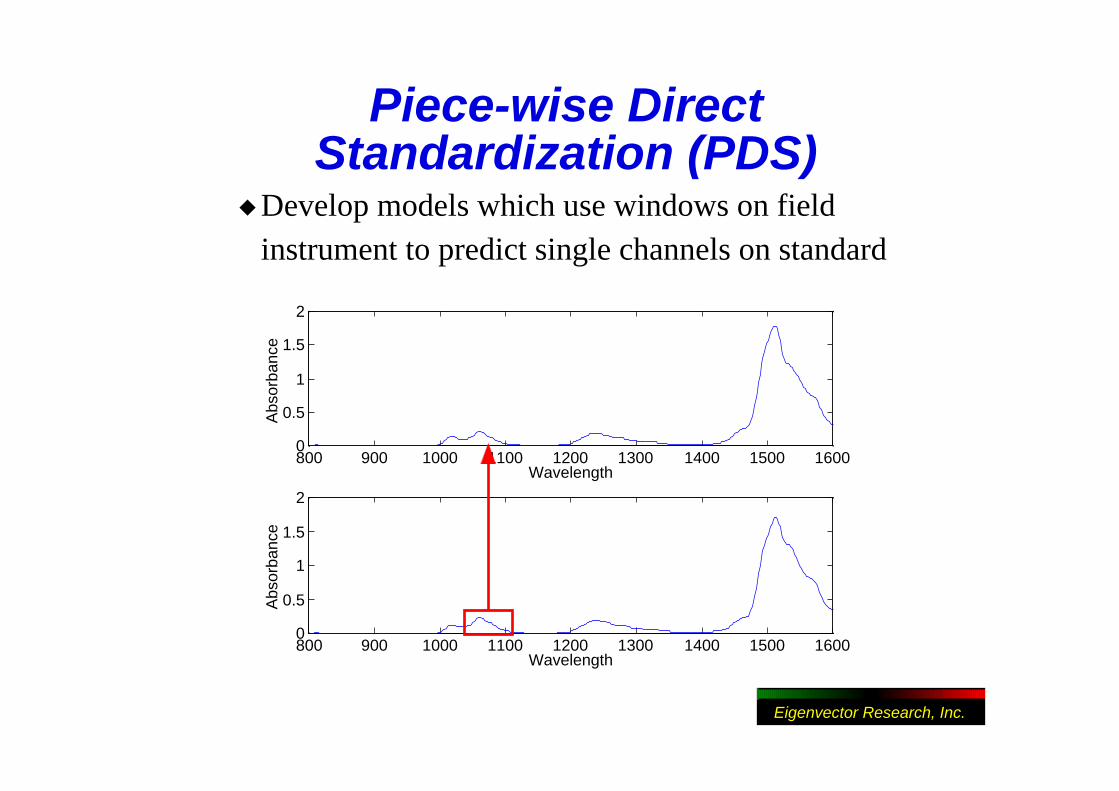
Piece-wise DirectStandardization (PDS)
Develop models which use windows on field instrument to predict single channels on standard
800 900 1000 1100 1200 1300 1400 1500 16000
0.5
1
1.5
2
Wavelength
Abs
orba
nce
800 900 1000 1100 1200 1300 1400 1500 16000
0.5
1
1.5
2
Wavelength
Abs
orba
nce
Eigenvector Research, Inc.
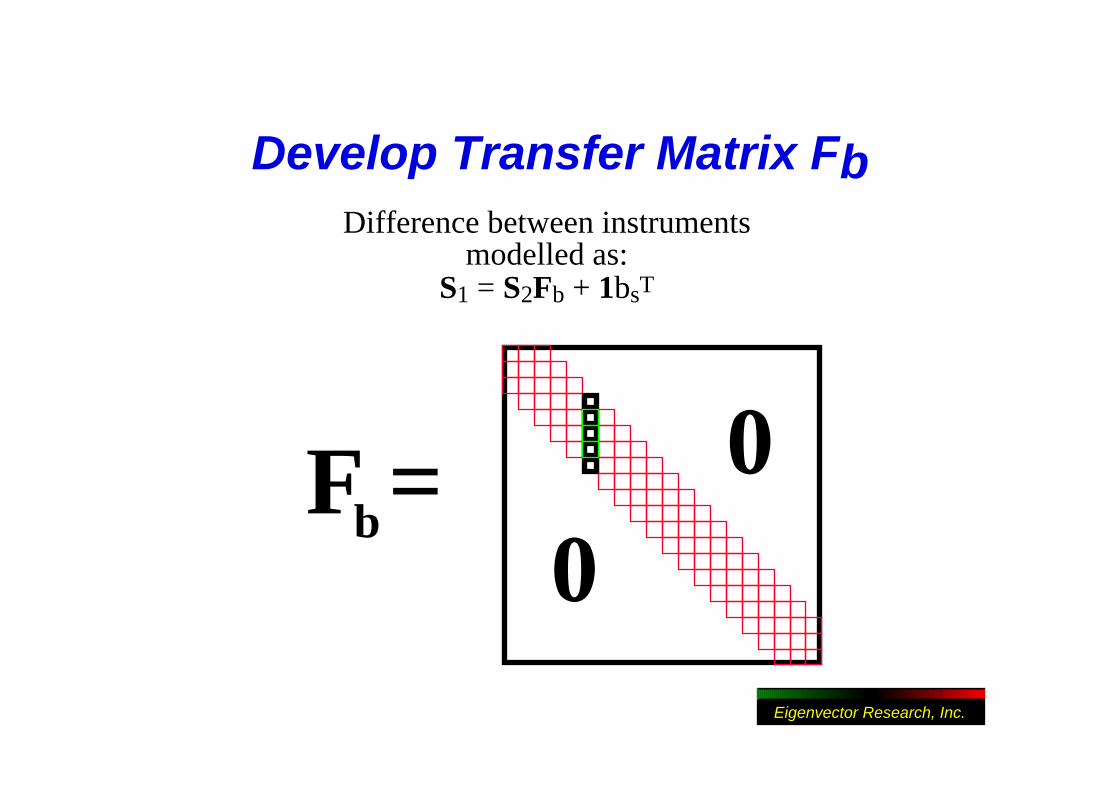
Develop Transfer Matrix Fb
00F =b
Difference between instrumentsmodelled as:
S1 = S2Fb + 1bsT
Eigenvector Research, Inc.
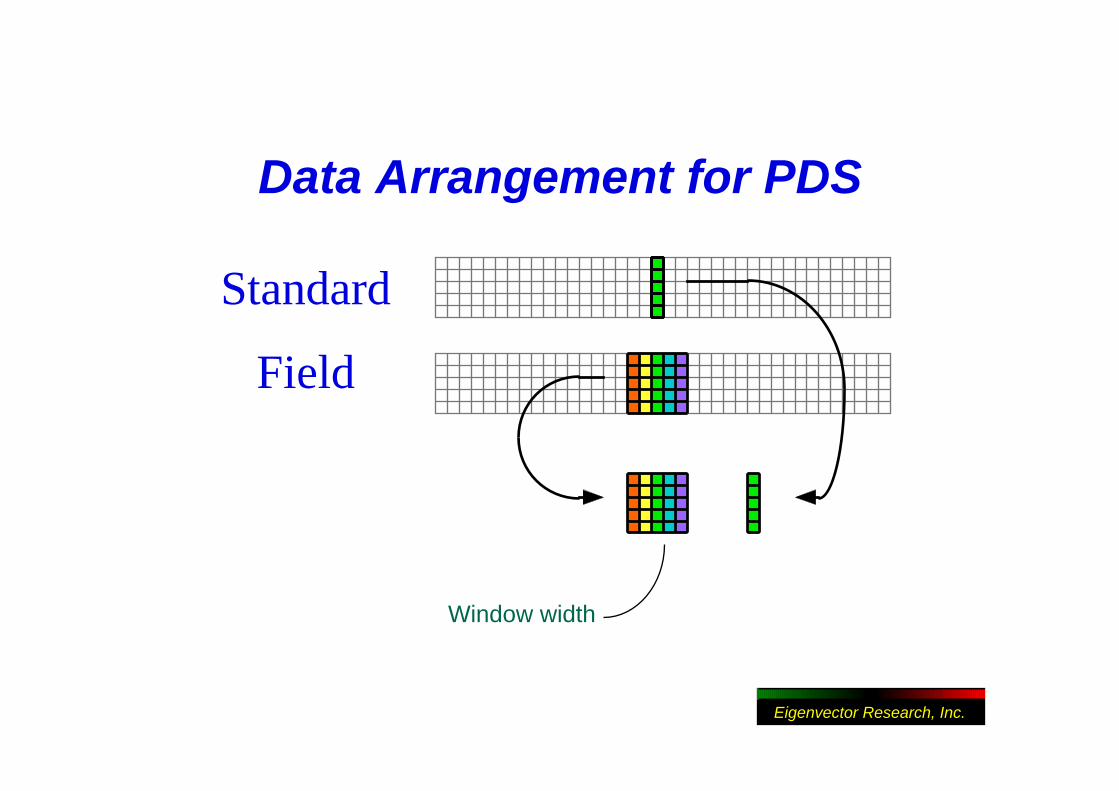
Data Arrangement for PDS
Standard
Field
Window width
Eigenvector Research, Inc.
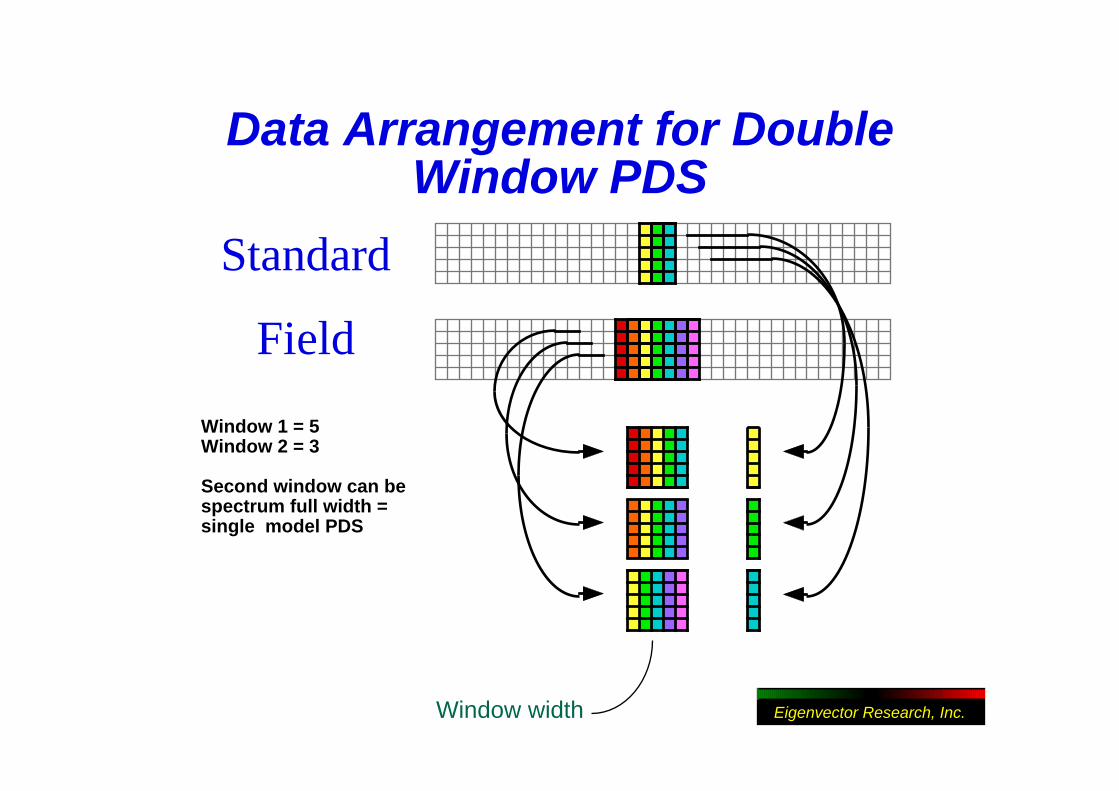
Data Arrangement for DoubleWindow PDS
Standard
Field
Window width
Window 1 = 5 Window 2 = 3
Second window can be spectrum full width =single model PDS
Eigenvector Research, Inc.
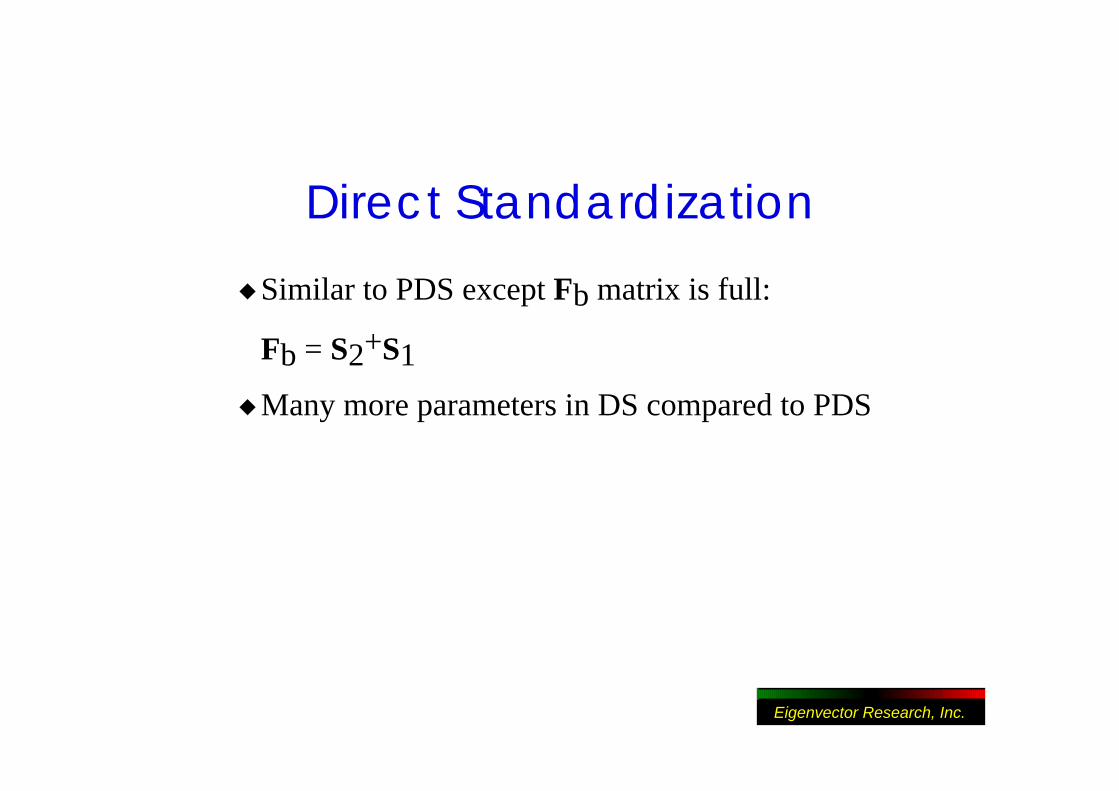
Direct Standardization
Similar to PDS except Fb matrix is full:
Fb = S2+S1
Many more parameters in DS compared to PDS
Eigenvector Research, Inc.
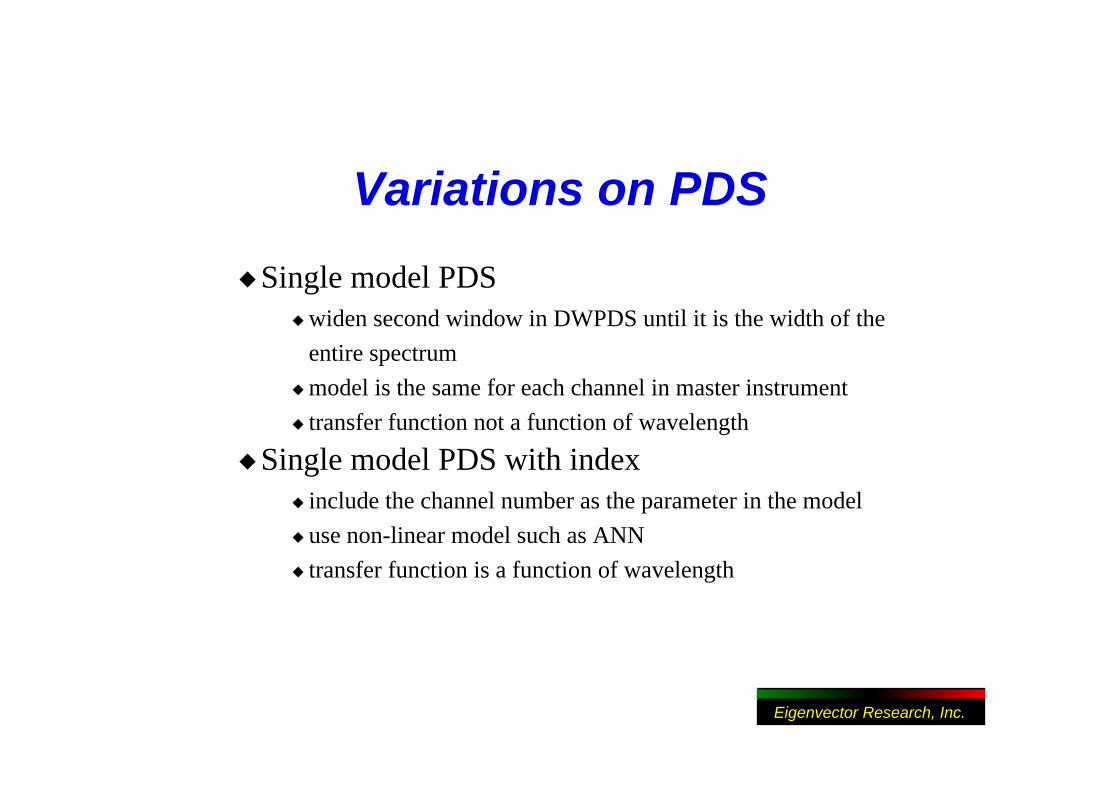
Variations on PDS
Single model PDSwiden second window in DWPDS until it is the width of the
entire spectrum
model is the same for each channel in master instrument
transfer function not a function of wavelength
Single model PDS with indexinclude the channel number as the parameter in the model
use non-linear model such as ANN
transfer function is a function of wavelength
Eigenvector Research, Inc.
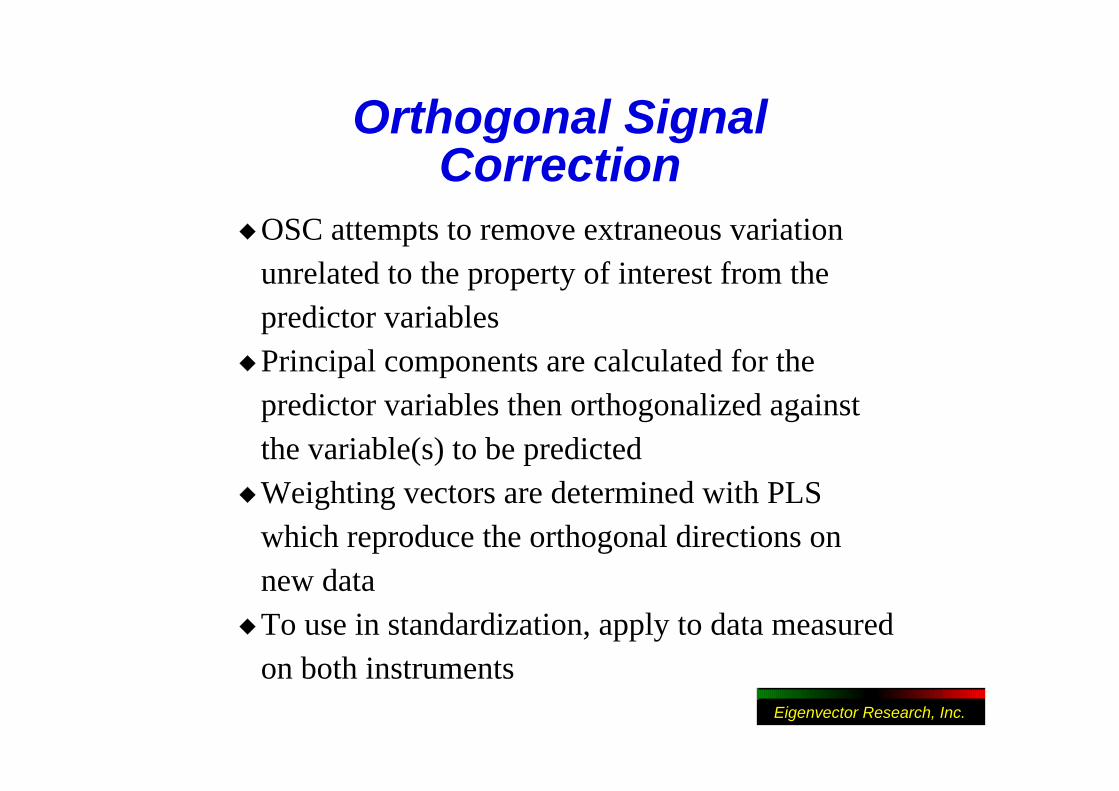
Orthogonal SignalCorrection
OSC attempts to remove extraneous variation unrelated to the property of interest from the predictor variablesPrincipal components are calculated for the predictor variables then orthogonalized against the variable(s) to be predictedWeighting vectors are determined with PLS which reproduce the orthogonal directions on new dataTo use in standardization, apply to data measured on both instruments
Eigenvector Research, Inc.
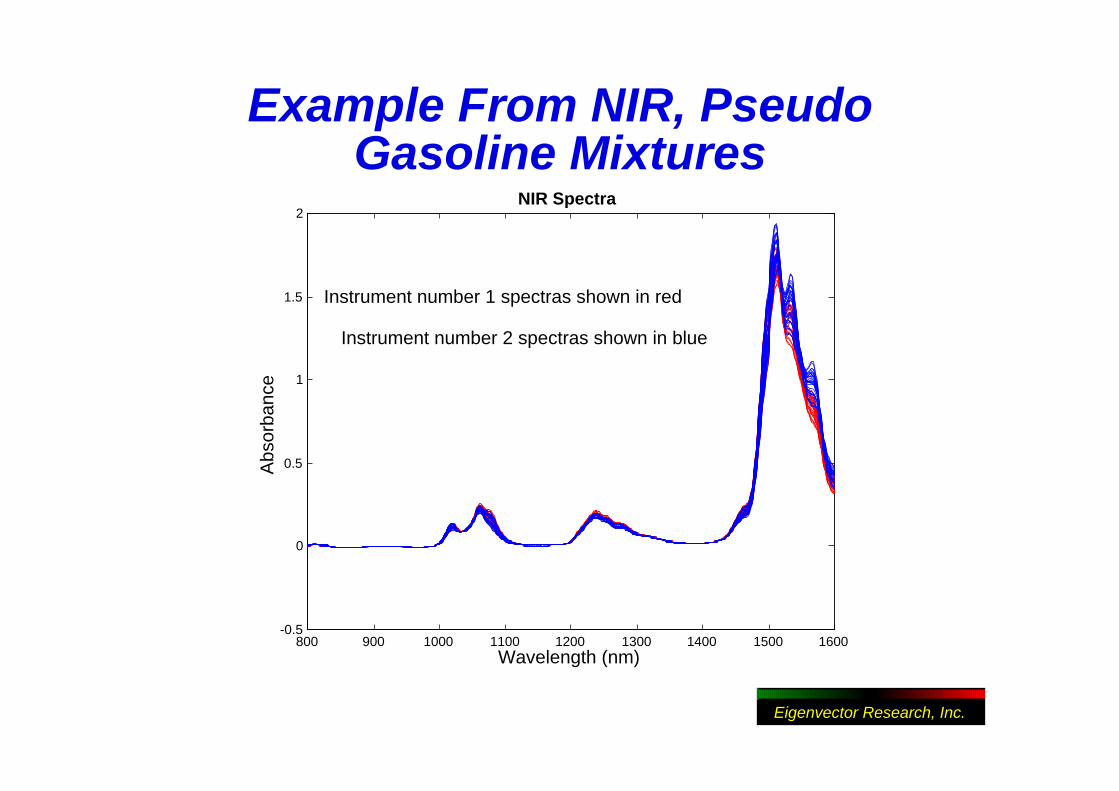
Example From NIR, PseudoGasoline Mixtures
800 900 1000 1100 1200 1300 1400 1500 1600-0.5
0
0.5
1
1.5
2NIR Spectra
Wavelength (nm)
Abs
orba
nce
Instrument number 1 spectras shown in red
Instrument number 2 spectras shown in blue
Eigenvector Research, Inc.
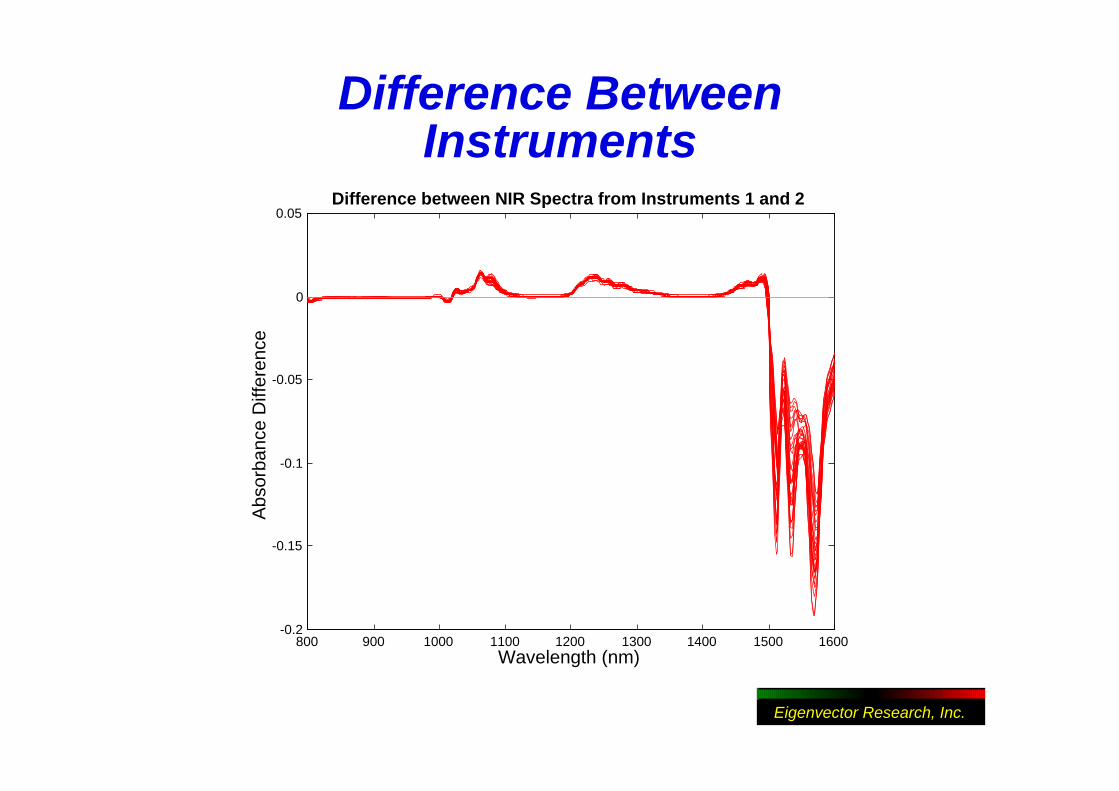
Difference BetweenInstruments
800 900 1000 1100 1200 1300 1400 1500 1600-0.2
-0.15
-0.1
-0.05
0
0.05Difference between NIR Spectra from Instruments 1 and 2
Wavelength (nm)
Abs
orba
nce
Diff
eren
ce
Eigenvector Research, Inc.
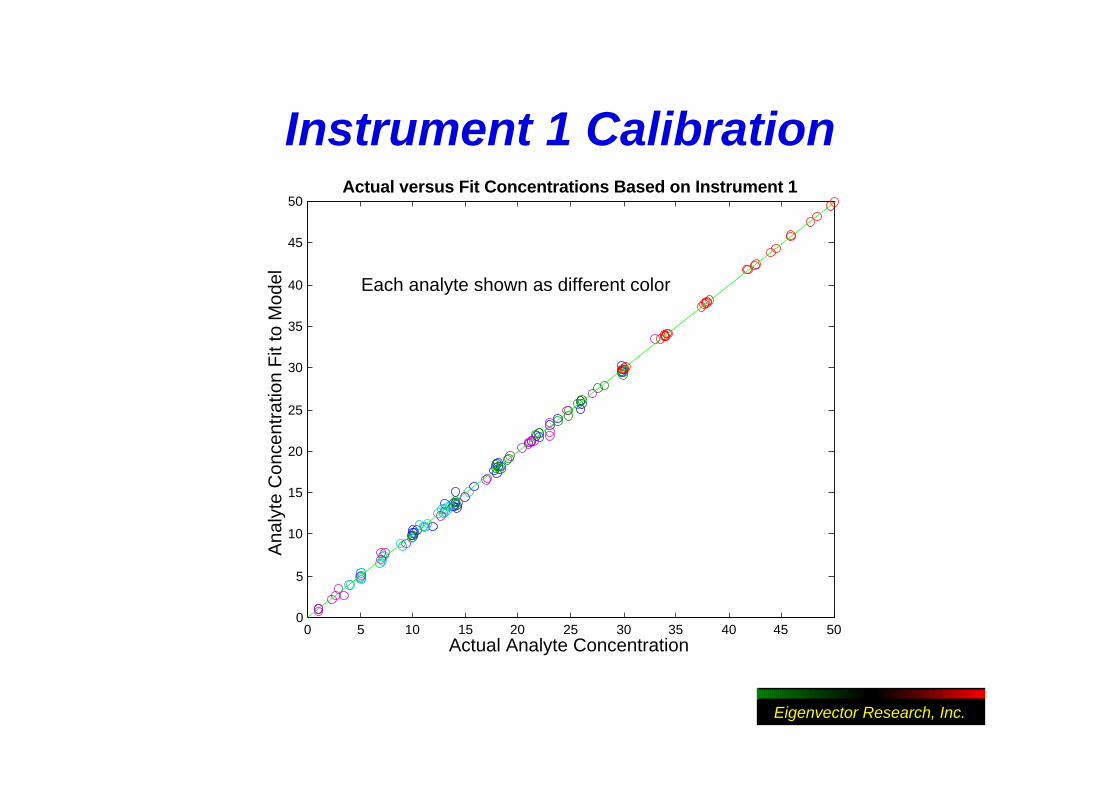
Instrument 1 Calibration
0 5 10 15 20 25 30 35 40 45 500
5
10
15
20
25
30
35
40
45
50Actual versus Fit Concentrations Based on Instrument 1
Actual Analyte Concentration
Ana
lyte
Con
cent
ratio
n F
it to
Mod
el Each analyte shown as different color
Eigenvector Research, Inc.
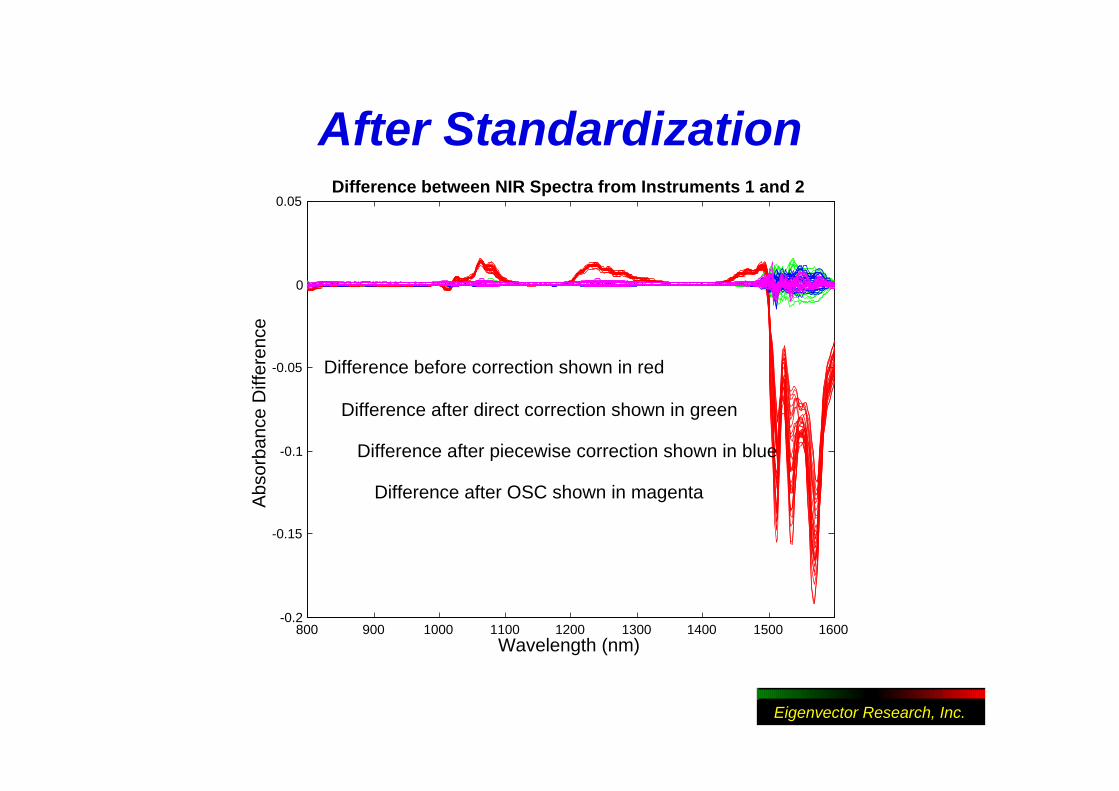
After Standardization
800 900 1000 1100 1200 1300 1400 1500 1600-0.2
-0.15
-0.1
-0.05
0
0.05Difference between NIR Spectra from Instruments 1 and 2
Wavelength (nm)
Abs
orba
nce
Diff
eren
ce
Difference before correction shown in red
Difference after direct correction shown in green
Difference after piecewise correction shown in blue
Difference after OSC shown in magenta
Eigenvector Research, Inc.
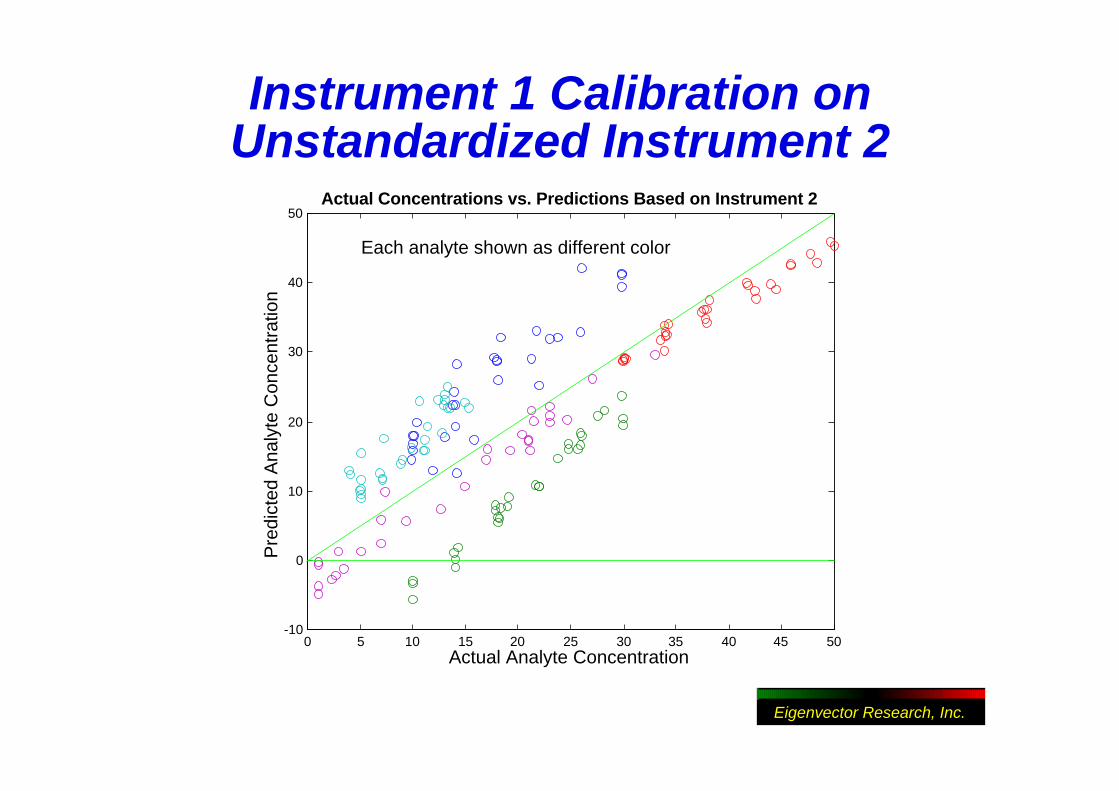
Instrument 1 Calibration onUnstandardized Instrument 2
0 5 10 15 20 25 30 35 40 45 50-10
0
10
20
30
40
50Actual Concentrations vs. Predictions Based on Instrument 2
Actual Analyte Concentration
Pre
dict
ed A
naly
te C
once
ntra
tion
Each analyte shown as different color
Eigenvector Research, Inc.
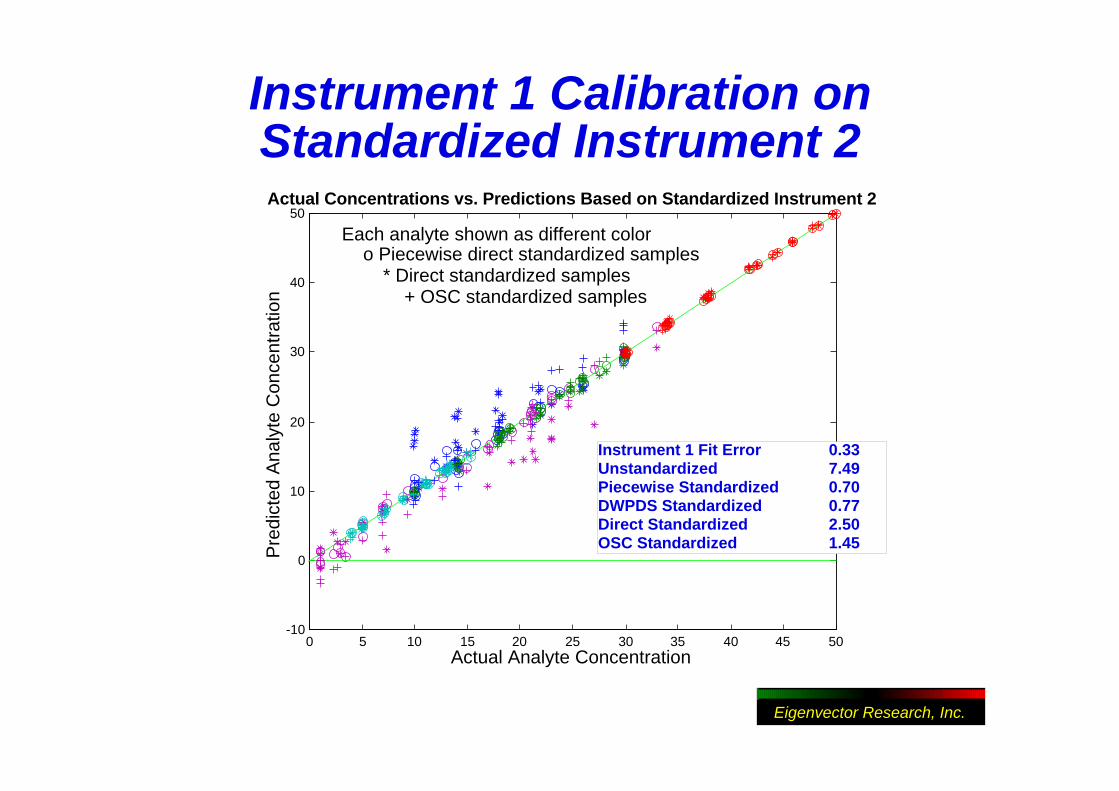
Instrument 1 Calibration onStandardized Instrument 2
0 5 10 15 20 25 30 35 40 45 50-10
0
10
20
30
40
50Actual Concentrations vs. Predictions Based on Standardized Instrument 2
Actual Analyte Concentration
Pre
dict
ed A
naly
te C
once
ntra
tion
Each analyte shown as different coloro Piecewise direct standardized samples
* Direct standardized samples+ OSC standardized samples
Instrument 1 Fit Error 0.33 Unstandardized 7.49 Piecewise Standardized 0.70 DWPDS Standardized 0.77 Direct Standardized 2.50 OSC Standardized 1.45
Eigenvector Research, Inc.
Prediction AugmentedClassical Least Squares
If CLS is used for predictive model, new spectra can be added to prediction step to account for differences between instrumentAugmented spectra can include known new components or estimates of changes such as a baseline offset or mean differenceEigenvectors of difference matrices can also be included
Eigenvector Research, Inc.
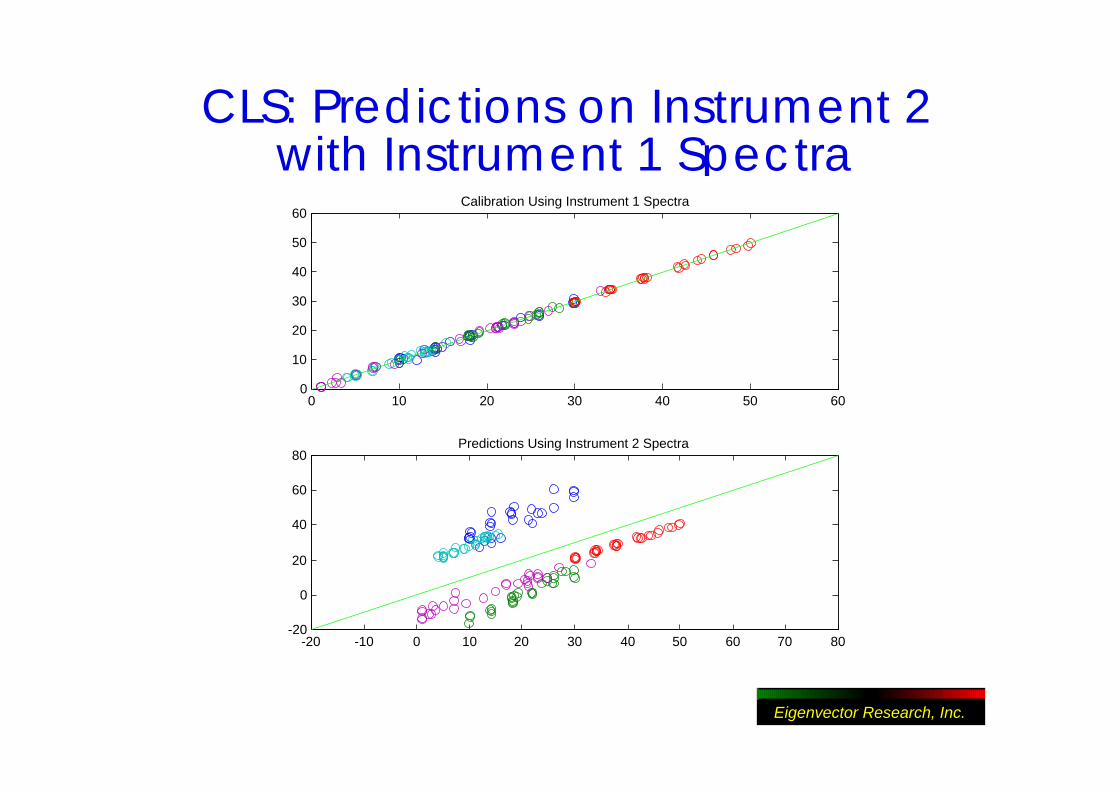
CLS: Predictions on Instrument 2with Instrument 1 Spectra
0 10 20 30 40 50 600
10
20
30
40
50
60Calibration Using Instrument 1 Spectra
-20 -10 0 10 20 30 40 50 60 70 80-20
0
20
40
60
80Predictions Using Instrument 2 Spectra
Eigenvector Research, Inc.
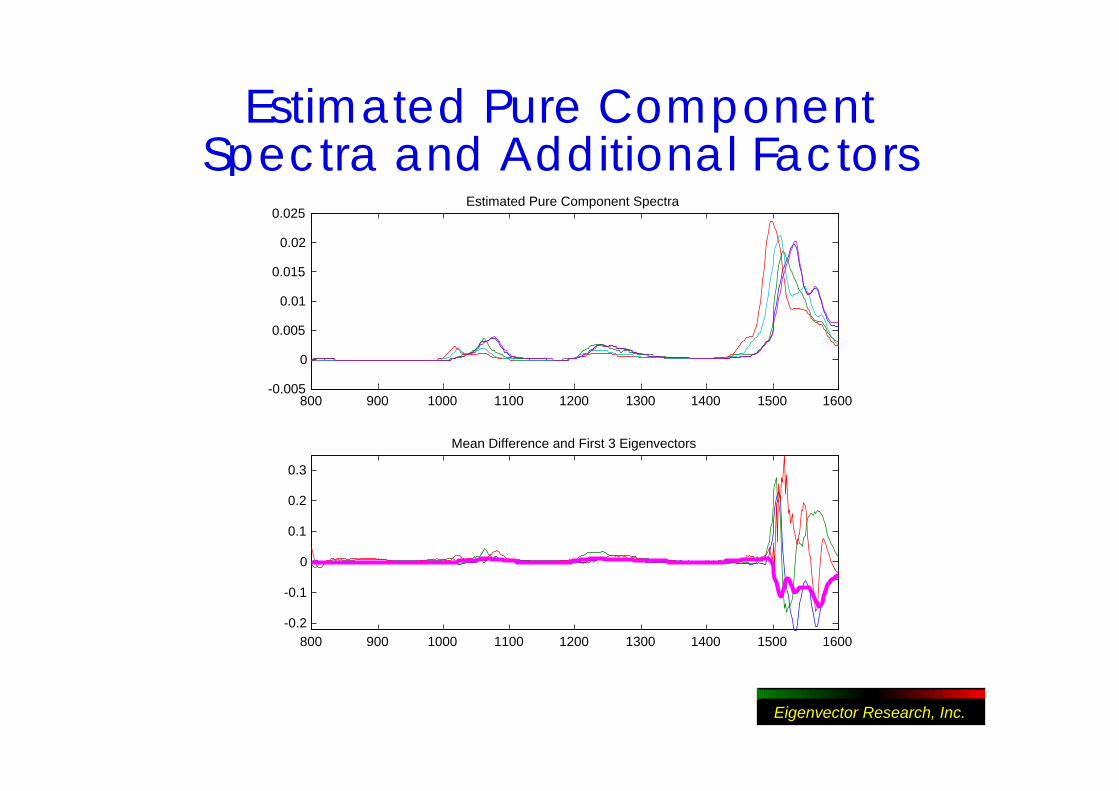
Estimated Pure ComponentSpectra and Additional Factors
800 900 1000 1100 1200 1300 1400 1500 1600-0.005
0
0.005
0.01
0.015
0.02
0.025Estimated Pure Component Spectra
800 900 1000 1100 1200 1300 1400 1500 1600-0.2
-0.1
0
0.1
0.2
0.3
Mean Difference and First 3 Eigenvectors
Eigenvector Research, Inc.
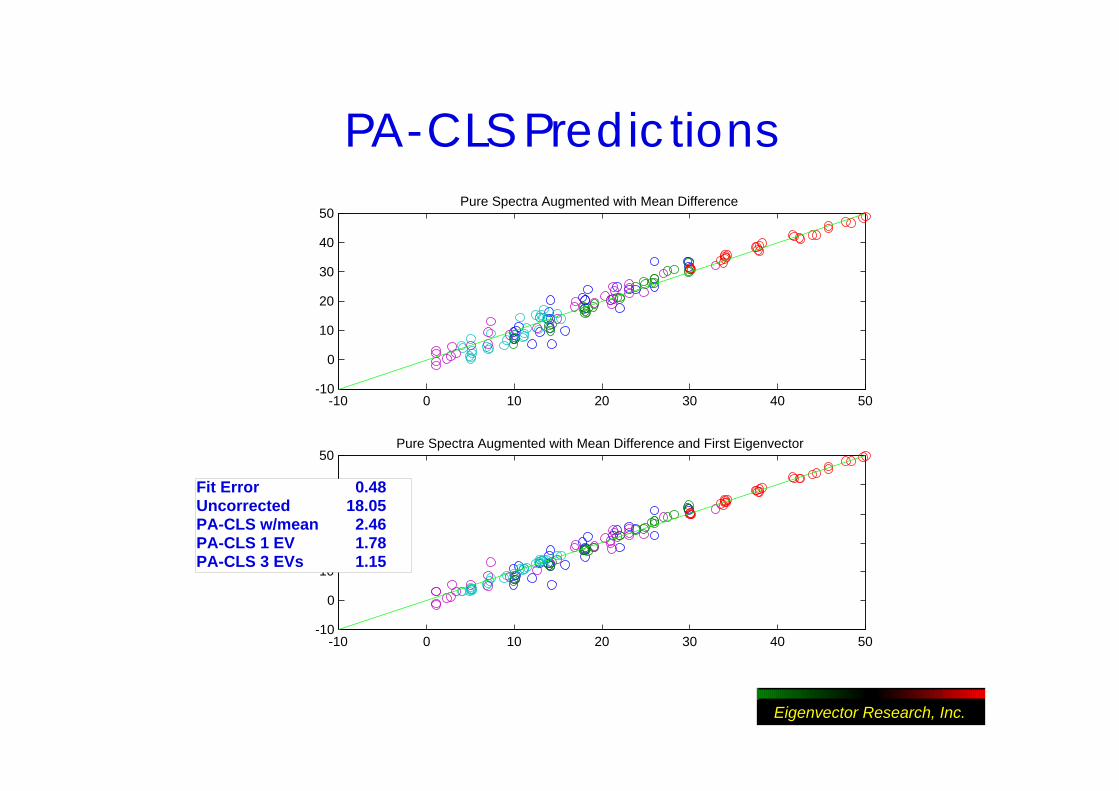
PA-CLS Predictions
-10 0 10 20 30 40 50-10
0
10
20
30
40
50Pure Spectra Augmented with Mean Difference
-10 0 10 20 30 40 50-10
0
10
20
30
40
50Pure Spectra Augmented with Mean Difference and First Eigenvector
Fit Error 0.48 Uncorrected 18.05 PA-CLS w/mean 2.46 PA-CLS 1 EV 1.78 PA-CLS 3 EVs 1.15
Eigenvector Research, Inc.
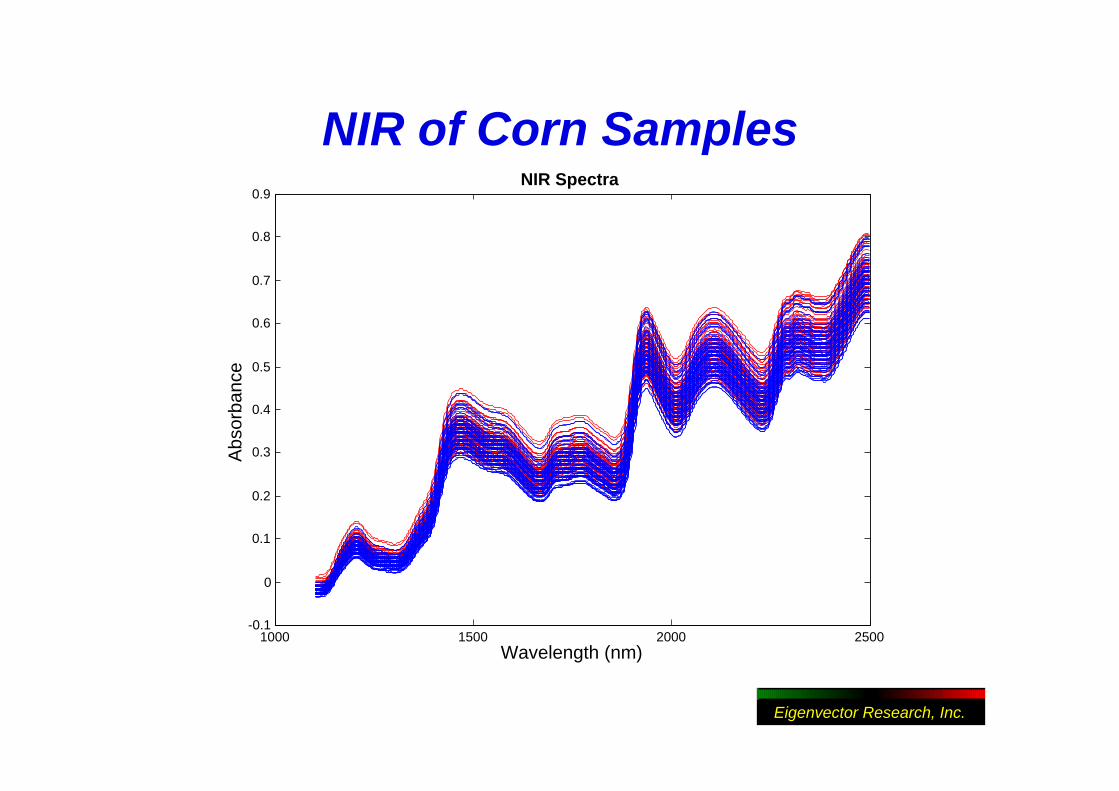
NIR of Corn Samples
1000 1500 2000 2500-0.1
0
0.1
0.2
0.3
0.4
0.5
0.6
0.7
0.8
0.9NIR Spectra
Wavelength (nm)
Abs
orba
nce
Eigenvector Research, Inc.
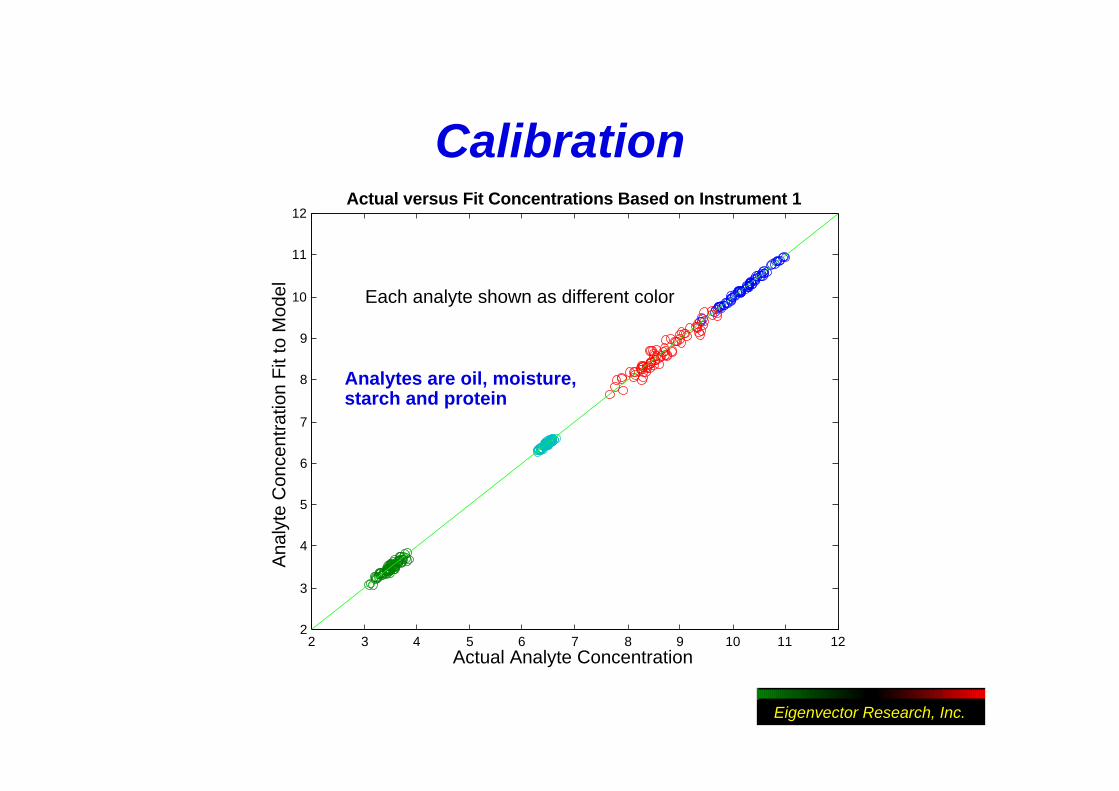
Calibration
2 3 4 5 6 7 8 9 10 11 122
3
4
5
6
7
8
9
10
11
12Actual versus Fit Concentrations Based on Instrument 1
Actual Analyte Concentration
Ana
lyte
Con
cent
ratio
n F
it to
Mod
el Each analyte shown as different color
Analytes are oil, moisture, starch and protein
Eigenvector Research, Inc.
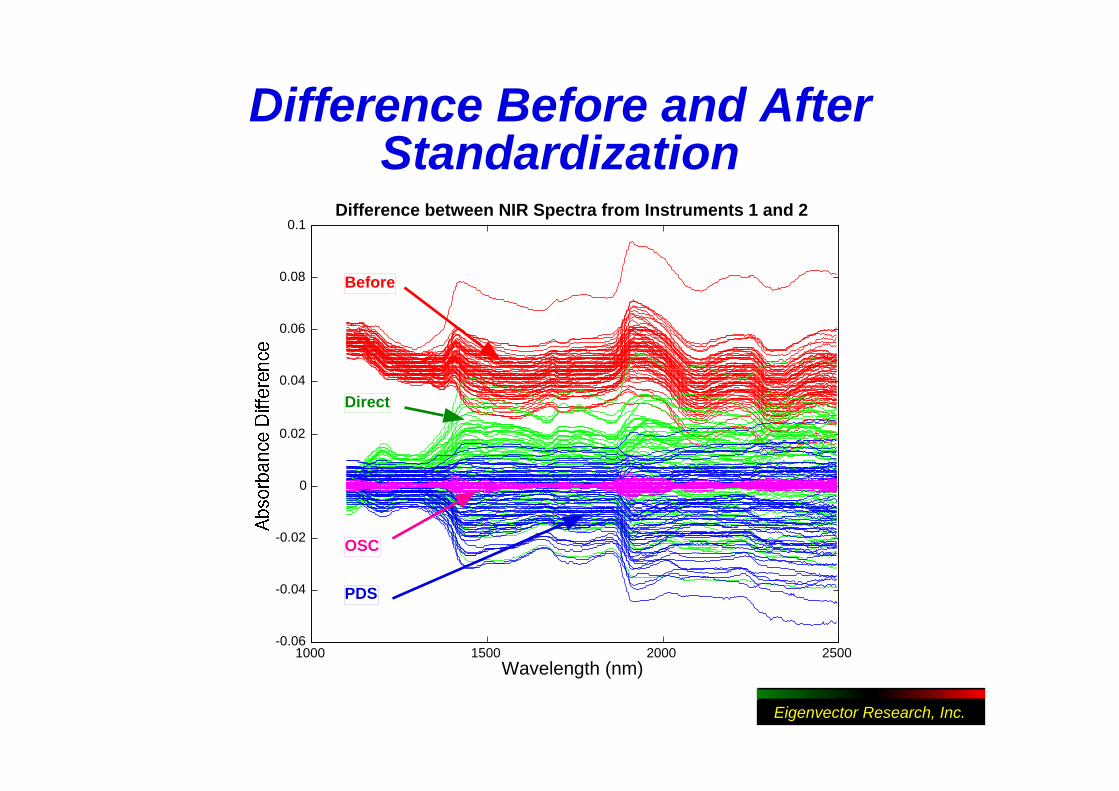
Difference Before and AfterStandardization
1000 1500 2000 2500-0.06
-0.04
-0.02
0
0.02
0.04
0.06
0.08
0.1Difference between NIR Spectra from Instruments 1 and 2
Wavelength (nm)
OSC
Direct
Before
PDS
Eigenvector Research, Inc.
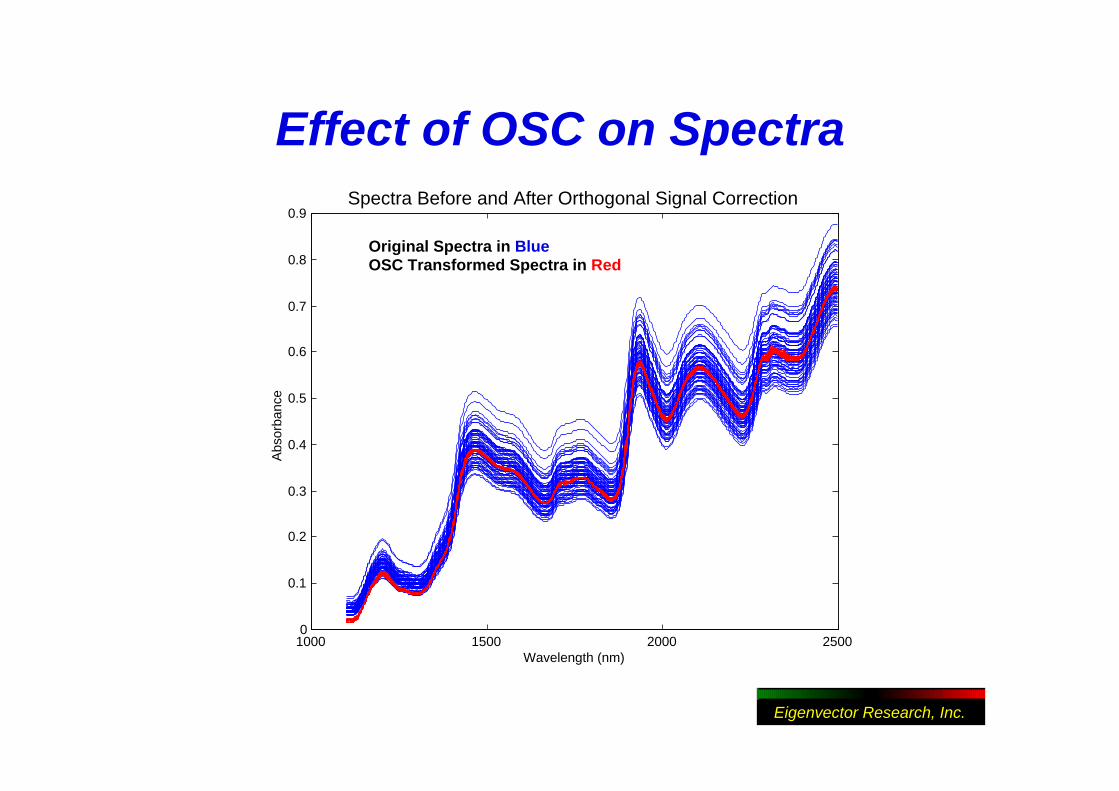
Effect of OSC on Spectra
1000 1500 2000 25000
0.1
0.2
0.3
0.4
0.5
0.6
0.7
0.8
0.9
Wavelength (nm)
Abs
orba
nce
Spectra Before and After Orthogonal Signal Correction
Original Spectra in BlueOSC Transformed Spectra in Red

Eigenvector Research, Inc.
Results of CornStandardization
2 3 4 5 6 7 8 9 10 11 122
3
4
5
6
7
8
9
10
11
12Actual Concentrations vs. Predictions Based on Standardized Instrument 2
Actual Analyte Concentration
Each analyte shown as different color
o Piecewise direct standardized samples
* Direct standardized samples
+ OSC standardized samples
Fit Error = 0.10 Unstandardized = 1.32 PDS = 0.33 DWPDS = 0.33 Direct = 0.45 OSC = 0.20
Eigenvector Research, Inc.
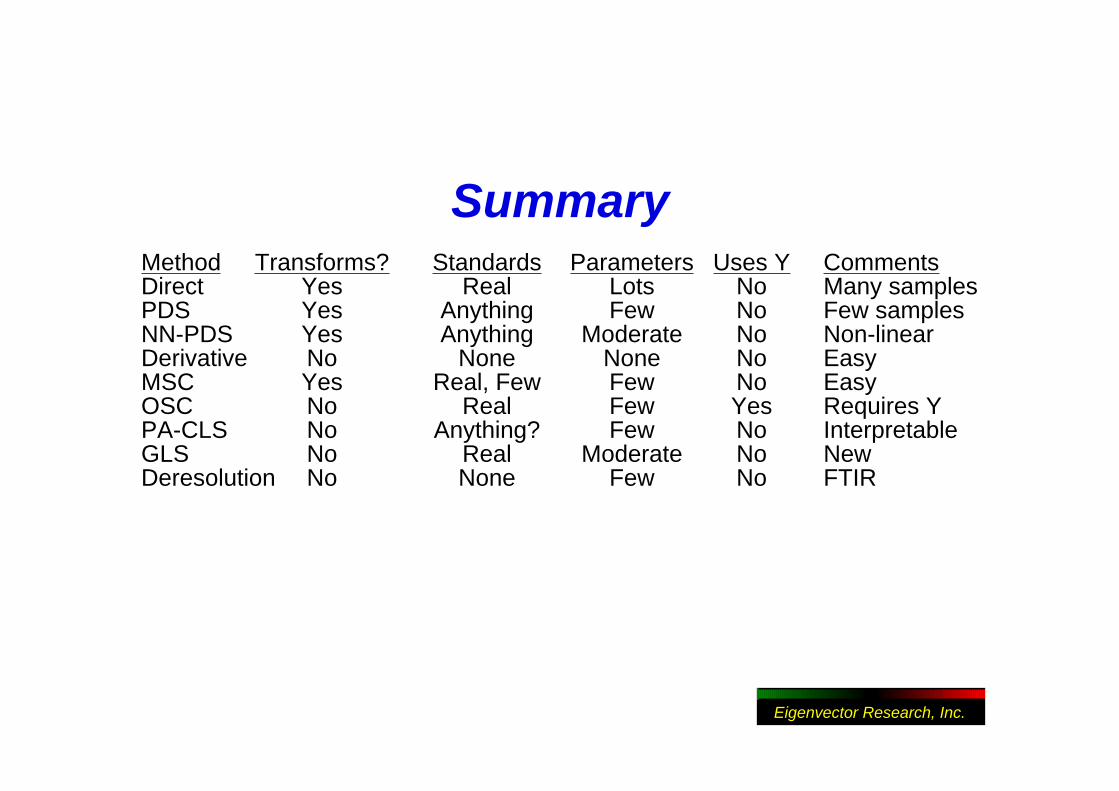
SummaryMethod Transforms? Standards Parameters Uses Y CommentsDirect Yes Real Lots No Many samplesPDS Yes Anything Few No Few samplesNN-PDS Yes Anything Moderate No Non-linearDerivative No None None No EasyMSC Yes Real, Few Few No EasyOSC No Real Few Yes Requires YPA-CLS No Anything? Few No InterpretableGLS No Real Moderate No NewDeresolution No None Few No FTIR
Eigenvector Research, Inc.
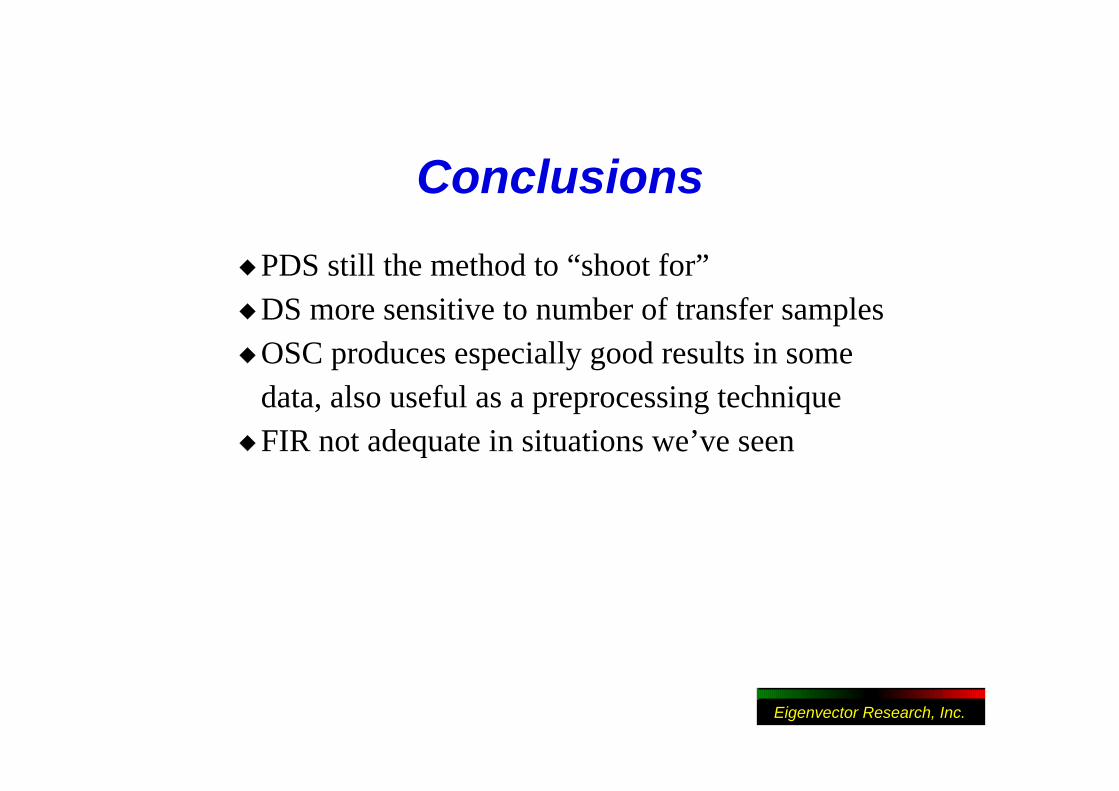
Conclusions
PDS still the method to “shoot for”DS more sensitive to number of transfer samplesOSC produces especially good results in some data, also useful as a preprocessing techniqueFIR not adequate in situations we’ve seen
PLS_Toolbox 2.0for use with MATLAB
PLS_Toolbox 2.0for use with MATLAB™
Barry M. WiseNeal B. Gallagher
• Version 2.0 for MATLAB 5 now available
• Wide selection of multivariate analysis tools
• Used in our Chemometrics Short Courses
Continuum ParameterNumber of LVs
PR
ESS