introduction to information visualization - computer …candrews/classes/infovis/lect… · ·...
TRANSCRIPT

2015-02-15
Introduction to Information VisualizationC. Andrews

data visualization
information visualization
scientific visualization

What is information visualization?
“The use of computer-supported, interactive visual representations of abstract data to amplify cognition”
- Card, Mackinlay, and Shneiderman
“The purpose of visualization is insight, not pictures.” - Ben Shneiderman
“... finding the artificial memory that best supports our natural means of perception.” - Jacques Bertin

Why visualization?
There is too much data to even begin to comprehend it all

Too much data?
2.5 Quintillion bytes of data produced every day
2,500,000,000,000,000,000 bytes!

Too much data
https://www.domo.com/blog/2014/04/data-never-sleeps-2-0/
No one said it was all interesting… but how to know the difference?

Why visualization?
✤ Vision is the highest bandwidth sense
✤ People think visually
✤ Vision incorporates
✤ parallel search
✤ pattern recognition
✤ pre-attentive processing
✤ Extends cognitive capacity by allowing fast access to the surrounding environment
from http://bionicvision.org.au/eye/healthy_vision

State income % degreeAlabama 23,587 22.3Alaska 32,537 27.5Arizona 25,571 26.6Arkansas 22,007 19.8California 29,551 30.5Colorado 31,039 36.7Connecticut 37,807 36.2Delaware 29,733 28.5Dist. of Col. 45,004 51.2Florida 26,451 26.2Georgia 25,309 27.8Hawaii 29,227 29.6Idaho 22,581 24.7Illinois 29,519 31.1Indiana 24,558 23.0Iowa 26,545 25.3Kansas 26,845 30.0Kentucky 23,210 21.0Louisiana 24,264 21.4Maine 26,464 27.3Maryland 36,056 36.3Massachusetts 35,485 39.0Michigan 25,547 25.5Minnesota 30,656 32.2Mississippi 20,670 20.0Missouri 25,546 25.8
State income % degreeMontana 25,002 28.5Nebraska 26,523 28.1Nevada 27,003 22.2New Hampshire 32,758 33.4New Jersey 35,928 35.4New Mexico 23,749 25.6New York 32,104 32.8North Carolina 25,285 26.8North Dakota 28,700 27.1Ohio 25,857 24.7Oklahoma 24,046 23.2Oregon 26,702 29.2Pennsylvania 28,190 27.0Rhode Island 30,005 30.8South Carolina 23,906 24.6South Dakota 25,570 26.0Tennessee 24,294 23.5Texas 25,809 26.3Utah 23,794 29.9Vermont 28,846 34.2Virginia 33,326 34.7Washington 30,661 31.6West Virginia 22,482 17.9Wisconsin 27,426 26.4Wyoming 28,858 24.3
2010 US Census data
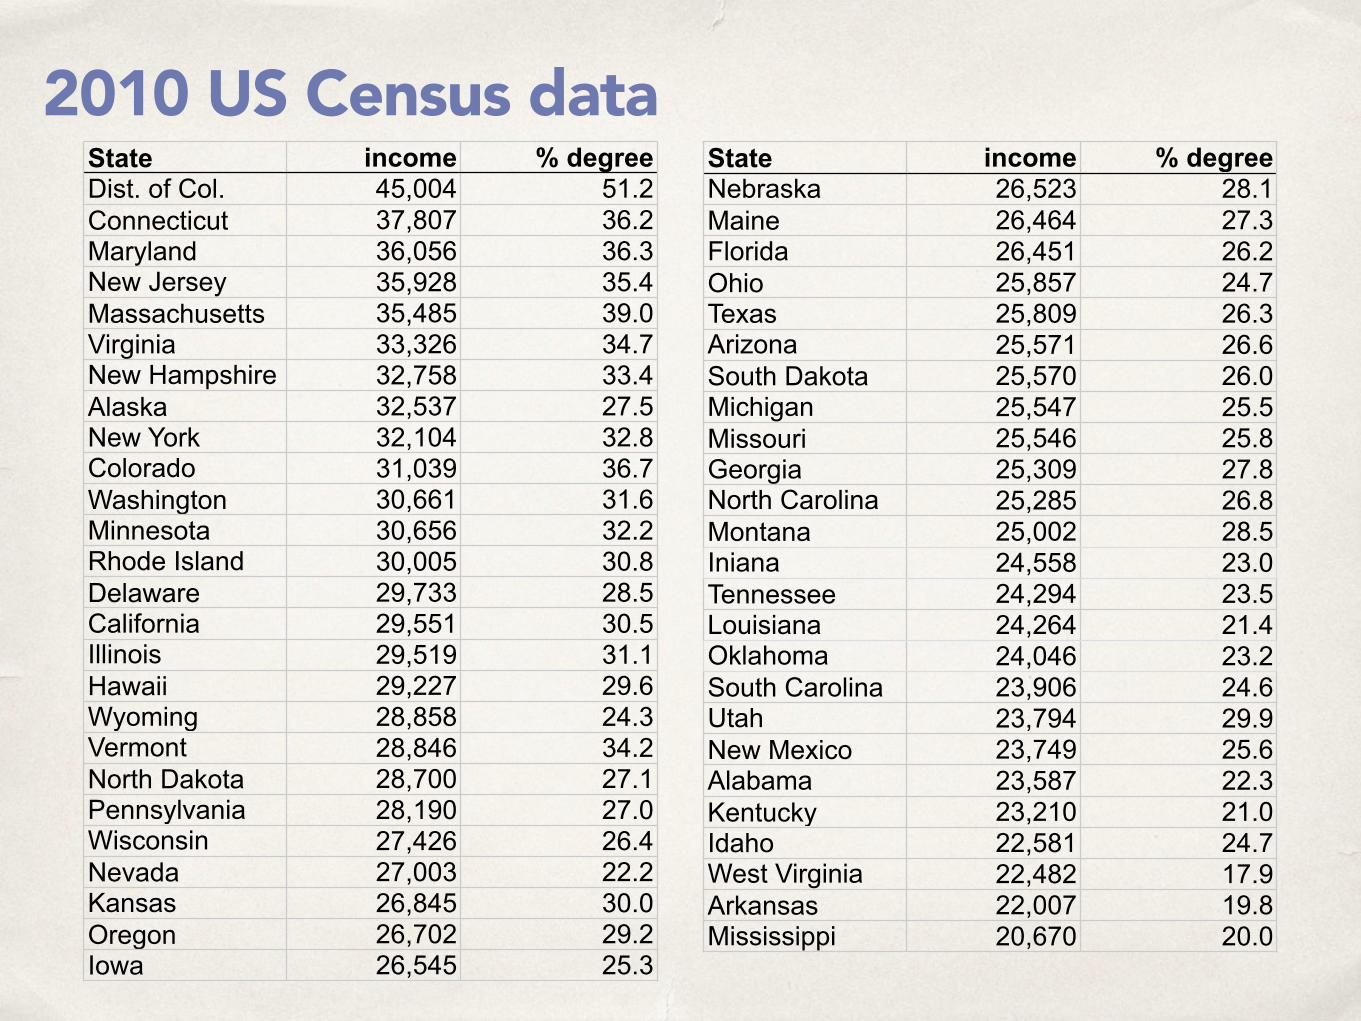
State income % degreeDist. of Col. 45,004 51.2Connecticut 37,807 36.2Maryland 36,056 36.3New Jersey 35,928 35.4Massachusetts 35,485 39.0Virginia 33,326 34.7New Hampshire 32,758 33.4Alaska 32,537 27.5New York 32,104 32.8Colorado 31,039 36.7Washington 30,661 31.6Minnesota 30,656 32.2Rhode Island 30,005 30.8Delaware 29,733 28.5California 29,551 30.5Illinois 29,519 31.1Hawaii 29,227 29.6Wyoming 28,858 24.3Vermont 28,846 34.2North Dakota 28,700 27.1Pennsylvania 28,190 27.0Wisconsin 27,426 26.4Nevada 27,003 22.2Kansas 26,845 30.0Oregon 26,702 29.2Iowa 26,545 25.3
State income % degreeNebraska 26,523 28.1Maine 26,464 27.3Florida 26,451 26.2Ohio 25,857 24.7Texas 25,809 26.3Arizona 25,571 26.6South Dakota 25,570 26.0Michigan 25,547 25.5Missouri 25,546 25.8Georgia 25,309 27.8North Carolina 25,285 26.8Montana 25,002 28.5Iniana 24,558 23.0Tennessee 24,294 23.5Louisiana 24,264 21.4Oklahoma 24,046 23.2South Carolina 23,906 24.6Utah 23,794 29.9New Mexico 23,749 25.6Alabama 23,587 22.3Kentucky 23,210 21.0Idaho 22,581 24.7West Virginia 22,482 17.9Arkansas 22,007 19.8Mississippi 20,670 20.0
2010 US Census data

2010 US Census data
District of Columbia
Connecticut
New Jersey
Massachusetts
West Virginia
Colorado
Wyoming

2010 US Census data

Visualization goals✤ Presentation
✤ tell stories
✤ inform, persuade
✤ collaborate
✤ Overview or monitoring
✤ Analysis
✤ try to make sense of a large mass of data, figure out what is interesting
✤ look for patterns, trends, outliers, relationships, correlations, clusters, anomalies

Anscombe’s QuartetI II III IV
x y x y x y x y
10 8.04 10 9.14 10 7.46 8 6.58
8 6.95 8 8.14 8 6.77 8 5.76
13 7.58 13 8.74 13 12.74 8 7.71
9 8.81 9 8.77 9 7.11 8 8.84
11 8.33 11 9.26 11 7.81 8 8.47
14 9.96 14 8.1 14 8.84 8 7.04
6 7.24 6 6.13 6 6.08 8 5.25
4 4.26 4 3.1 4 5.39 19 12.5
12 10.84 12 9.13 12 8.15 8 5.56
7 4.82 7 7.26 7 6.42 8 7.91
5 5.68 5 4.74 5 5.73 8 6.89
mean of X 9variance of x 11
mean of y 7.5variance of y 4.122

Anscombe’s Quartet
from Wikimedia Commons: http://en.wikipedia.org/wiki/File:Anscombe%27s_quartet_3.svg
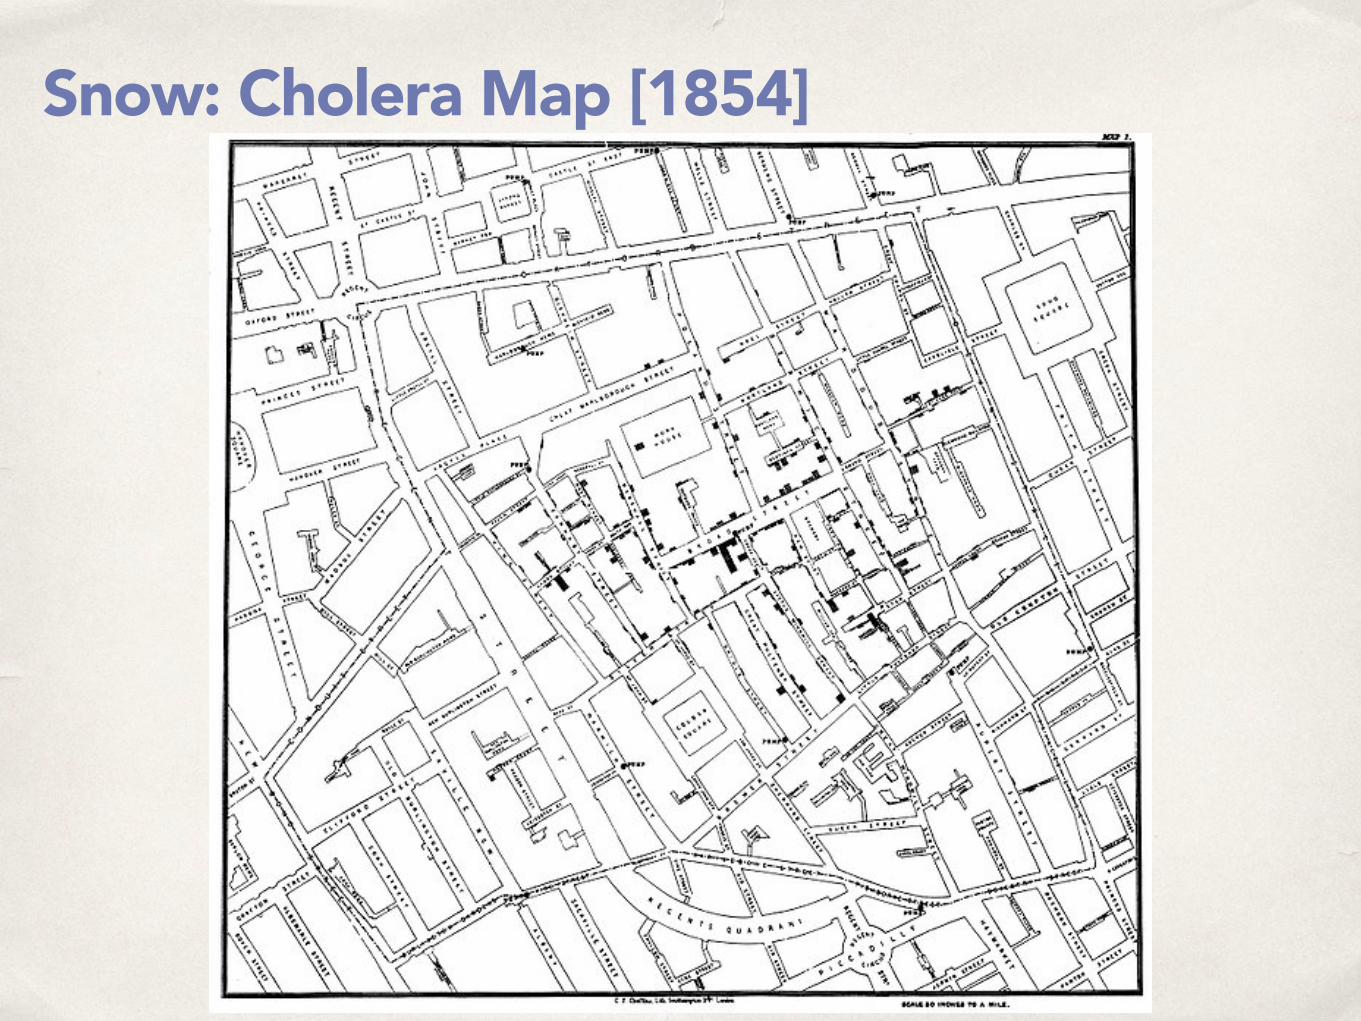
Snow: Cholera Map [1854]

Snow: Cholera Map [1854]

Minard: Napoleon’s march [1869]

Tufte: Challenger disaster

Tufte: Challenger disaster


http://visual.ly/thanksgiving-dinner-what-3000-calories-looks-everyday-food
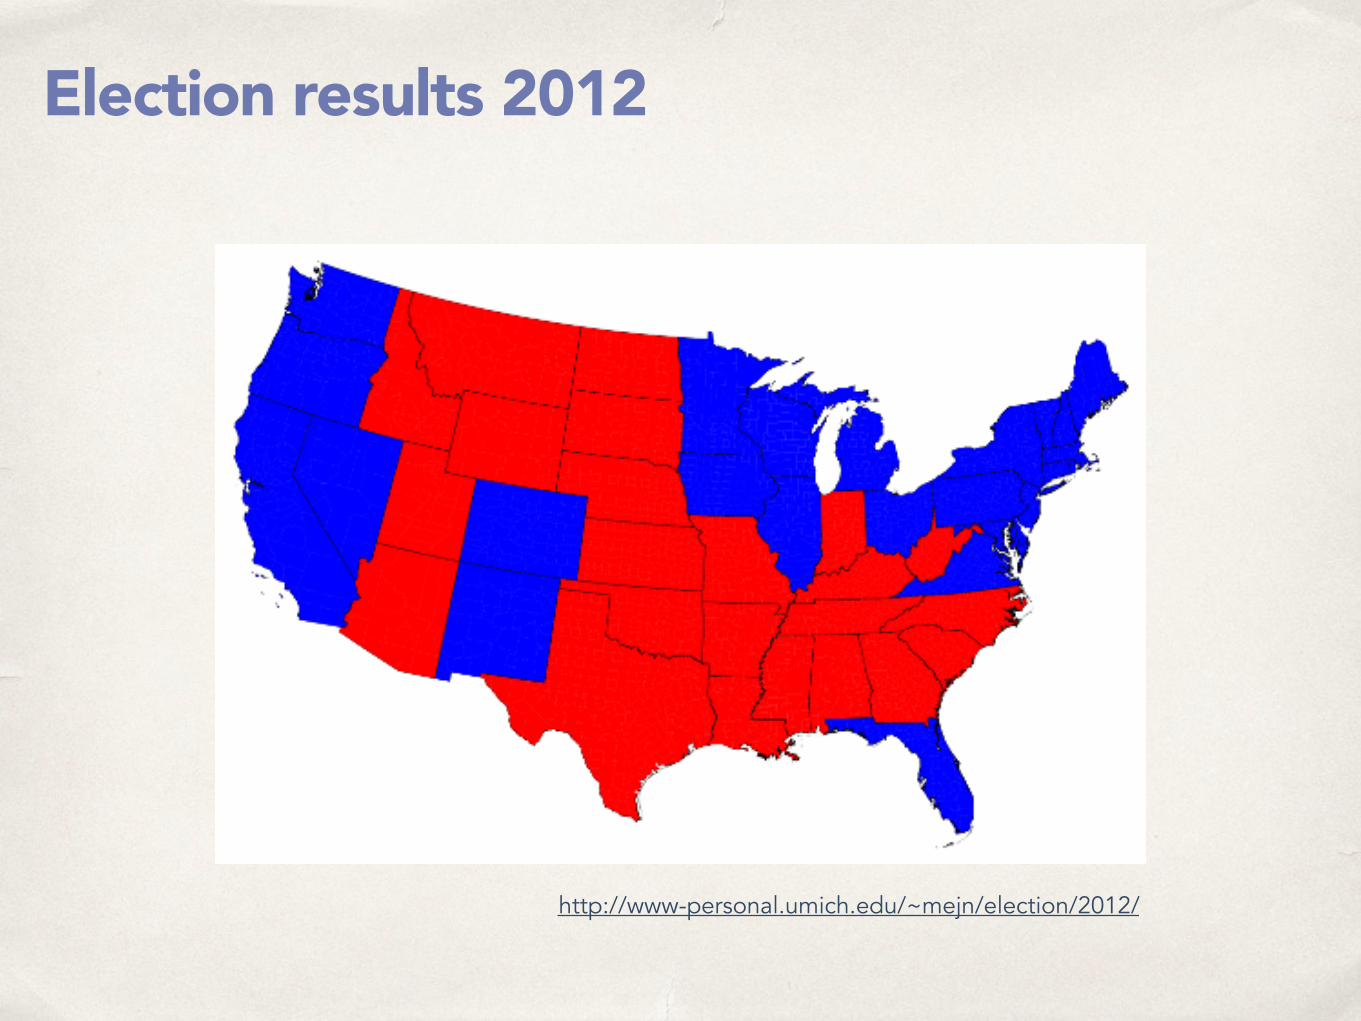
Election results 2012
http://www-personal.umich.edu/~mejn/election/2012/

Election results 2012
http://www-personal.umich.edu/~mejn/election/2012/

NameVoyager
http://www.babynamewizard.com/voyager#prefix=&sw=both&exact=false
