introduction to gis (basics, data, analysis) case studies ... · 1 introduction to gis (basics,...
TRANSCRIPT
1
Introduction to GIS (Basics, Data, Analysis)
&Case Studies
13th May 2004
Content
• Introduction to GIS• Data concepts• Data input• Analysis• Applications – selected examples
What is GIS?
Geographic Information System (GIS) is defined as an information system that is used to
input, store, retrieve, manipulate, analyze and output
geographically referenced data or geospatial data, in order to support decision making for planning and management of land use, natural resources, environment, transportation, urban facilities, health services so on.
2
What is GIS?
GIS is a set of tools that allow for the processing of
spatial data into information. This set of tools is open ended, but will include data input, data storage, data manipulation, and a reporting system.
Other definition of GIS
‘A GIS is designed for the collection storage, and analysis of objects and phenomena where geographic location is an important characteristic or critical to the analysis.’
“Computer tool for managing geographic feature location data and data related to those features.”
GIS is a tool for managing data about where features are (geographic coordinate data) and what they are like (attribute data), and for providing the ability to query, manipulate, and analyze those data.
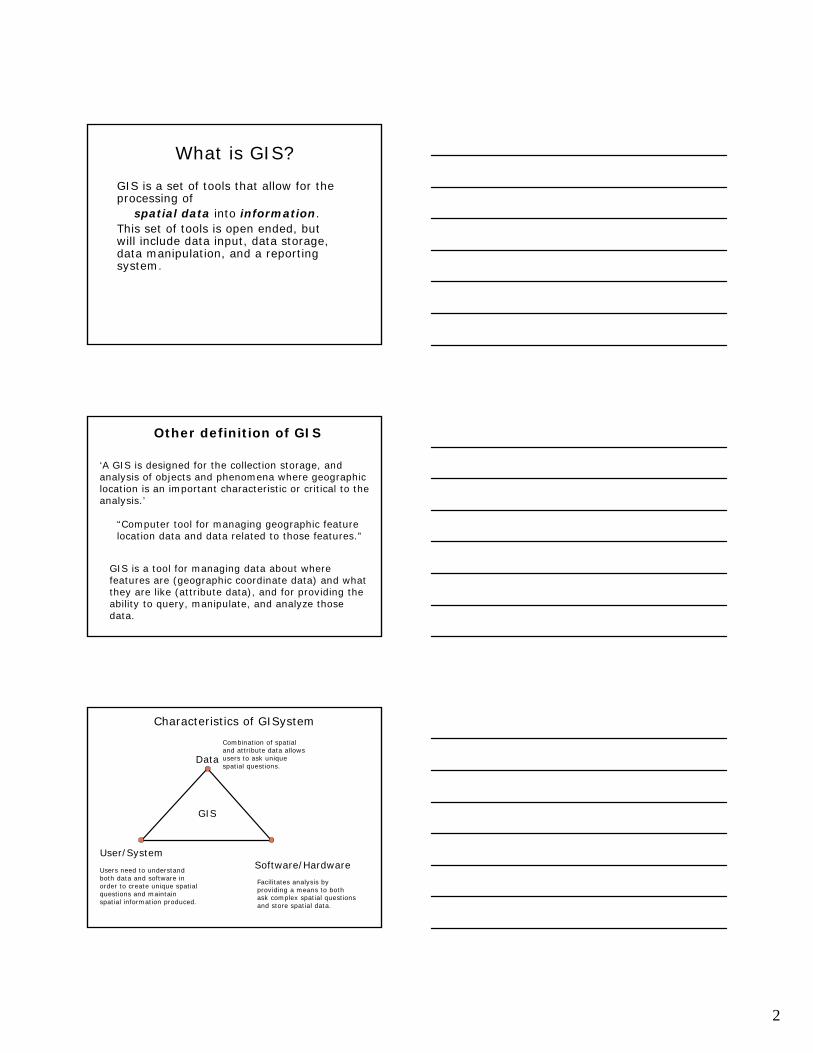
Data
User/SystemSoftware/Hardware
Combination of spatial and attribute data allows users to ask unique spatial questions.
Users need to understand both data and software in order to create unique spatial questions and maintain spatial information produced.
Facilitates analysis by providing a means to both ask complex spatial questions and store spatial data.
GIS
Characteristics of GISystem
3
Planning & GIS
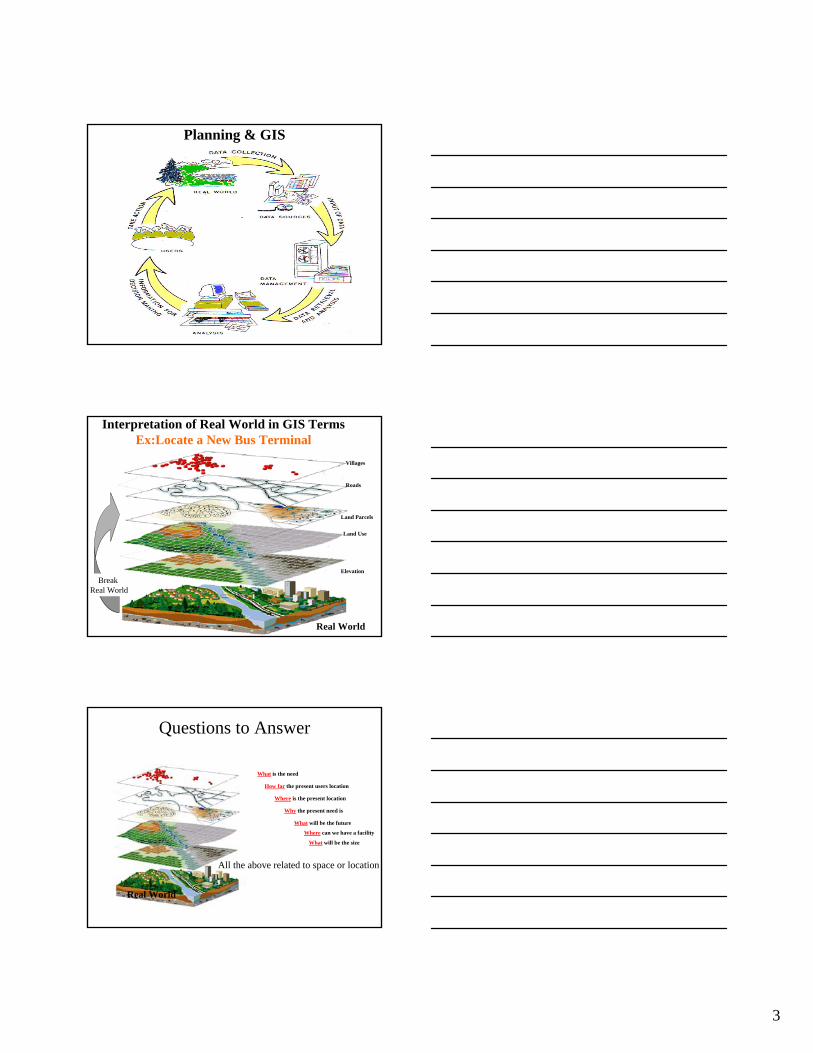
Interpretation of Real World in GIS TermsEx:Locate a New Bus Terminal
Villages
Roads
Land Parcels
Elevation
Real World
Break Real World
Land Use
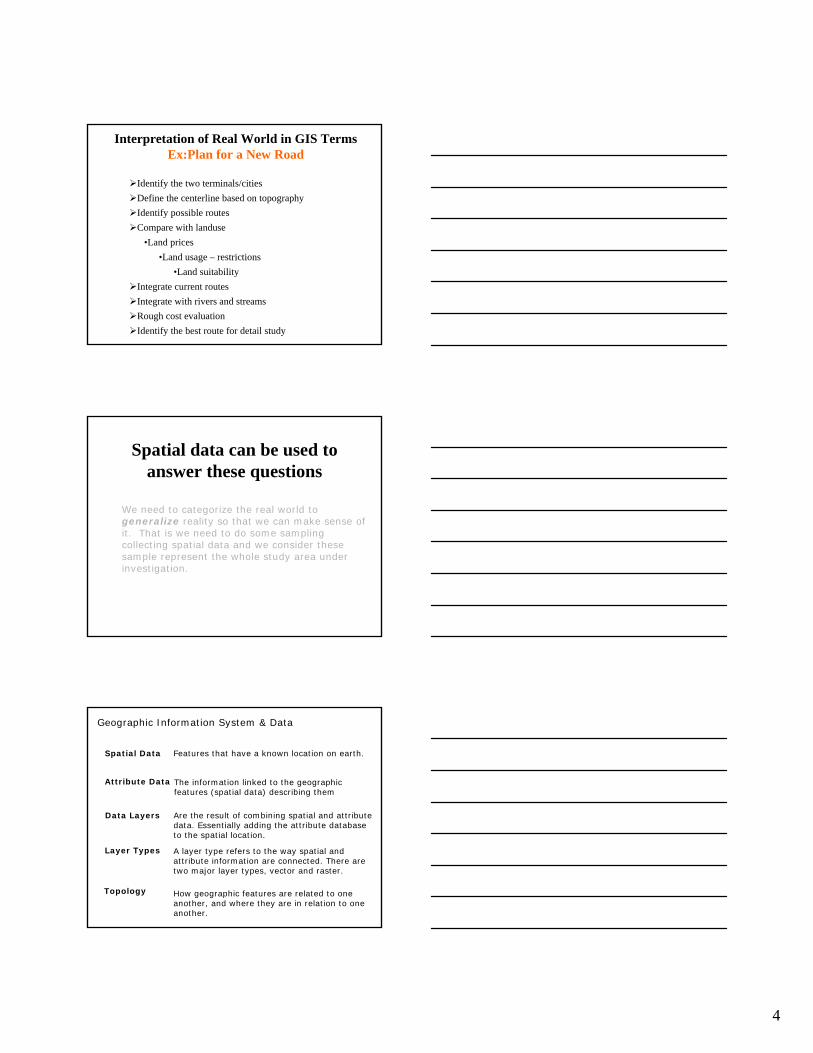
Questions to Answer
What is the need
Real World
How far the present users location
Where is the present location
Why the present need is
What will be the future
Where can we have a facility
All the above related to space or location
What will be the size
4
Identify the two terminals/citiesDefine the centerline based on topographyIdentify possible routesCompare with landuse
•Land prices•Land usage – restrictions
•Land suitabilityIntegrate current routesIntegrate with rivers and streamsRough cost evaluationIdentify the best route for detail study
Interpretation of Real World in GIS TermsEx:Plan for a New Road
Spatial data can be used to answer these questions
We need to categorize the real world to generalize reality so that we can make sense of it. That is we need to do some sampling collecting spatial data and we consider these sample represent the whole study area under investigation.
Topology
Geographic Information System & Data
Spatial Data Features that have a known location on earth.
Attribute Data The information linked to the geographic features (spatial data) describing them
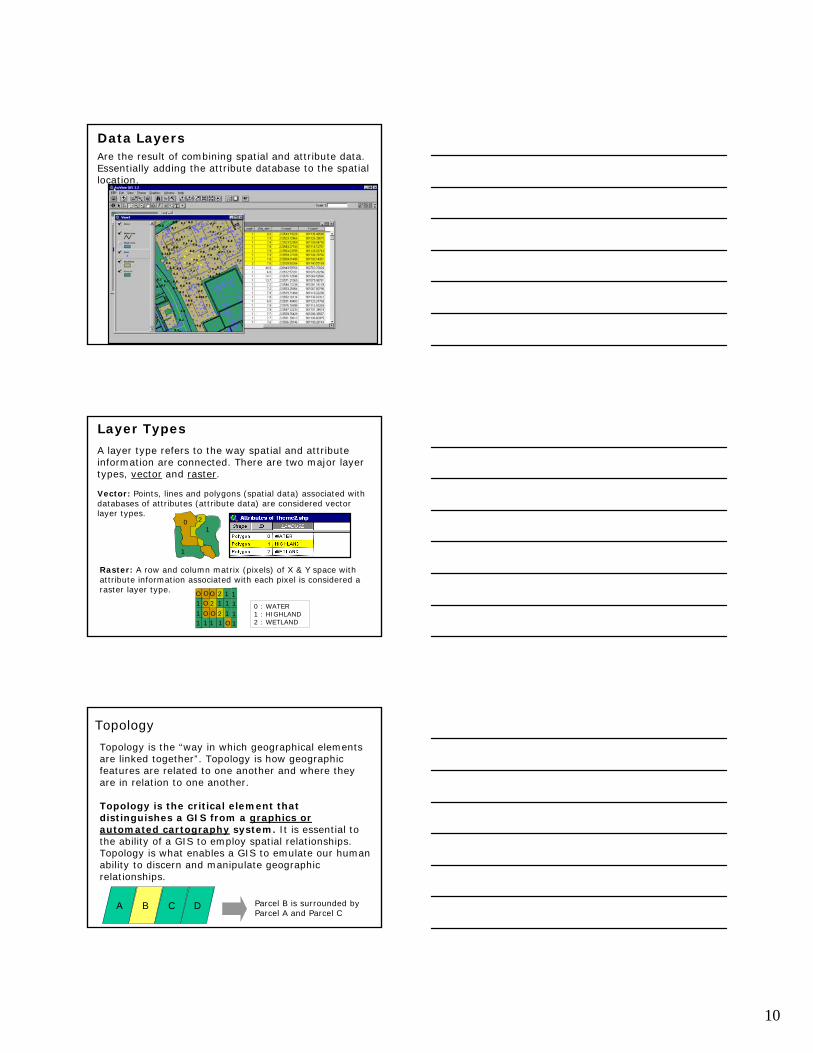
Data Layers Are the result of combining spatial and attribute data. Essentially adding the attribute database to the spatial location.
Layer Types A layer type refers to the way spatial and attribute information are connected. There are two major layer types, vector and raster.
How geographic features are related to one another, and where they are in relation to one another.
5
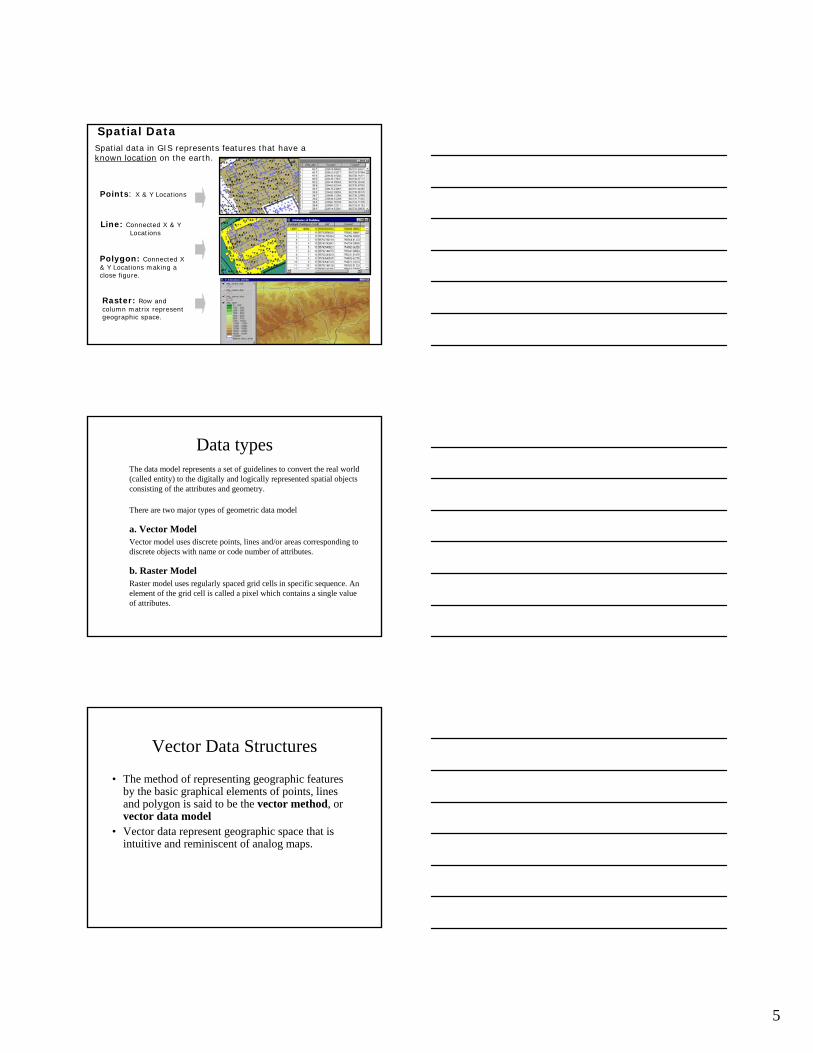
Spatial Data Spatial data in GIS represents features that have a known location on the earth.
Points: X & Y Locations
Polygon: Connected X & Y Locations making a close figure.
Line: Connected X & Y Locations
Raster: Row and column matrix represent geographic space.
Data typesThe data model represents a set of guidelines to convert the real world (called entity) to the digitally and logically represented spatial objects consisting of the attributes and geometry.
There are two major types of geometric data model
a. Vector ModelVector model uses discrete points, lines and/or areas corresponding to discrete objects with name or code number of attributes.
b. Raster ModelRaster model uses regularly spaced grid cells in specific sequence. An element of the grid cell is called a pixel which contains a single value of attributes.
Vector Data Structures
• The method of representing geographic features by the basic graphical elements of points, lines and polygon is said to be the vector method, or vector data model
• Vector data represent geographic space that is intuitive and reminiscent of analog maps.
6
Rasters
• A raster is a tesselation of a surface.• (A tesselation is defined as the process to
cover a surface through the repeated use of a single shape.)
What is a raster data?• a raster based system stores data by using a grid of
cells• a unique reference coordinate represents each
pixel either at a corner or in the middle of the cell• each cell or pixel has discrete attributes assigned
to it • raster data resolution is dependent on the pixel or
grid size and may vary from sub-meter to many kilometers.
• raster data stores different information in layers; elevation, soil type, geology, forest type, rainfall rate, etc.
• generally, raster data requires less processing than vector data, but it consumes more computer storage space.
• remote sensors on satellites store data in raster format
• digital terrain models (DTM) and digital elevation models (DEM)
• continuous data (FIELD) suit a raster structure

7
Rasters
• A raster can use any reasonable geometric shape, as long as it can be connected in such a way as to create a continuous surface.
8
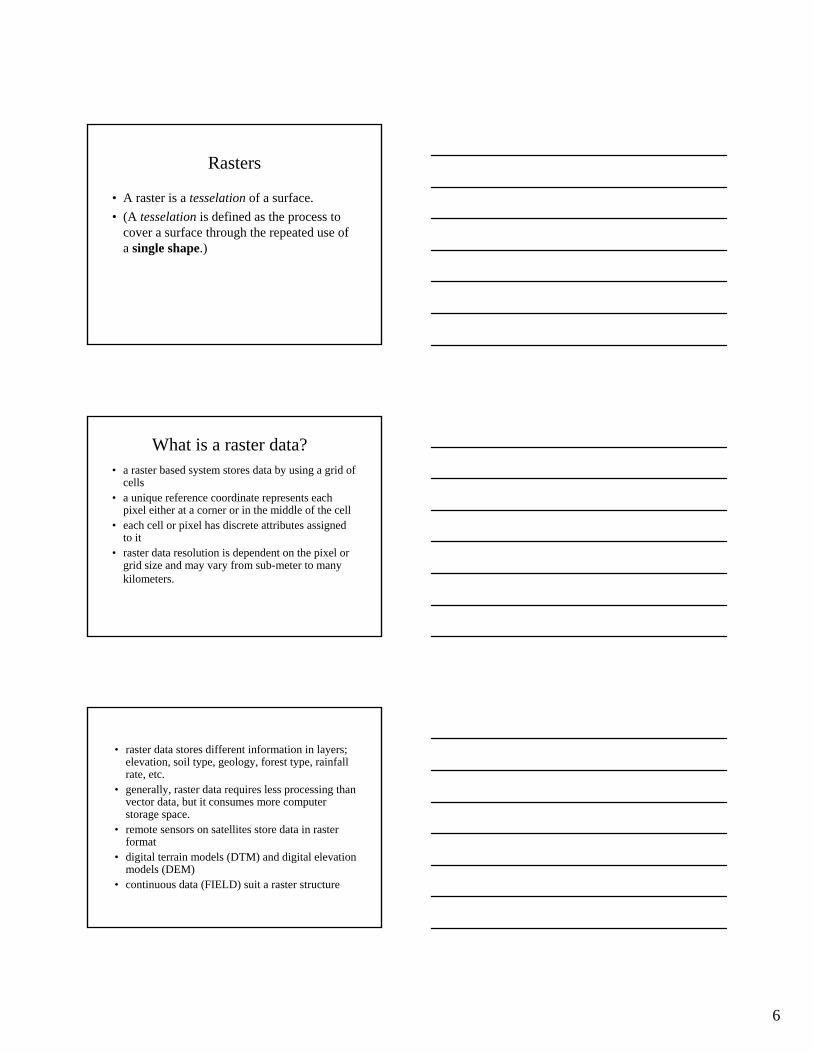
Comparison of Raster and Vector Data ModelsComparison of Raster and Vector Data Models
Raster Model
Advantage:
1. It is a simple data structure.
2. Overlay operations are
easily and efficiently implemented.
3.High spatial variability is efficiently
represented in raster format.
4.The raster format is more or less
required for efficient manipulation
and enhancement of digital images.
Advantage:1. It provides a more compact data structure
than the raster model.
2. It provides efficiently encoding of
topology and as result more efficiently
implementation of operations that require
topological information, such as network
analysis.
3.The vector model is better suited to
supporting graphics that closely approximate
Hand-drawn maps.
Vector Model
9
Comparison of Raster and Vector Data ModelsComparison of Raster and Vector Data Models
Raster Model
Disadvantage:1.It is less compact therefore data
compression techniques can often
overcome this problem.
2.Topological relationships are more
difficult to represent.
3.The output of graphics is less
aesthetically pleasing because
boundaries tend to have a blocky
appearance rather than the smooth
lines of hand-drawn maps.
Disadvantage:
1.It is a more complex data structure.
2.Overlay operations are more difficult to
Implement.
3.The representation of high spatial
variability is inefficient.
4.Manipulation and enhancement of digital
images cannot be effectively done in vector
domain.
Vector Model
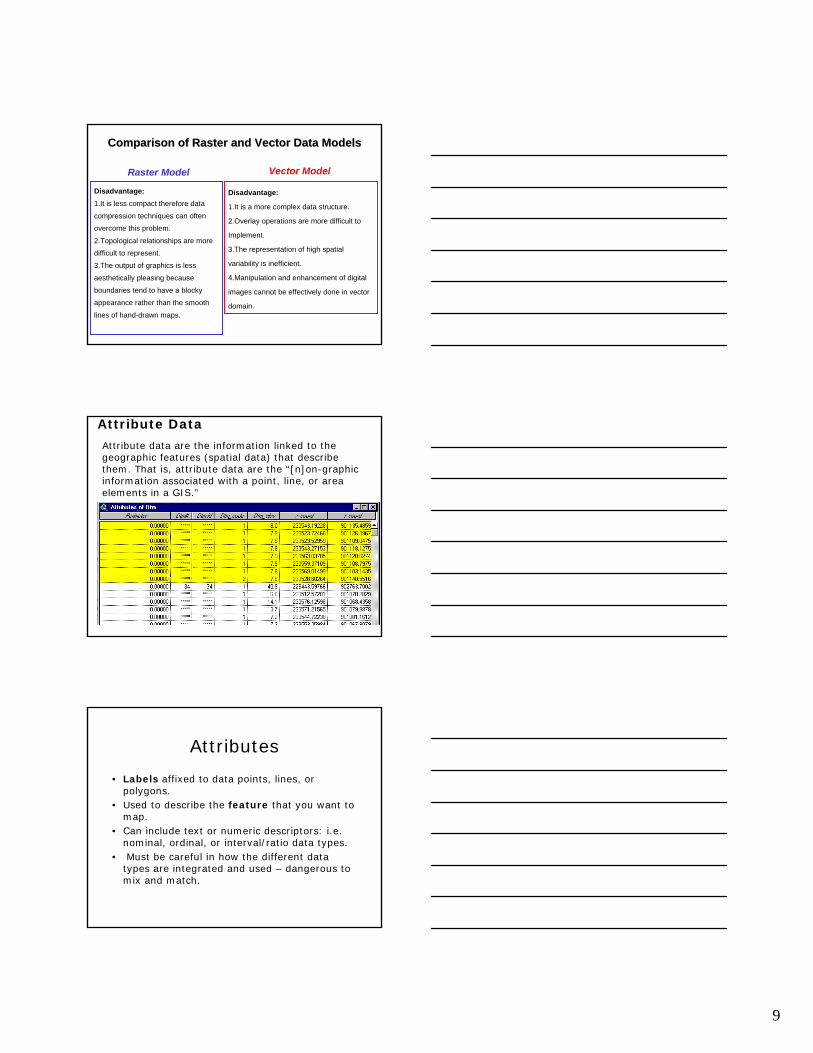
Attribute Data
Attribute data are the information linked to the geographic features (spatial data) that describe them. That is, attribute data are the “[n]on-graphic information associated with a point, line, or area elements in a GIS.”
Attributes
• Labels affixed to data points, lines, or polygons.
• Used to describe the feature that you want to map.
• Can include text or numeric descriptors: i.e. nominal, ordinal, or interval/ratio data types.
• Must be careful in how the different data types are integrated and used – dangerous to mix and match.
10
Data LayersAre the result of combining spatial and attribute data. Essentially adding the attribute database to the spatial location.
Raster: A row and column matrix (pixels) of X & Y space with attribute information associated with each pixel is considered araster layer type.
Layer Types
A layer type refers to the way spatial and attribute information are connected. There are two major layer types, vector and raster.
Vector: Points, lines and polygons (spatial data) associated with databases of attributes (attribute data) are considered vector layer types.
O
2O
O O11 1
O 21
2
11
1O
11
11
O1
11
0 : WATER1 : HIGHLAND 2 : WETLAND
2
O
O
O O11 1
O 21
2
11
1O
11
11
O1
11
01
2
1
Topology
Topology is the “way in which geographical elements are linked together”. Topology is how geographic features are related to one another and where they are in relation to one another.
Topology is the critical element that distinguishes a GIS from a graphics or automated cartography system. It is essential to the ability of a GIS to employ spatial relationships. Topology is what enables a GIS to emulate our human ability to discern and manipulate geographic relationships.
B CA D Parcel B is surrounded byParcel A and Parcel C
11
Data Projection and registration
• Geographic projections and their parameters (datums, geoids etc) are ways to model the earth’s curved surface to a flat plane
• Registration is necessary to “tie” geographic data to specific points on the Earth’s surface to allow accurate mapping and analysis between different GIS layers
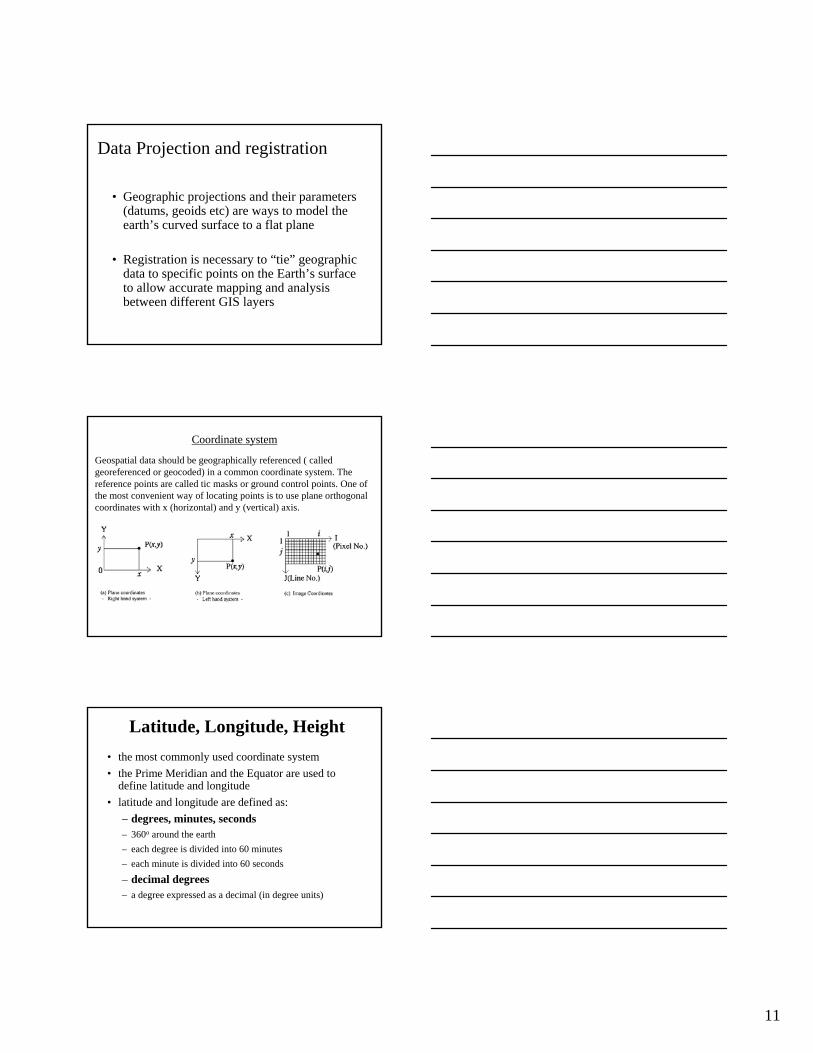
Coordinate system
Geospatial data should be geographically referenced ( calledgeoreferenced or geocoded) in a common coordinate system. The reference points are called tic masks or ground control points. One of the most convenient way of locating points is to use plane orthogonal coordinates with x (horizontal) and y (vertical) axis.
Latitude, Longitude, Height• the most commonly used coordinate system• the Prime Meridian and the Equator are used to
define latitude and longitude• latitude and longitude are defined as:
– degrees, minutes, seconds– 360o around the earth– each degree is divided into 60 minutes – each minute is divided into 60 seconds
– decimal degrees– a degree expressed as a decimal (in degree units)
12
Map Projections • all map projections are attempts to portray
the surface of the earth on a flat surface• distortions of shape, distance, direction,
scale, and area result from this process• some projections minimize certain
distortions while maximising others• other projections are attempts to moderately
distort all of the above properties.
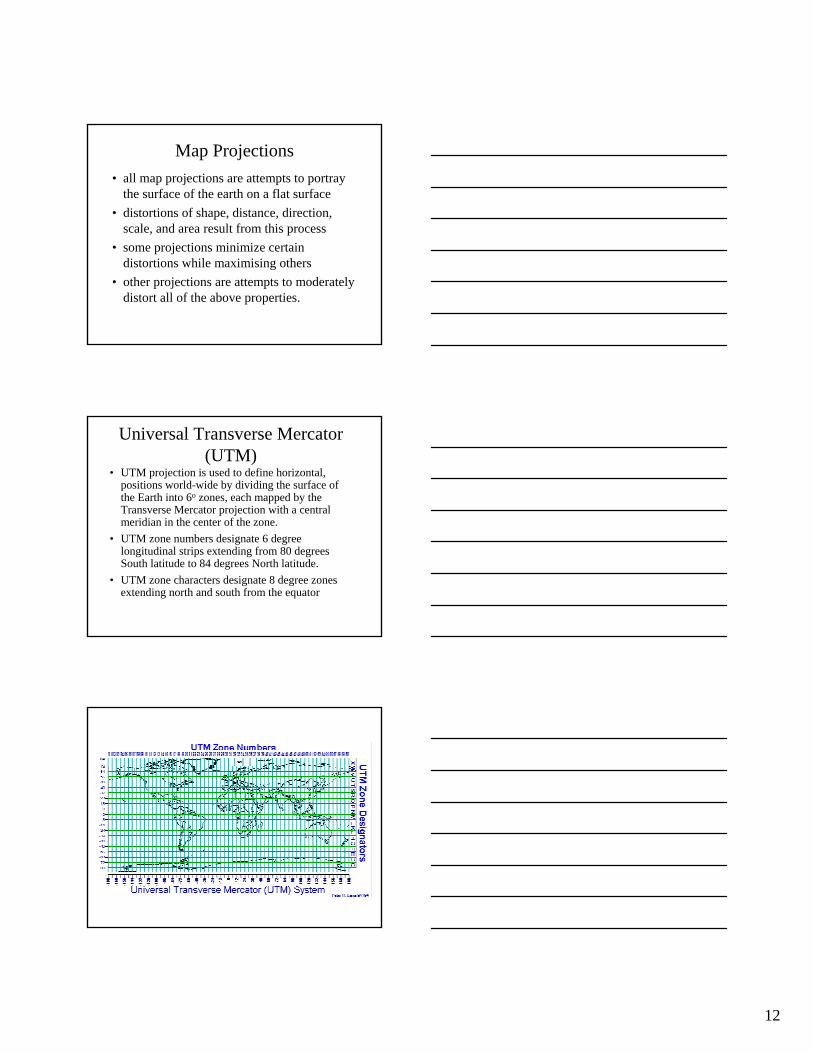
Universal Transverse Mercator(UTM)
• UTM projection is used to define horizontal, positions world-wide by dividing the surface of the Earth into 6o zones, each mapped by the Transverse Mercator projection with a central meridian in the center of the zone.
• UTM zone numbers designate 6 degree longitudinal strips extending from 80 degrees South latitude to 84 degrees North latitude.
• UTM zone characters designate 8 degree zones extending north and south from the equator

13
Data acquisitionAs data acquisition or data input of geospatial data in digital format is most expensive and procedures are time consuming. In GIS, the data sources for data acquisition should be carefully selected considering the application and scale.
The following data sources are widely used:Analog maps
Elevation, soil, landuse, climate, etc. Aerial photographs
DEM, landuse (Urban)Satellite image
Landuse (regional), vegetation, temperature, DEMGround survey with GPS
Detailed informationReports and publications
Attributes, statistics
Data source for GIS
Data Output
Users / Systems
Data
Management
Data Analysis
Users need to understand both data and software in order to create unique spatial questions and maintain the spatial information produced.
Data Input Refers to the creation of digital spatial data.
Refers to unique issues in the maintenance of spatial data such as error or level of accuracy; storing data; retrieving data; and metadata. Data management is one of the key issues determining the usability of spatial data.
Is what allows users to answer questions that may not be explicitly stated in the data.
Refers to the method used to visually display analysis performed using GIS. Output can be in the form of jpg to large plotted images.

14
Data Input
X & Y Coordinate: Used when a user has spatial data in X & Y coordinates.
Digitize: Used when a user has a paper map that they would like to convert into a digital file.
Scan: Used when a user has a paper map that lends itself to reading spatial features in a rasterized format.
The creation of digital spatial data.
Database Entry: Commonly used when a user has attribute information related to common spatial locations, such as the census.
Choice of data acquisition method
Scanning - paper maps
• Paper Map > Digital Raster > Vector• Resolution – accuracy of data c.f. file size• Initial accuracy; scanner integrity

15
Digitising - paper maps• Digitizing Tablet + “Mouse” + PC• Directly captures vector data of interest
from a paper source• Time consuming, tedious work
Vector data input (map digitizing)The digitizing operation is as follows:Step 1 : affix a map to a digitizing tableStep 2 : add control points or tics at four corners and input coordinates Step 3 : digitize map contents according to the map layers Step 4 : edit the errors and clean the data setStep 5 : convert from digitizer coordinate to map coordinate and store in a
spatial database
Direct input• Built from attribute data e.g. GPS points• Use software extensions for add to GIS
database

16
Aerial Photographs
Satellite Data
Data Management
Data Errors /Level ofAccuracy
Storing Data
Retrieving Data
Metadata
Refers to unique issues in the maintenance of spatial data. Data management is one of the key issues determining the usability of spatial data.
• Errors in digitizing• Errors in original data• Errors in data entry• Method of data entry• Scale of data
• Upkeep of historical data sets• Warehousing state and city data
• How can users access stored data
• Using national standards to record and maintain key information about data creation, scale, projection, and attributes.
17
Data Analysis
Is what allows users to answer questions that may not be explicitly stated in the data.
•Retrieval
•Map Generalization
•Map Abstraction
•Map Sheet Manipulations
•Buffer Generation
•Polygon Overlay &Dissolve
•Measurements
•Digital TerrainAnalysis
•Network Analysis
What is spatial analysis?
Spatial analysis is done to answer questions about the real world including the present situation of specific areas and features, the change in situation, the trends, the evaluation of capability or possibility using overlay technique and/or modeling and prediction.Spatial analysis ranges from simple arithmetic and logical operation to complicated model analysis.
- Query- Reclassification- Coverage rebuilding- Overlay
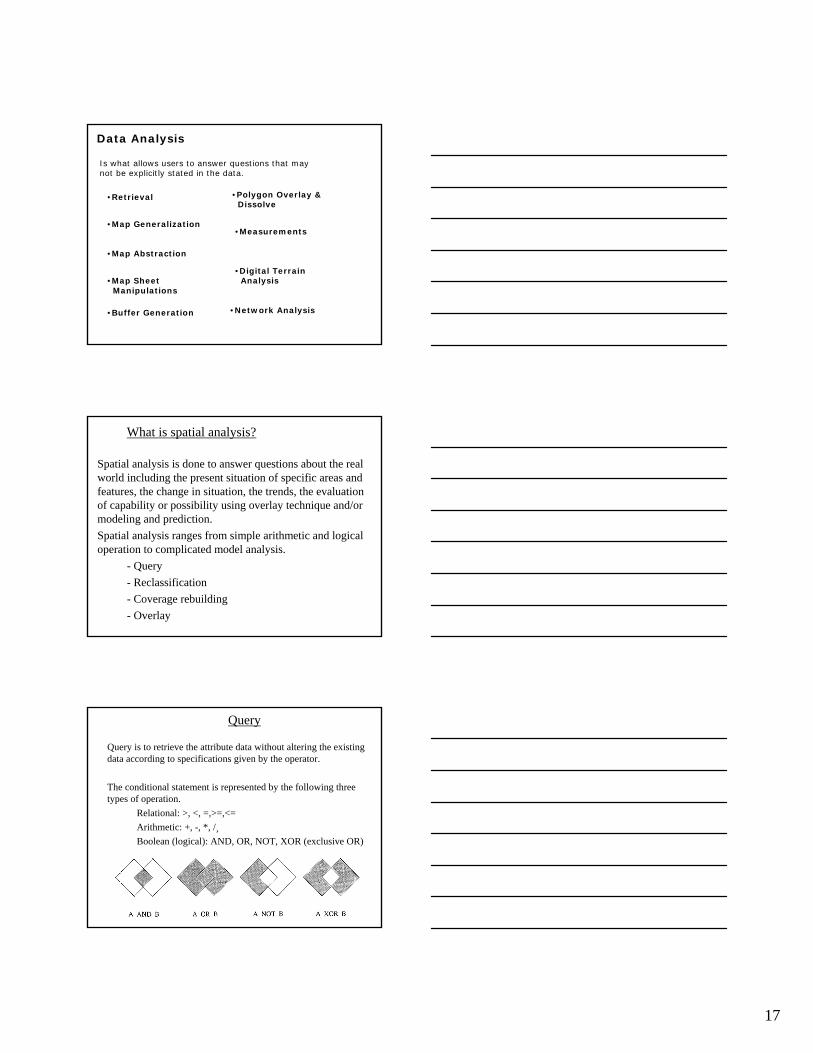
Query
Query is to retrieve the attribute data without altering the existing data according to specifications given by the operator.
The conditional statement is represented by the following three types of operation.
Relational: >, <, =,>=,<=Arithmetic: +, -, *, /¸Boolean (logical): AND, OR, NOT, XOR (exclusive OR)
18
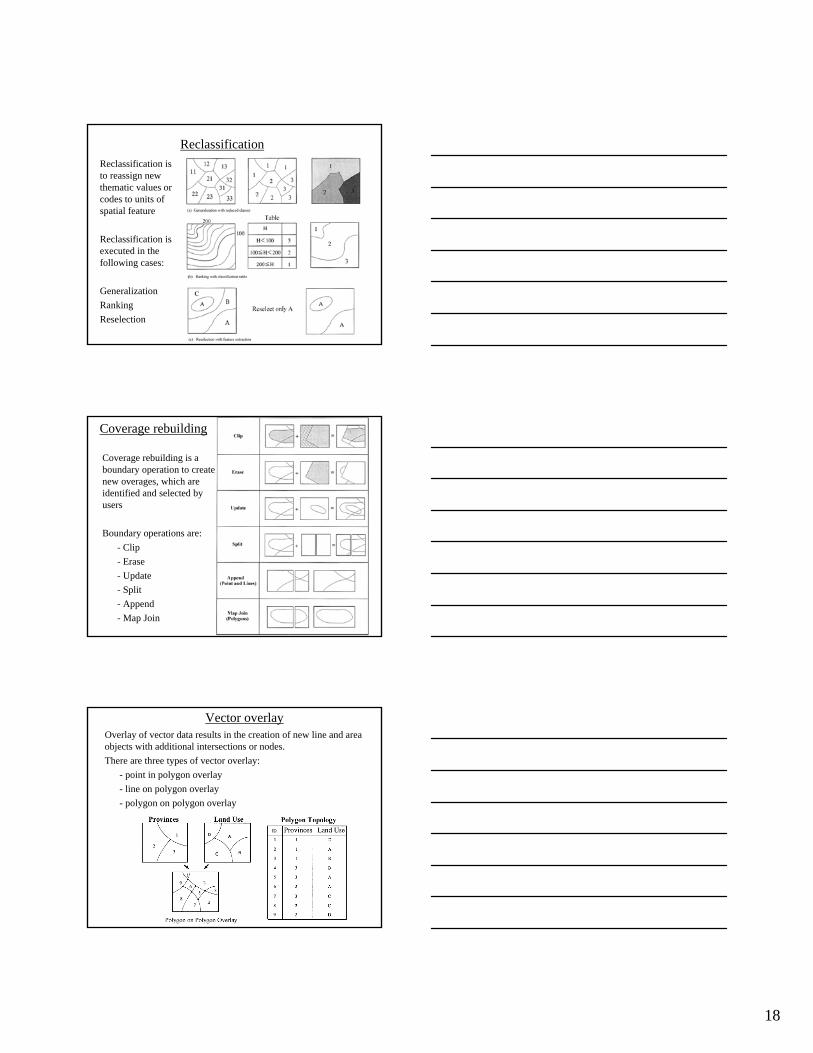
ReclassificationReclassification is to reassign new thematic values or codes to units of spatial feature
Reclassification is executed in the following cases:
GeneralizationRankingReselection
Coverage rebuilding
Coverage rebuilding is a boundary operation to create new overages, which are identified and selected by users
Boundary operations are:- Clip- Erase- Update- Split- Append- Map Join
Vector overlayOverlay of vector data results in the creation of new line and area objects with additional intersections or nodes.There are three types of vector overlay:
- point in polygon overlay- line on polygon overlay- polygon on polygon overlay
19
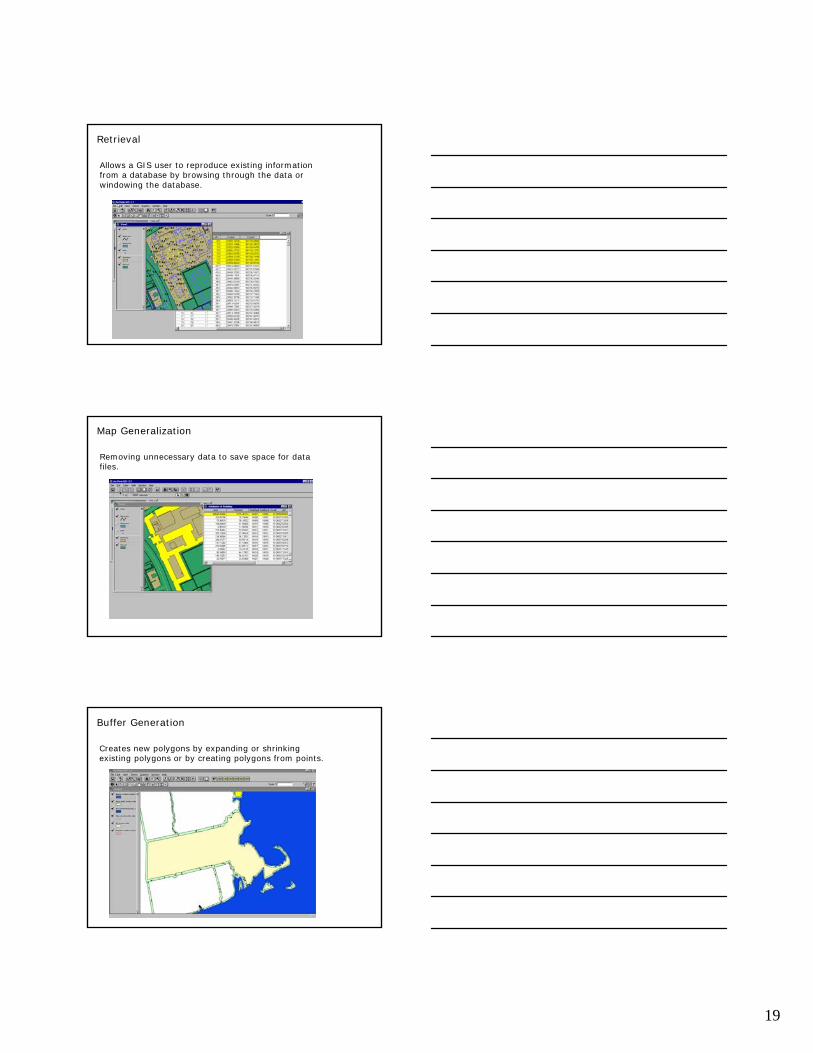
Retrieval
Allows a GIS user to reproduce existing information from a database by browsing through the data or windowing the database.
Map Generalization
Removing unnecessary data to save space for data files.
Buffer Generation
Creates new polygons by expanding or shrinking existing polygons or by creating polygons from points.

20
Polygon Overlay and Dissolve
Used when comparing two or more data layers.
Digital Terrain Analysis
Allows for interpolation from point data (usually elevations), derivation of slopes and slope aspects, watershed computations and identification, and construction of view sheds.
Network Analysis
Are techniques for routing resources along a set of linked linear features. Optimal path routing predicts the best route between two or more points based on distance, time, effort, or another measure. Often used for emergency response systems.
21
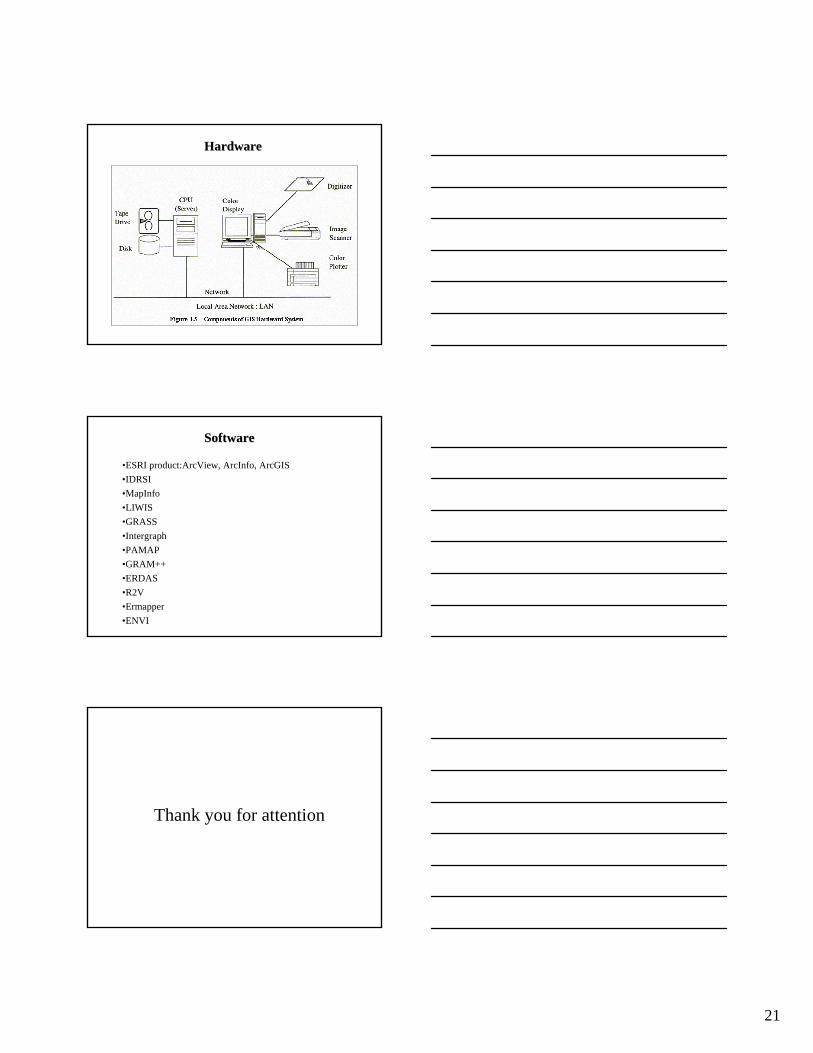
Hardware Hardware
Software Software
•ESRI product:ArcView, ArcInfo, ArcGIS•IDRSI•MapInfo•LIWIS•GRASS•Intergraph•PAMAP•GRAM++•ERDAS•R2V•Ermapper•ENVI
Thank you for attention