introduction to chapter 6 exercises exercise 6.1 gap · pdf filein these exercises, the most...
TRANSCRIPT

In these exercises, the most critical part of the marketing planning process will be tackled.
Exercise 6.1 is concerned with carrying out a gap analysis.
Exercise 6.2 is concerned with collecting relevant data about your company and sub-
jecting this to a hard-hitting examination, in summary form, of the opportunities and threats
facing your organization.
Exercise 6.3 is concerned with competitor analysis, which clearly is an important part of
a marketing audit.
Exercise 6.4 is concerned with carrying out a SWOT analysis.
Exercise 6.5 looks at the assumptions that are made before setting marketing objec-
tives. Clearly, such assumptions should be kept to a minimum, but it is useful to be under
no misapprehension regarding what they are, and, just as importantly, the risks attached to
making such assumptions.
Exercise 6.6 gets to the heart of the matter and is concerned with setting marketing
objectives, while Exercise 6.7 addresses the issue of selecting the most appropriate market-
ing strategies to match the chosen objectives.
Introduction to Chapter 6 exercisesExercise 6.1 Gap analysisRevenueYou are asked to complete this two-part exercise. The fi rst part is concerned with revenue,
the second with profi t.
Objective
Start by plotting the sales position you wish to achieve at the end of the planning period,
point E (Figure 6.18). Next plot the forecast position, point A.
Rev/
vol
E (objective)
D (new products/markets)
C (market penetration)
B (productivity)
A (forecast)
Budget
t0 t�1 t�2 t�3
Figure 6.18: Gap analysis.(Continued)

Productivity
Are there any actions you can take to close the gaps under the headings in Table 6.2, point B?
(These represent cash and margin focus.)
Ansoff product/market (market penetration)
List principal products on the horizontal axis (in Figure 6.19) and principal markets on
the vertical axis. In each smaller square write in current sales and achievable sales during the
planning period.
Prod
uct 1
Prod
uct 2
Prod
uct 3
etc.
Market 1
Market 2
Market 3
etc.
Figure 6.19: Ansoff matrix.
Productivity (NB: not all factors are mutually exclusive) Revenue
Better product mix (1)
Better customer mix (2)
More sales calls (3)
Better sales calls (4)
Increase price
Reduce discounts
Charge for deliveries
Total
Table 6.2: Productivity factors (1).

Next, plot the market penetration position, point C (Figure 6.20). This point will be the
addition of all the values in the right hand half of the small boxes in the Ansoff Matrix. Please
note, revenue from (1), (2), (3) and (4) from the productivity box should be deducted from the
market penetration total before plotting point C.
Ansoff product/market matrix (new products/new markets)
Next, list the value of any new products you might develop which you might sell to exist-
ing markets (Figure 6.20). Alternatively, or as well, if necessary, list the value of any existing
products that you might sell to new markets. Plot the total value of these on Figure 6.18,
point D.
Diversifi cation
List the value of any new products you might develop for new markets until point E is reached.
(Steps 3, 4 and 5 represent a sales growth focus.)
Capital utilization
If none of this gives the required return on investment consider changing the asset base.
This could be:
(A) Acquisition
(B) Joint venture.
(Continued)
Prod
uct 1
Prod
uct 2
Prod
uct 3
etc.
Prod
uct 1
0
Prod
uct 1
1
Prod
uct 1
2
etc.
Market 1
Market 2
Market 3
etc.
Market 10
Market 11
Market 12
etc.
Figure 6.20: Ansoff matrix.
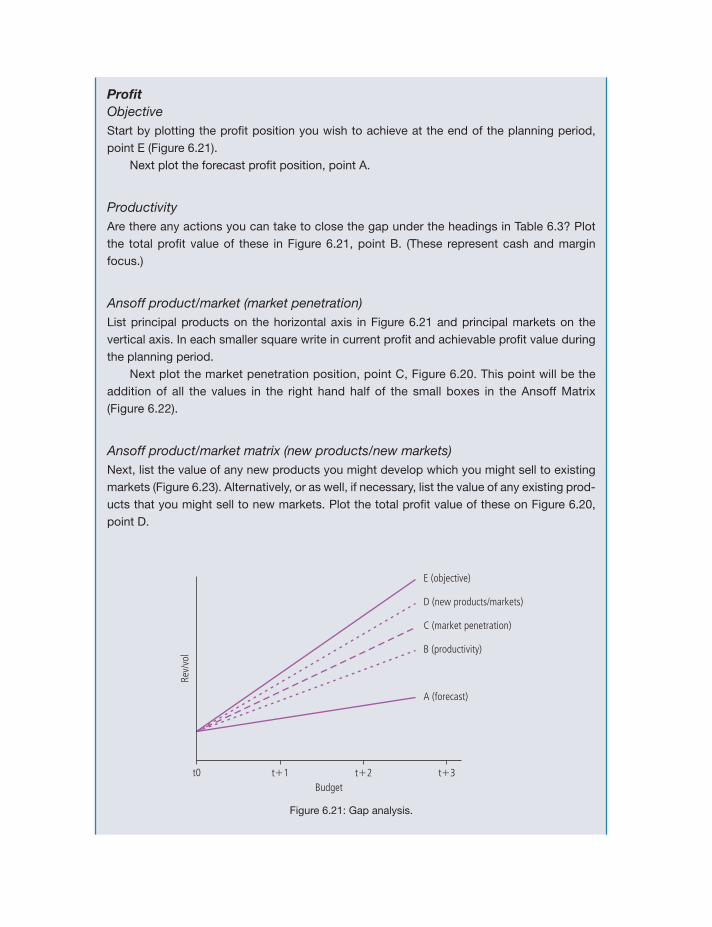
Profi tObjective
Start by plotting the profi t position you wish to achieve at the end of the planning period,
point E (Figure 6.21).
Next plot the forecast profi t position, point A.
Productivity
Are there any actions you can take to close the gap under the headings in Table 6.3? Plot
the total profi t value of these in Figure 6.21, point B. (These represent cash and margin
focus.)
Ansoff product/market (market penetration)
List principal products on the horizontal axis in Figure 6.21 and principal markets on the
vertical axis. In each smaller square write in current profi t and achievable profi t value during
the planning period.
Next plot the market penetration position, point C, Figure 6.20. This point will be the
addition of all the values in the right hand half of the small boxes in the Ansoff Matrix
(Figure 6.22).
Ansoff product/market matrix (new products/new markets)
Next, list the value of any new products you might develop which you might sell to existing
markets (Figure 6.23). Alternatively, or as well, if necessary, list the value of any existing prod-
ucts that you might sell to new markets. Plot the total profi t value of these on Figure 6.20,
point D.
Rev/
vol
E (objective)
D (new products/markets)
C (market penetration)
B (productivity)
A (forecast)
Budgett0 t�1 t�2 t�3
Figure 6.21: Gap analysis.
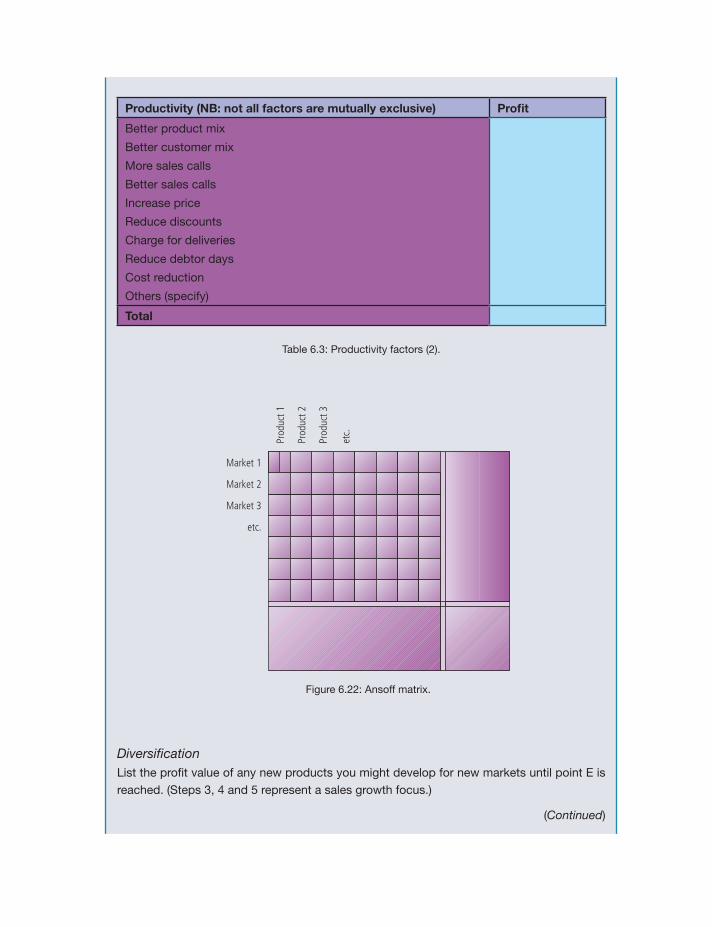
Diversifi cation
List the profi t value of any new products you might develop for new markets until point E is
reached. (Steps 3, 4 and 5 represent a sales growth focus.)
(Continued)
Productivity (NB: not all factors are mutually exclusive) Profi t
Better product mix
Better customer mix
More sales calls
Better sales calls
Increase price
Reduce discounts
Charge for deliveries
Reduce debtor days
Cost reduction
Others (specify)
Total
Table 6.3: Productivity factors (2).
Prod
uct 1
Prod
uct 2
Prod
uct 3
etc.
Market 1
Market 2
Market 3
etc.
Figure 6.22: Ansoff matrix.

Capital utilization
If none of this gives the required return on investment, consider changing the asset base.
This could be:
(A) Acquisition
(B) Joint venture.
Exercise 6.2 The marketing auditStage 1 Collecting the dataAll the earlier exercises in this book have been designed to improve your understanding
of aspects of marketing planning and to discover information about your company and/or
its key products and markets. If you completed all the preceding exercises, you should
by now be in possession of a fairly comprehensive marketing audit of your organization.
However, since every business is in some ways unique, there is a chance that an important
piece of information might have been missed. The marketing audit checklist which follows
is provided as a safeguard against this happening. (For convenience this is repeated from
Chapter 2.)
Use this list to decide if there is any additional information you would want to add to that
you have already collected. When you have completed assembling as much information as
you can, you are in a position to progress to Stage 2 of this exercise.
Prod
uct 1
Prod
uct 2
Prod
uct 3
Prod
uct 1
0
Prod
uct 1
1
Prod
uct 1
2
etc.
etc.
Market 1
Market 2
Market 3
etc.
Market 10
Market 11
Market 12
etc.
Figure 6.23: Ansoff matrix.

The marketing audit checklistThe following is a list of factors that can affect some businesses. You should only be inter-
ested in those that will affect your particular business.
This list doesn’t claim to be exhaustive but it is intended to provide fair coverage of most
areas thereby acting as a guide and stimulus.
External auditBusiness and economic environment
Economic
Political/fi scal/legal
Social/cultural
Technological
Intra-company
The market
Total market, size, growth and trends
(value/volume)
Market characteristics, developments and
trends
Products
Prices
Physical distribution
Channels
Customers/consumers
Communication
Industry practices
Competition
Major competitors
Size
Market shares/coverage
Market standing/reputation
Production capabilities
Distribution policies
Marketing methods
Extent of diversifi cation
Personnel issues
International links
Profi tability
Key strengths and weaknesses
Internal auditMarketing operational variables
Own company
Sales (total, by geographical location, by industrial
type, by customer, by product)
Market shares
Profi t margins/costs
Marketing procedures
Marketing organization
Marketing information/research
Marketing mix variables as follows:
Product management
Price
Distribution
Promotion
(Continued)

The marketing audit checklist (fuller details)
EXTERNAL (opportunities and threats)Business and economic environment
Economic Infl ation, unemployment, energy, price, volatility,
materials availability, etc.
as they affect
your business
Political/fi scal/
legal
Nationalization, union legislation, human rights
legislation, taxation, duty increases, regulatory
constraints (e.g. labelling, product quality, packaging,
trade practices, advertising, pricing, etc.)
as they affect
your business
Social/cultural Education, immigration, emigration, religion,
environment, population distribution and dynamics
(e.g. age distribution, regional distribution, etc.),
changes in consumer lifestyle, etc.
as they affect
your business
Technological Aspects of product and/or production technology
which could profoundly affect the economics of the
industry (e.g. new technology, the internet, cost savings,
materials, components, equipment, machinery,
methods and systems, availability of substitutes, etc.)
as they affect
your business
Intra-company Capital investment, closures, strikes, etc. as they affect
your business
The market
Total market Size, growth, and trends (value, volume).
Customers/consumers: changing demographics, psychographics and
purchasing behaviour.
Marketing
characteristics,
developments
and trends
Products: principal products bought; end-use of products; product
characteristics (weights, measures, sizes, physical characteristics,
packaging, accessories, associated products, etc.).
Prices: price levels and range; terms and conditions of sale; normal
trade practices; offi cial regulations; etc.
Physical distribution: principal method of physical distribution
Channels: principal channels; purchasing patterns (e.g. types of prod-
uct bought, prices paid, etc.); purchasing ability; geographical location;
stocks; turnover; profi ts; needs; tastes; attitudes; decision makers,
bases of purchasing decision; etc.
Communication: principal methods of communication, e.g. the inter-
net, sales force, advertising, direct response, exhibitions, public rela-
tions, etc. Industry practices: e.g. trade associations, government
bodies, historical attitudes, interfi rm comparisons, etc. Industry prac-
tices: e.g. trade associations, government bodies, historical attitudes,
interfi rm comparisons, etc.

Competition Industry structure: make-up of companies in the industry, major market
standing/reputation; extent of excess capacity; production capability;
distribution capability; marketing methods; competitive arrangements;
extent of diversifi cation into other areas by major companies in the
industry; new entrants; mergers; acquisitions; bankruptcies; signifi cant
aspects; international links; key strengths and weaknesses.
Industry profi tability: fi nancial and non-fi nancial barriers to entry; industry
profi tability and the relative performance of individual companies; structure
of operating costs; investment; effect on return on investment of changes
in price; volume; cost of investment; source of industry profi ts; etc.
INTERNAL (strengths and weaknesses)Own companySales (total, by geographical location, by industrial type, by customer, by product)
Market shares
Profi t margins
Marketing procedures
Marketing organization
Sales/marketing control data
Marketing mix variables as follows: Market research
Product development
Product range
Product quality
Unit of sale
Stock levels
Distribution
Dealer support
Pricing, discounts, credit
Packaging
Samples
Exhibitions
Selling
Sales aids
Point of sale
Advertising
Sales promotion
Public relations
After-sales service
Training
Operations and resourcesMarketing objectives
Are the marketing objectives clearly stated and consistent with marketing and corporate
objectives?
Marketing strategy
What is the strategy for achieving the stated objectives? Are suffi cient resources available
to achieve these objectives? Are the available resources suffi cient and optimally allocated
across elements of the marketing mix?
Structure
Are the marketing responsibilities and authorities clearly structured along functional, product,
end-user, and territorial lines?
(Continued)

Information system
Is the marketing intelligence system producing accurate, suffi cient and timely information
about developments in the marketplace? Is information gathered being used effectively in
making marketing decisions?
Planning system
Is the marketing planning system well conceived and effective?
Control system
Do control mechanisms and procedures exist within the group to ensure planned objectives
are achieved, e.g. meeting overall objectives, etc.?
Functional effi ciency
Are internal communications within the group effective?
Interfunctional effi ciency
Are there any problems between marketing and other corporate functions? Is the question of
centralized versus decentralized marketing an issue in the company?
Profi tability analysis
Is the profi tability performance monitored by product, served markets, etc. to assess where
the best profi ts and biggest costs of the operation are located?
Cost-effectiveness analysis
Do any current marketing activities seem to have excess costs? Are these valid or could they
be reduced?
Stage 2 SWOT analyses
From the above list you will see that the external factors are the sources of all opportunities
or threats, whereas the internal factors refl ect the company’s strengths or weaknesses.
In respect of external factors (opportunities and threats), try the following exercise:
Step 1 List the principal opportunities (we suggest no more than 20).
Step 2 Allocate a code to each of these (e.g. A, B, C, etc.)
Step 3 Allocate a number between 1 and 9 to each of them. The number 1 means
that in your view there is little chance of a particular opportunity occurring
within the planning timescale (say three years). A 9 would mean that there is
a high probability of it occurring within the planning timescale.
Step 4 Allocate a number between 1 and 9 to indicate the importance of the impact
each of these opportunities would have on the organization, were it to occur.
Step 5 Now put each of your opportunities on the opportunities matrix (Figure 6.24).

Step 6 You will now have a number of points of intersection which should corre-
spond to your coding system.
Step 7 All those in the top left box should be tackled in your marketing objectives
and should appear in your SWOT analysis (Exercise 6.4). All the others, while
they should not be ignored, are obviously less urgent. The whole exercise
should now be repeated for threats, using the matrix in Figure 6.25.
(Continued)
Impact on organization
5 19
19
Prob
abili
ty o
f occ
urre
nce
5
Figure 6.24: Opportunities matrix.
Impact on organization
5 19
19
Prob
abili
ty o
f occ
urre
nce
5
Figure 6.25: Threats matrix.

Exercise 6.3 Competitor analysisExercise 6.3 is concerned with summarizing the information gathered about your opportuni-
ties and threats in your marketing audit in a more usable format, in the SWOT analysis.
Before moving on to the SWOT analysis (Exercise 6.4), complete the competitor analysis
table (Table 6.4) in order to help you to rate yourself more accurately against your competitors.
Guidelines for completing Table 6.4 are given below.
Guide to competitive position classifi cationsLeadership Has major infl uence on performance or behaviour of others.
Strong Has a wide choice of strategies.
Able to adopt independent strategy without endangering short-term
position. Has low vulnerability to competitors’ actions.
Favourable Exploits specifi c competitive strength, often in a product/market niche.
Has more than average opportunity to improve position; several strate-
gies available.
Tenable Performance justifi es continuation in business.
Weak Currently unsatisfactory performance; signifi cant competitive weakness.
Inherently a short-term condition; must improve or withdraw.
The following list includes fi ve business directions that are appropriate for almost any
business. Select those that best summarize the competitor’s strategy.
Business directions 1. Enter – allocate resources to a new business area. Consideration should include building
from prevailing company or unit strengths, exploiting related opportunities and defend-
ing against perceived threats. It may mean creating a new industry.
2. Improve – to apply strategies that will signifi cantly improve the competitive position of
the business. Often requires thoughtful product/market segmentation.
3. Maintain – to maintain one’s competitive position. Aggressive strategies may be required,
although a defensive posture may also be assumed. Product/market position is main-
tained, often in a niche.
Main
competitor
Products/
markets
Business direction
and current
objectives and
strategies Strengths Weaknesses
Competitive
position
Table 6.4: Competitor analysis

4. Harvest – to relinquish intentionally competitive position, emphasizing short-term profi t
and cash fl ow but not necessarily at the risk of losing the business in the short term.
Often entails consolidating or reducing various aspects of the business to create higher
performance for that which remains.
5. Exit – to divest oneself of a business because of its weak competitive position or because
the cost of staying in it is prohibitive, and the risk associated with improving its position
is too high.
Exercise 6.4 The SWOT analysisHaving completed the marketing audit, your task now is to summarize it into a cogent and
interesting analysis of your company’s particular situation in each major segment. The SWOT
approach (the word SWOT incidentally being derived from the initial letters of Strengths,
Weaknesses, Opportunities and Threats) will enable you to list in simple terms:
1. Your company’s differential strengths and weaknesses vis-à-vis competitors.
2. Where the best opportunities exist, i.e. market segments.
3. The present and future threats to your business in the market segments.
The SWOT analysis for each segment should only be a few pages in length and should
concern itself with key factors only, supported by relevant data.
Some of the most valuable information for the SWOT analysis will come from the life-
cycle analysis and the portfolio matrix you prepared in Chapter 5. The former will give you
insights about the prospects for your key products and/or services and this information can
then be used on the portfolio matrix, thereby highlighting how the portfolio will change. An
example of this is shown in Figure 6.26.
(Continued)
Key: Current position Forecast position
The size of each circle is proportionate to the contribution of eachproduct or service to the company’s total sales turnover
High
High
Low
Low
SUSTAIN
INVEST
CASH
OPPORTUNISTIC
Our competitive (business) strengths
C
D
E
A
B
G
F
Divest
Divest
Mar
ket a
ttrac
tiven
ess
Figure 6.26: DPM example.

In Figure 6.26, clearly the future portfolio is going to be signifi cantly different from the
current one. Products/segments B and G will disappear. The sales volume of A, C and D will
increase, while that of E will reduce quite dramatically. All this has a tremendous bearing on
how funds are generated, and, again, this is where the portfolio matrix can be helpful in letting
one understand what is happening. If you recall, the text explained that different quadrants
of the matrix had different characteristics when viewed as sources of funds (Figure 6.27).
Although this comes from the Boston Matrix, it is just as relevant to the directional policy
matrix shown in Figure 6.26.
The signifi cance of this for any company is to have a balanced portfolio, where there are
adequate ‘sustains’ to fund research and development and selected ‘opportunistics’.
The effort and costs associated with keeping the market share for ‘invests’ makes them
unreliable sources of funds. The benefi ts will be reaped later when today’s ‘invests’ sink into
the ‘sustain’ quadrant.
You can now proceed to complete the pro forma provided in respect of all your key mar-
ket segments. Thus, if you have six key market segments, you will complete six pro formas.
In this book, we have provided you with one. If you need more, just repeat the exercise using
duplicate forms. See Figure 6.28.
A more detailed approach to completing the pro forma in Figure 6.28 now follows and
we recommend that you read this next section most carefully.
Exercise 6.5 AssumptionsAny SWOT analysis should not look like the one given in Figure 6.29.
The problem with these is that they are far too generalized and tend to be conducted on
what we describe here as ‘the average customer/consumer’ and, of course, we now under-
stand from the segmentation section in Chapter 4 that there is no such ‘person’. The result
of SWOTs like this is that they end up with vapid, meaningless words and the authors have
Figure 6.27: DPM guidelines.
High
High
Low
Low
INVEST
SUSTAIN
OPPORTUNISTIC
CASH
Cash generatedCash used
Net
Cash generatedCash used
� � �
� �
�
� � �
�
� � �
�
� �
� � �
�
�
� � �
� � �
Net
Cash generatedCash used
Net Net
Cash generatedCash used
0
Cash generatedCash used
0Net
Mar
ket a
ttrac
tiven
ess
Our competitive position
RESEARCH & DEV.

seen hundreds of such analyses over the years. They represent a kind of ‘My head is in the
oven and my feet are in the fridge, so we must be comfortable on average’ sentiment. So,
please avoid this at all costs and concentrate on the methodology spelled out below.
At a general level, however, there are some guidelines, which are set out in Figure 6.30.
Conducting meaningful, useful SWOTs, however, is still a diffi cult managerial exercise.
For example, on the pro forma provided in Figure 6.28, it will be seen that in Column 2 there
are only fi ve spaces. The problem here, however, is a tendency to write in words for critical
(Continued)
111111111
222222222222222222
3333333333333333333
44444444444444444444444
555555555555555555
1Here, describe the market forwhich the SWOT is being done
SBU description
4Score yourself and each of your main competitors out of 10 on each of the CSFs.Then multiply the score by theweight
Strengths/weaknesses analysis
2What are the few key things, from the customer’spoint of view, that any competitor has to do righ
y gy gt
to succeed?p
Critical success factors 3How important iseach of these CSFs?
pp
Score out of 100
Weighting
TTTTToooootttaaaall
CCCCCCooooommmmmmmppppCCCCCCSSSSSFFFFF YYYYYYoooooouuuu CCCCCCoooommmmmmmpppppeeeetttiittttoooooorrr AAAAAAA CCCCCooooommmmmmmpppppeeeettttiittttooooorrr BBBBB CCCCCCooooommmmmmmmpppppeeeetttiittttoooooorrr CCCCCC CCCCCooooommmmmmpppppeeeetttittttoooooorrr DDDD
111
22222
33333
44444
55555
TTTTTooooottttaaaaal((((sssscccooooorrrreeee xxxxxx wwwwwwwweeeeiiggggghhhhtttt)))
5What are the few key things outside your direct control that have had,and will continue to have, an impact on your business?
y g yy g yOpportunities/threats
7 Key assumptions for theplanning period
Final consequences
8 Key objectives 9 Key strategies
6 Key issues that needto be addressed
11111111111
2222222222222222222
3333333333333333333
4444444444444444444444
555555555555555555
11111111111
2222222222222222222
3333333333333333333
4444444444444444444444
555555555555555555
6666666666666666666666
7777777777777777777
111000000000
OOOOpppppppoooorrttuuuunnniitttiieee ssss TThThThrThrehreareateateatattssss
Figure 6.28: Strategic planning exercise (SWOT analysis).
Note: This form should be completed for each product/market segment
under consideration.

success factors (CSFs), such as ‘product’, ‘price’, ‘promotion’ and ‘service’, all of which are
meaningless unless accompanied by more detailed explanation.
The following case will explain a methodology for making the summary headings in
Column 2 of Figure 6.28 more meaningful.
Figure 6.31 shows fi ve key buying principles for parents who are considering which private
school to send their children to. More importantly, however, Figures 6.32 to 6.35 show the details
behind each of these headings. In this example, it is in order to put in Column 2 of Figure 6.28
‘Affordability’, for example, but behind this summary heading, a more detailed analysis will have
been completed, otherwise ‘Affordability’ becomes just another vapid, meaningless word.
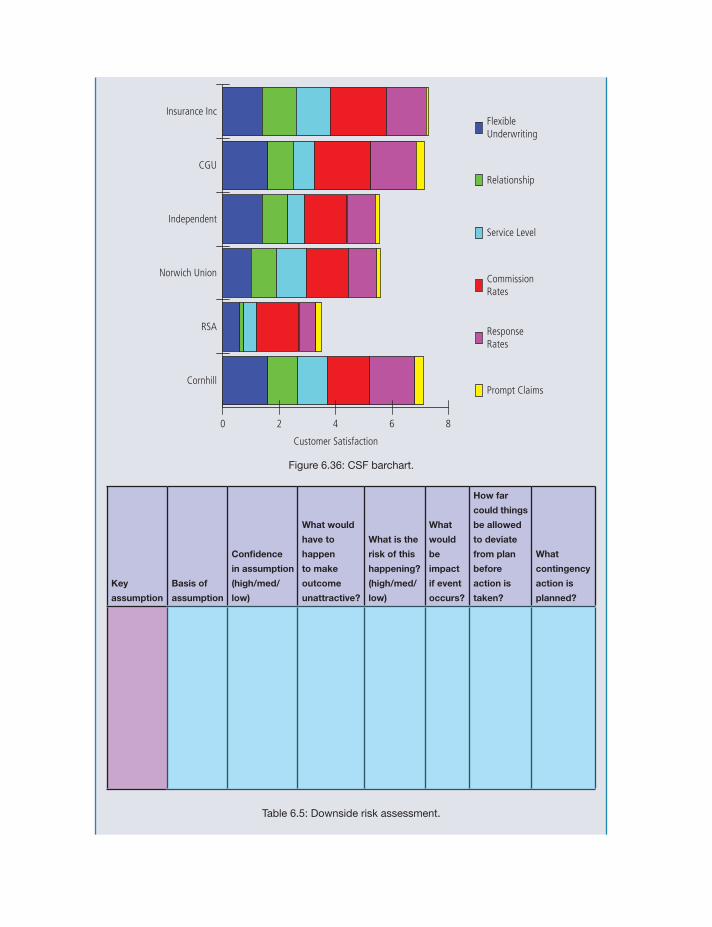
Finally, for presentation purposes in the actual marketing plan, it is often useful to present
the strengths/weaknesses data as a bar chart, as shown in Figure 6.36.
Often it is forgotten that in conducting the SWOT analysis we have had to make assump-
tions, or educated guesses, about some of the factors that will affect the business, e.g. about
market-growth rates, about government economic policy, about the activities of our com-
petitors, etc. Most planning assumptions tend to deal with the environment or market trends
and as such are critical to the fulfi lment of the planned marketing objectives and strategies.
STRENGTHS WEAKNESSES
OPPORTUNITIES THREATS
WRONG
Figure 6.29: A meaningless SWOT analysis.
StrengthsIt can create value for theorganisation/customerIt is uniqueIt is inimitableIt is lasting
OpportunitiesIt is largeIt is accessibleIt is lasting
WeaknessesIt is meaningful to the customerIt is uniqueIt is difficult to fix
ThreatsIt is significantIt is lasting
Figure 6.30: Guidelines for a meaningful SWOT analysis.
The lessons to be learned from the above example are crucial to conducting a truly
powerful SWOT on each important product/market segment.

Not
e: A
dmis
sion
s Po
licy
& C
atch
men
t: q
ualif
ying
fact
ors
Cost
s
Conv
enie
nce
Aca
dem
icEn
hanc
emen
t
Scho
ol:F
amily
Rela
tion
ship
Fees
Staf
f im
age/
qual
ifica
tion
s
Exam
res
ults
,le
ague
tab
le p
osit
ion Cl
assr
oom
faci
litie
s(in
cl IC
T)
Clas
s si
ze
Cour
sesu
bjec
ts/
opti
ons
Faci
litie
s
Scho
olbu
ildin
gs
Hist
ory
Gro
unds
/land
scap
e
Fron
t of h
ouse
Spor
ts r
eput
atio
n
Resu
ltsSp
orts
facil
ities
Art
/Mus
icre
puta
tion
Resu
lts
Art/M
usic
facil
ities
/eq
uipm
ent
Prom
otio
n
Med
ia c
over
age
Web
site/
inte
rnet
Even
ts
Skill
s-ba
sed
lear
ning
Life
-enr
ichi
ngop
port
unit
ies
Scho
oltri
psG
uest
spea
kers
Busin
ess
skill
s
GCS
Es
Stud
ent
rela
tion
ship
& h
appi
ness
Pare
ntre
lati
onsh
ip
Past
oral
car
eBu
llyin
gAc
adem
icsu
ppor
t
Stud
ent
wel
fare
Pare
ntco
mm
unica
tions
Pare
nt e
veni
ngs
Tran
spor
tro
utes
/tim
es&
cos
ts
Boar
ding
opt
ions
Inte
rnat
iona
lQ
ualif
icatio
ns
Relig
ious
/Cul
tura
lun
ders
tand
ing
Hea
dtea
cher
qua
lity
Broc
hure
Scho
lars
hips
& Bu
rsar
ies
Int’l
con
nect
ions
,co
mm
unity
link
s
Soci
alm
ix
Stud
ent
succ
esse
s-ex
ams,
univ
, com
peti
tion
s
Socia
l life
Dev
elop
-m
ent
Fig
ure
6.3
1: In
dep
end
ent
scho
ols
buyin
g c
rite
ria.
(Continued)

Academic factorsPersonality and vision of HeadExam resultsClass sizeLeague table position (compared to regional competitors)Student academic successes (Oxbridge, major universities, competitions)Academic planning: A level, IB, pre-U; IGCSE? New subjects?Flexibility of subject choiceAcademic history (results over a number of years)Quality/knowledge/experience of staffFacilities for teaching and learningLearning opportunities outside mainstream subjects (could be vocational skills)Reporting proceduresInnovations in teaching and learning
Figure 6.32: Academic factors.
Enhancement/Attractiveness factorsFacilities – Buildings and grounds – Specialist facilities (floodlit astroturf, ICT centre, theatre) – Development Planning: plans for new/better facilitiesPeople – Quality of staff (teaching and specialist – ie sports/music coaching) – Quality of staff recruitment – Front of House/customer focus – Understanding/delivery of mission by all staff – Strong alumni association – Active parents’ association‘Preparation for Life’ – Active careers department – Expertise in university entrance support – Work experience, Young Enterprise, Duke of Edinburgh’s Award, Sports Leader’s Award etc.Community – Links through activities (charity fundraising, visits to elderly, working with handicapped etc.) – Hire of facilities (pool, theatre, sports, hall for weddings and parties) – Compliant with Charities Act – Local reputationInternational links and opportunities – Language visits – Trips and expeditions – Other learning opportunitiesTechnology – Up-to-date, campus-wide access – Resources online to enhance studyEnvironmental – Clear policy and aims – Strong student involvement in campaigns and issues – Clear priority status within School – put into action
Figure 6.33: Enhancement factors.

What then are the risks attached to making assumptions? Suppose we get it wrong?
To give some measure of risk assessment, a technique has been developed that looks at
the assumption from the negative point of view. It leads one to ask ‘What can go wrong with
each assumption that would change the outcome?’ For example, suppose the product was
an oil derivative and was thus extremely sensitive to the price of oil. For planning purposes an
assumption about the price of oil would have to be made. Using this ‘Downside risk’ technique
we would assess to what level the price could rise before increased material costs would make
our products too expensive and cause our marketing plans to be completely revised.
Now complete the following ‘Downside risk assessment form’ (Table 6.5) to evaluate
some of the key assumptions you used in your SWOT analyses, and which you are now to
use as the basis for setting marketing objectives and strategies.
(Continued)
Relationship factorsPastoral Care – Welfare: support, information, training, awareness – Responsiveness – Structures – Policies: availability, clarityEthos – Mission, values – Tangible, delivered from top downParents’ associationAlumni associationCommunications – Internet, intranet – Events – Printed communications – Policies and procedures – Management of problems
Figure 6.34: Relationship factors.
Cost factorsFees – Fee increases yr-to-yrScholarships – Type? (sports, academic, all-round, music, art) – % discountBursaries – % range – Means-testingSibling discountsTransport costsTrips, other extra costs on the billPrice relative to regional competitors
Figure 6.35: Cost factors.
FlexibleUnderwriting
Relationship
Service Level
CommissionRates
ResponseRates
Prompt Claims
Customer Satisfaction
Cornhill
RSA
Norwich Union
Independent
CGU
Insurance Inc
0 2 4 6 8
Figure 6.36: CSF barchart.
Key
assumption
Basis of
assumption
Confi dence
in assumption
(high/med/
low)
What would
have to
happen
to make
outcome
unattractive?
What is the
risk of this
happening?
(high/med/
low)
What
would
be
impact
if event
occurs?
How far
could things
be allowed
to deviate
from plan
before
action is
taken?
What
contingency
action is
planned?
Table 6.5: Downside risk assessment.

Exercise 6.6 Setting marketing objectivesMarketing objectives are solely concerned with which products go to which markets, and
marketing strategies are concerned with how that is done. Therefore, because marketing
objectives are only concerned about products and markets, an extremely useful planning aid
is provided by the Ansoff Matrix, depicted in Figure 6.37.
This matrix suggests there are four types of marketing objective:
1. Selling established products into established markets (market penetration).
2. Selling established products into new markets (market extension).
3. Selling new products into established markets (product development).
4. Selling new products into new markets (diversifi cation).
(Continued)
PRODUCTS
MAR
KETS
New
Established New
Esta
blish
ed
Marketpenetration
Marketextension
Productdevelopment
Diversification
Incr
easin
g ne
wne
ss o
f mar
kets
Increasing technological newness
Figure 6.37: The Ansoff matrix.
Figure 6.38: The Ansoff matrix.
PRODUCTS
MAR
KETS
New
Established New
Esta
blish
ed
Incr
easin
g ne
wne
ss
Increasing technological awareness

Task 1Using the blank Ansoff Matrix (Figure 6.38), or perhaps using a larger sheet of paper, draw
the matrix for your company’s products and markets.
Please note that when you consider whether or not a market is new or established, the
question you must ask yourself is ‘How long does it take to get one’s distinctive competence
known in this market?’ If you have been dealing with the market for anything less than your
answer to this question, then that is a new market.
Similarly, new products are those probably at the early stages of their lifecycles, where
the company is still ‘learning’ how to make them, i.e. it hasn’t solved all the operational,
scheduling, quality, design and technical problems in the same way as it has for the estab-
lished products.
Task 2Combining the information on the Ansoff Matrix with that of your SWOT analyses, pick out
those areas of business that offer the best prospects for your company. For each one, sum-
marize your marketing objective for your longer-term planning horizon, i.e. 2, 3, 4 or 5 years.
This must be quite explicit in terms of:
1. The product/service
2. The customer/market segment
3. The volume of sales
4. The market share.
Now repeat the exercise, stating the specifi c objectives for the fi rst year of your planning
horizon.
The marketing objectives should be consistent with the information from the product
lifecycle analysis and portfolio matrix, completed in Chapter 5. Further guidance is provided
in the notes which follow.
Guidelines for setting marketing objectivesContained within your SWOT analyses will be key information gleaned from your marketing
audit. You will know the reasons why customers want your products or services. You will
know your best market segments. You will know the ‘life’ of your products or services and,
probably most important of all, the portfolio matrix will have shown you how the various
items of your range relate to each other in terms of raising funds.
Creative and intelligent interpretation of the portfolio matrix is the secret behind setting
the right marketing objectives for your company. For this to happen, it is important to dis-
tinguish the essentially different characteristics of products or services falling into the four
quadrants of the matrix. Let us take in turn:
InvestProducts or services in this quadrant are by implication aimed at those markets most attractive
to your company. These will almost certainly be the markets with the higher growth rates.

Marketing objectives for such products should be calculated to match or exceed the
market-growth rate and thereby hold or extend the company’s market share. Since these
markets are likely to be attractive to others, the company will have to be aggressive to
achieve its objectives.
This marketing posture has to be supported by tight budgeting and control processes
to ensure that all resources are used effectively. Concern for present earnings should be
subordinate to the main thrust of keeping or extending market share.
The increase in sales looked for in these products or services is likely to come from:
1. Possible geographic expansion
2. Possible product line expansion
3. Possible product line differentiation.
These may be achieved by internal development, acquisition or joint ventures.
SustainIn these less attractive markets it doesn’t make sense to go for aggressive growth as with
the invest quadrant – it would prove to be too costly and counterproductive. Instead, the
objectives should be aimed at maintaining a profi table position with greater emphasis on
present earnings.
The most successful products/services should be maintained, while less successful
ones should be pruned. Marketing effort should be aimed at maintaining the market share of
key market segments with minimum expenditure. Prices should be stabilized except when a
temporary aggressive stance is required to maintain market share.
Sustain products must be managed to be the major source of funding for the company.
SelectiveFor products/services in this quadrant there are two broad choices:
1. Invest in the products for future earnings, i.e. groom them to be tomorrow’s invest prod-
ucts and subsequent sustain products; or
2. Manage them for present earnings.
In practice it is only feasible to ‘groom’ a limited number of question marks and so these
have to be carefully chosen for their genuine potential. Investment across the range would
be prohibitive.
CashIn effect there are two kinds of product/service in this quadrant:
1. Genuine cash products (to the right of the quadrant)
2. Select products (to the left of the quadrant, adjacent to the sustain quadrant).
The marketing objectives for genuine cash products should be to divest where appropriate
or to manage for present earnings. Marketing expenditure should be minimized, product lines
pruned and prices stabilized or raised where possible, even at the expense of sales volume.(Continued)

The marketing objectives for select products should acknowledge the low growth/
attractiveness of these products and services, but still seek to identify and exploit growth
segments, not by fl ying in the face of reason and trying to restore the product to its previous
higher growth rate by costly advertising and promotion, but by emphasizing product quality and
looking for improvements in productivity. Judicious marketing expenditure might be reason-
able in special circumstances, but the emphasis should be on maximizing present earnings.
Exercise 6.7 Marketing strategiesNow that the marketing objectives have determined what the company must achieve, you
have to decide how that might be done by your marketing strategies. Whereas there are only
four types of marketing objective, there are a whole range of possible marketing strategies
which can be used either singly or in combination with others. A choice of possible market-
ing strategies is shown in the list below.
Using this list, identify the broad marketing strategies most supportive to each of the
marketing objectives you set for the company. Having done this, you will probably fi nd it
helpful to refer back to Figure 6.5. The left hand column of this fi gure lists the marketing
variables that need to be considered, such as pricing, distribution, etc. The other columns
represent the key positions on the portfolio matrix and are headed accordingly. Thus it
becomes a fairly straightforward procedure to identify the best marketing strategies for your
chosen objectives.
Chapters 7–10 will provide you with additional information about advertising, sales
promotion, selling, pricing and distribution. Only fi nalize your marketing strategies after com-
pleting these later sections of this book.
Possible marketing strategies 1. Change product performance
2. Change quality or features of product
3. Change advertising
4. Change promotion
5. Change pricing
6. Change delivery arrangements
7. Change distribution channels
8. Change service levels
9. Improve operational effi ciency
10. Improve marketing effi ciency
11. Improve administrative procedures
12. Change the degree of forward integration
13. Change the degree of backward integration
14. Rationalize product range
15. Withdraw from selected markets
16. Standardize design
17. Specialize in certain products/markets
18. Change sourcing

19. Buy into new markets
20. Acquire new/different facilities
21.
22.
23.
24.
Add any other strategies that occur to you in the spaces provided.