introduction - tennessee · fair. concert. fight/wrestling. other. other animal event. flea market....
TRANSCRIPT

1
Feas
ibili
ty S
tudy
of a
Pot
entia
l New
Sta
te F
airg
roun
ds
in M
anch
este
r, Te
nnes
see
INTR
ODU
CTIO
N
Feasibility Analysis of a Potential New State Fairgrounds in Manchester, TennesseeJuly 14, 2017

2
Feas
ibili
ty S
tudy
of a
Pot
entia
l New
Sta
te F
airg
roun
ds
in M
anch
este
r, Te
nnes
see
INTR
ODU
CTIO
N
July 14, 2017
Mr. Bo RobertsChairmanTennessee State Fair and Exposition Commission 414 Union Street, Suite 1105Nashville, Tennessee 37219
Dear Mr. Roberts:
Conventions, Sports & Leisure International (CSL) is pleased to have completed our market, financial and economic feasibility analysis of a new fairgrounds complex at the Bonnaroo site in Manchester that would be a new home to the Tennessee State Fair. The attached document presents our research, analysis and findings and is intended to assist the Tennessee State Fair and Exposition Commission (Commission) and other stakeholders in evaluating the viability of the project.
The analysis presented in this report is based on estimates, assumptions and other information developed from industry research, data provided by the study’s stakeholders, surveys of potential facility users and local representatives, discussions with industry participants and analysis of competitive/comparable facilities and communities. The sources of information, the methods employed, and the basis of significant estimates and assumptions are stated in this report. Some assumptions inevitably will not materialize and unanticipated events and circumstances may occur. Therefore, actual results achieved will vary from those described and the variations may be material.
The findings presented herein are based on analysis of present and near-term conditions in Tennessee as well as existing interest levels by the potential base of users of the facility project. Any significant future changes in the characteristics of the local community, such as growth in population, corporate inventory,competitive inventory and visitor amenities/attractions, could materially impact the key market conclusions developed as a part of this study. As in all studies of this type, the estimated results are based on competent and efficient management of the potential facilities and assume that no significant changes in the demand markets or assumed immediate and local area market conditions will occur beyond those set forth in this report. Furthermore, all information provided to us by others was not audited or verified and was assumed to be correct. All market research and analysis associated with this study was completed by late 2016.
This report has been prepared for the internal use of the Commission and should not be relied upon by any other party. The report has been structured to assist stakeholders in evaluating market demand, supportable program and the potential cost/benefit characteristics of a new fairgrounds complex at the Bonnaroo site in Manchester that would be a new home to the Tennessee State Fair, and should not be used for any other purpose. This report, its findings or references to CSL may not be included or reproduced in any public offering statement or other financing document.
We sincerely appreciate the assistance and cooperation we have been provided in the compilation of this report and would be pleased to be of further assistance in the interpretation and application of our findings.
Very truly yours,
CSL International

3
Feas
ibili
ty S
tudy
of a
Pot
entia
l New
Sta
te F
airg
roun
ds
in M
anch
este
r, Te
nnes
see
INTR
ODU
CTIO
N
Study Background & PurposeTo analyze the market, financial and economic feasibility of a new fairgrounds complex at the Bonnaroo site in Manchester that would be a new home to the Tennessee State Fair.
The study updates and builds on portions of CSL’s 2012/2013 feasibility study of a redeveloped State Fairgrounds.
This study was requested by the State of Tennessee to investigate the feasibility of a unique public/private partnership opportunity involving a new Fairgrounds that would involve and leverage Bonnaroo, its property, management, marketing expertise and association with Live Nation and AC Entertainment.

4
Feas
ibili
ty S
tudy
of a
Pot
entia
l New
Sta
te F
airg
roun
ds
in M
anch
este
r, Te
nnes
see
INTR
ODU
CTIO
N
Bonnaroo Music Festival• Originally established by AC Entertainment in 2002.
• Four-day event held annually in Manchester, TN starting the second Thursday in June.
• Live music from a variety of styles including indie rock, classic rock, hip hop, jazz, pop, alternative and others.
• Notable acts have included Elton John, Nine Inch Nails, Paul McCartney, The Beach Boys, James Brown, Metallica, Mumford and Sons, Red Hot Chili Peppers, Willie Nelson, Jay Z, Bob Dylan and The Black Keys.
• Attendance has historically been between 70,000 and 100,000 for the event. However, 2016 attendance was down over recent levels at approximately 45,000.
• In 2016, Bonnaroo was acquired by Live Nation Entertainment, one of the largest global entertainment companies in the world with connections to some of the most highly sought after musical and promoted acts.
• Potential for Live Nation/AC Entertainment/Bonnaroo to manage via contract a new State Fairgrounds located adjacent to the current Bonnaroo site. An experienced fairgrounds manager and facility team would be retained.

5
Feas
ibili
ty S
tudy
of a
Pot
entia
l New
Sta
te F
airg
roun
ds
in M
anch
este
r, Te
nnes
see
INTR
ODU
CTIO
N
Study Components1. Site visit, facility/community tours2. Stakeholder & community outreach3. Existing TN State Fairgrounds review4. Manchester market conditions analysis5. Competitive & comparable facilities6. In-person & telephone user surveys7. Market supportable program8. Event/utilization analysis9. Financial operating estimates10. Economic impacts11. Cost/benefit conclusions

6
Feas
ibili
ty S
tudy
of a
Pot
entia
l New
Sta
te F
airg
roun
ds
in M
anch
este
r, Te
nnes
see
LOCA
L M
ARKE
T AN
ALYS
IS
Fairgrounds NashvilleCurrent Home of TN State Fair
8
11
1 2 3
45
6
7
9
10
1213
14
15
16
1 Creative Arts Building2 Annex Building3 Exhibitor's Building4 Banquet Building5 Agriculture Building6 Vaughn Building7 Wilson Hall8 Judging Arena9 Sports Arena
10 Grandstand11 Rabbit Barn12 Shed 213 Shed 314 Shed 415 Shed 516 Pulling Shed

7
Feas
ibili
ty S
tudy
of a
Pot
entia
l New
Sta
te F
airg
roun
ds
in M
anch
este
r, Te
nnes
see
LOCA
L M
ARKE
T AN
ALYS
IS
Note: Adjustments were made to 2009 through 2011 data reflecting utilization days within indoor event space usage only.Source: CSL International, facility management, 2016.
Fairgrounds NashvilleHistorical Event Activity – Utilization Days
155 171
86 86 74 76 64
227 182
158 134 119
152 146
36 57
64
28 28
45 40
48 48
48
56
48
48 48
24
32
22 30
16
18
25 27
529 528
427
385
333 363 366
0
100
200
300
400
500
600
2009 2010 2011 2012 2013 2014 2015
Util
izat
ion
Day
sFairConcertFight/WrestlingOtherOther Animal EventFlea MarketMeeting/BanquetPublic/Consumer ShowRoller Derby

8
Feas
ibili
ty S
tudy
of a
Pot
entia
l New
Sta
te F
airg
roun
ds
in M
anch
este
r, Te
nnes
see
HIST
ORI
CAL
OPE
RATI
ON
S
Source: Tennessee State Fair, 2016
Tennessee State FairRecent Financial Operating Results
2015 2014 2013 2012RevenueAdmission $444,395 $469,158 $440,615 $390,751Commissions and Fees on Midway 314,876 329,222 329,364 361,100Grants 154,550 13,925 13,400 88,975Donations and Sponsorships 92,450 148,326 77,904 69,042Vendor Space Rental 77,378 71,530 61,762 57,137Parking Fees 63,754 67,764 66,918 0Contributed Account and Legal Services 26,900 33,180 34,350 34,915Exhibit Entry Fees 20,644 18,911 18,511 16,404Other Income 12,416 11,133 10,535 5,336
Total $1,207,363 $1,163,149 $1,053,359 $1,023,660
ExpensesFairgrounds Rental $180,416 $171,870 $175,882 $67,805Advertising/Public Relations 199,288 232,852 203,249 189,495Fair Entertainment 137,430 128,203 116,317 101,399Premiums 120,502 115,949 104,744 91,309Salaries 144,578 123,730 117,554 96,700Contract Services 101,955 86,749 87,814 78,139Exhibit Judging and Supplies 62,024 57,597 52,128 41,539Other Fair Expenses 104,010 123,247 86,165 61,896Management/General 128,663 105,773 102,613 94,379In-kind Accounting/Legal 26,900 33,180 34,350 34,915
Total $1,205,766 $1,179,150 $1,080,816 $857,576
Net Operating Profit/(Deficit) $1,597 ($16,001) ($27,457) $166,084
9
Feas
ibili
ty S
tudy
of a
Pot
entia
l New
Sta
te F
airg
roun
ds
in M
anch
este
r, Te
nnes
see
LOCA
L M
ARKE
T AN
ALYS
IS
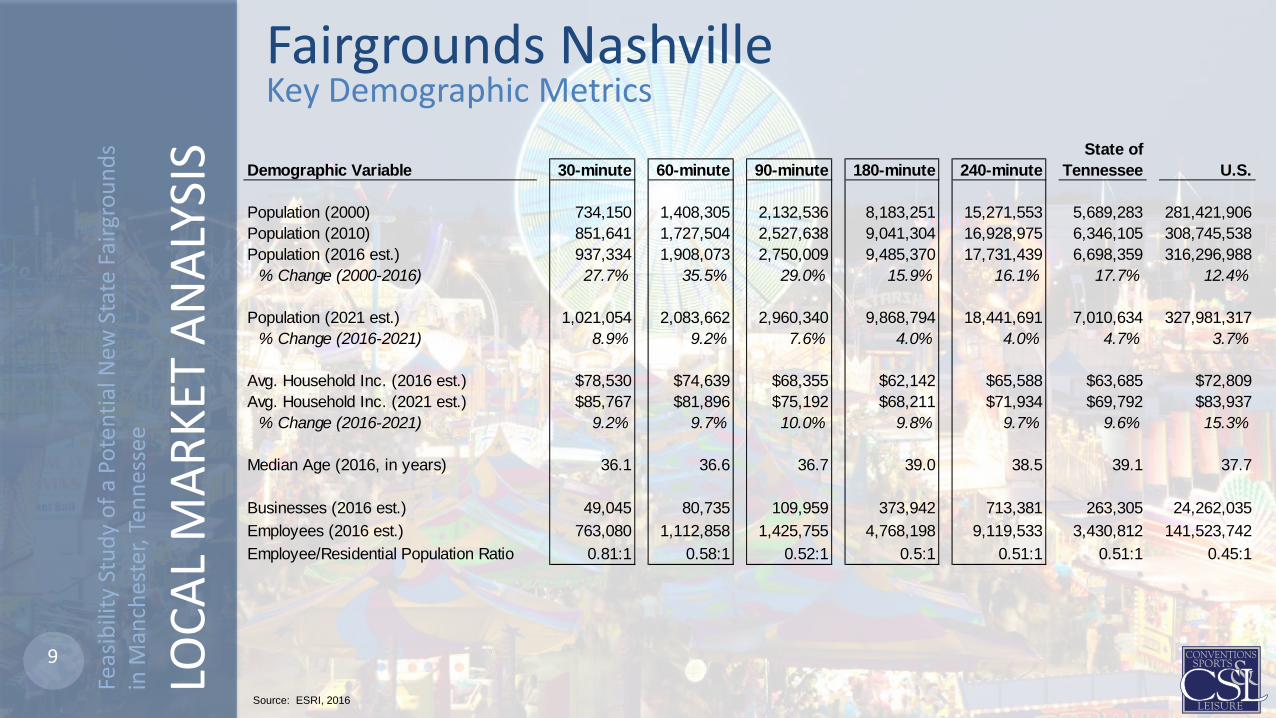
Source: ESRI, 2016
Fairgrounds NashvilleKey Demographic Metrics
State ofDemographic Variable 30-minute 60-minute 90-minute 180-minute 240-minute Tennessee U.S.
Population (2000) 734,150 1,408,305 2,132,536 8,183,251 15,271,553 5,689,283 281,421,906Population (2010) 851,641 1,727,504 2,527,638 9,041,304 16,928,975 6,346,105 308,745,538Population (2016 est.) 937,334 1,908,073 2,750,009 9,485,370 17,731,439 6,698,359 316,296,988
% Change (2000-2016) 27.7% 35.5% 29.0% 15.9% 16.1% 17.7% 12.4%
Population (2021 est.) 1,021,054 2,083,662 2,960,340 9,868,794 18,441,691 7,010,634 327,981,317% Change (2016-2021) 8.9% 9.2% 7.6% 4.0% 4.0% 4.7% 3.7%
Avg. Household Inc. (2016 est.) $78,530 $74,639 $68,355 $62,142 $65,588 $63,685 $72,809Avg. Household Inc. (2021 est.) $85,767 $81,896 $75,192 $68,211 $71,934 $69,792 $83,937
% Change (2016-2021) 9.2% 9.7% 10.0% 9.8% 9.7% 9.6% 15.3%
Median Age (2016, in years) 36.1 36.6 36.7 39.0 38.5 39.1 37.7
Businesses (2016 est.) 49,045 80,735 109,959 373,942 713,381 263,305 24,262,035Employees (2016 est.) 763,080 1,112,858 1,425,755 4,768,198 9,119,533 3,430,812 141,523,742Employee/Residential Population Ratio 0.81:1 0.58:1 0.52:1 0.5:1 0.51:1 0.51:1 0.45:1

10
Feas
ibili
ty S
tudy
of a
Pot
entia
l New
Sta
te F
airg
roun
ds
in M
anch
este
r, Te
nnes
see
LOCA
L M
ARKE
T AN
ALYS
IS
Proposed New State FairgroundsLocation & Driving Distance to Regional Cities
Source: Google Maps, Esri, 2016
Lebanon
11
Feas
ibili
ty S
tudy
of a
Pot
entia
l New
Sta
te F
airg
roun
ds
in M
anch
este
r, Te
nnes
see
LOCA
L M
ARKE
T AN
ALYS
IS
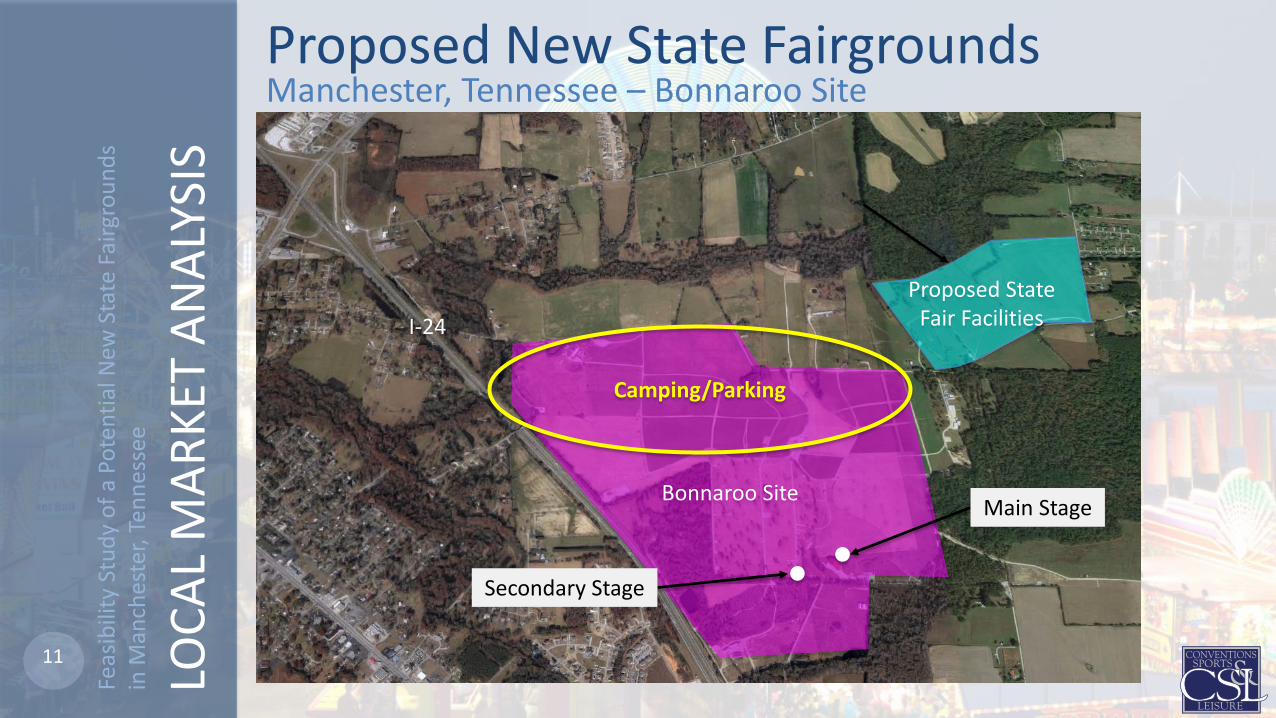
Proposed New State FairgroundsManchester, Tennessee – Bonnaroo Site
Bonnaroo Site Main Stage
Secondary Stage
Proposed StateFair Facilities
Camping/Parking
I-24

12
Feas
ibili
ty S
tudy
of a
Pot
entia
l New
Sta
te F
airg
roun
ds
in M
anch
este
r, Te
nnes
see
LOCA
L M
ARKE
T AN
ALYS
IS
Proposed New State Fairgrounds
Source: Populous, 2016

13
Feas
ibili
ty S
tudy
of a
Pot
entia
l New
Sta
te F
airg
roun
ds
in M
anch
este
r, Te
nnes
see
LOCA
L M
ARKE
T AN
ALYS
IS
Proposed New State FairgroundsDriving Distance to Regional Cities
Source: Google Maps, Esri, 2016
City
Distance from
Manchester (in miles)
Drive Time
Market Population
Nashville, TN 70 1:10 1,830,300Chattanooga, TN 70 1:10 547,800Huntsville, AL 75 1:30 444,800Bowling Green, KY 130 2:15 168,400Knoxville, TN 180 2:45 861,400Birmingham, AL 190 2:45 1,145,600Jackson, TN 190 2:50 129,700Atlanta, GA 185 3:10 5,710,800Louisville, KY 240 3:55 1,278,400Memphis, TN 275 4:00 1,344,100Lexington, KY 280 4:25 500,500Cincinnati, OH 340 5:10 2,157,700Indianpolis, IN 355 5:25 1,988,800St. Louis, MO 375 5:30 2,811,600

14
Feas
ibili
ty S
tudy
of a
Pot
entia
l New
Sta
te F
airg
roun
ds
in M
anch
este
r, Te
nnes
see
LOCA
L M
ARKE
T AN
ALYS
IS
Note: Drive times are based off of the intersection of Shedd Road and New Busy Branch Road in Manchester, Tennessee. Source: ESRI, 2016
Proposed New State FairgroundsKey Demographic Metrics
State ofDemographic Variable 30-minute 60-minute 90-minute 180-minute 240-minute Tennessee U.S.
Population (2000) 76,594 504,034 1,971,609 7,163,005 15,907,469 5,689,283 281,421,906Population (2010) 83,141 629,000 2,302,819 8,164,206 18,127,112 6,346,105 308,745,538Population (2016 est.) 85,702 683,659 2,497,532 8,636,432 19,092,445 6,698,359 316,296,988
% Change (2000-2016) 11.9% 35.6% 26.7% 20.6% 20.0% 17.7% 12.4%
Population (2021 est.) 87,726 737,475 2,679,588 9,066,567 19,988,409 7,010,634 327,981,317% Change (2016-2021) 2.4% 7.9% 7.3% 5.0% 4.7% 4.7% 3.7%
Avg. Household Inc. (2016 est.) $54,465 $60,890 $69,020 $66,296 $67,644 $63,685 $72,809Avg. Household Inc. (2021 est.) $60,166 $67,194 $75,911 $72,794 $74,280 $69,792 $83,937
% Change (2016-2021) 10.5% 10.4% 10.0% 9.8% 9.8% 9.6% 15.3%
Median Age (2016, in years) 40.8 35.9 37.8 38.8 38.0 39.1 37.7
Businesses (2016 est.) 3,702 23,116 109,269 343,615 771,954 263,305 24,262,035Employees (2016 est.) 39,900 1,469,593 1,469,593 4,155,550 9,548,740 3,430,812 141,523,742Employee/Residential Population Ratio 0.47:1 0.4:1 0.4:1 0.48:1 0.5:1 0.51:1 0.45:1

15
Feas
ibili
ty S
tudy
of a
Pot
entia
l New
Sta
te F
airg
roun
ds
in M
anch
este
r, Te
nnes
see
LOCA
L M
ARKE
T AN
ALYS
IS Map Key Hotel Rooms
1 Ambassador Inn 1532 Scottish Inn 903 Red Roof Inn 814 Holiday Inn Express and Suites 805 Quality Inn 806 Comfort Suites 777 Sleep Inn and Suites 778 Hampton Inn and Suites 709 Rodeway Inn 65
10 Microtel Inn and Suites 6211 Super 8 Motel 6212 Regency Inn 5213 Economy Inn 5014 Motel 6 5015 Greenleafe Inn 5016 Royal Inn 35
Source: Manchester Travel Guide, 2016; TripAdvisor, 2016
Total Hotel Rooms in Manchester: 1,134
15
113
811
7 1425
469
123 1016
1 Mile
3 Miles
Proposed New State FairgroundsManchester Area Hotels
16
Feas
ibili
ty S
tudy
of a
Pot
entia
l New
Sta
te F
airg
roun
ds
in M
anch
este
r, Te
nnes
see
LOCA
L M
ARKE
T AN
ALYS
IS
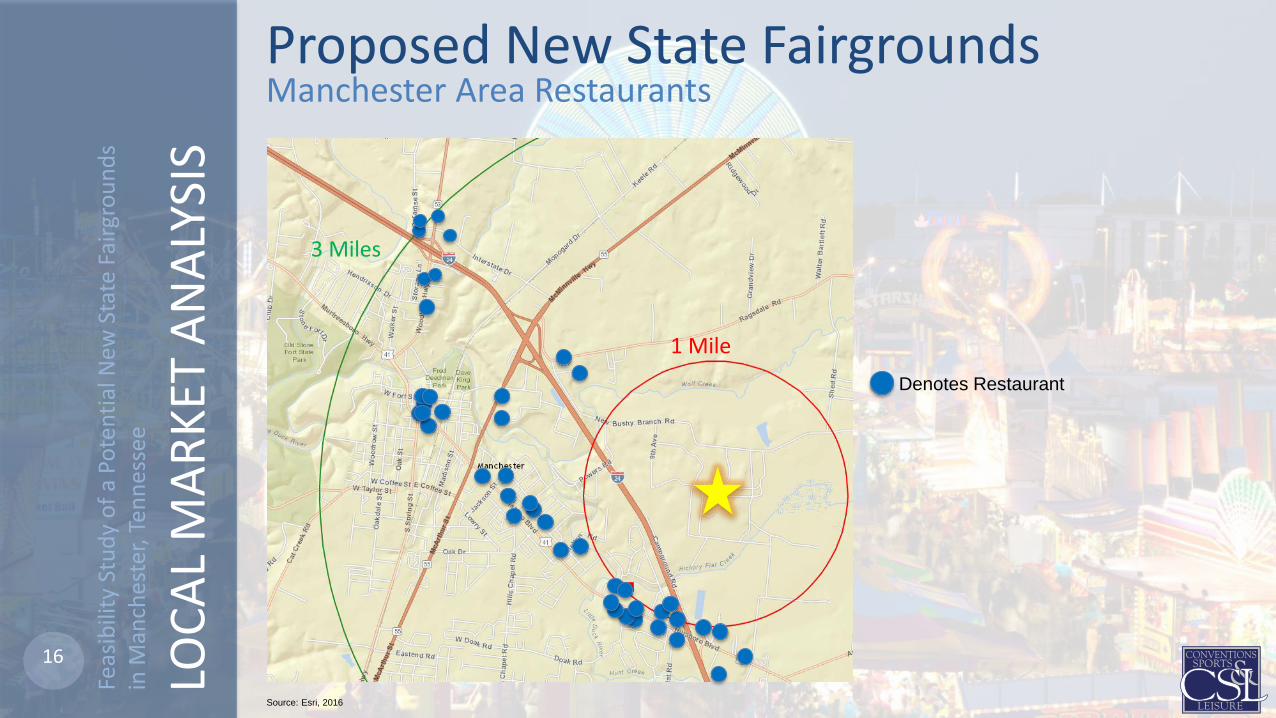
Source: Esri, 2016
Denotes Restaurant
1 Mile
3 Miles
Proposed New State FairgroundsManchester Area Restaurants
17
Feas
ibili
ty S
tudy
of a
Pot
entia
l New
Sta
te F
airg
roun
ds
in M
anch
este
r, Te
nnes
see
COM
PETI
TIVE
FAC
ILIT
IES
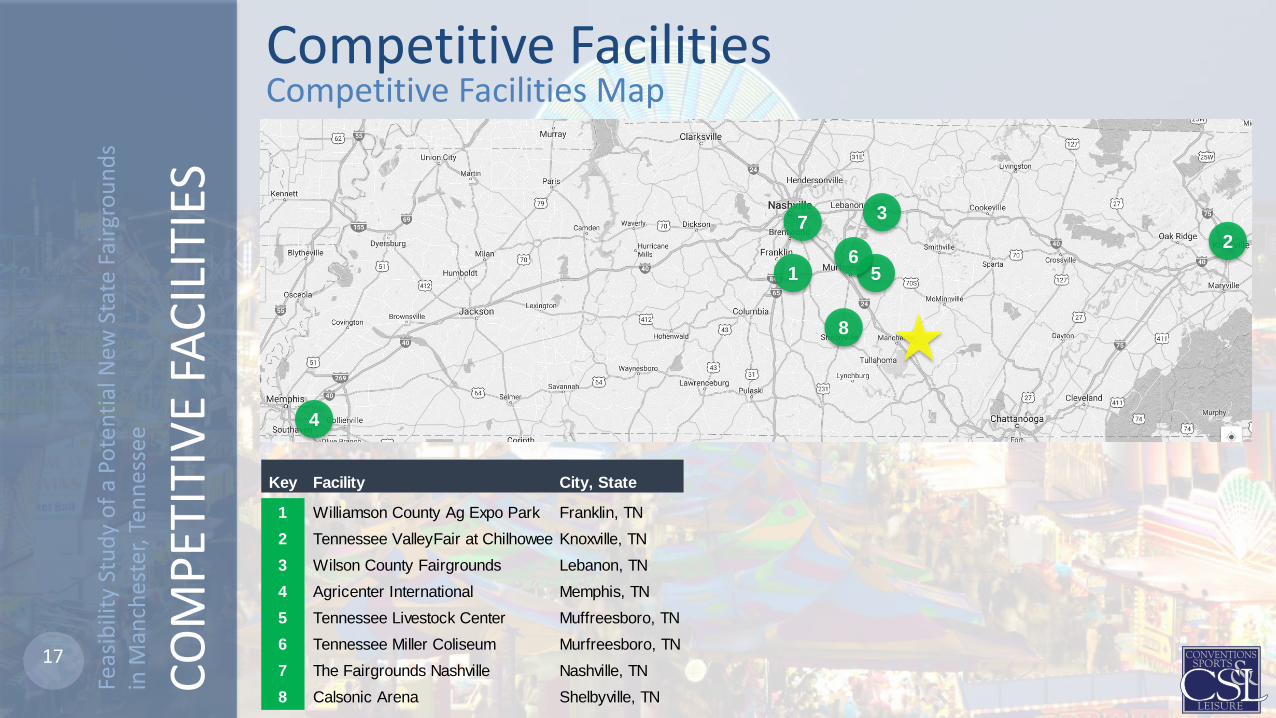
Competitive FacilitiesCompetitive Facilities Map
4
21 5
6
8
37
Key Facility City, State
1 Williamson County Ag Expo Park Franklin, TN2 Tennessee ValleyFair at Chilhowee Knoxville, TN3 Wilson County Fairgrounds Lebanon, TN4 Agricenter International Memphis, TN5 Tennessee Livestock Center Muffreesboro, TN6 Tennessee Miller Coliseum Murfreesboro, TN7 The Fairgrounds Nashville Nashville, TN8 Calsonic Arena Shelbyville, TN

18
Feas
ibili
ty S
tudy
of a
Pot
entia
l New
Sta
te F
airg
roun
ds
in M
anch
este
r, Te
nnes
see
COM
PETI
TIVE
FAC
ILIT
IES
Competitive FacilitiesCompetitive Facilities - Summary
(1) Outdoor seating at Celebration Stadium.Source: Facility Management, 2016
LargestOwnership Size Total Permanent Portable RV Grandstand Arena
Facility City, State Structure (in acres) Stalls Stalls Stalls Hookups Seating Seating
Williamson County Ag Expo Park Franklin, TN County 110 194 194 0 85 0 4,180Chilhowee Park Knoxville, TN City 81 15 15 0 50 4,500 1,000Wilson County Fairgrounds Lebanon, TN County 110 200 200 0 921 0 3,100Agricenter International Memphis, TN County 1,000 632 632 0 80 0 4,100Tennessee Livestock Center Muffreesboro, TN University 16 214 214 0 25 0 4,550Tennessee Miller Coliseum Murfreesboro, TN University 154 500 500 0 117 0 4,600The Fairgrounds Nashville Nashville, TN Metro 117 0 0 0 20 21,000 2,500Calsonic Arena (1) Shelbyville, TN - 105 1,500 1,500 0 294 28,000 4,469
Average 212 407 407 0 199 6,688 3,562Median 110 207 207 0 83 0 4,140
19
Feas
ibili
ty S
tudy
of a
Pot
entia
l New
Sta
te F
airg
roun
ds
in M
anch
este
r, Te
nnes
see
COM
PETI
TIVE
FAC
ILIT
IES
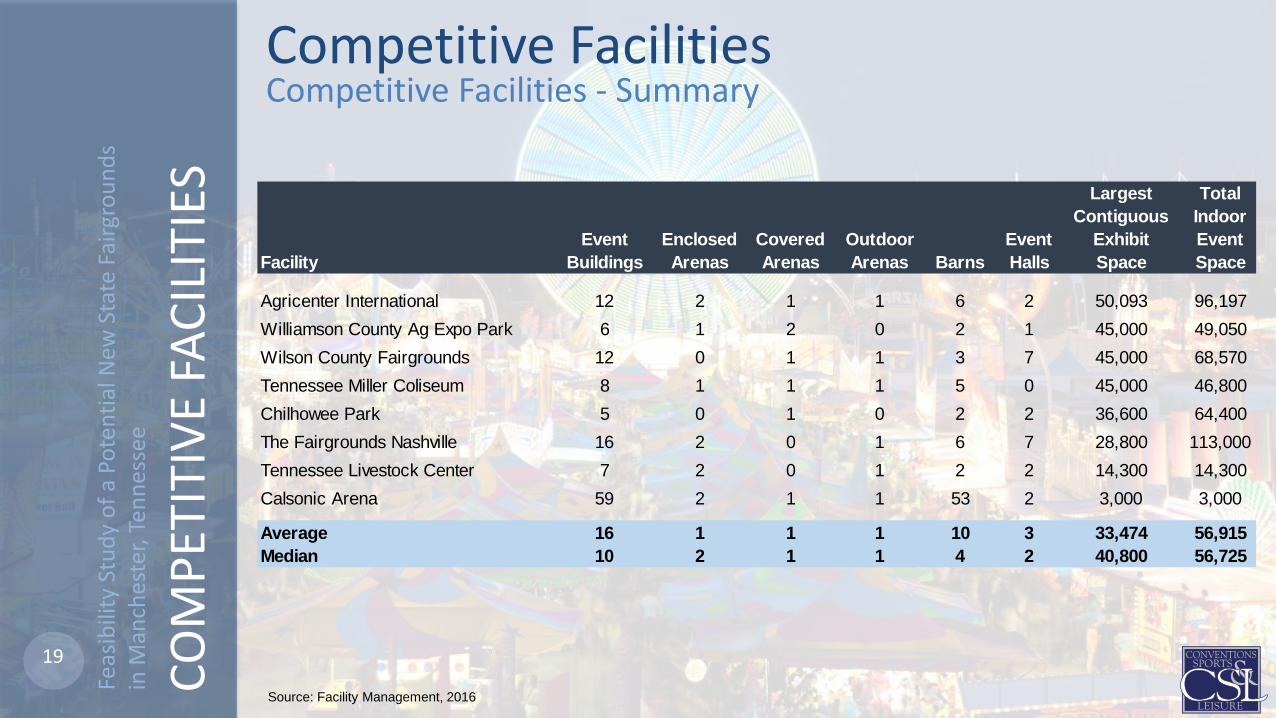
Competitive FacilitiesCompetitive Facilities - Summary
Source: Facility Management, 2016
Largest TotalContiguous Indoor
Event Enclosed Covered Outdoor Event Exhibit EventFacility Buildings Arenas Arenas Arenas Barns Halls Space Space
Agricenter International 12 2 1 1 6 2 50,093 96,197Williamson County Ag Expo Park 6 1 2 0 2 1 45,000 49,050Wilson County Fairgrounds 12 0 1 1 3 7 45,000 68,570Tennessee Miller Coliseum 8 1 1 1 5 0 45,000 46,800Chilhowee Park 5 0 1 0 2 2 36,600 64,400The Fairgrounds Nashville 16 2 0 1 6 7 28,800 113,000Tennessee Livestock Center 7 2 0 1 2 2 14,300 14,300Calsonic Arena 59 2 1 1 53 2 3,000 3,000
Average 16 1 1 1 10 3 33,474 56,915Median 10 2 1 1 4 2 40,800 56,725

20
Feas
ibili
ty S
tudy
of a
Pot
entia
l New
Sta
te F
airg
roun
ds
in M
anch
este
r, Te
nnes
see
COM
PETI
TIVE
FAC
ILIT
IES Largest Largest Secondary Tertiary
Indoor Arena Indoor Arena Arena ArenaFacility City, State Dimensions (ft.) Sq. Ft. Dimensions (ft.) Dimensions (ft.)
Tennessee Miller Coliseum Murfreesboro, TN 300x150 45,000 203x120 -Williamson County Ag Expo Park Franklin, TN 300x150 45,000 190x110 200x100Calsonic Arena Shelbyville, TN 300x150 45,000 250x125 300x150Agricenter International Memphis, TN 250x125 31,250 100x100 200x100Tennessee Livestock Center Muffreesboro, TN 230x100 23,000 160x75 200x100Wilson County Fairgrounds Lebanon, TN - - 300x160 200x130The Fairgrounds Nashville Nashville, TN - - 200x100 -Chilhowee Park Knoxville, TN - - 150x71 -
Average 276x135 39,500 194x108 220x116Median 300x150 45,000 195x105 200x100
Source: Facility Management, 2016
Competitive FacilitiesComparison of Arena Sizes
Covered Arena
Outdoor Arena

21
Feas
ibili
ty S
tudy
of a
Pot
entia
l New
Sta
te F
airg
roun
ds
in M
anch
este
r, Te
nnes
see
COM
PETI
TIVE
FAC
ILIT
IES
Largest TotalLargest Contiguous Indoor
Enclosed Indoor Arena Event Exhibit EventFacility Arenas Sq. Ft. Halls Space Space
Agricenter International 2 31,250 2 50,093 96,197Williamson County Ag Expo Park 1 45,000 1 45,000 49,050Wilson County Fairgrounds 0 0 7 45,000 68,570Tennessee Miller Coliseum 1 45,000 0 45,000 46,800Chilhowee Park 0 0 2 36,600 64,400The Fairgrounds Nashville 2 11,020 7 28,800 113,000Tennessee Livestock Center 2 23,000 2 14,300 14,300Calsonic Arena 2 45,000 2 3,000 3,000
Average 1 25,034 3 33,474 56,915Median 2 27,125 2 40,800 56,725
Source: Facility Management, 2016
Competitive FacilitiesSummary of Total Indoor Event Space
22
Feas
ibili
ty S
tudy
of a
Pot
entia
l New
Sta
te F
airg
roun
ds
in M
anch
este
r, Te
nnes
see
COM
PETI
TIVE
FAC
ILIT
IES
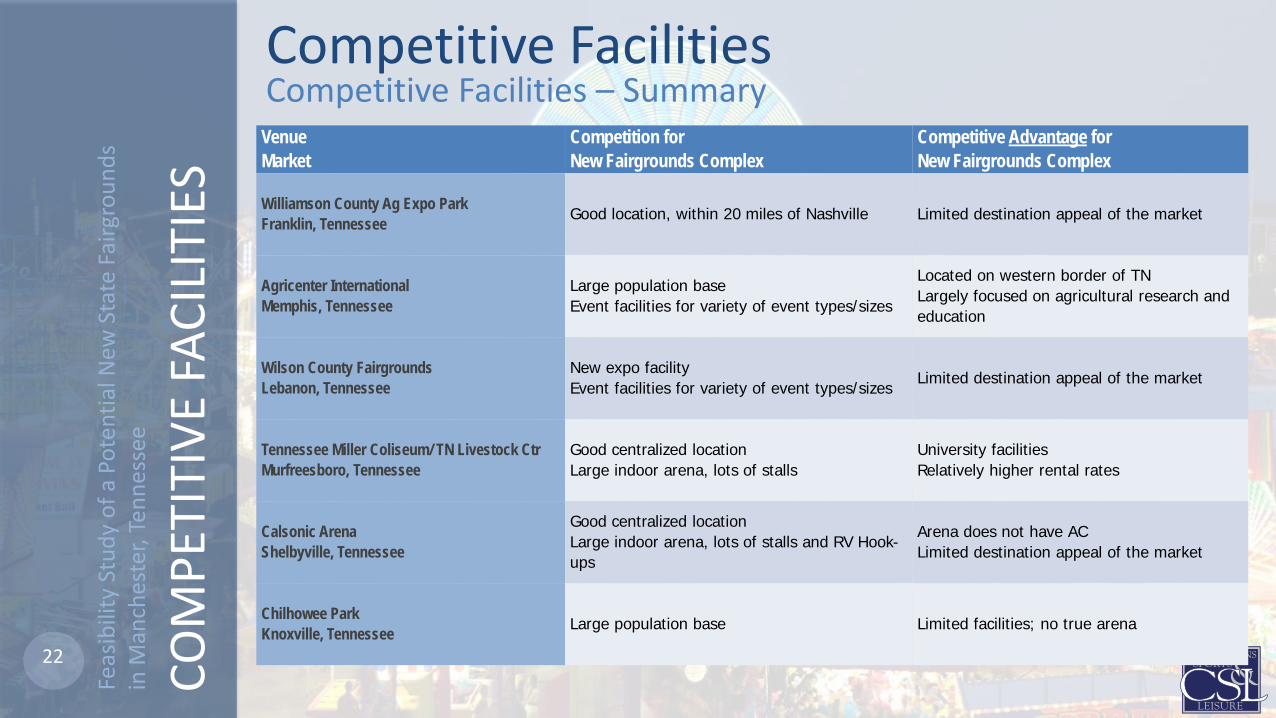
Competitive FacilitiesCompetitive Facilities – Summary
VenueMarket
Competition forNew Fairgrounds Complex
Competitive Advantage forNew Fairgrounds Complex
Williamson County Ag Expo ParkFranklin, Tennessee Good location, within 20 miles of Nashville Limited destination appeal of the market
Agricenter InternationalMemphis, Tennessee
Large population baseEvent facilities for variety of event types/sizes
Located on western border of TNLargely focused on agricultural research and education
Wilson County FairgroundsLebanon, Tennessee
New expo facility Event facilities for variety of event types/sizes Limited destination appeal of the market
Tennessee Miller Coliseum/ TN Livestock CtrMurfreesboro, Tennessee
Good centralized locationLarge indoor arena, lots of stalls
University facilitiesRelatively higher rental rates
Calsonic ArenaShelbyville, Tennessee
Good centralized locationLarge indoor arena, lots of stalls and RV Hook-ups
Arena does not have ACLimited destination appeal of the market
Chilhowee ParkKnoxville, Tennessee Large population base Limited facilities; no true arena

23
Feas
ibili
ty S
tudy
of a
Pot
entia
l New
Sta
te F
airg
roun
ds
in M
anch
este
r, Te
nnes
see
COM
PETI
TIVE
FAC
ILIT
IES % of Rank % of Rank
Low High Average Median Estimate Avg. (out of 8) Estimate Avg. (out of 8)
Population30-Minute Drive 85,700 971,000 472,100 399,000 85,702 18% 7 963,295 204% 260-Minute Drive 683,700 1,942,300 1,378,600 1,527,600 683,659 50% 7 1,942,261 141% 190-Minute Drive 1,643,600 2,762,300 2,338,100 2,438,500 2,497,532 107% 2 2,762,311 118% 1180-Minute Drive 5,102,200 9,510,600 7,817,300 7,917,200 8,636,432 110% 2 9,510,563 122% 1240-Minute Drive 11,168,500 22,159,600 17,512,900 17,656,600 19,092,445 109% 3 17,767,699 101% 4
Average Household Income30-Minute Drive $54,500 $104,300 $70,300 $66,900 $54,465 77% 8 $78,766 112% 260-Minute Drive $60,900 $76,100 $69,700 $71,100 $60,890 87% 8 $74,390 107% 290-Minute Drive $57,800 $72,700 $67,600 $68,900 $69,020 102% 4 $68,269 101% 6180-Minute Drive $58,300 $66,300 $62,100 $62,100 $66,296 107% 1 $62,182 100% 4240-Minute Drive $61,600 $67,900 $66,000 $66,600 $67,644 102% 2 $65,559 99% 6
Median Age30-Minute Drive 33.7 39.0 37.2 37.4 40.8 110% 1 36.3 98% 660-Minute Drive 36.1 41.3 37.0 36.6 35.9 97% 7 36.5 99% 590-Minute Drive 36.2 41.7 37.7 37.2 37.8 100% 2 36.8 98% 6180-Minute Drive 37.9 38.7 39.0 39.0 38.8 100% 6 39.0 100% 4240-Minute Drive 37.9 38.7 38.3 38.2 38.0 99% 4 38.5 101% 3
Corporate Base30-Minute Drive 3,700 39,000 21,500 18,500 3,702 17% 7 50,110 233% 160-Minute Drive 23,100 75,700 56,200 61,900 23,116 41% 7 81,187 144% 190-Minute Drive 63,600 109,300 95,300 100,900 109,269 115% 1 110,428 116% 1180-Minute Drive 195,400 343,600 307,300 311,300 343,615 112% 1 375,099 122% 1240-Minute Drive 446,000 897,000 704,800 713,600 771,954 110% 3 714,409 101% 4
Competitive Markets Proposed Manchester Site Existing Nashville Site
Competitive FacilitiesDemographics Comparison
Source: Esri, 2016

24
Feas
ibili
ty S
tudy
of a
Pot
entia
l New
Sta
te F
airg
roun
ds
in M
anch
este
r, Te
nnes
see
COM
PETI
TIVE
FAC
ILIT
IES
Market 30-minute 60-minute 90-minute 180-minute 240-minute
Nashville, TN - Existing Site 963,295 1,942,261 2,762,311 9,510,563 17,767,699Lebanon, TN 277,904 1,728,340 2,616,656 8,652,347 17,036,919Murfreesboro, TN 365,586 1,707,284 2,432,222 7,914,264 19,349,672Franklin, TN 432,349 1,634,010 2,444,845 7,920,234 15,982,709Memphis, TN 971,029 1,421,164 1,929,852 5,102,161 11,168,527Knoxville, TN 583,713 1,092,063 1,643,631 7,751,618 22,159,613Shelbyville, TN 97,037 820,365 2,377,407 7,050,483 17,545,542Manchester, TN - Proposed Site 85,702 683,659 2,497,532 8,636,432 19,092,445
Average 454,603 1,400,538 2,240,769 7,398,518 17,207,164Median 398,968 1,527,587 2,404,815 7,832,941 17,291,231
Manchester Rank (out of 8) 8 8 3 3 3
Competitive FacilitiesDemographics Comparison
Note: Sorted by 60-minute drive time. Average and medians do not include Manchester or Nashville population data. Source: Esri, 2016

25
Feas
ibili
ty S
tudy
of a
Pot
entia
l New
Sta
te F
airg
roun
ds
in M
anch
este
r, Te
nnes
see
COM
PETI
TIVE
FAC
ILIT
IES
Competitive Facilities2016 Fair Dates
Notes: Includes only fairs with 2015 attendance greater than 50,000.Source: IAFE, 2016
Sunday Monday Tuesday Wednesday Thursday Friday SaturdayAug 1 2 3 4 5 6
7 8 9 10 11 12 13
14 15 16 17 18 19 20
21 22 23 24 25 26 27
28 29 30 31 Sep 1 2 3
AUGUST 2016Sunday Monday Tuesday Wednesday Thursday Friday SaturdayAug 28 29 30 31 Sep 1 2 3
4 5 6 7 8 9 10
11 12 13 14 15 16 17
18 19 20 21 22 23 24
25 26 27 28 29 30 Oct 1
SEPTEMBER 2016
Williamson County Fair Franklin, TN Dyer County Fair Dyersburg, TNWilson County Fair Lebanon, TN Tennessee Valley Fair Knoxville, TNAppalachian Fair Gray, TN Tennessee State Fair Nashville, TNTN Walking Horse Celebration Shelbyville, TN Coffee County Fair Manchester, TNCumberland County Fair Crossville, TN Mid-South Fair Southaven, MSDelta Fair & Music Festival Memphis, TN Middle Tennessee District Fair Lawrenceburg, TN

26
Feas
ibili
ty S
tudy
of a
Pot
entia
l New
Sta
te F
airg
roun
ds
in M
anch
este
r, Te
nnes
see
COM
PETI
TIVE
FAC
ILIT
IES
Competitive FacilitiesTennessee Fairs 2015 Attendance
0
100,000
200,000
300,000
400,000
500,000
600,000
Average = 76,500Median = 34,400
Source: IAFE, 2016

27
Feas
ibili
ty S
tudy
of a
Pot
entia
l New
Sta
te F
airg
roun
ds
in M
anch
este
r, Te
nnes
see
COM
PARA
BLE
FACI
LITI
ES
Comparable FacilitiesComparable Facilities - Summary
Source: Facility Management, 2016

28
Feas
ibili
ty S
tudy
of a
Pot
entia
l New
Sta
te F
airg
roun
ds
in M
anch
este
r, Te
nnes
see
COM
PARA
BLE
FACI
LITI
ES
Comparable FacilitiesComparable Facilities - Summary
Contiguous IndoorEvent Enclosed Covered Outdoor Event Exhibit Event
Facility Buildings Arenas Arenas Arenas Barns Halls Space Space
South Carolina State Fairgrounds 17 2 0 0 8 7 36,000 138,350Ohio Expo Center 15 2 1 0 2 10 152,900 650,904The Meadow Event Park 9 0 1 4 1 3 63,354 66,242Fonner Park 11 3 0 1 5 2 80,000 88,000Kansas State Fairgrounds 21 3 1 0 5 12 40,800 207,850Indiana State Fairgrounds 17 1 0 0 1 15 147,050 699,150Arkansas State Fair Complex 18 1 1 1 11 4 26,300 93,300Kentucky Exposition Center 32 2 0 0 22 8 425,700 1,062,600Georgia National Fairgrounds and Agricenter 20 4 3 0 5 8 84,480 207,965Washington State Fair Events Center 16 1 1 0 5 9 82,972 232,747Missouri State Fairgrounds 26 2 2 1 11 10 19,400 83,740
Average 18 2 1 1 7 8 105,360 320,986Median 17 2 1 0 5 8 80,000 207,850
Source: Facility Management, 2016

29
Feas
ibili
ty S
tudy
of a
Pot
entia
l New
Sta
te F
airg
roun
ds
in M
anch
este
r, Te
nnes
see
COM
PARA
BLE
FACI
LITI
ES
Source: Facility Management, 2016
Comparable FacilitiesSize of Facilities Largest Indoor Arena
Largest Largest Secondary TertiaryIndoor Arena Indoor Arena Arena Arena
Facility Dimensions (ft.) Sq. Ft. Dimensions (ft.) Dimensions (ft.)
Fonner Park 240x125 30,000 215x110 1 210x102Georgia National Fairgrounds and Agricenter 250x125 31,250 250x125 250x125Washington State Fair Events Center 250x100 25,000 164x114 -The Meadow Event Park - - 240x120 300x150Missouri State Fairgrounds 174x118 20,532 190x104 220x80Kansas State Fairgrounds 270x98 26,500 187x95 110x53Arkansas State Fair Complex 240x120 28,800 240x120 120x80Kentucky Exposition Center 310x137 42,500 310x136 -Ohio Expo Center 225x112 25,200 187x76 300x128South Carolina State Fairgrounds 250x150 37,500 166x79 -Indiana State Fairgrounds 225x100 22,500 185x60 -
Average 243x119 28,978 212x104 216x103Median 245x119 27,650 190x110 220x102
Covered Arena
Outdoor Arena

30
Feas
ibili
ty S
tudy
of a
Pot
entia
l New
Sta
te F
airg
roun
ds
in M
anch
este
r, Te
nnes
see
COM
PARA
BLE
FACI
LITI
ES
Source: Facility Management, 2016
Comparable FacilitiesSummary of Total Indoor Event Space
Largest Contiguous IndoorEnclosed Indoor Arena Event Exhibit Event
Facility Arenas Sq. Ft Halls Space Space
Kentucky Exposition Center 2 42,500 8 425,700 1,062,600Ohio Expo Center 2 25,200 10 152,900 650,904Indiana State Fairgrounds 1 22,500 15 147,050 699,150Georgia National Fairgrounds and Agricenter 4 31,250 8 84,480 207,965Washington State Fair Events Center 1 25,000 9 82,972 232,747Fonner Park 3 30,000 2 80,000 88,000The Meadow Event Park 0 - 3 63,354 66,242Kansas State Fairgrounds 3 26,500 12 40,800 207,850South Carolina State Fairgrounds 2 37,500 7 36,000 138,350Arkansas State Fair Complex 1 28,800 4 26,300 93,300Missouri State Fairgrounds 2 20,532 10 19,400 83,740
Average 2 28,978 8 105,360 320,986Median 2 27,650 8 80,000 207,850

31
Feas
ibili
ty S
tudy
of a
Pot
entia
l New
Sta
te F
airg
roun
ds
in M
anch
este
r, Te
nnes
see
COM
PARA
BLE
FACI
LITI
ES% of Rank % of Rank
Low High Average Median Estimate Avg. (out of 8) Estimate Avg. (out of 8)
Population30-Minute Drive 85,700 971,000 472,100 399,000 85,702 18% 7 963,295 204% 260-Minute Drive 683,700 1,942,300 1,378,600 1,527,600 683,659 50% 7 1,942,261 141% 190-Minute Drive 1,643,600 2,762,300 2,338,100 2,438,500 2,497,532 107% 2 2,762,311 118% 1180-Minute Drive 5,102,200 9,510,600 7,817,300 7,917,200 8,636,432 110% 2 9,510,563 122% 1240-Minute Drive 11,168,500 22,159,600 17,512,900 17,656,600 19,092,445 109% 3 17,767,699 101% 4
Average Household Income30-Minute Drive $54,500 $104,300 $70,300 $66,900 $54,465 77% 8 $78,766 112% 260-Minute Drive $60,900 $76,100 $69,700 $71,100 $60,890 87% 8 $74,390 107% 290-Minute Drive $57,800 $72,700 $67,600 $68,900 $69,020 102% 4 $68,269 101% 6180-Minute Drive $58,300 $66,300 $62,100 $62,100 $66,296 107% 1 $62,182 100% 4240-Minute Drive $61,600 $67,900 $66,000 $66,600 $67,644 102% 2 $65,559 99% 6
Median Age30-Minute Drive 33.7 39.0 37.2 37.4 40.8 110% 1 36.3 98% 660-Minute Drive 36.1 41.3 37.0 36.6 35.9 97% 7 36.5 99% 590-Minute Drive 36.2 41.7 37.7 37.2 37.8 100% 2 36.8 98% 6180-Minute Drive 37.9 38.7 39.0 39.0 38.8 100% 6 39.0 100% 4240-Minute Drive 37.9 38.7 38.3 38.2 38.0 99% 4 38.5 101% 3
Corporate Base30-Minute Drive 3,700 39,000 21,500 18,500 3,702 17% 7 50,110 233% 160-Minute Drive 23,100 75,700 56,200 61,900 23,116 41% 7 81,187 144% 190-Minute Drive 63,600 109,300 95,300 100,900 109,269 115% 1 110,428 116% 1180-Minute Drive 195,400 343,600 307,300 311,300 343,615 112% 1 375,099 122% 1240-Minute Drive 446,000 897,000 704,800 713,600 771,954 110% 3 714,409 101% 4
Comparable Markets Proposed Manchester Site Existing Nashville Site
Comparable FacilitiesDemographics Comparison
Source: Esri, 2016

32
Feas
ibili
ty S
tudy
of a
Pot
entia
l New
Sta
te F
airg
roun
ds
in M
anch
este
r, Te
nnes
see
COM
PARA
BLE
FACI
LITI
ESMarket 30-minute 60-minute 90-minute 180-minute 240-minute
Puyallup, WA 1,164,440 2,973,517 4,208,081 7,657,203 8,972,499Columbus, OH 1,518,007 2,375,116 4,137,603 15,822,881 28,669,952Indianapolis, IN 1,296,378 2,218,268 3,364,461 15,705,006 29,685,563Nashville, TN - Existing Site 963,295 1,942,261 2,762,311 9,510,563 17,767,699Doswell, VA 415,753 1,585,146 3,491,907 15,090,626 22,441,053Louisville, KY 993,618 1,541,480 2,529,350 11,954,218 19,830,304Columbia, SC 535,105 997,288 2,185,926 11,074,317 21,969,686Little Rock, AR 457,063 906,622 1,224,054 4,166,390 7,549,166Manchester, TN - Proposed Site 85,702 683,659 2,497,532 8,636,432 19,092,445Hutchinson, KS 67,654 565,290 907,546 2,096,733 7,575,040Perry, GA 179,069 542,188 1,163,335 10,107,943 15,882,428Sedalia, MO 60,588 226,198 1,461,102 6,384,846 9,176,846Grand Island, NE 76,658 187,791 463,999 1,994,113 3,082,212
Average 614,939 1,283,537 2,285,215 9,277,661 15,894,068Median 457,063 997,288 2,185,926 10,107,943 15,882,428
Manchester Rank (out of 13) 10 9 7 8 6
Comparable FacilitiesPopulation Comparison
Note: Sorted by 60-minute drive time. Average and medians do not include Manchester or Nashville population data. Source: Esri, 2016

33
Feas
ibili
ty S
tudy
of a
Pot
entia
l New
Sta
te F
airg
roun
ds
in M
anch
este
r, Te
nnes
see
COM
PARA
BLE
FACI
LITI
ES
Comparable Facilities2015 State Fair Attendance
0
200,000
400,000
600,000
800,000
1,000,000
1,200,000
1,400,000
1,600,000
1,800,000
2,000,000
Average = 558,300Median = 438,800
(1) Georgia National FairSource: IAFE, 2016

34
Feas
ibili
ty S
tudy
of a
Pot
entia
l New
Sta
te F
airg
roun
ds
in M
anch
este
r, Te
nnes
see
COM
PARA
BLE
FACI
LITI
ES
10
8
11
34
5
7 9
1
Key Facility1 Einhusen Arena2 Five Points Bank Arena3 Thompson Foods Indoor Arena4 Thompson Foods Open Air Arena5 Pinnacle Bank Expo Center6 Bosselman Conference Center7 Big Red Barn8 Cattle Barn9 Horse Barns
10 Sheep Barn11 Swine Barn and Arena6
2 Note: Nebraska State Fair buildings include the Five Points Bank Arena, Pinnacle Bank Expo Center, the sheep and cattle barn and the swine barn and arena.
Comparable FacilitiesFonner Park – Grand Island, Nebraska
35
Feas
ibili
ty S
tudy
of a
Pot
entia
l New
Sta
te F
airg
roun
ds
in M
anch
este
r, Te
nnes
see
COM
PARA
BLE
FACI
LITI
ES
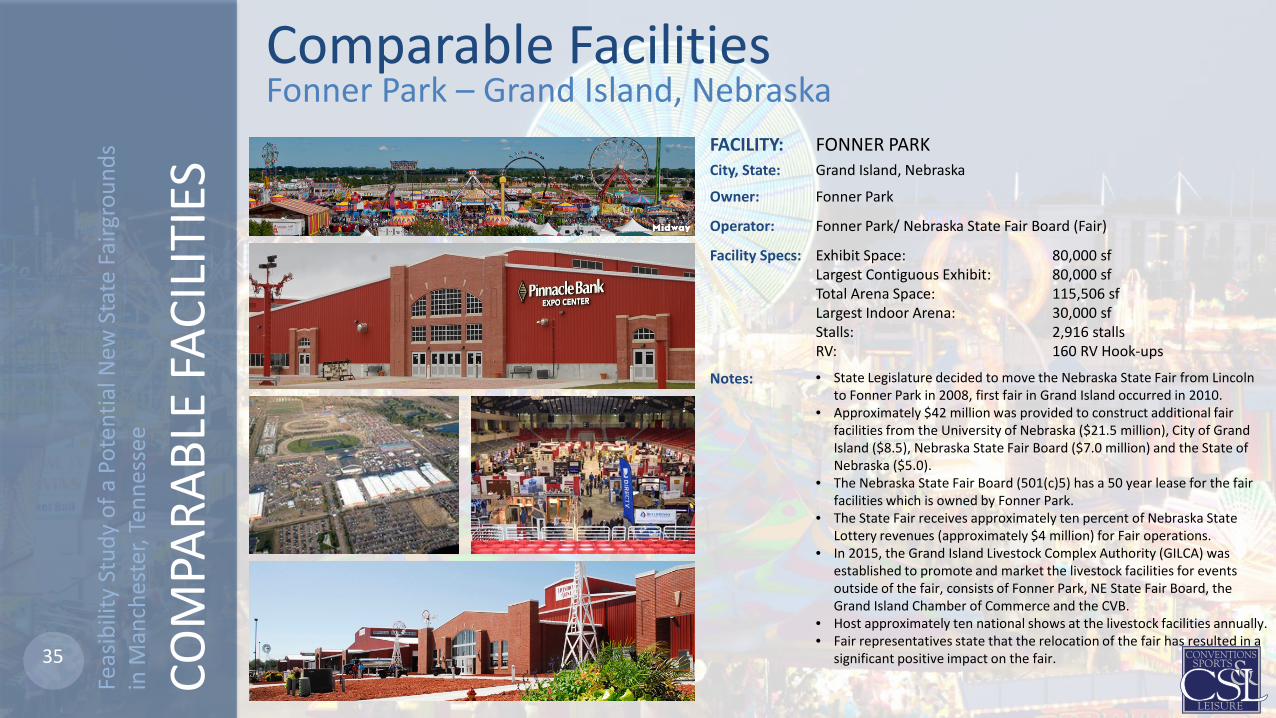
Comparable FacilitiesFACILITY: FONNER PARKCity, State: Grand Island, Nebraska
Owner: Fonner Park
Operator: Fonner Park/ Nebraska State Fair Board (Fair)
Facility Specs: Exhibit Space:Largest Contiguous Exhibit:Total Arena Space:Largest Indoor Arena:Stalls:RV:
80,000 sf80,000 sf115,506 sf30,000 sf2,916 stalls160 RV Hook-ups
Notes: • State Legislature decided to move the Nebraska State Fair from Lincoln to Fonner Park in 2008, first fair in Grand Island occurred in 2010.
• Approximately $42 million was provided to construct additional fair facilities from the University of Nebraska ($21.5 million), City of Grand Island ($8.5), Nebraska State Fair Board ($7.0 million) and the State of Nebraska ($5.0).
• The Nebraska State Fair Board (501(c)5) has a 50 year lease for the fair facilities which is owned by Fonner Park.
• The State Fair receives approximately ten percent of Nebraska State Lottery revenues (approximately $4 million) for Fair operations.
• In 2015, the Grand Island Livestock Complex Authority (GILCA) was established to promote and market the livestock facilities for events outside of the fair, consists of Fonner Park, NE State Fair Board, the Grand Island Chamber of Commerce and the CVB.
• Host approximately ten national shows at the livestock facilities annually.• Fair representatives state that the relocation of the fair has resulted in a
significant positive impact on the fair.
Fonner Park – Grand Island, Nebraska

36
Feas
ibili
ty S
tudy
of a
Pot
entia
l New
Sta
te F
airg
roun
ds
in M
anch
este
r, Te
nnes
see
COM
PARA
BLE
FACI
LITI
ESKey Facility
1 Paulhamus Arena2 Show Arena3 Agriplex4 Centennial Building5 Expo Hall6 Fair Food Court7 Fair View Club8 Meeting Rooms9 Pavilion
10 Sleep Train Showplex11 Washington State Fair Farm12 Barn Complex13 Beef Barn
10
5
12
13
24
3
9
7
6
Comparable FacilitiesWashington State Fairgrounds – Puyallup, WA

37
Feas
ibili
ty S
tudy
of a
Pot
entia
l New
Sta
te F
airg
roun
ds
in M
anch
este
r, Te
nnes
see
COM
PARA
BLE
FACI
LITI
ES
Comparable FacilitiesFACILITY: WASHINGTON STATE FAIRGROUNDSCity, State: Puyallup, Washington
Owner:
Operator: Western Washington Fair Association
Facility Specs: Exhibit Space:Largest Contiguous Exhibit:Total Arena Space:Largest Indoor Arena:Stalls:RV:
215,300 sf83,000 sf43,700 sf25,000 sf258 Stalls100 RV Hook-ups
Notes: • In 2013, The Puyallup Fair was rebranded to the Washington StateFair.
• Name change has helped with marketing efforts and increasedsponsorship.
• Have seen an approximate 3 percent annual growth in sponsorshipsince rebranding.
• In 2016, they extended their fair to 21 days.• Annually host an average of 150 to 160 non-fair events, with strong
growth in recent years.• Approximately 75 percent of non-fair events are returning events
from years prior.• In 2016, the 12,000 sf Arena and 22,000 Agriplex opened at a total
cost of approximately $7.4 million
Washington State Fairgrounds – Puyallup, WA
38
Feas
ibili
ty S
tudy
of a
Pot
entia
l New
Sta
te F
airg
roun
ds
in M
anch
este
r, Te
nnes
see
COM
PARA
BLE
FACI
LITI
ES
2
1
3
4 5
9
7
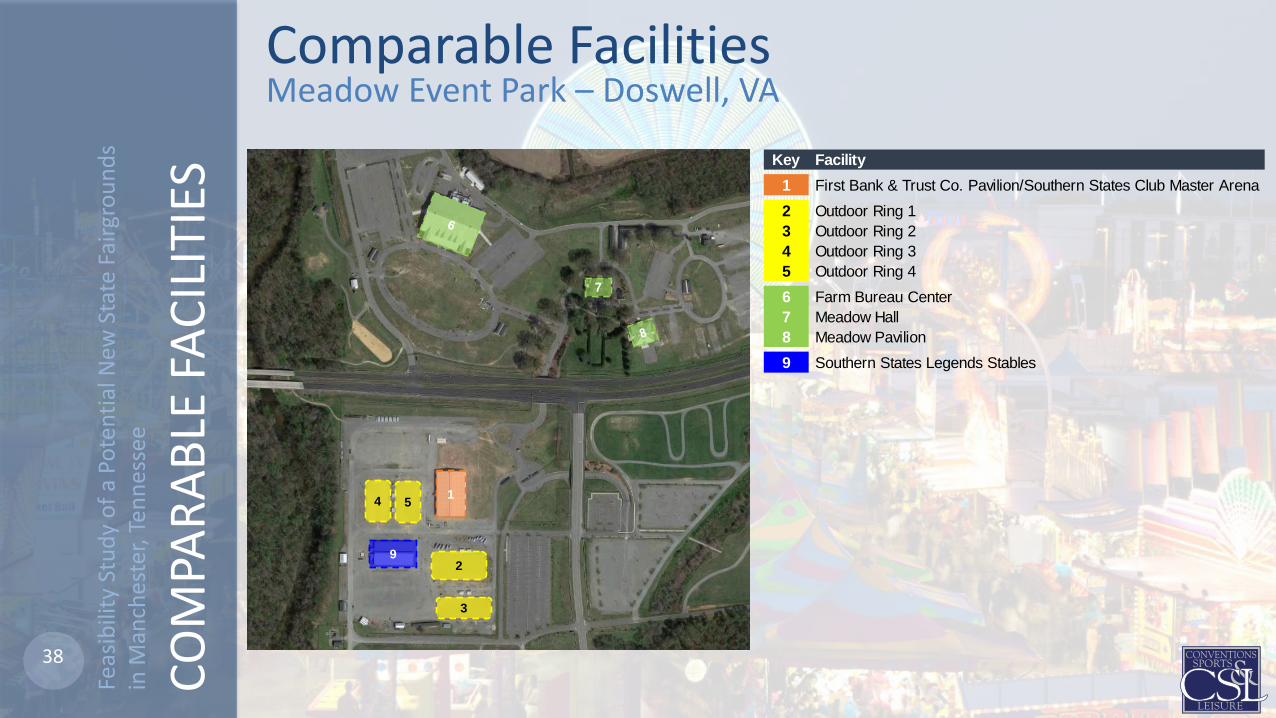
Key Facility1 First Bank & Trust Co. Pavilion/Southern States Club Master Arena2 Outdoor Ring 13 Outdoor Ring 24 Outdoor Ring 35 Outdoor Ring 46 Farm Bureau Center7 Meadow Hall8 Meadow Pavilion9 Southern States Legends Stables
Comparable FacilitiesMeadow Event Park – Doswell, VA
39
Feas
ibili
ty S
tudy
of a
Pot
entia
l New
Sta
te F
airg
roun
ds
in M
anch
este
r, Te
nnes
see
COM
PARA
BLE
FACI
LITI
ES
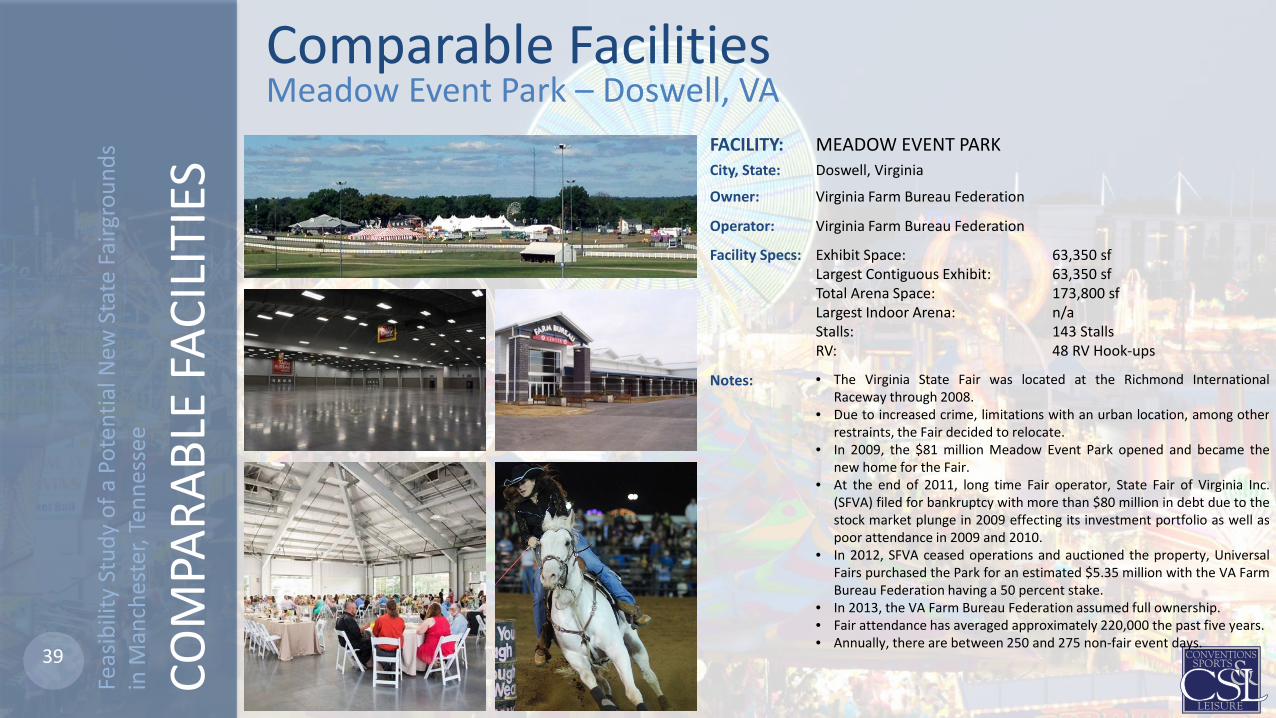
Comparable FacilitiesFACILITY: MEADOW EVENT PARKCity, State: Doswell, Virginia
Owner: Virginia Farm Bureau Federation
Operator: Virginia Farm Bureau Federation
Facility Specs: Exhibit Space:Largest Contiguous Exhibit:Total Arena Space:Largest Indoor Arena:Stalls:RV:
63,350 sf63,350 sf173,800 sfn/a143 Stalls48 RV Hook-ups
Notes: • The Virginia State Fair was located at the Richmond InternationalRaceway through 2008.
• Due to increased crime, limitations with an urban location, among otherrestraints, the Fair decided to relocate.
• In 2009, the $81 million Meadow Event Park opened and became thenew home for the Fair.
• At the end of 2011, long time Fair operator, State Fair of Virginia Inc.(SFVA) filed for bankruptcy with more than $80 million in debt due to thestock market plunge in 2009 effecting its investment portfolio as well aspoor attendance in 2009 and 2010.
• In 2012, SFVA ceased operations and auctioned the property, UniversalFairs purchased the Park for an estimated $5.35 million with the VA FarmBureau Federation having a 50 percent stake.
• In 2013, the VA Farm Bureau Federation assumed full ownership.• Fair attendance has averaged approximately 220,000 the past five years.• Annually, there are between 250 and 275 non-fair event days.
Meadow Event Park – Doswell, VA
40
Feas
ibili
ty S
tudy
of a
Pot
entia
l New
Sta
te F
airg
roun
ds
in M
anch
este
r, Te
nnes
see
COM
PARA
BLE
FACI
LITI
ES
3
17
5
1411610
11
1512
1319
2
6
18
7 4
8
20
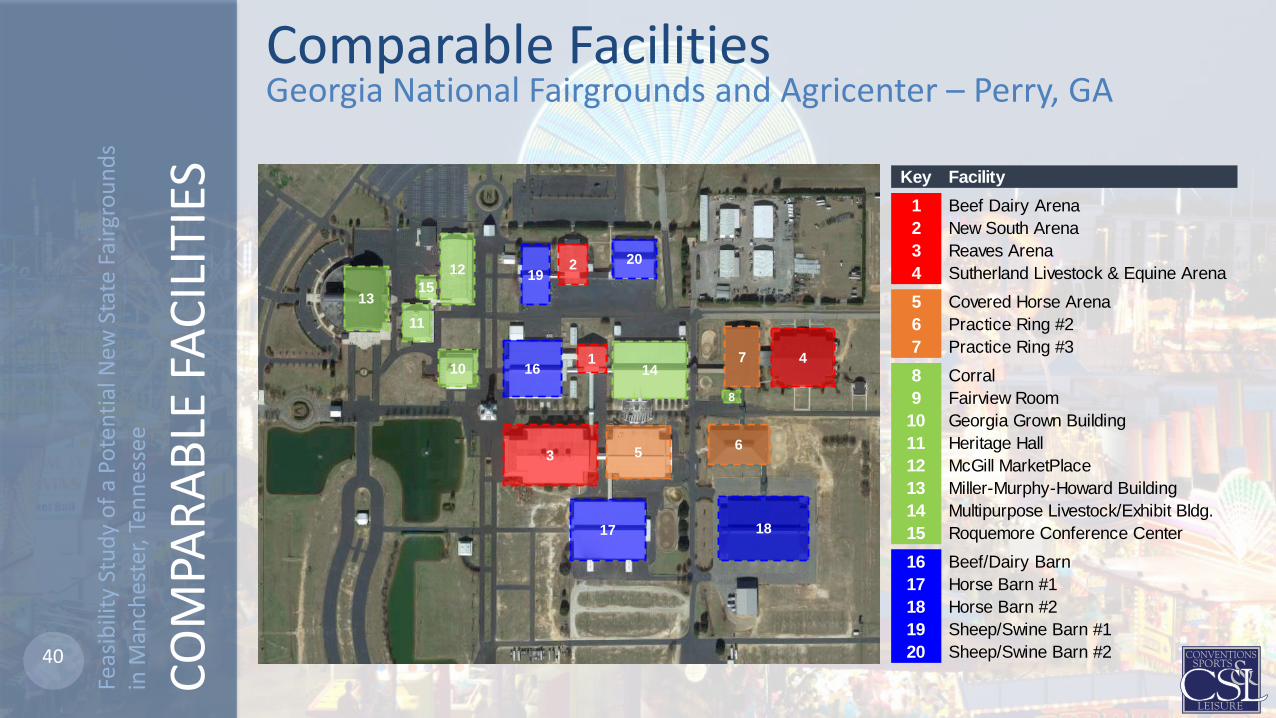
Key Facility1 Beef Dairy Arena2 New South Arena3 Reaves Arena4 Sutherland Livestock & Equine Arena5 Covered Horse Arena6 Practice Ring #27 Practice Ring #38 Corral9 Fairview Room
10 Georgia Grown Building11 Heritage Hall12 McGill MarketPlace13 Miller-Murphy-Howard Building14 Multipurpose Livestock/Exhibit Bldg.15 Roquemore Conference Center16 Beef/Dairy Barn17 Horse Barn #118 Horse Barn #219 Sheep/Swine Barn #120 Sheep/Swine Barn #2
Comparable FacilitiesGeorgia National Fairgrounds and Agricenter – Perry, GA

41
Feas
ibili
ty S
tudy
of a
Pot
entia
l New
Sta
te F
airg
roun
ds
in M
anch
este
r, Te
nnes
see
COM
PARA
BLE
FACI
LITI
ES
Comparable FacilitiesFACILITY: GEORGIA NATIONAL FAIRGROUNDS AND AGRICENTERCity, State: Perry, Georgia
Owner: State of Georgia
Operator: Georgia Agricultural Exposition Authority
Facility Specs: Exhibit Space:Largest Contiguous Exhibit:Total Arena Space:Largest Indoor Arena:Stalls:RV:
201,900 sf84,500 sf152,850 sf31,250 sf1,610 Stalls300 RV Hook-ups
Notes: • Fairgrounds opened in 1990 at a total cost of approximately $25 million funded through issuance of bonds by the State.
• Because the fairgrounds is State owned and paid for through State issued bonds, the fairgrounds cannot have major sponsorships and also does not serve alcohol.
• Purpose of the development was to create an agricultural facility to better serve state’s youth, agricultural organizations, among others.
• In 2016, the 11-day fair attracted approximately 536,800 attendees.
• Fair generates an estimated $80 million annual impact to the area.• There are more than 400 non-fair events drawing more than
500,000 visitors at the Fairgrounds annually, a majority of which are equestrian events.
Georgia National Fairgrounds and Agricenter – Perry, GA

42
Feas
ibili
ty S
tudy
of a
Pot
entia
l New
Sta
te F
airg
roun
ds
in M
anch
este
r, Te
nnes
see
COM
PARA
BLE
FACI
LITI
ES
Comparable FacilitiesGeorgia National Fairgrounds and Agricenter – Perry, GA
The Georgia National Fairgrounds and Agricenter (GNFA) opened in June of 1990 at an approximate cost of $25 million. Prior to that, Macon County Fairgrounds served as the main agricultural facility in the state and home to the Georgia State Fair. In the early 1980’s state leaders felt the facilities in Macon were no longer sufficient and determined the need to study the feasibility of upgrading those facilities or to build a new fairgrounds to better serve the state’s youth, agricultural organizations and other events and activities.
Legislators felt that a more rural location with easy interstate access offered the greatest opportunity, and decided that investing in a new complex in Perry, approximately 30 miles from Macon and 100 miles from Atlanta, was the most feasible option.
The City of Perry and Houston County purchased land off of Interstate-75 at approximately $1.15 million ($575,000 each) and deeded it to the State of Georgia. Funding for the $25 million complex was paid for by the State through the issuance of bonds. Since its opening in 1990, the Fairgrounds and Agricenter have invested nearly $20 million to expand the complex and are currently considering an additional expansion that would include a new multipurpose equine facility.
GNFA is owned by the State of Georgia and operated by the Georgia Agricultural Exposition Authority, an authority of the State created in 1985 established to:
• Showcase Georgia’s agricultural/agribusiness;• Promote the agricultural achievements of Georgia’s youth;• Provide a center for diverse activities to benefit the state’s economy; and,• To stage and promote a statewide fair to accomplish one or more of the above.
In addition to managing the GNFA, the Authority also operates the annual Georgia National Fair. The first Georgia National Fair was held in 1990 and drew approximately 150,000 attendees. Since its inaugural year, the 11-day Fair has continued to grow, drawing in excess of 536,000 attendees and more than 400 exhibitors and staff in 2016. Further, in 2016, the Fair generated more than $550,000 in revenues.
While not Georgia’s official State Fair, the Georgia National Fair’s has become significantly more successful. In 2012, the Georgia State Fair located at the fairgrounds in Macon generated attendance levels of approximately 40,000. This low attendance caused the State Fair to be purchased and relocated to the Atlanta Motor Speedway, 30 miles outside of downtown Atlanta.
In addition to the Georgia National Fair, the GNFA has more than 400 additional event days throughout the year, drawing attendance in excess of 500,000. Due to the size and number of facilities, the GNFA typically has three to four events going on simultaneously. The largest number of events annually are equestrian.The GNFA’s annual budget is approximately $10 million, of which, approximately $5.5 million is dedicated to the operations of the annual fair.
43
Feas
ibili
ty S
tudy
of a
Pot
entia
l New
Sta
te F
airg
roun
ds
in M
anch
este
r, Te
nnes
see
MAR
KET
DEM
AND
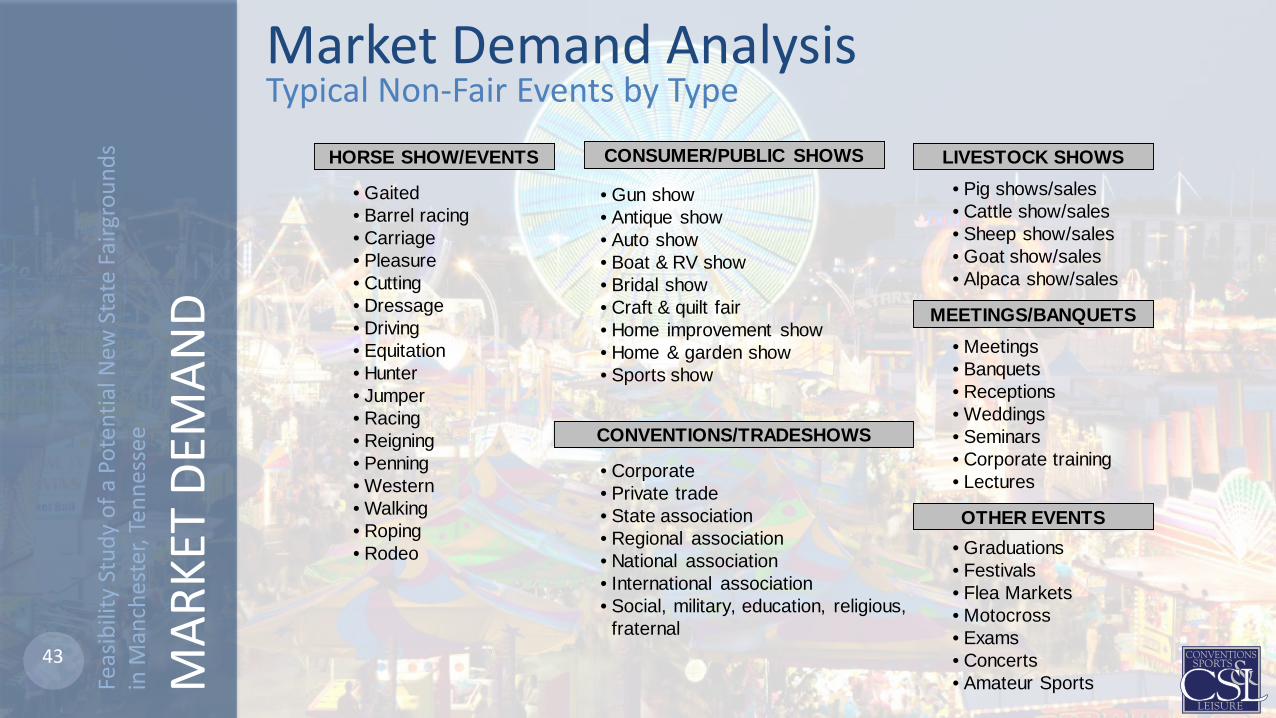
Market Demand AnalysisTypical Non-Fair Events by Type
• Corporate • Private trade• State association• Regional association• National association• International association• Social, military, education, religious,
fraternal
• Gaited• Barrel racing• Carriage• Pleasure• Cutting• Dressage• Driving• Equitation• Hunter• Jumper• Racing• Reigning• Penning• Western• Walking• Roping• Rodeo
HORSE SHOW/EVENTS
• Gun show• Antique show• Auto show• Boat & RV show• Bridal show• Craft & quilt fair• Home improvement show• Home & garden show• Sports show
OTHER EVENTS• Graduations• Festivals• Flea Markets• Motocross• Exams• Concerts• Amateur Sports
MEETINGS/BANQUETS• Meetings• Banquets• Receptions• Weddings• Seminars• Corporate training• Lectures
CONVENTIONS/TRADESHOWS
CONSUMER/PUBLIC SHOWS• Pig shows/sales• Cattle show/sales• Sheep show/sales• Goat show/sales• Alpaca show/sales
LIVESTOCK SHOWS
44
Feas
ibili
ty S
tudy
of a
Pot
entia
l New
Sta
te F
airg
roun
ds
in M
anch
este
r, Te
nnes
see
MAR
KET
DEM
AND
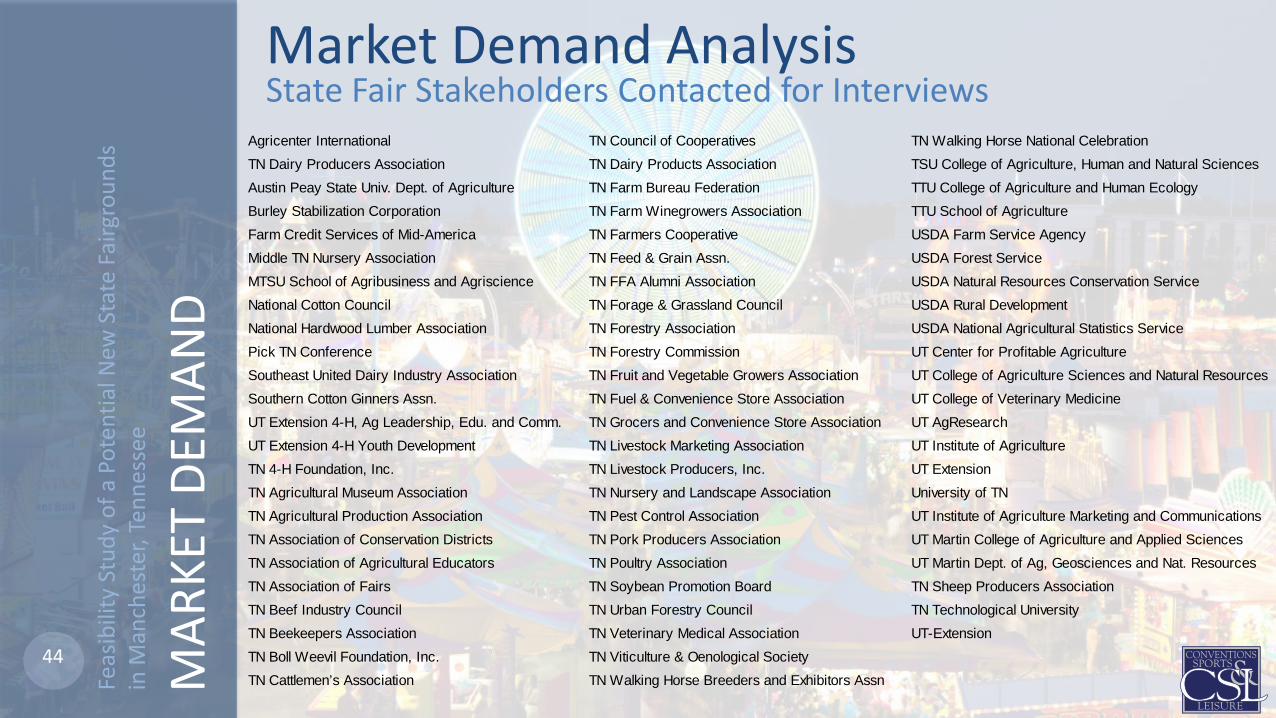
Market Demand AnalysisState Fair Stakeholders Contacted for Interviews
Agricenter International TN Council of Cooperatives TN Walking Horse National CelebrationTN Dairy Producers Association TN Dairy Products Association TSU College of Agriculture, Human and Natural SciencesAustin Peay State Univ. Dept. of Agriculture TN Farm Bureau Federation TTU College of Agriculture and Human EcologyBurley Stabilization Corporation TN Farm Winegrowers Association TTU School of Agriculture Farm Credit Services of Mid-America TN Farmers Cooperative USDA Farm Service AgencyMiddle TN Nursery Association TN Feed & Grain Assn. USDA Forest ServiceMTSU School of Agribusiness and Agriscience TN FFA Alumni Association USDA Natural Resources Conservation ServiceNational Cotton Council TN Forage & Grassland Council USDA Rural DevelopmentNational Hardwood Lumber Association TN Forestry Association USDA National Agricultural Statistics ServicePick TN Conference TN Forestry Commission UT Center for Profitable AgricultureSoutheast United Dairy Industry Association TN Fruit and Vegetable Growers Association UT College of Agriculture Sciences and Natural ResourcesSouthern Cotton Ginners Assn. TN Fuel & Convenience Store Association UT College of Veterinary MedicineUT Extension 4-H, Ag Leadership, Edu. and Comm. TN Grocers and Convenience Store Association UT AgResearchUT Extension 4-H Youth Development TN Livestock Marketing Association UT Institute of Agriculture TN 4-H Foundation, Inc. TN Livestock Producers, Inc. UT ExtensionTN Agricultural Museum Association TN Nursery and Landscape Association University of TN TN Agricultural Production Association TN Pest Control Association UT Institute of Agriculture Marketing and CommunicationsTN Association of Conservation Districts TN Pork Producers Association UT Martin College of Agriculture and Applied SciencesTN Association of Agricultural Educators TN Poultry Association UT Martin Dept. of Ag, Geosciences and Nat. ResourcesTN Association of Fairs TN Soybean Promotion Board TN Sheep Producers AssociationTN Beef Industry Council TN Urban Forestry Council TN Technological UniversityTN Beekeepers Association TN Veterinary Medical Association UT-ExtensionTN Boll Weevil Foundation, Inc. TN Viticulture & Oenological SocietyTN Cattlemen’s Association TN Walking Horse Breeders and Exhibitors Assn
45
Feas
ibili
ty S
tudy
of a
Pot
entia
l New
Sta
te F
airg
roun
ds
in M
anch
este
r, Te
nnes
see
MAR
KET
DEM
AND
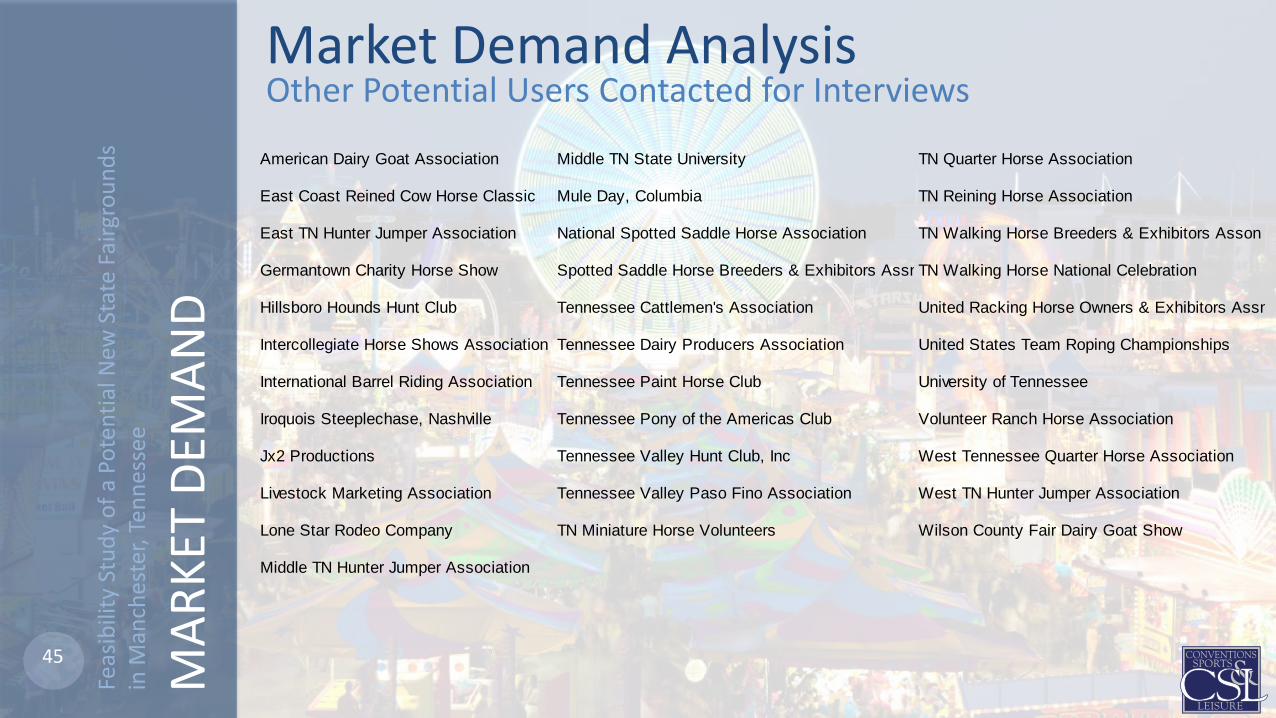
American Dairy Goat Association Middle TN State University TN Quarter Horse Association
East Coast Reined Cow Horse Classic Mule Day, Columbia TN Reining Horse Association
East TN Hunter Jumper Association National Spotted Saddle Horse Association TN Walking Horse Breeders & Exhibitors Asson
Germantown Charity Horse Show Spotted Saddle Horse Breeders & Exhibitors AssnTN Walking Horse National Celebration
Hillsboro Hounds Hunt Club Tennessee Cattlemen's Association United Racking Horse Owners & Exhibitors Assn
Intercollegiate Horse Shows Association Tennessee Dairy Producers Association United States Team Roping Championships
International Barrel Riding Association Tennessee Paint Horse Club University of Tennessee
Iroquois Steeplechase, Nashville Tennessee Pony of the Americas Club Volunteer Ranch Horse Association
Jx2 Productions Tennessee Valley Hunt Club, Inc West Tennessee Quarter Horse Association
Livestock Marketing Association Tennessee Valley Paso Fino Association West TN Hunter Jumper Association
Lone Star Rodeo Company TN Miniature Horse Volunteers Wilson County Fair Dairy Goat Show
Middle TN Hunter Jumper Association
Market Demand AnalysisOther Potential Users Contacted for Interviews

46
Feas
ibili
ty S
tudy
of a
Pot
entia
l New
Sta
te F
airg
roun
ds
in M
anch
este
r, Te
nnes
see
MAR
KET
DEM
AND
Market Demand AnalysisTennessee State Fair
• Oversees mules, beef, dairy, poultry, rabbits and all other shows• Not enough parking and/or marshalling area• Not enough barns and show rings to accommodate all exhibitors from all breeds/species• Need improved electricity, water and drainage• Outdoor Equestrian Arena essentially a stop-gap solution; no stalling, so they can only hold smaller, one-day shows• Could go up to one-hour outside of Nashville with minimal impact on exhibitor attendance
Livestock Superintendent
Equestrian Superintendent
• Need an indoor horse show arena – ideally with seating for 5,000 to 8,000; something similar to Calsonic Arena in Shelbyville or MTSU’s Miller Coliseum on Murfreesboro
• Need access to 500 stalls in an enclosed building with HVAC; potential to add another 500 temporary stalls for future growth of the Fair and other year-round non-Fair events
• Covered warm-up ring of similar size to main indoor ring• Large outdoor ring large enough to host two concurrent small to medium-sized events• Covered grandstand that can hold 8,000 to 10,000 people• Parking for 100 trucks and livestock trailers• 50 to 75 RV hook-ups• Indoor mule-pulling barn/shed; approximately 500’ x 100’ would be wide enough for seating.• Getting exhibitors to the Fairgrounds for Fair and non-Fair events would not be the problem; getting attendees to
drive out to Manchester would be the concern

47
Feas
ibili
ty S
tudy
of a
Pot
entia
l New
Sta
te F
airg
roun
ds
in M
anch
este
r, Te
nnes
see
MAR
KET
DEM
AND
Market Demand AnalysisTennessee State Fair
• Currently house dairy, swine, beef and sheep competition during State Fair, but have to host equine show elsewhere• Want all events on-site at same time (over the course of 2-4 days)• Potential opportunity to host additional year-round FFA events between September and April• Could grow existing FFA Ham Breakfast event from 500 attendees (maximum capacity due to space limitations) up
to 1,000 attendees• Need indoor arena with 1,000 to 1,500 seats and a secondary warm-up show ring with limited seating
Future Farmers of America (FFA)
Tennessee Farm Bureau
• State Fair is an opportunity to educate people on agriculture• Need areas where public can interact with animals and exhibitors• Need 4 total show rings for Equine, Dairy/Beef, Goats/Sheep and Pigs/Swine• Need 6 total indoor barns for Sheep/Goats, Swine, Poultry, Rabbits, Bovine (plus access to a tie-out area outside)
and Equine• Super Barn concept would work, assuming sufficient space were available

48
Feas
ibili
ty S
tudy
of a
Pot
entia
l New
Sta
te F
airg
roun
ds
in M
anch
este
r, Te
nnes
see
MAR
KET
DEM
AND
Tennessee 4-H
• Have never viewed current location as a State Fair site; use Wilson County Fairgrounds and MTSU Livestock Event Center for past events
• Able to host single-species shows, not multiple species shows concurrently due to space limitations• Need a main show ring of 300’ x 150’ with between 1,000 and 1,500 seats; beef shows could also use this ring for 2
or 3 concurrently running shows• Two more warm-up rings of 250’ - 200’ x 125’ – 100’• Approximately 100 to 150 horse stalls• 3-4 large buildings for species barns – Super Barn concept may be an option worth considering• Entrants from 2016 State shows, by species, that would likely move to a newly developed State Fair complex
include:• Hog – 615• Knoxville Spring Cattle – 128• Horse – 402• Beef – 443• Sheep – 646• Goat – 197
• Approximately 50,000 sf of exhibit space for non-animal contests/judging of speeches, project work displays, clothing/textiles, etc.
Market Demand AnalysisTennessee State Fair

49
Feas
ibili
ty S
tudy
of a
Pot
entia
l New
Sta
te F
airg
roun
ds
in M
anch
este
r, Te
nnes
see
MAR
KET
DEM
AND
Market Demand AnalysisTennessee State Fair
• Carnival rides, games and some food• Limited with existing power lines• They currently operate 30 rides in Tennessee, compared to 80+ in Indiana and Mississippi• Believes they would quickly increase ride capacity to 40 rides, requiring approximately 15 acres of space (depending
on the exact nature and structure of the various rides)• 20-25 percent would be dedicated kids rides• 50 percent would be adult/kids rides• 20 percent would be thrill-rides (teenagers/adults only)• Would like to bring in a new/bigger/better roller coaster
• Need investment into management and marketing of the State Fair; not just in infrastructure
Carnival Operator
Creative Arts Superintendent
• Trying to work toward having more of a Maker Faire feel; antiques too closely resemble Flea Market wares• Maxed out of space within Creative Arts Building• Views Fair as more of a Davidson County fair than a true State Fair; moving too far from Nashville/Davidson County
could significantly sacrifice participation and attendance rates. Manchester too far. I-840 corridor would work okay.• Lots of Davidson County school kids will attend State Fair on a field trip

50
Feas
ibili
ty S
tudy
of a
Pot
entia
l New
Sta
te F
airg
roun
ds
in M
anch
este
r, Te
nnes
see
MAR
KET
DEM
AND
General Comments
• Need access to a sufficient workforce to operate a State Fair• Need access to adequate supply of medical support facilities• Will draw exhibitors from FL, AL, KY, GA, TX, AZ and NM• Estimated that most State Fair attendees live within 50 miles of the complex• Need to invest in management and marketing the complex; not just facilities
Market Demand AnalysisTennessee Statewide Agricultural Industry Leadership
Timing of Fair
• Concept of State Fair being the ultimate goal of exhibitors attending County Fairs – may need to consider new dates for State Fair – potentially early October
• Somewhat difficult to get kids out of school to attend Fair; however, already have a number of prominent county fairs that occur throughout September
• Many schools will have field trips to State Fair; moving too far away from significant population base may minimize opportunity to market to this demographic

51
Feas
ibili
ty S
tudy
of a
Pot
entia
l New
Sta
te F
airg
roun
ds
in M
anch
este
r, Te
nnes
see
MAR
KET
DEM
AND
Programming
• Potential Agricultural Innovation and Entrepreneurship event• Convention-like atmosphere with general sessions• Static exhibits to display newest technology in farming• Can attract visitors directly involved in ag-related activities and those looking to reconnect with the historical
significance of farming• Hands-on exhibits and activities:
• Simulated milking station• Farm-to-table walkthrough exhibit geared toward young children• Tiny Acres simulating farmer’s activities• Ag in the Classroom• Petting zoo
• Need more and improved opportunities for attendees to directly interact with horses, livestock and other animals throughout the Fairgrounds
• Monster Truck shows seem to draw a crowd• If demographic profile of location indicates an opportunity, consider developing an enclosed pavilion that could easily
open up during the summer months (overhead garage doors, etc.) for a year-round Farmer’s Market.
Market Demand AnalysisTennessee Statewide Agricultural Industry Leadership

52
Feas
ibili
ty S
tudy
of a
Pot
entia
l New
Sta
te F
airg
roun
ds
in M
anch
este
r, Te
nnes
see
MAR
KET
DEM
AND
Location
• Location on I-840 loop would be ideal (however, need to avoid competition with Williamson and Wilson County Fairs)• Manchester cited as a viable, though not ideal, location• “State Fair” is viewed by many as the Davidson County Fair. Relocating too far from Nashville/Davidson County
risks alienating a base of attendees, which may result in the spin-off of a more urban fair offering more of a carnival-like atmosphere with rides, games, kitschy entertainment and attractions and concert acts. While not directly competing for animal show exhibitors and/or attendees directly interested in ag-related activities, this may have a substantial impact on the marketability of the Fair as a whole.
• Will be important to pursue sponsorship opportunities. However, Manchester location may limit opportunities due to geographic location and a marginalized opportunity to attract an array of different attendee profiles
• Coffee County (Manchester) has a strong County Fair• No County Fair in Rutherford County (Murfreesboro)• General sense that there are more attendees and/or potential future attendees from east of Nashville than from the
west
Market Demand AnalysisTennessee Statewide Agricultural Industry Leadership

53
Feas
ibili
ty S
tudy
of a
Pot
entia
l New
Sta
te F
airg
roun
ds
in M
anch
este
r, Te
nnes
see
MAR
KET
DEM
AND
Market Demand AnalysisTennessee Reining Horse Association
• Not critical for a potential new complex to remain in Nashville/Davidson County• Would prefer a central location within the state to better allow for them to continue to draw from regional states• Anywhere between current Nashville Fairgrounds location south to Chattanooga would not effect their events as far
east as Knoxville• Less interest in a complex too far west of Nashville
Location Consideration
Previous/Current Facilities
Tennessee Miller Coliseum (Murfreesboro, TN): • Host two events annually• Great facilities, not enough stalls, high facility rental costs
Roane State CC Expo Center (Harriman, TN):• Host two to three shows annually• Not an ideal facility for their events – They need a more shallow ground than what is currently available and the
facility has not been well kept
• Produce four to five horse shows annually• Horse shows typically run five days from Wednesday through Sunday in March, May, June/July, August and October• Have between 250 and 450 horses per show, with an average of 2 to 4 people traveling per horse• Majority of their participants are from within the state, but they also pull from AR, FL, IN, KY, OK and TX• Approximately 60 to 70 percent of attendees require a hotel room
Event Characteristics

54
Feas
ibili
ty S
tudy
of a
Pot
entia
l New
Sta
te F
airg
roun
ds
in M
anch
este
r, Te
nnes
see
MAR
KET
DEM
AND
Market Demand AnalysisTennessee Reining Horse Association
• Arena:• Three arenas, at least one indoor, the other two can be covered• Preference for indoor arenas• Typically use two arenas for showing and one for warming up, the show arena dimensions need to be 300’x150’• Type of ground is critical for their events; need a shallow ground• Seating is not important• Need additional area near the arena where vendors can set up booths
• Stalls:• For their smaller events, need approximately 250 permanent stalls• Larger events require 400 to 450 permanent stalls
• RV/Lodging:• Need approximately 150 RV hook-ups with water to accommodate their events, though leadership projects that
closer to 300 would be regularly utilized at the complex• Additional hook-ups right outside of arena• Hotel with a minimum room count of 150 rooms
• Other Requirements:• Concessions that serve breakfast and lunch• Bathrooms and showers in the barns
Facility Requirements
Potential Usage
• Would definitely utilize a new complex• Would look to bring a minimum of four, potentially all five horse shows annually• No real opportunity to create new events beyond five existing events
55
Feas
ibili
ty S
tudy
of a
Pot
entia
l New
Sta
te F
airg
roun
ds
in M
anch
este
r, Te
nnes
see
MAR
KET
DEM
AND
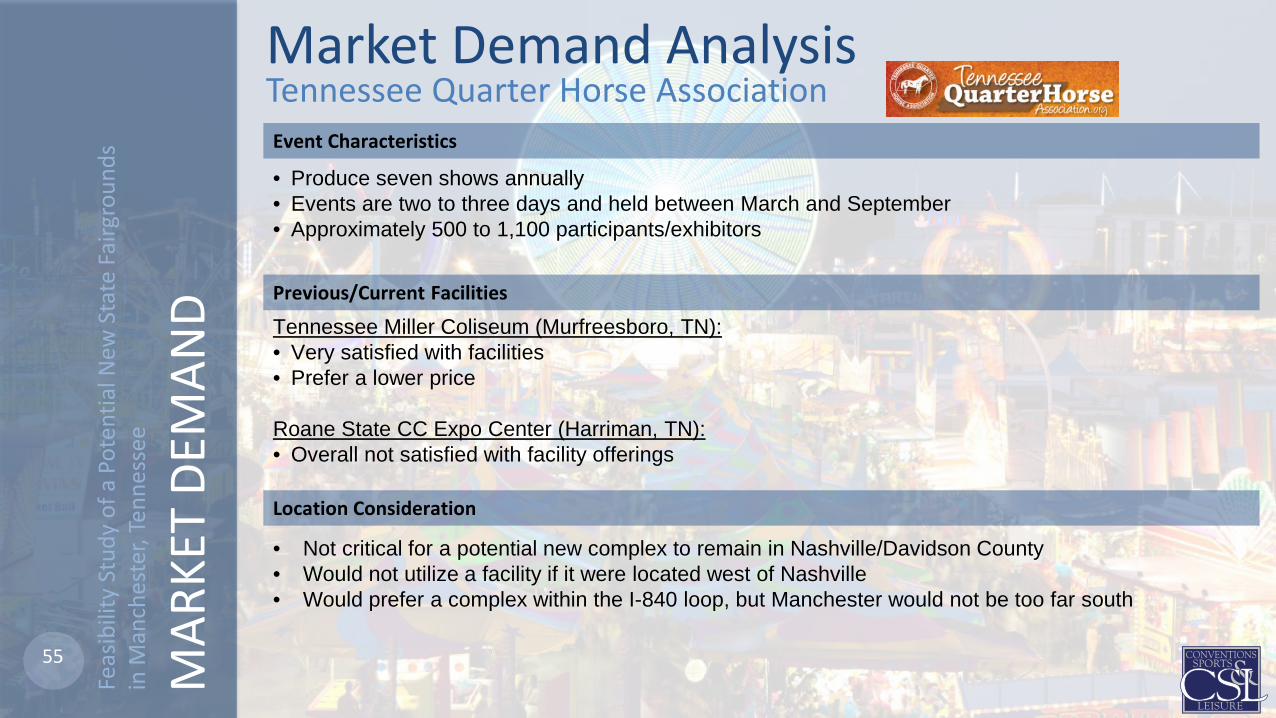
Market Demand AnalysisTennessee Quarter Horse Association
• Not critical for a potential new complex to remain in Nashville/Davidson County• Would not utilize a facility if it were located west of Nashville• Would prefer a complex within the I-840 loop, but Manchester would not be too far south
Location Consideration
Previous/Current Facilities
Tennessee Miller Coliseum (Murfreesboro, TN): • Very satisfied with facilities• Prefer a lower price
Roane State CC Expo Center (Harriman, TN):• Overall not satisfied with facility offerings
• Produce seven shows annually• Events are two to three days and held between March and September• Approximately 500 to 1,100 participants/exhibitors
Event Characteristics

56
Feas
ibili
ty S
tudy
of a
Pot
entia
l New
Sta
te F
airg
roun
ds
in M
anch
este
r, Te
nnes
see
MAR
KET
DEM
AND
Market Demand AnalysisTennessee Quarter Horse Association
• Arena:• At least one indoor arena, 300’x150’• Connected warm-up area, preference for indoor, but would require covered• Additional area within arena for potential vendors to use
• Stalls:• Need between 350 and 500 covered stalls• No preference on permanent vs. temporary
• RV/Lodging:• Need a minimum of 30 RV hook-ups• Need a hotel within close proximity, a headquarters hotel is ideal
Facility Requirements
Potential Usage
• Would definitely utilize a new complex• Would look to bring a three shows annually• No real opportunity to create new events beyond seven existing events
57
Feas
ibili
ty S
tudy
of a
Pot
entia
l New
Sta
te F
airg
roun
ds
in M
anch
este
r, Te
nnes
see
MAR
KET
DEM
AND
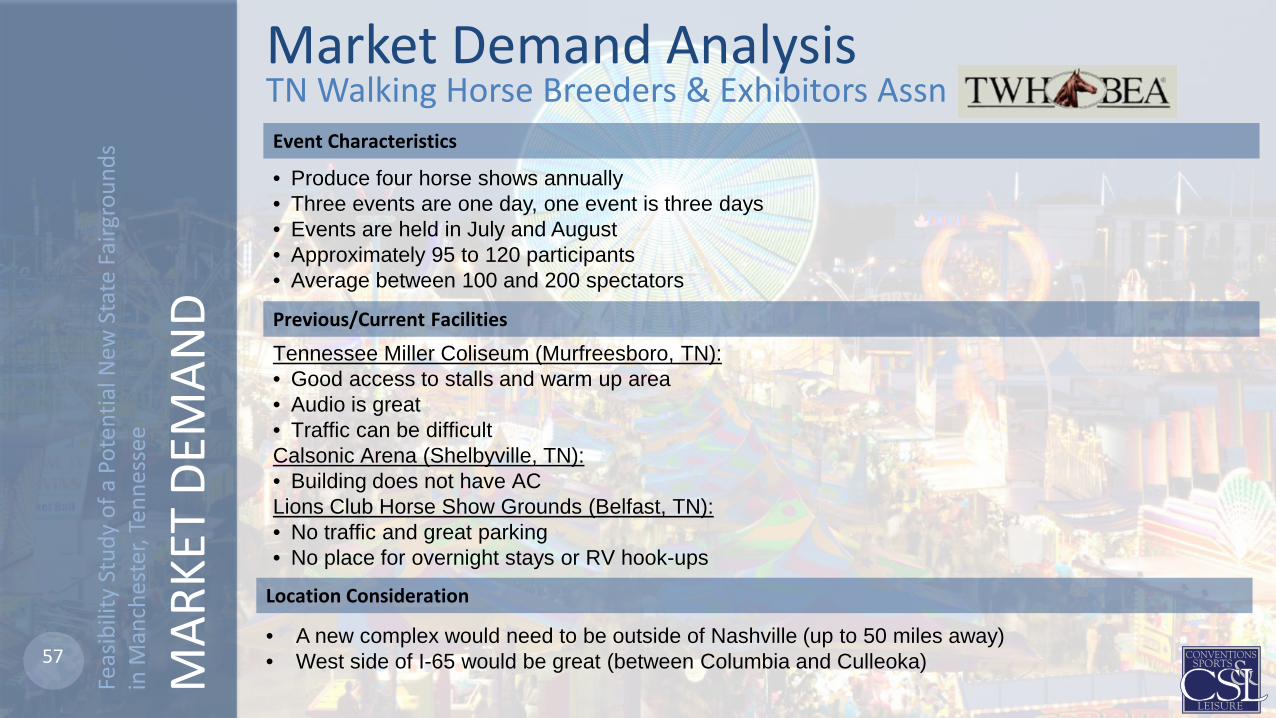
Tennessee Miller Coliseum (Murfreesboro, TN): • Good access to stalls and warm up area• Audio is great• Traffic can be difficultCalsonic Arena (Shelbyville, TN):• Building does not have ACLions Club Horse Show Grounds (Belfast, TN):• No traffic and great parking• No place for overnight stays or RV hook-ups
Market Demand AnalysisTN Walking Horse Breeders & Exhibitors Assn
• A new complex would need to be outside of Nashville (up to 50 miles away)• West side of I-65 would be great (between Columbia and Culleoka)
Location Consideration
Previous/Current Facilities
• Produce four horse shows annually• Three events are one day, one event is three days • Events are held in July and August• Approximately 95 to 120 participants• Average between 100 and 200 spectators
Event Characteristics
58
Feas
ibili
ty S
tudy
of a
Pot
entia
l New
Sta
te F
airg
roun
ds
in M
anch
este
r, Te
nnes
see
MAR
KET
DEM
AND
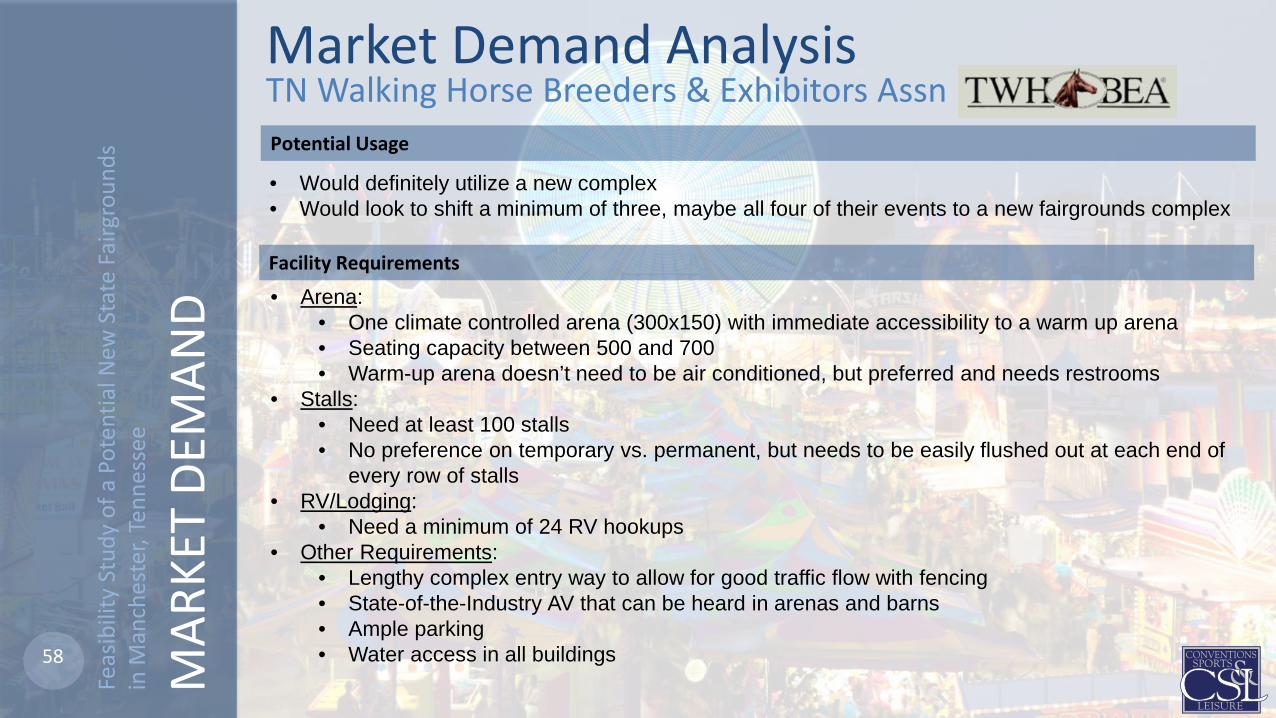
Market Demand AnalysisTN Walking Horse Breeders & Exhibitors Assn
• Arena:• One climate controlled arena (300x150) with immediate accessibility to a warm up arena• Seating capacity between 500 and 700• Warm-up arena doesn’t need to be air conditioned, but preferred and needs restrooms
• Stalls:• Need at least 100 stalls• No preference on temporary vs. permanent, but needs to be easily flushed out at each end of
every row of stalls• RV/Lodging:
• Need a minimum of 24 RV hookups• Other Requirements:
• Lengthy complex entry way to allow for good traffic flow with fencing• State-of-the-Industry AV that can be heard in arenas and barns• Ample parking• Water access in all buildings
Facility Requirements
Potential Usage
• Would definitely utilize a new complex• Would look to shift a minimum of three, maybe all four of their events to a new fairgrounds complex

59
Feas
ibili
ty S
tudy
of a
Pot
entia
l New
Sta
te F
airg
roun
ds
in M
anch
este
r, Te
nnes
see
MAR
KET
DEM
AND
Market Demand AnalysisNational Spotted Saddle Horse Association
• Thinks a new fairgrounds complex would need to move outside of Davidson County• A complex that is centrally located within the state with accessibility to interstate would be best• Believes Manchester would be an ideal location for a new fairgrounds
Location Consideration
Previous/Current Facilities
• Produce ten horse shows annually• Events are two to three days and held between March and September• Approximate 500 to 1,100 participants/exhibitors• Between 200 and 2,000 spectators for events
Event Characteristics
• Cannon County Fairgrounds (Woodbury, TN)• Coffee County Fairgrounds (Manchester, TN)• Lincoln County Fairgrounds (Fayetteville, TN)• Tennessee Livestock Center (Murfreesboro, TN) – too expensive
Potential Usage
• Would definitely utilize a new complex• Would look to bring a two to three of their events and would be willing to generate new events

60
Feas
ibili
ty S
tudy
of a
Pot
entia
l New
Sta
te F
airg
roun
ds
in M
anch
este
r, Te
nnes
see
MAR
KET
DEM
AND
Market Demand AnalysisNational Spotted Saddle Horse Association
• Arena:• Need at least two arenas and one warm-up area• Preference for climate controlled indoor facilities or covered• Bleacher seating for 500• Center ring pavilion or area for the judges
• Event Space:• Banquet space for awards ceremony to accommodate approximately 300
• Other Requirements:• Good lighting• Ample bathrooms• Reasonable rental rates is critical for indoor facilities, typical rates in the area are approximately
$1,200 to $1,300 per day, it is too expensive for their association
Facility Requirements
61
Feas
ibili
ty S
tudy
of a
Pot
entia
l New
Sta
te F
airg
roun
ds
in M
anch
este
r, Te
nnes
see
MAR
KET
DEM
AND
Market Demand AnalysisAmerican Dairy Goat Association
• Critical for a new fairgrounds complex to be outside of Nashville, urban areas can be constraining and a Nashville complex would be competing too much with their event in Louisville
• Ideal location would be somewhere between Nashville, Knoxville and Chattanooga • Prefer a location that is within one hour of a major airport• Needs direct interstate access• Needs to be located within a market that has a lot of visitors amenities within close proximity
Location Consideration
• Produce two national sales annually• Events occur in June or July and last one week• Exhibitor attendance ranges between 200 and 300 per event• Events have been rotating between the Farm Show Complex and Expo Center in Harrisburg, PA and
the Kentucky Expo Center in Louisville, KY
Event Characteristics
Potential Usage
• Would definitely utilize a new complex• Would look to shift one of their national sales• Ideally, would eventually like to find four fairgrounds complexes to sign agreements with and rotate
national shows annually
62
Feas
ibili
ty S
tudy
of a
Pot
entia
l New
Sta
te F
airg
roun
ds
in M
anch
este
r, Te
nnes
see
MAR
KET
DEM
AND
Market Demand AnalysisAmerican Dairy Goat Association
• Arena:• Two show rings within one building (each 75 to 80x125)• Indoor, climate controlled, with high ceilings• Floor type needs to be either hard back dirt with shavings or concrete• Some bleacher seating is preferred• Wash racks
• Event Space:• Banquet space for a dinner and reception for 200 to 250• Space needs to be able to host a reception and a sale within the same building
• Pens:• Need a minimum of 1,200 pens• Prefer temporary that can be adjustable (5x5 or 6x6)• Pens need to be on-site and included in pricing package, too expensive to rent • Connected to the show ring• Prefer indoor, climate controlled, with high ceilings to help with air ventilation
• RV/Lodging:• Need a minimum of 30 RV hookups
• Other Requirements:• Within ten minutes of a hotel – prefer less expensive brands• Reasonable rates – needs to be within $50,000 to $70,000 per week• Legal way to dispose of milk
Facility Requirements
63
Feas
ibili
ty S
tudy
of a
Pot
entia
l New
Sta
te F
airg
roun
ds
in M
anch
este
r, Te
nnes
see
MAR
KET
DEM
AND
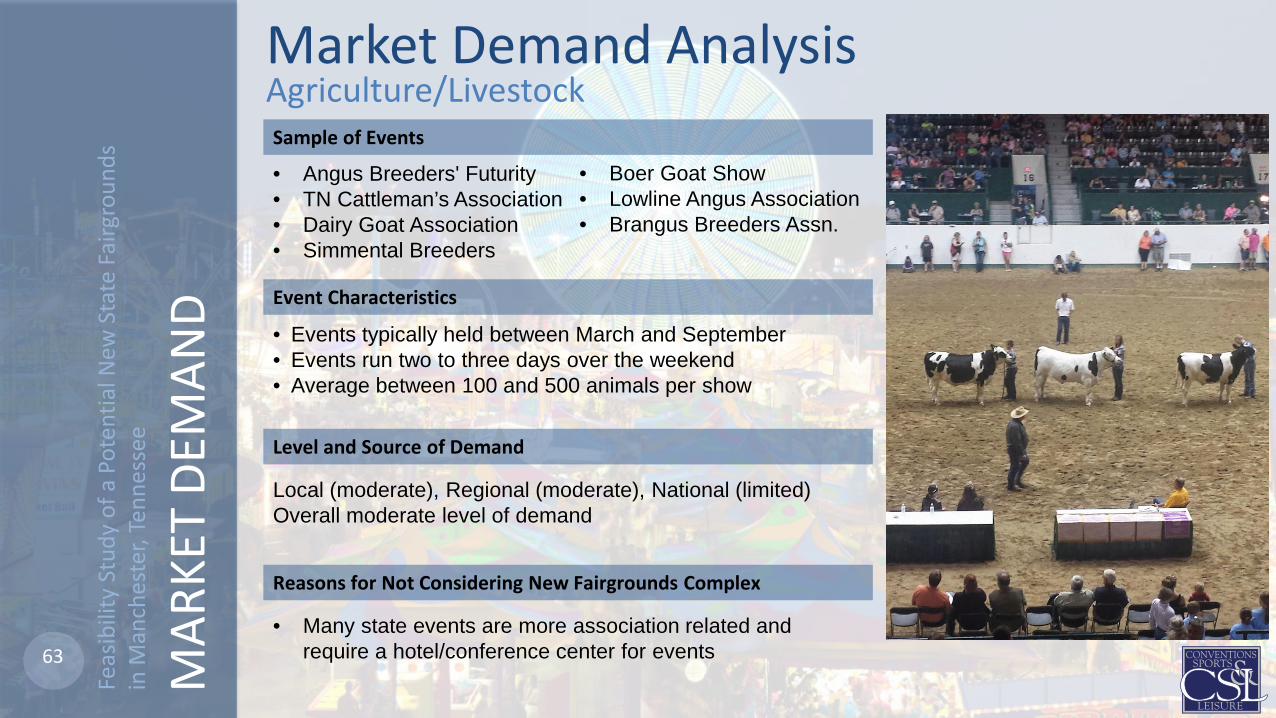
Market Demand AnalysisAgriculture/Livestock
Local (moderate), Regional (moderate), National (limited)Overall moderate level of demand
Level and Source of Demand
• Events typically held between March and September• Events run two to three days over the weekend• Average between 100 and 500 animals per show
Event Characteristics
• Many state events are more association related and require a hotel/conference center for events
Reasons for Not Considering New Fairgrounds Complex
• Angus Breeders' Futurity• TN Cattleman’s Association • Dairy Goat Association• Simmental Breeders
Sample of Events
• Boer Goat Show• Lowline Angus Association• Brangus Breeders Assn.

64
Feas
ibili
ty S
tudy
of a
Pot
entia
l New
Sta
te F
airg
roun
ds
in M
anch
este
r, Te
nnes
see
MAR
KET
DEM
AND
Market Demand AnalysisAgriculture/Livestock
• Not critical to remain in Nashville/Davidson County• Preference to remain within I-840 loop• Needs to have easy interstate access
Location Considerations
• Arena:• Multiple show rings, preference for indoor• Some bleacher seating
• Event Space:• Exhibition space for conventions• Additional ballroom/breakout space for meal functions
or meetings• Stalls:
• Preference for portable, adjustable pens• Other Requirements:
• Connected to or within close proximity of hotels• Reasonable rental rates
Facility Requirements

65
Feas
ibili
ty S
tudy
of a
Pot
entia
l New
Sta
te F
airg
roun
ds
in M
anch
este
r, Te
nnes
see
MAR
KET
DEM
AND
• Produce 8 cheerleading and karate tournaments and competitions and two cheerleading clinics per year• Events are one day that last 12 to 14 hours• Winter events are held in December and January; spring events are held in April and May• Largest cheerleading event has approximately 900 participants with an estimated 1,800 spectators
Market Demand AnalysisChampion Force Athletics
• In order to relocate, the facility would need to be within 30 miles of Nashville
Location Consideration
Event Characteristics
Potential Usage
• Would possibly consider utilizing a new complex• Would look to relocate their largest event to a new complex
• Exhibit Space:• Enough contiguous flat floor space to accommodate a minimum of two full basketball courts, warm-up area,
space for vendors, announcers/MC area, and trophy area• Private meeting/office space
Facility Requirements
Previous/Current Facilities
Wilson Ag Expo (Franklin, TN):• It fits their needs and will allow for their events to grow in size • Pricing is high• Some parents feel the location is too far, but facility acts as centralized location

66
Feas
ibili
ty S
tudy
of a
Pot
entia
l New
Sta
te F
airg
roun
ds
in M
anch
este
r, Te
nnes
see
MAR
KET
DEM
AND
• Produce tournaments for youth and adult basketball, soccer and flag football• Produce 8 to 10 youth basketball tournaments and 10 to 15 adult basketball tournaments annually
and have grown to add one additional tournament per year• Tournaments run between March and May from Friday night through Sunday afternoon• Youth tournaments host approximately 250 teams, approximately ¼ of teams are non-local
Market Demand AnalysisMid State Youth Sports
• Critical to remain in Davidson County • Preference for a complex on the north side of Nashville/Davidson County• Proximity to Nashville is a large draw for their events
Location Consideration
Event Characteristics
Previous/Current Facilities
• All tournaments are currently held at school gymnasiums or multi-court facilities within Davidson County
• Larger state/regional tournament has been held at Rocky Top in Gatlinburg – ideal facility• Lack of multi-court facilities in the area or space that could accommodate multiple courts• Pricing and availability of local facilities is an issue

67
Feas
ibili
ty S
tudy
of a
Pot
entia
l New
Sta
te F
airg
roun
ds
in M
anch
este
r, Te
nnes
see
MAR
KET
DEM
AND
Market Demand AnalysisMid State Youth Sports
Potential Usage
• Would definitely utilize a new complex• Would look to relocate minimum of six, and as many as eight, tournaments, with the expectation to
grow by one tournament annually • Envision future usage of hosting tournaments every weekend for at least six months a year• Additional potential to use for weekly league play and practice (six days per week)
• Exhibit Space:• Enough contiguous flat floor space to accommodate five to six full-size basketball courts• Bleacher seating for 50 per court• Facility would need to provide portable court flooring, bleacher seating and basketball hoops
• Other Requirements:• Concessions area• Large bathrooms• Within 10 to 15 minutes from hotel • Pricing is critical – would need to be around $500 per court per weekend
Facility Requirements
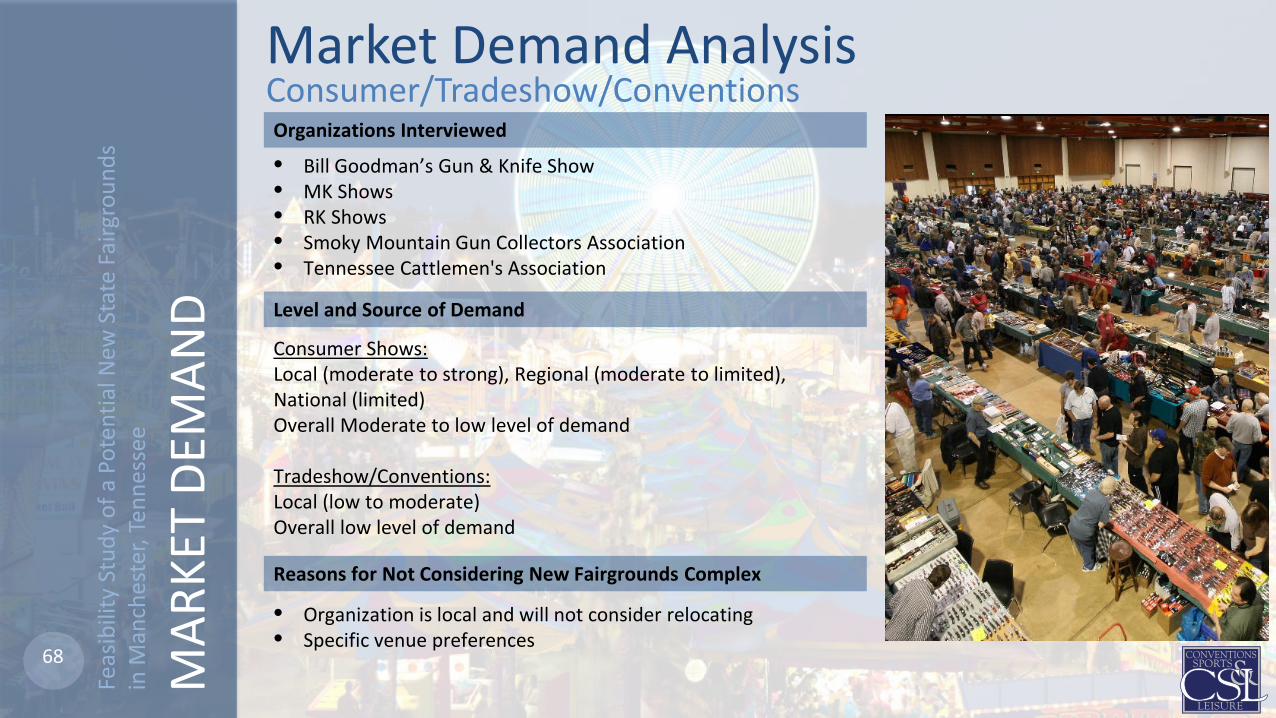
68
Feas
ibili
ty S
tudy
of a
Pot
entia
l New
Sta
te F
airg
roun
ds
in M
anch
este
r, Te
nnes
see
MAR
KET
DEM
AND
Market Demand AnalysisConsumer/Tradeshow/Conventions
Level and Source of Demand
Organizations Interviewed
Consumer Shows: Local (moderate to strong), Regional (moderate to limited), National (limited)Overall Moderate to low level of demand
Tradeshow/Conventions: Local (low to moderate)Overall low level of demand
Reasons for Not Considering New Fairgrounds Complex
• Organization is local and will not consider relocating • Specific venue preferences
• Bill Goodman’s Gun & Knife Show• MK Shows• RK Shows• Smoky Mountain Gun Collectors Association• Tennessee Cattlemen's Association
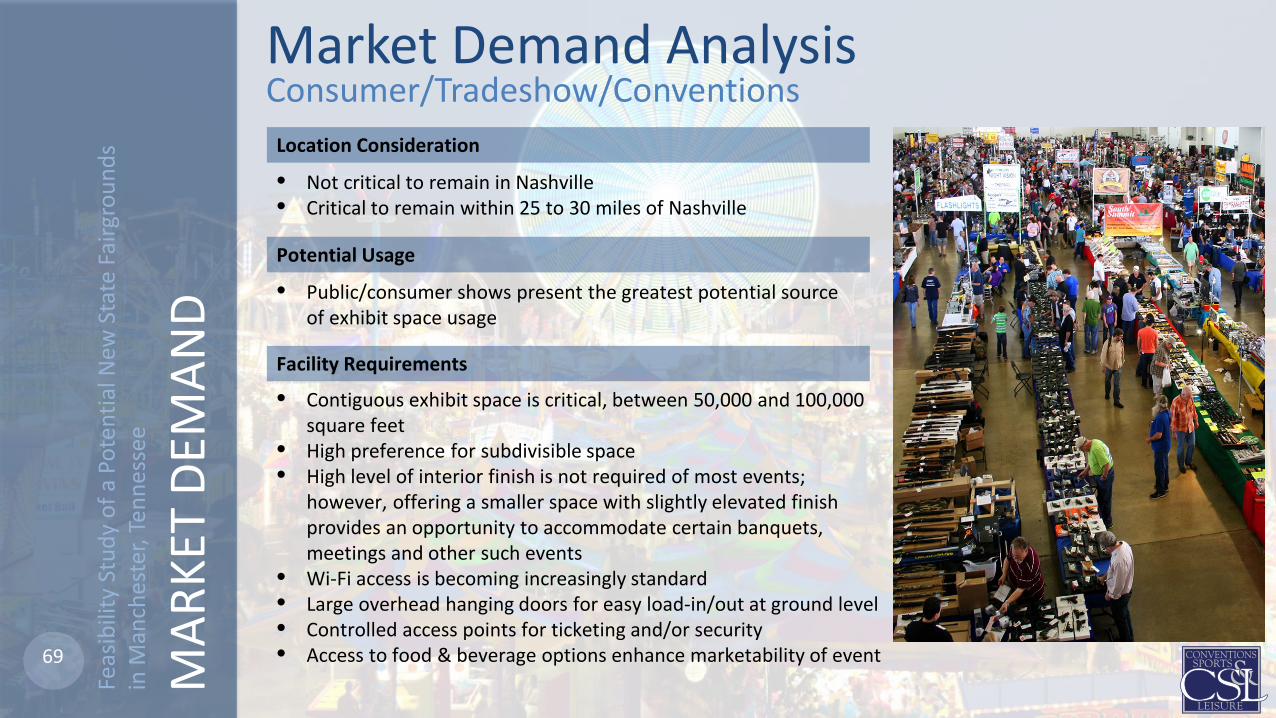
69
Feas
ibili
ty S
tudy
of a
Pot
entia
l New
Sta
te F
airg
roun
ds
in M
anch
este
r, Te
nnes
see
MAR
KET
DEM
AND
Market Demand AnalysisConsumer/Tradeshow/Conventions
Location Consideration
Facility Requirements
• Contiguous exhibit space is critical, between 50,000 and 100,000 square feet
• High preference for subdivisible space• High level of interior finish is not required of most events;
however, offering a smaller space with slightly elevated finish provides an opportunity to accommodate certain banquets, meetings and other such events
• Wi-Fi access is becoming increasingly standard• Large overhead hanging doors for easy load-in/out at ground level• Controlled access points for ticketing and/or security• Access to food & beverage options enhance marketability of event
• Not critical to remain in Nashville• Critical to remain within 25 to 30 miles of Nashville
Potential Usage
• Public/consumer shows present the greatest potential source of exhibit space usage

70
Feas
ibili
ty S
tudy
of a
Pot
entia
l New
Sta
te F
airg
roun
ds
in M
anch
este
r, Te
nnes
see
MAR
KET
DEM
AND
Level and Source of Demand
Market Demand Analysis Concerts, Promoted Shows and Other EntertainmentSample Events
• Kicker Arenacross• Live Nation• Professional Rodeo
Cowboys Association
• AC Entertainment• Harlem Globetrotters
• Prefer a larger market like Nashville or Chattanooga, limited population in and around Manchester/Coffee County would make it a difficult draw for many acts
• Would likely need to purchase acts to perform during State Fair• Limited opportunity to increase concert and/or performance activity
during non-State Fair dates• Increased opportunity to attract concerts and other promoted/touring
acts or shows if located closer to Nashville• Bonnaroo/AC Entertainment/Live Nation association would maximize
potential to draw touring acts; however, beyond ”festival”-oriented events, the remote location of the site would be expected to be challenging for attracting concerts and other entertainment events and event levels in this segment would be expected to be low.
Concerts and Promoted Events:Local (Moderate), Regional (low), National (low)Overall low level of demand
Source: CSL Potential User Survey 2016.
Reasons for Not Considering New Fairgrounds Complex

71
Feas
ibili
ty S
tudy
of a
Pot
entia
l New
Sta
te F
airg
roun
ds
in M
anch
este
r, Te
nnes
see
MAR
KET
DEM
AND
Market Demand Conclusions1. Existing Fairgrounds Nashville site is not a long-term solution for hosting the Tennessee State Fair. Existing
site/location is problematic on many levels and significantly constrains growth, attendance and impact of the Fair.2. Moderate to strong demand was measured among ag/equestrian/livestock representatives for a State Fair site
located outside of Nashville.3. Demand begins to wane among urban attendees the further the Fair is located outside the I-840 loop.4. Moderate demand among non-Fair related event activity:
a) Ag/equestrian/livestock shows indicated a moderate to strong interest in hosting future events.b) Demand associated with many consumer shows, conventions, tradeshows, and non-festival-associated
concert/entertainment incrementally weakens the further outside of Nashville a potential facility is located. As such, a Bonnaroo location will likely result in lower demand than typical within the industry
5. Consideration should be given to shifting State Fair dates. First week in October was mentioned by a number of interviewees and a reborn State Fair could slot here as the final fair event of the season.
6. Manchester viewed as a viable location among ag-related events. However, a location closer to I-840 and Nashville preferred.
7. Dirt-oriented events such as equestrian, livestock and agricultural-related events expected to be the primary demand generator.
8. Other types of non-dirt events such as public/consumer shows, meetings/banquets/receptions and/or amateur sports tournaments/ competitions could also provide important facility utilization.
9. Limited opportunity to attract additional concerts or other promoted shows outside of traditional Bonnaroo or State Fair event dates.
10. For confidentiality reasons, the Bonnaroo site was not specifically identified during potential user surveys. Location was spoken about in terms of an hour or more from downtown Nashville. The Murfreesboro area was repeatedly cited by interviewees as an ideal general site location and driving distance for a new State Fairgrounds.

72
Feas
ibili
ty S
tudy
of a
Pot
entia
l New
Sta
te F
airg
roun
ds
in M
anch
este
r, Te
nnes
see
SUPP
ORT
ABLE
PRO
GRAM
Market Supportable Program1) Indoor Arena
• Dirt floor• Ring size targeting 300’ x 150’ (45,000 SF)• Seating for approximately 5,000 (allow for potential future expansion)• Approximately 10,000 additional square feet at one end for chutes, pens and/or staging• Multiple roll-up doors and space for lobby, show offices, concessions, box office, restrooms, etc.• Climate controlled• Connectivity with warm-up area and stalls
2) Warm-up Areas• Ring size targeting a 300’ x 150’ ring, with a minimum size of 250’ x 125’• Dirt floor (similar footing quality to Main Arena)• Climate control would be preferable, but not critical (at a minimum, incorporate industrial ceiling fans)• Seating for approximately 500 (allow for potential future expansion)• Additional outdoor ring targeting a 300’ x 150’ ring, with a minimum size of 250’ x 125’
3) Concert/Entertainment Assumptions• No dedicated grandstand for concert or other performance events• Assumed use of Bonnaroo Main Stage or other performance venues for hosting promoted acts• Dedicated transportation system/people mover to connect preferred Fair site with Bonnaroo infrastructure

73
Feas
ibili
ty S
tudy
of a
Pot
entia
l New
Sta
te F
airg
roun
ds
in M
anch
este
r, Te
nnes
see
SUPP
ORT
ABLE
PRO
GRAM
Market Supportable Program4) Stalls and Barns
• Approximately 500 permanent stalls plus storage (allow for potential future expansion)• Additional Barns for beef/dairy, swine, sheep and goats:
• Concrete floor, column-free exhibition space• 1 @ 80,000 square feet (Beef/Dairy)• 2 @ 40,000 to 45,000 square feet (Goats & Swine)• 1 @ 35,000 square feet (Sheep)
• Consider development of Super Barn (all facilities under one roof) to allow for enhanced flexibility• Enhanced access points for Fair attendees to interact with animals• Program additional space to allow for temporary pens, cattle ties, etc.• Electrical drops at every stall; minimum of three to four wash racks• Easy access for load-in/out from parking area
5) Additional Programming to Consider• Exhibits and hands-on displays to allow people to re-connect with agriculture and farming activities such as a
simulated milking station, Tiny Acres farmer experience, petting zoo, etc.• Covered/semi-enclosed pavilion for a year-round Farmer’s Market• Farm equipment inspired playground

74
Feas
ibili
ty S
tudy
of a
Pot
entia
l New
Sta
te F
airg
roun
ds
in M
anch
este
r, Te
nnes
see
SUPP
ORT
ABLE
PRO
GRAM
Market Supportable Program6) Exhibit and Meeting Space
• 40,000 square feet of space for non-animal activities (arts, crafts, textiles, etc.)• 15,000-square foot banquet hall• Some sub-divisibility options (via air walls)• Concrete floor• Column-free or minimal columns• One to three show offices/meeting rooms• Climate controlled
7) Other Indoor Areas• Commercial kitchen facilities – utilize access of farm-to-table produce• Lobby, storage and other back-of-house• Three to four showers (per gender) and locker rooms• Wi-Fi access• PA system with controllable access among Arena, Warm-up Area and Stalls
8) Outdoor Areas• Approximately 150 RV hookups• Ample trailer parking to accommodate large truck and trailer rigs

75
Feas
ibili
ty S
tudy
of a
Pot
entia
l New
Sta
te F
airg
roun
ds
in M
anch
este
r, Te
nnes
see
COST
/BEN
EFIT
AN
ALYS
IS
Estimated Annual Number of EventsStabilized Year of Operations

76
Feas
ibili
ty S
tudy
of a
Pot
entia
l New
Sta
te F
airg
roun
ds
in M
anch
este
r, Te
nnes
see
COST
/BEN
EFIT
AN
ALYS
IS
Estimated Annual Event DaysStabilized Year of Operations
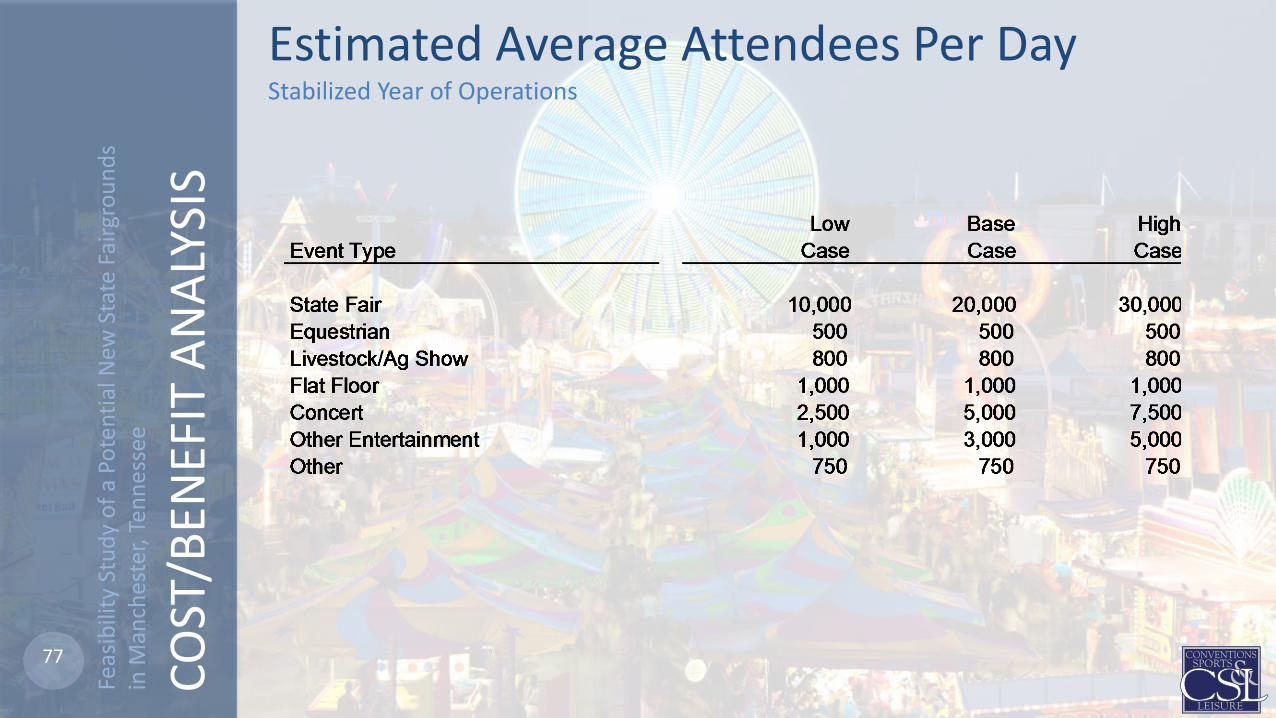
77
Feas
ibili
ty S
tudy
of a
Pot
entia
l New
Sta
te F
airg
roun
ds
in M
anch
este
r, Te
nnes
see
COST
/BEN
EFIT
AN
ALYS
IS
Estimated Average Attendees Per DayStabilized Year of Operations

78
Feas
ibili
ty S
tudy
of a
Pot
entia
l New
Sta
te F
airg
roun
ds
in M
anch
este
r, Te
nnes
see
COST
/BEN
EFIT
AN
ALYS
IS
Estimated Annual Attendee DaysStabilized Year of Operations

79
Feas
ibili
ty S
tudy
of a
Pot
entia
l New
Sta
te F
airg
roun
ds
in M
anch
este
r, Te
nnes
see
COST
/BEN
EFIT
AN
ALYS
IS
Economic Impact Concepts• Direct Spending consists principally of initial purchases made by attendees at an event who do
not reside in the local area. This spending typically takes place in local hotels, restaurants, retail establishments and other such businesses. An example of direct spending is when an out-of-town event attendee pays a local hotel for overnight lodging accommodations.
• Indirect Spending consists of the re-spending of the initial or direct expenditures. An example of indirect spending is when a restaurant purchases additional food and dining supplies as a result of new dining expenditures through increased patronage. A certain portion of these incremental supply expenditures occurs within the local community (i.e., “indirect spending,” the type of which is quantified under this analysis), while another portion leaves the local economy (i.e., “leakage”).
• Induced Spending consists of the positive changes in employment, earnings and tax collections generated by changes in population associated with direct/indirect expenditures.
• Total Output represents the total direct, indirect and induced spending effects generated by the project. This calculation measures the total dollar change in output that occurs in the local economy for each dollar of output delivered to final demand.
• Earnings (or Personal Income) represents the wages and salaries earned by employees of businesses associated with or impacted by the project. In other words, the multiplier measures the total dollar change in earnings of households employed by the affected industries for each additional dollar of output delivered to final demand.
• Employment represents the number of full- and part-time jobs. The employment multiplier measures the total change in the number of jobs in the local economy (throughout a wide diversity of industry sectors) for each additional $1.0 million of output delivered to final demand.
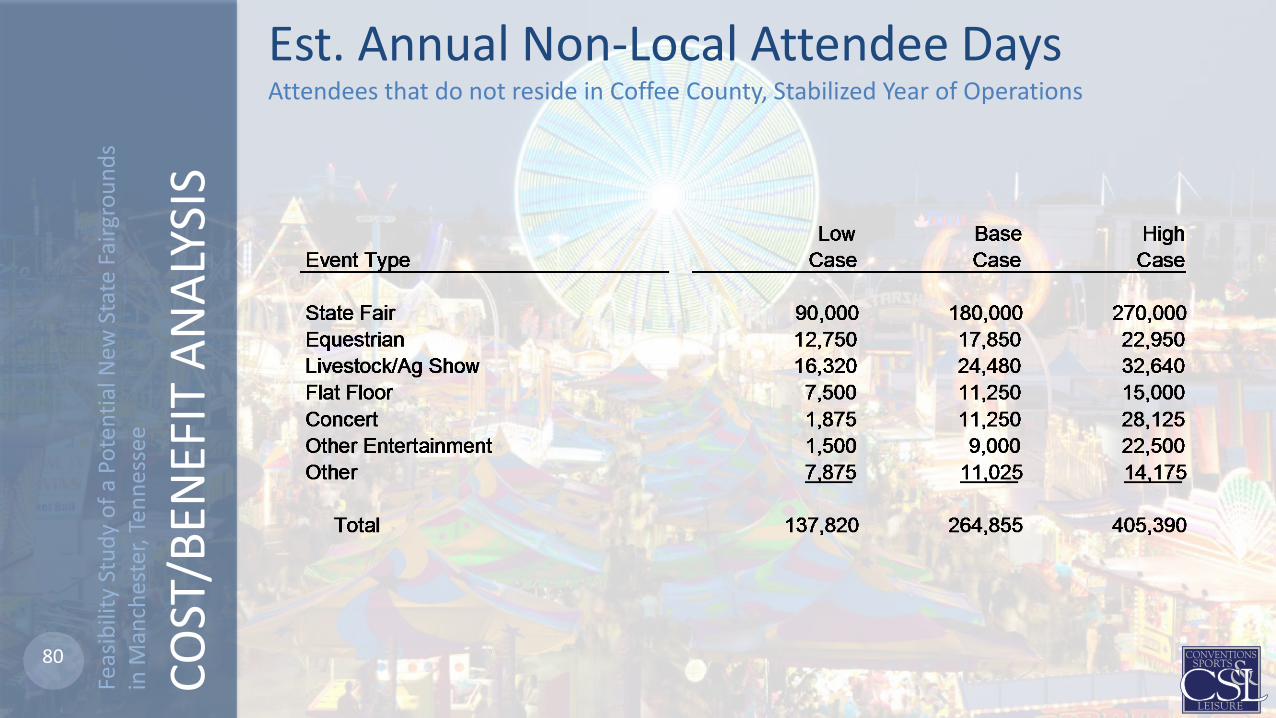
80
Feas
ibili
ty S
tudy
of a
Pot
entia
l New
Sta
te F
airg
roun
ds
in M
anch
este
r, Te
nnes
see
COST
/BEN
EFIT
AN
ALYS
IS
Est. Annual Non-Local Attendee DaysAttendees that do not reside in Coffee County, Stabilized Year of Operations
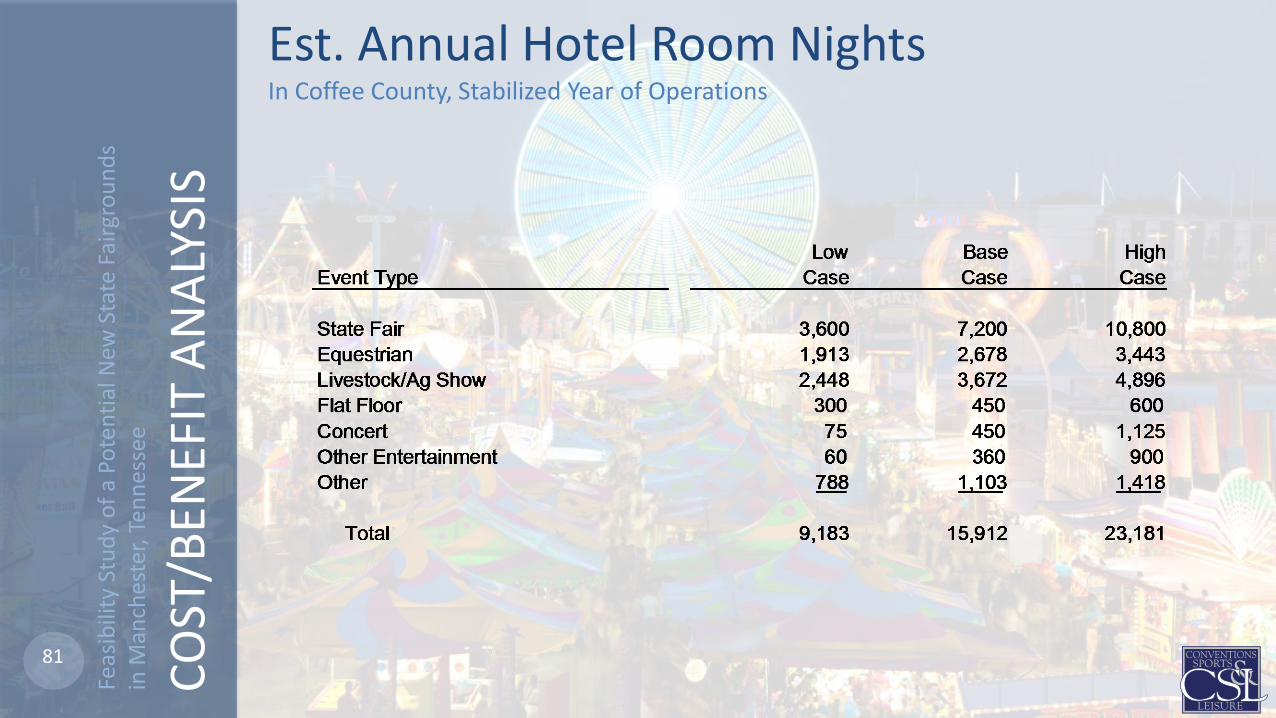
81
Feas
ibili
ty S
tudy
of a
Pot
entia
l New
Sta
te F
airg
roun
ds
in M
anch
este
r, Te
nnes
see
COST
/BEN
EFIT
AN
ALYS
IS
Est. Annual Hotel Room NightsIn Coffee County, Stabilized Year of Operations
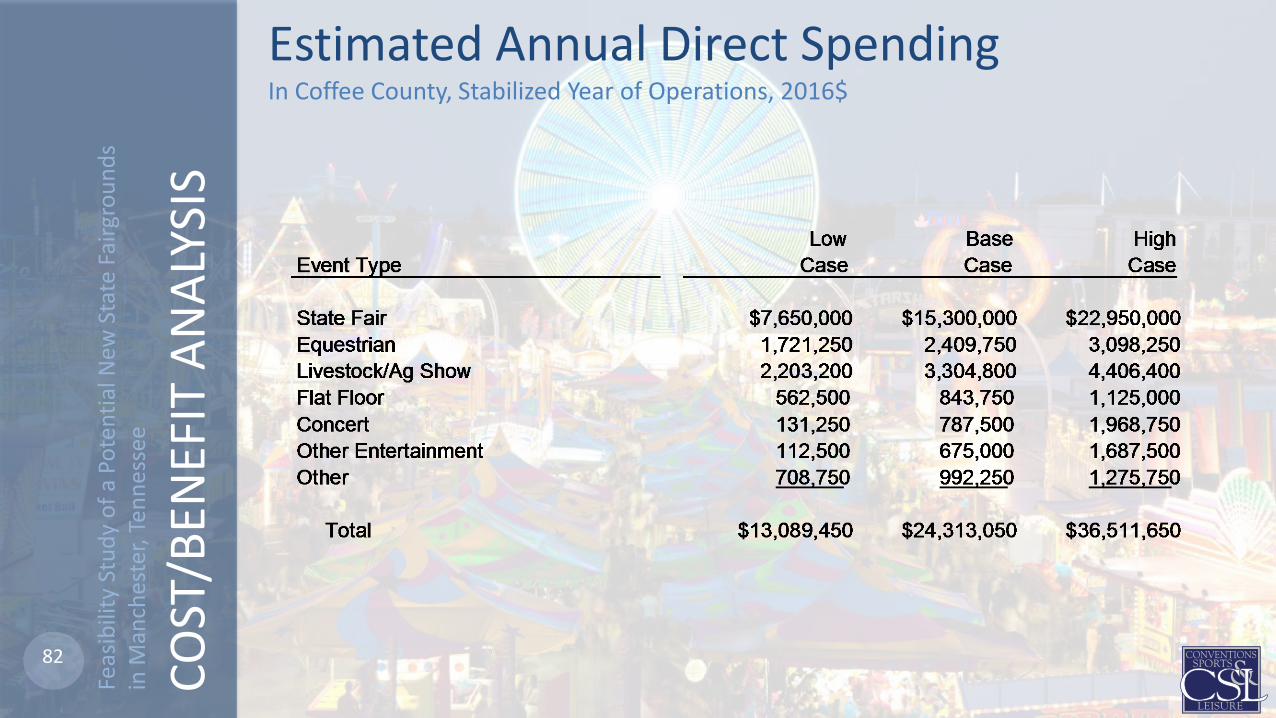
82
Feas
ibili
ty S
tudy
of a
Pot
entia
l New
Sta
te F
airg
roun
ds
in M
anch
este
r, Te
nnes
see
COST
/BEN
EFIT
AN
ALYS
IS
Estimated Annual Direct SpendingIn Coffee County, Stabilized Year of Operations, 2016$

83
Feas
ibili
ty S
tudy
of a
Pot
entia
l New
Sta
te F
airg
roun
ds
in M
anch
este
r, Te
nnes
see
COST
/BEN
EFIT
AN
ALYS
IS
Estimated Annual Economic ImpactsIn Coffee County, Stabilized Year of Operations, 2016$

84
Feas
ibili
ty S
tudy
of a
Pot
entia
l New
Sta
te F
airg
roun
ds
in M
anch
este
r, Te
nnes
see
COST
/BEN
EFIT
AN
ALYS
IS
Estimated Annual Financial OperationsStabilized Year of Operations, 2016$, excluding debt service

85
Feas
ibili
ty S
tudy
of a
Pot
entia
l New
Sta
te F
airg
roun
ds
in M
anch
este
r, Te
nnes
see
COST
/BEN
EFIT
AN
ALYS
IS
Overall Conclusions1. Existing Fairgrounds Nashville site is not a long-term solution for hosting the TN State Fair. Existing site/location is
problematic on many levels and is significantly constraining the growth, attendance and impact of the Fair.2. Consideration could be given to shifting State Fair dates. The first week in October was mentioned by a number of
interviewees and a relocated State Fair could slot at that point and would then represent the final fair event of the season.3. The proposed location of a new Fairgrounds at the Bonnaroo site in Manchester is believed to be sufficient for a new home
for the Tennessee State Fair, allowing for the development of an appropriate array of facilities and infrastructure that could allow the Fair to significantly grow and better support the state’s agricultural, livestock and equine industries.
4. However, the remote location will have important implications on event/attendance attraction for non-Fair events. Overall event and attendance levels would be expected to be lower than industry averages associated with comparable complexes.
5. Negative impacts associated with the remote location for certain event segments, such as livestock/ag/equine events, tend to be more limited than those expected for other event segments, such as public/consumer shows, tradeshows, concerts, entertainment, and sporting events.
6. Event attraction and operating synergy associated with a potential partnership with Bonnaroo/AC Enter/Live Nation would be expected to be somewhat limited. The primary partner benefit rests with the land opportunity and willing partner to undertake operating responsibility.
7. The Murfreesboro area was repeatedly cited by interviewees as an ideal general site location and driving distance for a new State Fairgrounds, that would be preferable over a Manchester location.
8. The facilities program and concept (Option C) developed by Populous largely appears appropriate for the proposed project. 9. It is estimated that the new Fairgrounds would attract 54 events, 131 event days, and 308,000 attendees per year (upon
stabilization of operations, assumed to occur by year five) under a Base Case scenario. 10. Low, Base and High Case Scenarios estimate State Fair attendance at 100,000, 200,000, and 300,000, respectively.11. A new State Fairgrounds would be expected to generate significant new economic impact in Coffee County,
generating $24.3 million in new direct spending and $40.7 million in economic output annually. Net new economic impacts generated for the State would be expected to be limited.
12. Under the Low and Base Case, a new State Fairgrounds would be estimated to generate an annual operating deficit, suggesting that an appropriate operating model would include contracted private management with a management fee (base + incentive) and annual public sector operating subsidy support.