introduction script - prudential.co.uk/media/files/p/prudential-v2/... · you will have seen the...
TRANSCRIPT

Introduction Script
Good morning ladies and gentlemen.
Thank you very much indeed for coming today to a series of presentations that will describe
our economic capital project, developments in regulatory reporting and the changes that we
are making to our financial reporting.
In a moment I will set the scene for the morning by summarising the key themes. I will then
go on to give an overview of the Financial Groups Directive and the results when we apply it
to measure the group’s solvency. Andy Crossley will then talk about our economic capital
project and summarise what it tells us about the group’s economic capital position. You will
then have an opportunity to ask all of your questions on those two subjects.
David Martin, who has headed up our project to implement International Financial Reporting
Standards, will then talk about the impact of its adoption on our statutory accounts and take
your questions. After a coffee break, Andy and I will return to discuss European Embedded
Value again with an opportunity for questions.
In addition to the three of us who are presenting, there are a number of other people present
in the front row today who will be happy to take your questions either during the sessions or in
the break. Philip Long has been the project director for economic capital and FGD
implementation and Azim Mithani has been the director for our EEV project. Also here are
David Belsham, Garth Jones and Chad Myers who have each run their own business unit
project and provided input to the group wide project. This is very much the way we view such
projects at Prudential. A number of you will have met the three of them before at our regular
presentations.
Much of the session is inevitably technical in nature, but there is certainly more to this
morning than a series of technical updates. What I hope we will show you is that we have
been doing a substantial amount of work over the last three years or so to improve further
capital efficiency in the group. This is a continuous and unceasing project.
Today will be a progress report. I hope we will also be able to demonstrate how the work we
have been doing fits into the context of the various regulatory and accounting changes
already announced; we will show you quantitatively where we were at the end of 2004; and
give you some pointers for the future direction of our work. However there are a number of
important links between the projects; the key one being the way we have taken output from
economic capital and used it in setting capital under EEV. One thing is clear to us: our work
is far from over and we intend to be actively involved directly and through industry bodies in

influencing further changes to regulatory and financial reporting that will be introduced over
the remainder of the decade.
Today’s presentation covers four themes:
• our Groups Directive solvency position
• economic capital
• the impact of International Financial Reporting Standards, the so called phase I for the
insurance industry
• and finally European Embedded Value.
Looking at each of these four themes in turn, starting with regulatory capital.
We have spoken before about the evolving models for group solvency under EU directives.
The Financial Groups Directive came into force on 1st January 2005 superseding, for us, the
Insurance Groups Directive. It introduces an additional test on the group, the mechanics of
which we will describe. As at 31st December 2004, our surplus at a group level was £845m
over a solvency capital requirement of £2billion.
Moving on to economic capital.
For the last three years we have been developing the group-wide model for measuring
economic capital across the group. We see this model as the key to improved value creation
through better and consistent capital allocation. By developing this model and sharing our
output with regulators and industry bodies across Europe we hope to play an active role in
influencing the development of the Solvency II model to be applied to the insurance industry
across the EU. We expect Solvency II to adopt a more realistic approach than the current
regulatory model that we will discuss.
The economic capital project has also been an important input into our enhanced embedded
value reporting providing a consistent model for defining the capital applied in the calculation
of profits under European Embedded Value.
I hope we will be able to give you some sense of the depth of work that we have undertaken
to develop our group-wide model and what gives us the confidence to use it as a tool for
capital allocation. We can now look at our capital on a 25 year view, with confidence
consistent with historic default rates from AA Bonds, and conclude that we have available
capital that is about twice that required to withstand the financial and operational risks to
which we are subject.

You will have seen the commentary in our Annual Report on the effects of International
Financial Reporting Standards on our reported financial performance. I think its reasonably
well known that because IFRS4 broadly permits a continuation of existing accounting
treatment for contracts that meet the Standard’s definition of insurance its effects are limited.
We have put out this morning a press release and accompanying schedules that show the
effect of restating our 2004 results under IFRS. Our operating profit is reduced by £15m to
£608m largely as a result of changes in the accounting for unit linked business.
Our total profit shows an increase of £227m to £985m for two principal reasons: first, under
IFRS goodwill on acquisitions is no longer amortised through the profit and loss account, and
secondly changes in the value of derivative contracts entered into principally to hedge
Jackson National Life’s general account will flow through the profit and loss account. We will
explain these adjustments to you in more detail as we will the changes to our shareholders’
funds which increase by about £470m to £4751m.
We have taken the opportunity afforded by the arrival of IFRS to review all of our accounting
policies. We believe it is appropriate to replace the approach we have taken to reporting
longer-term returns for fixed income securities, by replacing the five year averaging method
with a method which better reflects the credit risk and maturity period of the underlying
securities. To be clear, this is a discretionary change not required by IFRS. We will describe
the new method later but its effect in 2004 would have been to increase operating profit by
£91m with an offsetting reduction in short-term fluctuations in investment returns leaving total
profit unchanged.
It is worth mentioning that the changes brought about by IFRS Phase I will remain in place
until the IASB produces its definitive standard. We understand this is unlikely to be in use
before 2009 year-end at the earliest.
This change in approach together, with all of the effects of IFRS on our non-life business also
feed through into European Embedded Value reporting, the fourth and final presentation you
will hear this morning.
Prudential has taken a leading role over the last three years or so in the development of
European Embedded Value principles by the CFO Forum. We believed at the outset that it
was important for the insurance industry to address actively the concerns that investors had in
the methods of Embedded Value reporting and at the same time to improve the consistency
of these methods across Europe. We think it was right for the industry to tackle this subject
itself rather than await the work of standard setters.

It is worth mentioning now that the approach we have followed is different from some others
that you have now seen presented. We believe our approach is true to the EEV principles in
that we have set risk discount rates to reflect the volatility in individual product cashflows. We
believe it is also an advantage of our method of determining new business profitability that it
is not influenced by changes in the market’s implied risk premium for the group as a whole. In
simple terms we have taken a bottom up rather than a top down approach.
As I mentioned earlier our economic capital work is an important input into our EEV models in
that it provides the assessment of the capital which we require. Applying our approach,
including capturing the time value of options and guarantees gives rise to a slight decrease in
the group’s embedded value at the end of 2004 of 1% to £8481m. Our approach to valuing
product cashflows under EEV gives rise to an increase in the margin earned on new business
profits in 2004, expressed as a percentage of APE, of 3 percentage points from 37% to 40%
and a new business profit of £741m.
Starting with our Interims presentation at the end of July we will be providing additional
disclosure that will show the impact, arising from new business and from in-force releases
separately, on our free capital, required capital and the value of in-force. Many of you have
been asking for this information; I hope you find it helpful.
Having set the scene for the morning let me now turn to regulatory capital.

IGD/FGD presentation
Slide 1 (Cover Slide) - Introduction
We have spoken before about the Group’s position under various EU directives, including the
Financial Groups Directive, which now applies to the Prudential.
When presenting our preliminary results I said we would come back to the subject today and
provide a little more explanation.
During this presentation, I intend to cover two things:
• First, to explain how the Groups Directive works
• Secondly, to explain the Prudential’s surplus position of £845m at the end of 2004 and
how that compares to the capital requirement of £2billion under the Directive.
Slide 2 - (3 pillars)
The evolving proposals for insurance regulation under Solvency II are based around a three
pillar approach, consistent with the requirements of Basel II that apply to banks.
Pillar 1 is about the use of standard rules to determine the minimum capital requirements.
Pillar 2 is about supervisory review, mainly in the form of company specific capital guidance
by the regulator following an internal assessment of each groups risks. This uses economic
capital, which we covered in the previous session.
Pillar 3 is about transparency and disclosure designed to achieve market discipline applied by
investors and rating agencies.
The current Pillar 1 requirements are met effectively by the Insurance Groups Directive and
the Financial Groups Directive, and from now on I will use three letter acronyms when talking
about them. The key difference between Pillar 1 and the other two Pillars is that Pillar 1 gives
us no benefit from being a well-diversified group. Pillar 1 is deliberately set to be a very
narrow valuation test based on the simple aggregation of our regulated businesses on a solo
capital basis. The consolidated requirement is exactly equal to the sum of the surpluses and
deficits that arise under this solo capital test. In our view there are three aspects of the Pillar
1 test which make it particularly prudent:

First, our economic interest in our well capitalised UK life fund is not brought into the
calculation at all;
Secondly, as I have already mentioned none of the offsetting benefits that come from the
diversification of our regulated businesses around the world is brought into account.
And finally, as the test is based on regulatory valuations very conservative assumptions are
brought into play in determining the surpluses.
Working within these three Pillars it remains our aim to optimise the use of capital across
them, recognising the different methods and intentions.
Slide 3 - (IGD and FGD contrasted)
The IGD came into effect and applied to us on 1st January 2001 and formed the basis of
regulation up to 31st December 2004. Since the 1st January 2005, Prudential needs to meet
the requirements of the FGD, as the group owns a banking operation in Egg. Obviously other
UK insurance groups are not in this position so are still under an IGD regime.
The underlying methods of calculation for the IGD and FGD are the same, in that all of our
insurance and non-insurance entities have to be valued on a resources less requirements
basis. However, up until the end of last year we were able to apply a more commercial set of
valuation rules under the IGD for businesses like Egg and M&G, where we were permitted to
carry at market value (Note: Excluding internally generated goodwill).
The FGD introduces an additional important requirement which is that it is a continuous and
hard solvency test so we are required to meet it every day of the year from 1st January 2005.
As I have said already there is little difference in the rules between the two directives and the
hard solvency test will apply under the IGD from 31st December 2006 with public disclosure of
the group’s solvency position required from a year earlier.
Although the FSA has made public disclosure of the solvency position under the directives
mandatory the details of that disclosure have not yet been worked out. We have as you see
today disclosed our position at the end of 2004 in advance.
Slide 4 - (Calculation Process)
The group capital requirement is broadly equal to the sum of the individual capital resources
less the capital requirements for each entity individually across the group.
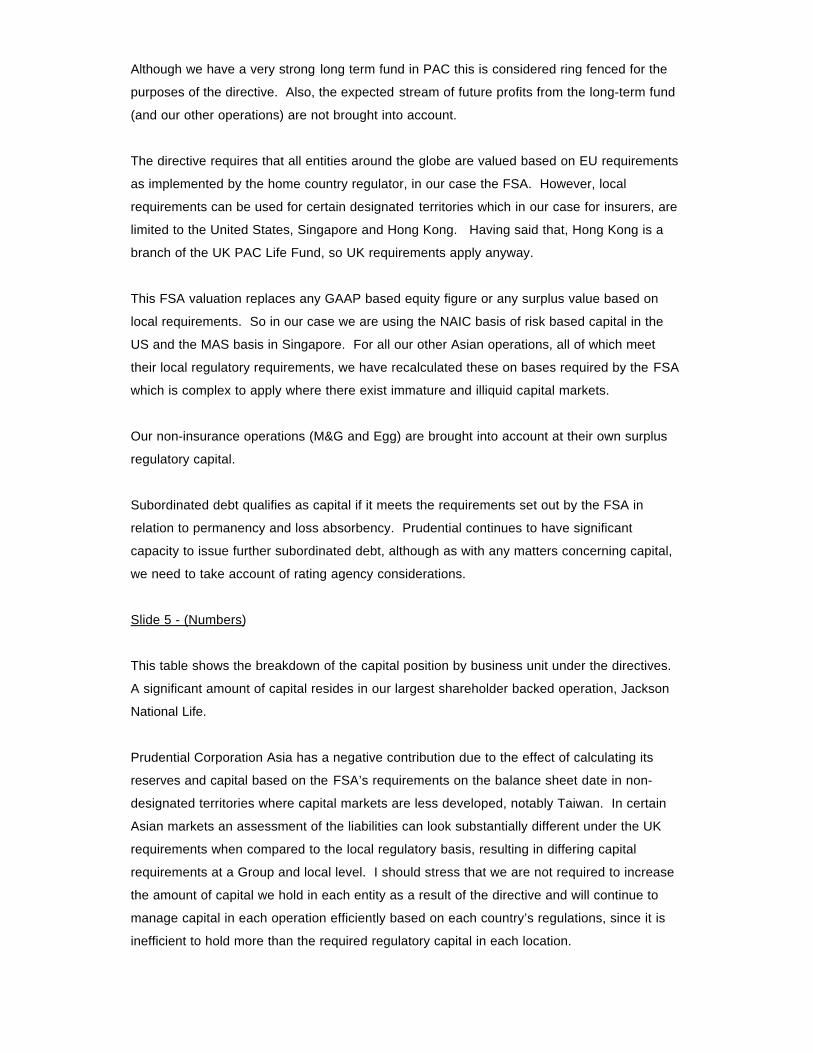
Although we have a very strong long term fund in PAC this is considered ring fenced for the
purposes of the directive. Also, the expected stream of future profits from the long-term fund
(and our other operations) are not brought into account.
The directive requires that all entities around the globe are valued based on EU requirements
as implemented by the home country regulator, in our case the FSA. However, local
requirements can be used for certain designated territories which in our case for insurers, are
limited to the United States, Singapore and Hong Kong. Having said that, Hong Kong is a
branch of the UK PAC Life Fund, so UK requirements apply anyway.
This FSA valuation replaces any GAAP based equity figure or any surplus value based on
local requirements. So in our case we are using the NAIC basis of risk based capital in the
US and the MAS basis in Singapore. For all our other Asian operations, all of which meet
their local regulatory requirements, we have recalculated these on bases required by the FSA
which is complex to apply where there exist immature and illiquid capital markets.
Our non-insurance operations (M&G and Egg) are brought into account at their own surplus
regulatory capital.
Subordinated debt qualifies as capital if it meets the requirements set out by the FSA in
relation to permanency and loss absorbency. Prudential continues to have significant
capacity to issue further subordinated debt, although as with any matters concerning capital,
we need to take account of rating agency considerations.
Slide 5 - (Numbers)
This table shows the breakdown of the capital position by business unit under the directives.
A significant amount of capital resides in our largest shareholder backed operation, Jackson
National Life.
Prudential Corporation Asia has a negative contribution due to the effect of calculating its
reserves and capital based on the FSA’s requirements on the balance sheet date in non-
designated territories where capital markets are less developed, notably Taiwan. In certain
Asian markets an assessment of the liabilities can look substantially different under the UK
requirements when compared to the local regulatory basis, resulting in differing capital
requirements at a Group and local level. I should stress that we are not required to increase
the amount of capital we hold in each entity as a result of the directive and will continue to
manage capital in each operation efficiently based on each country’s regulations, since it is
inefficient to hold more than the required regulatory capital in each location.

The Asian deficit under the directives compares to an overall Asian surplus under the local
regulations of £300m showing the significant effect of applying the FSA’s reserving and
capital basis.
Core debt and other adjustments remove the effects of downstreaming of senior and
subordinated debt and there is a small reduction in value due to inadmissible assets at the
holding company level, including the valuation of ancillary service companies at nil value.
Qualifying subordinated debt is added back as capital resources. You will be able to
recognise the core debt and subordinated debt figures from the annual report.
The total group surplus at 31st December 2004 as we reported it to the FSA in April this year
was £845m.
Slide 6 - (waterfall)
The purpose of this waterfall chart is to show the reconciliation between shareholders equity
based on the MSB accounts basis and the position under the directive. We start with
£4.3billion of shareholders’ funds in the accounts. There are three major reconciling items to
shareholders equity that we need to make.
First, we add back £1.4billion of subordinated debt as it qualifies as capital.
Secondly, as I have already mentioned we need to remove goodwill.
Thirdly, we have to deduct about £1.5billion of valuation adjustments to adjust accounts value
to regulatory surplus value, including removing things like DAC which are included in MSB
accounts but not under regulatory requirements. (This works out to £0.5billion each for JNL
and Asia, and another £0.5billion for UK Insurance Operations, Egg and M&G and
inadmissible assets at Group level together).
This leaves us with available capital of about £2.8billion.
Having arrived at our capital resources we now need to consider the capital resource
requirements, which are basically, the long term insurance capital requirements and resilience
reserves for each individual insurance entity. These amount to about £2billion leaving us with
a surplus of £845m under the directive over and above the capital requirement.
It is perhaps worth mentioning in passing that under the transitional arrangements provided
by the FSA up to 31st December 2004 we could have applied by written notice to the FSA to
continue to count certain subsidiaries like M&G at a higher value including goodwill supported

by external business. This would have enabled us to report a surplus of £2.2billion at 31st
December 2004.
As I said in my introductory remarks we do expect that the form of Pillar 1 reporting will
change over time with the introduction of Solvency II. In the meantime we will we have put in
place a group-wide projection model to monitor our compliance with the continuous solvency
requirements.
Having explained the regulatory capital position under Pillar 1, I will now hand over to Andy as
we move on to Pillar 2, our view of economic capital.

Economic Capital presentation
Slide 1 (Cover Slide) – Introduction
Good morning.
We initiated the economic capital project three years ago in order to enhance our group-wide
platform for business management. The project was a significant undertaking as it imposed
the strict discipline of a single-yardstick to assess and quantify all of the risks, and associated
capital requirements, across the Group.
We have also put in a place a regular reporting process across all of our operations. The
economic capital position across the group is a regular agenda item at the Group’s Asset-
Liability Committee.
In this presentation I will first describe the high-level objectives behind this initiative
Second, I will explain some of the key principles underlying the approach that we have
adopted.
Third, I will share with you some of the results of the model, and discuss some of the key
applications of this important work, in particular around how we manage and allocate capital
across the Group.
Slide 2 - (Three Key objectives)
We had three principal objectives for undertaking this project.
First, to enhance value creation.
We seek to create value for our shareholders by allocating our capital where returns – on a
risk-adjusted basis – are most attractive.
Risk-adjusting those returns is no trivial task.
We operate under a variety of local reserving and capital regimes that do not always provide
a consistent view of capital at risk. Our economic capital framework allows us to correct for
those inconsistencies and provides us with a more rational, and often differentiated view, of
the prospective attractiveness of the markets that we operate in.
And of course, we intend that this feeds into the performance management process.
Second, to enhance our risk management capabilities.
At Prudential, we deliberately operate as a decentralised group - we firmly believe that
business decisions should be taken by our local people in their local markets. Nevertheless,
it is important that we continue to monitor the risk profile of the Group as a whole and have a
line of sight into our businesses.
This ensures that as we grow and expand, across markets and products, we continue to
operate according to a single standard for managing and assessing risk.

Finally, we wanted to be able to demonstrate the financial strength of the Group on an
economic basis.
Existing regulatory views do not always fully capture the risk profile and capital adequacy of a
global and diversified business like ours. The regulators clearly recognise this and are
seeking to use internal models as a component of the Solvency 2 proposals.
We have engaged with the FSA throughout the development of this framework. We have had
a very useful two-way dialogue, which has informed our thinking on the whole issue of
diversification. We also recognise that our ability to realise diversification benefits is limited
by constraints on capital mobility around the Group.
Our dialogue with the FSA is continuing, and we intend to provide them with the detailed
internal models as part of our Group Capital Assessment in due course.
We will thus only cover the in-force book throughout this presentation.
In addition all the major rating agencies are showing a lot of interest in the use of internal
models as a supplement to their current processes and we have already had some useful
discussions with them.
Slide 3 - (Key Principles)
In devising our framework, the principles that we adopted were guided by two things:
The need to ensure a sound theoretical framework, as well as the imperative to have a
practical approach that can support real business decisions.
We set out three key principles at the start of the project:
The key driver of our approach was that we wanted to capture diversification benefits within
each business and across the Group.
The issue of diversification is an absolutely fundamental requirement, as this is core to our
strategy as a geographically and product-diverse Group.
Second, we use a multi-period approach in which we model cashflows over the run off of the
books of business.
Our primary motivation for adopting this approach is that it suitably captures the nature of the
risks that we are exposed to and how we manage them. For example, our exposure to asset-
liability risk evolves over time - we manage that through dynamic asset allocation and flexible
bonus and crediting strategies.
Finally, the risk coverage has to be comprehensive covering all of our risks, financial and
operational, with a clear focus on the major exposures.
… Next, I will walk you through in a bit more detail the implications of each of these three
principles.

Slide 4 - (Principle 1)
Turning to diversification and capital mobility…
Perhaps the most distinctive feature of our approach is that it allows Prudential to assess the
economic solvency of the Group on an integrated basis.
At the core of the model is an integrated scenario generator that we maintain centrally. We
call it GeneSiS: Generator of Stochastic Investment Scenarios. This model produces a set of
investment scenarios that capture all the major financial risk drivers across the Group. In
other words, correlated scenarios for interest rates, equity returns etc.
The scenarios are produced taking into account the probability of each outcome occurring
and the way the risk drivers interact with each other.
For example, while global equity markets are highly correlated at times of distress, the same
is not necessarily true for interest rates, inflation or credit defaults.
Our model captures how our business benefits from the diversity of exposure to various risk
factors that do not always move in synch with each other.
These scenarios are then fed into detailed asset-liability models of the businesses. The
detailed modelling produces projections of cash flows and balance sheets for each business.
Note also, that these business unit models produce stand-alone economic capital analyses
that are used for business unit applications. Our economic capital work is all about business
application at both group and individual business unit.
(more next page)
For each scenario, we can capture whether a certain business generates excess capital that
can be up-streamed to the group, or conversely whether the business requires a capital
injection from the Group.
We bring together the cashflows from each of the individual businesses into the Group
Solvency Model. Also, cashflows from other group activities such as expenses and interest
on hybrid debt.
The financial strength of the Group is then assessed through observing the frequency of
Group insolvency across all the range of the random scenarios generated. In this context you
can think of Economic Capital as the amount of “buffer” capital that the Group needs to
remain solvent in all but very extreme “tail” scenarios.
What is an extreme tail scenario? Given the mix of business we hold, the scenarios that tend
to drive our capital requirement are those that have strong falls in one of our main markets –
UK, US and Taiwan – and moderate falls in the remaining two. Extreme behaviour resulting in
increased capital requirements in all three markets simultaneously tends to be rare. So by
way of example, capital might be driven by a combination of sharp interest rate rises in the

US, bond losses in Taiwan, and below average investment returns in the UK which reduce
the transfers coming out of the 90:10 fund.
At the moment, the Group Solvency Model covers 80% of our business. The economic
capital for the remaining business is calculated in individual stand-alone models. This is then
added to obtain the Group Capital Requirement using a correlation matrix approach. This is a
standard aggregation approach used by banks and some other insurers.
Over time of course, we will look to migrate more individual stand-alone country models into
the Group Solvency Model. However, at the same time we will ensure that our
developmental efforts are targeted at areas that will best enhance our understanding of the
business.
Slide 5
As I mentioned earlier, our model is designed to reflect the mobility of capital around the
Group. Given that “tail events” DO NOT occur across all of our businesses at the same time,
we can transfer capital out of a strong business into a weak business where necessary.
However, our ability to make such transfers is constrained by the local regulatory
requirements of the businesses. It is these constraints that limit the capital mobility across the
Group.
If you think of the Group capital as the central capital pot…
… the model captures the business unit cashflows into the centre…
…. with the cashflows to and from the Group limited by the regulatory constraints shown in
the grey boxes.
Our economic capital framework is, after all, a business management tool. We assess the
economic position through looking at what happens to the business over many different
possible economic scenarios while reflecting the reality of the environment we operate in.
For example, focusing on the top grey box, we do not take any initial credit for the estate in
the PAC with-profits fund. However, we do allow the 90:10 shareholder transfers to flow
through each year to the Group Capital Balance. This happens as claims are paid and
bonuses declared, depending on the economic environment determined by the scenario.
And of course, there are extreme scenarios where the PAC fund requires an injection.
However, some of these will not be extreme scenarios for the group, as at that point, cash
would have also been generated from another Business Unit.
The Group Solvency Model also captures the effects of non-discretionary cashflows that
occur at the Group level.

The main cash outflows are expenses and the cost of servicing subordinated debt, and we
also capture investment returns on capital held at Group level.
As this is an in-force solvency model, we have not put in the impact of future dividends and
new business here.
Slide 6 - (Principle 2)
Next, the multi-year approach…
We assess our capital requirement on a multi-year basis using a 25-year projection. By multi-
year, we mean that we examine the solvency position at the end of each projection year, and
track the total number of times that the Group Capital Balance falls below zero.
The best way to think about this is as a three step-iterative process.
First, we start with an estimate of the required level of capital from our total available capital
base. Here, we start with zero.
Second, we run our random investment scenario generator, feed the scenarios through the
Business Unit ALM models and feed the results through to the Group Solvency Model.
Then, we look at the frequency of Group default over 25 years across all the scenarios.
On the vertical axis we have the random scenarios, say 1 to 1000. As an illustration, here we
show 100 on the slide. On the horizontal axis we have the time horizon, i.e. 25 years.
The red dots you see here signify a Group default occurring in that time period. It is
cumulative, in that once you default, all future years are also red – i.e. you don’t recover. The
green dots signify that the group is solvent in the time period.
Just looking at the number of red dots here, this initial starting level of capital of zero is clearly
insufficient.
So, we iterate through the process, add more capital and re-run the model until the observed
frequency of Group default is within our Group standard for financial strength.
We then rank the scenarios from worst to best, then we check that this meets our target
calibration…
Slide 7 - (Calibration of standards)
Setting a common group target for default frequency is critical as it allows us to assess all
risks and businesses using a consistent yard-stick. There are a number of approaches to
setting the actual targets. For our purposes, we have adopted the calibration that is
represented by the line here

The line represents the target probability of default over 25 years. In other words, we target a
level of capital that ensures that our probability of default is always above the line as you can
see from the red area on the chart.
The Group target is 4.4% over 25 years. By way of comparison, this is equivalent to the
cumulative probability of default of a AA bond. This means the Group is capitalised such that
we act as a very highly rated counter-party to our policyholders.
Note that our chosen level of calibration is well in excess of the minimum set by regulators,
which is generally a BBB consistent basis. Here we have also shown the historic cumulative
probability of default on BBB bonds.
To protect and grow our business franchise, we choose to hold to operate at a higher
standard than the minimum “investment grade” standards that regulators require.
Slide 8
Finally, risk coverage…
As a Group, we are exposed to a wide variety of risks across our businesses. This table
shows which risks are captured and where.
The Group solvency model captures the largest components of these risks across our major
business models as shown here
ALM risk covers the effects of interest rates and investment assets such as equities, property
and bonds. You will see later that credit risk is an important risk exposure for us, and we
spent quite a bit of time getting a robust and detailed credit risk model that allows for spread
volatility, credit migration and default incorporated into the broader framework.
Operational risk is captured in aggregate and quantifies the capital required to withstand tail
operational losses. Specifically, losses that are high severity and low frequency in nature.
This was modelled by first fitting frequency and severity distributions to risk parameters. The
parameters were obtained through extensive risk workshops across the group, and sense-
checked through an analysis of an external loss database. Capital requirements were then
obtained from simulating over a large number of stochastic iterations.
For the remainder of our businesses, we use standalone economic capital models to cover
the other large operations in Asia as well as Annuity business within the life fund.
For now, we continue to use regulatory capital requirements to cover M&G, Egg and other
operations.

Slide 9 - (Group Available Capital)
Up till now, we have focused on how we calculate required economic capital. This is how we
determine available capital…
We have defined available capital to be broadly consistent with the FSA’s definition for the
Integrated Prudential Sourcebook, in that equity and subordinated debt counts as capital, but
goodwill doesn’t. There are also valuation differences due to the conservatism in the FSA’s
valuation of assets and liabilities.
We start off with our UK GAAP shareholders equity.
We then take off the £1.4bn goodwill, add in the £1.4bn subordinated debt
Make £0.9bn of further adjustments, to arrive at our available capital figure of £3.4bn.
The £0.9bn valuation adjustment is driven by a combination of
- adjustments to shareholders’ equity to bring the available capital onto a basis consistent
with our calculation of required capital, and
- marking to market senior debt, which is then removed from the available capital all
together.
The former requires a £250m adjustment for Asia and £500m for JNL, and the latter is around
£100m.
This is similar to the adjustments made for IGD, but consistent with the way we approach
required Economic Capital rather than required IGD reserves.
Slide 10 - (Group Capital Position)
Now let’s look at the results of all this:
Just to remind you, we are looking at how much capital we have available in the group for the
in-force book, compared to the capital we require to meet the group’s target probability of
default. The more capital, the fewer defaults.
At the end of 2004 we had a surplus of £1.6bn at our target calibration, which you will
remember is equivalent to the historic probability of default of an AA rated bond over 25
years.

As I mentioned at the start, one of the principal uses of the model is as a risk management
tool. The following two slides show the economic capital consumption at the group target
level, by business unit and by risk type, on a diversified basis.
Slide 11 - (Capital Position by BU)
The pie chart provides a snapshot of the risk profile as at end-2004.
JNL is the largest shareholder operation at Prudential and naturally requires the most
economic capital.
The PAC long-term fund has a nil requirement. Modelling demonstrates that it does not
require any capital from shareholders due to the large size of the estate.
Over time, we would expect this to evolve in line with our business mix. For example, our
current focus on growth in UK and Asia will drive a greater proportion of the risk towards
those businesses.
Going forward, as JNL shifts its product mix towards Variable Annuities, we expect that the
economic capital requirements for JNL will reduce.
Slide 12 - (Capital Position by risk)
By risk type, the greatest shareholder exposure is to credit risk, which is not surprising given
the relative size of the direct exposure to JNL, the UK annuity corporate bond portfolios as
well as Egg.
In contrast, underwriting risk is only 10% of the total, mostly reflecting the longevity risk in the
UK annuity portfolios. This is due to the fact that at the group level longevity risk is fairly
independent of other market type risks and therefore rapidly diversifies away. In fact, on a
marginal basis, for each additional £1 of standalone longevity risk we take on, approximately
80p to 90p of it diversifies away. Given our current risk profile, appropriately priced longevity
exposure provides very attractive returns on an economic capital basis.
Clearly, this risk profile is not static over time and we do monitor and adjust our exposure both
at the Group and business units levels. In fact, the framework allows us to regularly monitor
our risk-taking and adjust our profile depending on the attractiveness of how risk is priced in
the market and our own risk appetite.
Slide 13
The economic capital framework is a long term project to create a major piece of
infrastructure for the Group. The framework will be used to address the three objectives that
we laid out at the outset.

Our businesses are beginning to use Economic Capital in product design, asset-liability
management and hedging strategies. Let me give you a few concrete examples of what this
means in practice.
From an Asset-Liability management perspective, we actively use Economic Capital to inform
bonus declaration decisions. This provides an approach that can enable us to manage our
crediting policies more carefully.
From a product management perspective, we need to continue to use the regulatory view of
capital requirements, but are also introducing economic capital requirements in our
assessment of new products. An assessment that is based on economic capital can be very
different from the pure regulatory views adopted by local peers. This will allow us to use a
different, and more economic, lens for identifying attractive opportunities in our various
markets.
From a Group perspective, we can actively manage and use the framework to inform capital
allocation decisions. In particular, we will drive towards deploying capital on an economic
basis while centrally managing the differences between economic and regulatory capital
needs.
From a risk management standpoint, we use economic capital as a group tool to understand
the risk profile within our businesses as well as our overall capital adequacy position. Over
time, we expect this measure to become increasingly prominent in our regulatory and rating
agency dialogues.
Slide 14 - (Capital Management Slide)
To summarise, we view the economic capital framework as an important enabler for
improving our capital allocation decisions. In fact, our de-centralised management philosophy
goes hand-in-hand with an active capital management approach as to how we run our
business.
While the presentation this morning covered all three objectives - I would like to focus your
attention again to our first objective here …
… namely enhanced value creation for our shareholders.
Our ability to assess the attractiveness of opportunities in the global market place and to
deploy capital against those opportunities will be a key success factor for the Group.
Economic capital will allow us to assess opportunities on a like for like basis. We intend fully
to embed the economic capital framework structures for the Group.
We believe that this provides us with an enhanced approach for capital allocation that
ultimately leads to superior value creation for our shareholders
Thank you for your attention.

IFRS PRESENTATION
Page 1 - Cover slide
Good morning everybody.
We have a 20 minute slot to explain the impact of the conversion to IFRS basis reporting. For
this short session the focus will be on key issues of particular interest.
Page 2 – Adoption timetable
To start, some brief words on the implementation timetable.
We will publish our interim IFRS results on 27th July together with, for the last time, results on
the Achieved Profits basis. For the year-end we will change from Achieved Profits to the
European Embedded Value method.
Page 3 – Summary impact – Economic measures
First, some context setting may be helpful.
Fundamentally we do not expect the adoption of IFRS to have a significant impact on our
business. The key point is that although, numerically some of the accounting effects are
material the underlying financial position is not significantly affected.
On dividend paying capacity – this is a function of cash, distributable reserves, and regulatory
positions within the group’s companies.
For most of our businesses the IFRS changes are either insignificant or relatively modest. For
Jackson National Life, though, there are very significant IFRS valuation changes for
investments and derivatives – but none of these affect the local regulatory position.
On capital strength, commentators look to our accounts-basis gearing ratio.
The core debt part of the calculation is unaffected by IFRS. However, Group IFRS basis
shareholders’ funds will be more volatile from period to period for market value movements on
Jackson’s fixed income securities. I will explain more on this later.
Page 4 - Summary impact of IFRS; financial reporting: Overview of change
On the generality of accounting for life insurers, - a very brief overview for those not overly
conversant with the issues.

In the interests of time I confine my comments in this presentation to the major technical
aspects of the conversion process, and to which we have previously drawn attention in the
financial review section of our 2004 Annual Report.
On investment accounting, with the exception of Jackson no great change has been
necessary. For Jackson we have though needed to change from an amortised cost approach
to a fair value model.
On derivatives, which are generally required to be fair valued, we have applied hedge
accounting in only a small number of areas but, as will become apparent in this presentation,
the major issue is our derivative book in Jackson.
On insurance accounting, some 85 per cent of our contracts fall under the technical definition
of insurance contracts, containing significant insurance risk, or those with discretionary
participating features such as with-profit contracts.
Accounting for these contracts is grand fathered so that UK GAAP can continue to apply
under the IASB’s phase 1 approach.
For those contracts that are instead classified as investment contracts new rules apply. For
us – that comes down to certain UK and Europe unit linked contracts and Guaranteed
Investment type contracts in Jackson.
In fact though it is only the UK unit linked contracts where there is any change of substance to
the results. .
Of the other major items – the Fund for Future Appropriations is UK GAAP-speak for amounts
held in with-profits funds that have yet to be allocated between policyholders and
shareholders. For UK GAAP it is excluded from shareholders’ funds – this treatment will
continue under IFRS. There is no change to the basis of profit recognition for with-profit
contracts.
In fact, despite the multitude of detailed IFRS changes the areas of change on headline
results are comparatively limited.
Page 5 - Summary Impact of IFRS - Financial Reporting; significant changes
The important point for this meeting is that there are three Pru specific areas that we need to
cover.

For insurance contract accounting the changes are limited to altered profit emergence for
accounting, but not regulatory, purposes for some of our unit-linked business in the UK and
Europe.
The most significant change, numerically, relates to the valuation of derivatives and fixed
income securities of Jackson. However, as I will explain the changes serve only to detract
from an unaltered underlying position.
The third item is pension costs where, for all but minor differences, the financial position on
the Group’s UK defined benefit schemes, as previously disclosed in our FRS17 disclosures,
is consolidated into the balance sheet.
Each of these changes was flagged in the disclosures in our 2004 Annual Report and should
not be a surprise.
Page 6 - Re-stated IFRS results
Turning now to the results, working our way down the slide on items of particular note.
Basis of presentation
First, the basis of presentation. With our ownership of Egg, like most of the banking industry,
we have chosen to formally adopt IAS39 (the key financial instruments standard) from 1
January 2005 rather than the beginning of 2004.
Our approach to IAS39 adoption is though important to an understanding of the dynamics of
future results of Jackson.
The restated results shown here include the effects of IFRS4 (the insurance standard) and
IAS39 had we applied these standards to our insurance operations in 2004.
Premiums
On premiums, briefly – a technical change that is large but purely presentational, and does
not of itself affect profit.
The change is required for the previously mentioned types of business that are required to be
accounted for as investment contracts, with premiums and withdrawals now recorded as
movements in the balance sheet rather than the income statement.
The new business announcements will continue to reflect premiums for these contracts.
Achieved Profits and European Embedded Value basis results are not affected by the
change.

Operating profit
On operating profit, the first point to note is that we will continue with the current industry
practise of publish an operating result based on longer-term returns, as a supplementary
reporting measure.
Those of you who have had time to assimilate the announcement this morning will know that
we are changing the basis of determining longer-term returns – which I will explain later.
However, for this slide, the point to take away is that the pure IFRS changes reduce operating
profit by just £15m.
Of the change, £9m arises from the altered profit profile of the UK unit linked business that is
required to be accounted for as investment contracts.
The change though does not alter profit emergence on a regulatory basis; also the achieved
profit basis results are unaffected.
Shareholders’ share of actuarial gains and losses on defined benefit pension schemes
On pension scheme accounting, we would have preferred to book actuarial gains and losses
direct to the balance sheet under IAS19. The IFRS standards though seemingly prevent this
for companies such as ours where the deficit is partially attributable to a with-profit fund.
The charge here of £7m is comparatively small but in a year when asset returns are
particularly high or low, or significant changes of assumption are necessary, the amounts
could be quite large.
Short-term fluctuations in investment returns
Finally, value movements on Jackson’s derivatives dominate short-term fluctuations in
investment returns – for 2004 a £144m credit.
The derivatives are now required to be carried at market value, with value movements booked
in the income statement.
The volatility reflects the fact that we have not sought, and will continue not to seek, to hedge
account; in other words not to formally document individual hedges so as to try to match up
value movements on hedged instruments in the income statement with the derivative value
movements.
Page 7 Interest rate swaps – Hedging approach

Could we have used hedge accounting under IAS39 to mitigate the volatility and show the
level of economic hedging in the accounts?
Most of the volatility arises on Jackson’s interest rate swaps.
Jackson uses interest rate swaps to bridge the gap between its floating rate institutional
liabilities and the fixed rate bonds it uses to back them.
The Jackson approach to these issues is to undertake economic hedges at an appropriate
level of aggregation that meets the underlying objective but at the same time allows the
investment managers to focus on finding the most attractive assets within investment policy
benchmarks.
It also allows the programme to be managed more flexibly to address altered portfolio
duration for changes in liability cash flows.
The cash flows (and thus the spread) are insulated through the use of interest rate swaps but
differences in risk premium attaching to the bonds and swaps can cause the relative mark to
market movements to give rise to temporary volatility in the net value of these instruments.
By contrast, any economic mismatch will be captured in spread, as the cash flows will reflect
this.
The interaction of these complexities, and the requirements of IAS39, make standard hedge
accounting at the level of individual transactions for interest rate swaps under IFRS
impractical to achieve without a whole sale re-configuration of Jackson’s derivative book into
much smaller components.
This would need to be accompanied by an extra layer of hedging instruments, beyond what is
economically rational, to achieve the best accounting answer. Even then, the requirements of
IFRS are such that there will almost inevitably be some volatility to book,
The IAS39 macro hedge rules are also not helpful.
A great deal of consideration has been given to the practical consequences of attempting to
achieve hedge accounting as best the rules would permit. We have decided that the
economic costs of re-configuring the book to achieve a better accounting answer, was simply
not justifiable.
Page 8 Movement in JNL derivative values
This slide shows the value movements on Jackson’s derivatives since 2002. These figures
have been compiled from the FAS133 adjustments that we have previously booked for US

GAAP filing purposes. Jackson’s own US GAAP financial statements, that for some time
have been provided to analysts with our annual results presentations, have also incorporated
the effects of these value movements.
As you can see the value movements have been highly volatile. The features that cause this
volatility will undoubtedly continue.
As mentioned before, the largest component relates to value movements on Jackson’s
interest rate swap book.
The smaller other items cover various instruments that are used for a variety of ALM
purposes. Even if we wanted to hedge account, for some of them IAS39 is not suited.
An example is the swaptions programme, which are insurance type arrangements rather than
conventional hedge instruments, which protects Jackson from large spikes in interest rates –
economically sensible, but not IAS39 friendly for small increases in interest rates.
Page 9 Shareholders’ funds
If we now turn to the impact on shareholders’ equity, there are two substantial changes to
spend time on this morning.
First, - the uplift of £273m in respect of Jackson.
This reflects the combined effect of marking to market value the fixed income securities, the
effects of which are dealt with directly in shareholders’ equity, the value movements on the
derivatives which we saw earlier, and the offset of related effects on deferred acquisition
costs and deferred tax. The key driver is the movement in the market values of the fixed
income securities.
Most of the fixed income security book is held to maturity or at least for the longer term and
valuation differences on individual instruments can be expected to reverse over time.
The use of amortised cost accounting is though not available to us as the IAS39 rules, as
under US GAAP, are very stringently drawn and we are therefore obliged to carry them in the
balance sheet at fair value.
In any one period, due to movements in interest rates and credit spreads, the difference
between current value and amortised cost (as previously applied under UK GAAP) can be
very significant and the movements, from period to period, highly volatile.
At the 2000 year end the fair value of Jackson’s fixed income securities was some 800 million
dollars lower than the amortised cost.

By contrast, at the end of 2004 the fair value exceeded the amortised cost by 1.9 billion
dollars, – a turnaround in under 5 years of $2.7 billion dollars.
Offsetting movements in the values of hedging derivatives and related accounting effects on
the balance sheet values of deferred acquisition costs and deferred tax reduce the impact the
impact on shareholders’ equity from the 1.9 billion dollars, (about a billion pounds) at the end
of 2004 to the £273m on the slide.
Nevertheless, we can expect more volatile movements in shareholders’ equity on the IFRS
basis simply as a result of interest rate movements.
The second item I would like to touch on is pension cost accounting.
Page 10 - Pension costs
This slide shows the accounting impact of putting on balance sheet the deficits of the three
UK defined benefit pension schemes. The main scheme is the Prudential Staff Pension
Scheme that accounts for 90 per cent of the liabilities.
The key point that needs to be conveyed here is that the net deficit is apportioned between
the PAC with-profit fund and shareholder backed operations. That apportionment reflects the
cumulative level of activity, and therefore, historic funding by the different funds and
companies of the group.
The next triennial valuation of the main staff scheme is to be undertaken as at 5 April 2005.
This will be accompanied by the formulation of proposals on funding principles to be agreed
with the trustees.
Page 11 – Discretionary change to longer-term returns
That concludes the discussion in this presentation of the main IFRS changes. We now
though come on to an additional change that we are choosing to make at the same time as
the IFRS implementation.
This slide shows the effect of the change which is to replace the basis of determining longer-
term returns in operating results for fixed income securities of shareholder backed operations.
Total profits, which includes actual investment returns, of course do not change.
Now to back up for a minute – why are we publishing an operating result based on longer-
term returns at all? Total profit is inevitably volatile for short-term market movements on
investments that, by and large, are held for the long-term to back liabilities and solvency
capital.

This volatility obscures underlying performance. So, for many years now, in line with industry
practise, we have published operating results that reflect underlying results that incorporate
longer-term returns.
Historically, for fixed income securities, we have applied 5 year averaging of realised gains
and losses as a short-hand estimate of longer-term default levels and a way of spreading
forward recognition of realised gains that merely arise because of movements in interest
rates.
The 5-year approach was first applied in the late 1980s, and the use of longer-term returns
enshrined in the ABI Statement of Recommended Practise. 5-year averaging is
arithmetically simple but it is though a crude approach.
Page 12 JNL altered longer-term returns for fixed income securities
The change we are making primarily affects the analysis of the Jackson results. On the
previous basis, 5 year-averaged losses on fixed income securities of £102m would have been
included in the operating result.
That £102m comprised a charge of £153m for credit related losses offset by £51m of gains
arising from interest rate movements.
The replacement method is much more reflective of longer-term returns, rather than 5 year
experience, and is intellectually much more rigorous.
The major difference between the new and old methods is for credit related losses. The new
method is to make an annual allowance, by use of a risk margin reserve approach based on
long-term bond market experience as analysed by the rating agencies.
The allowance is built up on a granular basis applying an appropriate factor depending upon
the credit quality of the bonds in the portfolio based on 3 and 10-year studies by Moodys.
Applying these factors, the IFRS operating results for Jackson include an RMR charge of
£47m, details of which are contained in your packs, rather than £153m of average credit
related losses.
Before we leave this slide some general comments:
Why is the change so large?
Essentially, because the losses in 2001 and 2002 were not just bad years in a credit cycle but
reflect a level that was truly exceptional across credit cycles over the last 50 or more years,
as evidenced in the studies undertaken by the rating agencies.

How is the shape of our operating results affected?
The restated 2004 operating result is of course much higher – but let’s think about the trend
and how the new method is an improvement.
On the previous basis, If the level of defaults over the next few year were to be aligned to
longer-term levels, and we had stayed on 5 year averaging, the averaged losses for 2006,
2007 and beyond would have reduced to levels very significantly below the 2004 level of the
£102m charge.
In other words, on the previous 5-year averaged basis, the trend in future operating results
would have had an in built uplift bias.
By contrast we would expect the new method to be much more stable from period to period,
and we are starting with that more stable platform from a restated 2004 set of results.
The allowance for defaults is directly linked to the assets held - assuming the current credit
quality mix, the RMR charge will increase proportionately for growth in the size of the book.
And finally - amortisation of interest related gains and losses will primarily reflect the run-off of
gains made in prior years and better reflect the maturity period of the sold bonds.
Page 13 - Impact of IFRS on value based reporting measures
This last slide shows the consequential impact on the Achieved Profits results. The changes
shown are also carried over to the European Embedded Value results.
There are two points I would like to draw to your attention.
First, the short-term volatility effects under IFRS for Jackson’s fixed income securities and
derivatives do not manifest themselves under Achieved Profits.
Second, on pension costs, the expense assumption for pension costs built into the UK
Achieved Profits basis results reflects the current rate paid and contributes towards the
actuarial service cost of current employees.
The Achieved Profits basis accounting issue on converting to IFRS is how to address the
IAS19 deficit in the absence of altered funding principles.
It is clearly appropriate that the value-based results should somewhere reflect the company’s
obligation, but a random assumption about future contribution levels would be inappropriate.

What we have therefore done is centrally book, in the group’s consolidated Achieved Profits
balance sheet, two amounts
First, the £115m deficit for shareholder backed life and non-life operations, that is booked
under IFRS, and
Second, augment it with an additional deduction of £47m for the shareholders’10% share on
these bases of the deficit attributable to the with-profit fund.
This approach has the advantage of being transparent and directly linked to the IAS19 basis
results.
Page 14 - Conclusion
To sum up,
We have a series of accounting changes that have separate effects on operating profits, total
profits, and shareholders’ equity. Obviously these will take time for market observers to
assimilate.
However, as I said earlier, the IFRS changes have been well trailed in our 2004 annual report.
More importantly, apart from giving our accountants multi GAAP migraine, none of these
changes should have a significant impact on our business
Finally, for those of you who enjoy “join the dots” puzzles, I would add that there is a large
amount of detail in your packs.
We have about 10 minutes before the coffee break – can I suggest that we use the Q and A
session for general questions. If there are more detailed questions on particular numbers we
will of course be happy to address them in due course.
EEV Presentation
Slide 1 – Cover Slide
Thank you ladies and gentlemen, we conclude today’s session with the final presentation,
European Embedded Value. This has been a major piece of work for us across the Group
and Philip and I are very grateful to our colleagues across the Group for their efforts in
preparing the results. Whilst EEV has led to fundamental changes to the way we calculate
embedded value, as you will see the overall impact on the numbers is relatively modest.
I will take you through our overall approach to EEV, before handing over to Philip who will
discuss the key results.
Slide 2 – The EEV framework
Our approach can be summarised in a few words. We have attempted to be as closely
aligned as possible with the principles and in particular to make a coherent and consistent
allowance for risk and create a linkage to our economic capital framework.
The Group’s interim 2005 results will continue to be reported on an achieved profits basis in
line with the original EEV timetable. We will publish a full set of results and sensitivities in
December before fully adopting the principles for the 2005 full year results.
As we go through the numbers please remember that the comparatives that you will see are
on a like for like basis in that they exclude the changes brought about by IFRS reporting
except where indicated.
Slide 3 – Headline EEV Results
Before we go into the detail I’ll just summarise the headline results.
As you can see, adoption of EEV results in an 8% uplift in both the Group’s 2004 new
business profits and long-term operating profits from an achieved profits basis whilst the
Group margin of 40%, measured against Annual Premium Equivalent, is up 3 percentage
points. Group embedded value is little changed.
Philip and I will go into the reasons behind these effects a little later but at this stage it is
worth emphasising that EEV does not affect the fundamental economics or capital strength of

our business which, as this morning’s earlier presentations have demonstrated, remain
strong. Indeed the EEV results are a reflection and confirmation of that strength.
Slide 4 - Key Principles
Many of you will be very familiar with the 12 principles so I will not go into details of what they
require, but will instead highlight those that affect Prudential. These are shown in red. The
most important principles and those we will be focussing on today are those in respect of
required locked-in capital, the valuation of financial options and guarantees, and the
economic assumption sets – in particular risk discount rates. In other respects, the principles
are very similar to the current achieved profits basis so they have not resulted in a change in
approach for us.
Slide 5 – EEV framework aligns with how we run our business
The principles essentially espouse a risk-based approach to valuation. Such anapproach is consistent with how we run our business, in terms of the economic capitalframework I described earlier and in our approach to pricing, bonus rates, and assetallocation.
As far as capital is concerned our starting point is our group target for economic capital as
discussed in my earlier presentation. We then overlay local regulatory capital if this is higher.
In Asia, the use of group targets has led to an increase in locked-in capital, whilst in the UK
and US the level of capital used for achieved profits has proved to be adequate to meet our
target.
The second way in which risk is captured is in the valuation of financial options and
guarantees. We have done this by doing a complete stochastic embedded value calculation,
building on the robust models we have developed for economic capital. We calculate the
impact of the time value of options and guarantees by comparing it with a deterministic
embedded value.
As required by the principles, the option valuation uses a real world basis with investment
return and risk discount rate assumptions that are consistent with the deterministic models.
By real world I mean that we allow for the expected rate of return on each asset class,
including, for example, the equity risk premium.
As for risk discount rates, we have used a bottom up approach to capture the volatility of the
in-force cashflows. This is both product group and geographically specific. This is different

from the top down WACC approach used by some of our peers and I’ll go through this in
more detail shortly.
One very important point to remember: the principles are very clear that where risk is allowed
for in one part of the calculation it should not also be included elsewhere.
We support the overall approach of the principles with regard to risk. A risk-based approach is
central to the way we run the group and how we manage it. In particular our approach to
asset allocation, bonus strategy, product pricing, and capital management.
So now let’s look at each aspect of the risk framework in more detail.
Slide 6 – Capturing Risk: Capital
The first element I want to look at is capital.
As I mentioned before, the approach to locked-in capital within EEV is consistent with the
economic capital framework with all major risks allowed for. One significant difference does,
however, stem from our bottom-up approach to EEV which means that we treat each
operation as stand-alone. We therefore take no account of the significant geographical
diversification benefits that arise from being an internationally diverse insurer and which are
reflected in our economic capital framework.
So what does this mean in terms of capital levels? The table on the right hand side shows the
capitalisation ratios for some of our key businesses. The comparators used are those most
suitable for each of them. For example in Asia, given the various regulatory standards that
exist across the region it is more meaningful to express the levels of capital as a percentage
of a common denominator which we have chosen to be the FGD requirement.
This summarises what we have done for shareholder backed business.
For our with profits funds the estates are sufficiently strong to cover the economic capital
requirements. Thus, there is no change from our achieved profits approach.
I will now take each of the key businesses shown on the slide in turn.
Slide 7: UK Annuities Capital
For the UK we only need to consider annuities written in PRIL. The capital requirements for
the Life Fund are covered by the estate.

The level of locked-in capital assumed for these annuities is the current Pillar I requirement of
4% (ie 100% of the EU minimum), the same level as for achieved profits. For those of you
who attended the UK strategy update a few weeks ago, this will be a familiar chart. We have
compared both the economic capital requirement at the Group target level and the Pillar II
Individual Capital Assessment with the Pillar I level. As you can see, all three are similar. Just
to give you some context, the Pillar II level of capital is actually sufficient to cover the extra
annuity payments that would be made in the event that a cure for all smoking cancers was
found within the next 5 years.
We believe that if we have enough capital to cover a scenario such as this, there is no need
to lock-in any more than the EU minimum, ie 4%.
Slides 8: JNL Capital
Turning to JNL, our target economic capital requirement is at a similar level to the level of
capital currently used for achieved profits which is 235% of NAIC Risk Based Capital (ie the
Company Action Level).
Slide 9: Asia Capital
Moving onto Asia, our target economic requirement leads to a substantial increase in capital
requirements compared to the local statutory basis used for achieved profits. As with the UK,
shareholder capital is not required for with-profits business written into segregated life funds
since the estate covers economic capital requirements.
As you would expect, the target economic capital varies considerably between countries, but
in aggregate the level of capital happens to come out very close to the FGD level for Asia.
However, these funds have not been physically allocated to Asia and remain in central funds,
but the cost of the increased capital is fully reflected in the Asia embedded value.
Slide 10: Value of options and guarantees
Now to the second piece of the risk framework - options and guarantees.
These have two components of value – intrinsic value and time value. The intrinsic value
measures the value of the options and guarantees on the chosen valuation assumptions (i.e.
the extent to which they are ‘in the money’) and as I mentioned before our assumptions are
real-world ones. The time value on the other hand measures the additional value of the
options and guarantees that arises from changing future financial conditions.

EEV puts these two components of value in different places. Firstly, the intrinsic value at the
balance sheet date is captured in the basic embedded value calculation.
By contrast, the time value is reflected through modelling which captures the effect of
volatility. As I said before, what we have done is to undertake full stochastic modelling of the
value of in-force business and the difference between this value and the deterministic value
gives the time value of the options and guarantees.
The Monte Carlo simulations use assumptions that are consistent with the main embedded
value calculations, and which allow for available management actions and such features as
dynamic lapses. As far as the with-profits funds across the Group are concerned, the various
estates are sufficient to meet the cost of options and guarantees in all but the few most
extreme scenarios.
Slide 11: Options and Guarantees
The coverage of guarantees and options has been comprehensive. For JNL, we have
covered the minimum crediting rate guarantees for fixed annuities and the living and death
benefits on variable annuities, together with indexed linked annuities. The UK covers life fund
guarantees for declared bonuses and smoothing costs, together with pension and annuity
guarantees. In Asia we have covered with profit guarantees and guaranteed surrender values
where they exist.
The results show that the cost of Prudential’s exposure to guarantees and options based on
the approach required by the EEV principles is relatively small at £209m. This is a direct
result of the risk-based approach to management that I mentioned earlier. By ensuring that
the guarantees offered on our products are kept prudently low and by actively taking
advantage of the management actions open to us we are able to minimise our shareholder
exposures.
As with the UK and US operations, the exposure to options and guarantees in Asia is low at
£24m on the EEV basis. This reflects the fact that the majority of the guarantees are
contained within with-profits products which are supported by healthy estates. Don’t forget
that the intrinsic value is included in the basic embedded value.
Slide 12: Risk Discount Rates
Moving on now to the final piece of the risk jigsaw, namely risk discount rates.

These extracts from the EEV principles require that a company’s funding structure, for
example gearing, should not distort the valuation of the underlying business. They also
suggest the use of risk discount rates that vary between product groups and territories.
Slide 13: Risk Discount Rates
In order to reflect these requirements we have used a bottom up approach to derive the risk
discount rates for each major product group in each of our operations, using the formula
shown on the slide.
RDR = risk free rate + product specific beta × equity risk premium + 50bps margin
Your packs provide detailed information on the approach (and the appendix gives an example
calculation) so let me just focus on some key points.
The most important factors in the determination of the risk discount rate, and the area which
set us apart from some of the other approaches you have seen, is in the determination of the
product-specific beta.
We made a decision early on in the project to be as close to the Principles and Guidance as
we could. In particular, we interpret the section on risk discount rates to mean that they
should relate to the risks in the business being valued. Our approach involves looking at how
the projected profits from the business are impacted by changes in expected returns on the
different asset classes. We convert this into a relative rate of return, and the ratio tells us what
the beta should be. The greater the sensitivity of the product profit to asset returns, the higher
the beta and the risk discount rate.
Some products, such as the various forms of protection insurance, have very little exposure to
market risk. The assets are invested close to risk-free, and the liability risk is diversifiable. For
these products the beta will be low and so the risk discount rate will also be relatively low.
Other products, such as single premium bonds invested in equities, have a much greater
sensitivity to market returns and will have a higher discount rate. Finally, where a product is
backed by a high amount of capital this would tend to reduce the volatility of the overall
product cashflows.
Further, by linking in with the locked in economic capital and removing any options and
guarantees when deriving the risk discount rates the risk loop is completed in a coherent
fashion without any double counting.
The final, very important, point I would make here is that we do not view the risk discount rate
in an embedded value calculation as representing the Group’s cost of capital. The market

beta is for the market to decide and takes into account many other factors not relevant to the
in-force block, including franchise value, non-insurance businesses, market betas, and
general market sentiment. We view the risk discount rate as relating to the risks and
volatilities of the cashflows we have modelled in the Embedded Value which is why we have
chosen to use a bottom up approach to risk discount rates.
Slide 14: UK Annuity Risk Discount Rates
For UK annuity business which is closely matched there is limited equity market risk. The
main financial risks are actually credit risk and interest rate duration risk, which are more
difficult to capture using our main approach to calculating betas. We therefore considered
whether our existing achieved profits result made adequate allowance for these risks by using
objective market consistent techniques that make full allowance for double taxation and other
frictional costs of capital, as well as a liquidity premium reflecting the illiquid nature of the
liabilities. These have demonstrated that the achieved profits results do indeed make
sufficient allowance and so we have carried over the existing achieved profits basis.
Slide 15: Summary of Risk Discount Rates
This summary shows the average risk discount rates in each of our main businesses, and
how they compare to the risk discount rates used for achieved profits. I would stress here that
our approach is much more detailed than this slide might suggest. These averages have been
constructed to give a feel for how the overall risk discount rates have moved. For example,
you will recall from what I mentioned earlier that the underlying risk discount rates vary greatly
by type of business and territory, with linked and non-par business tending to have lower risk
discount rates than with-profits business.
Also, it is very important point to remember that the underlying options and guarantees on all
of our products have been valued explicitly. Under the more traditional achieved profits
framework, the discount rate is the primary mechanism where risk is captured. It will allow for
all risks relevant to the valuation of long-term business including volatility of cashflows and
options and guarantees. If we take that element of risk and capture it elsewhere as we do in
EEV we should expect discount rates to fall and that is what has happened.
We have given different risk discount rates for in force and new business, because the mix of
business is quite different between the two.
The risk discount rates used in the UK haven’t changed much. The new business rate is
actually slightly lower than the in-force rate, reflecting the shift of business away from with-
profits business.

In the US the in-force risk discount rate is driven mostly by Fixed Annuities. If, as we’re doing,
we value the options and guarantees separately, the profit stream on these products is pretty
stable, as we’re able to pass on much of the volatility to policyholders through the crediting
rate. A steady profit stream results in a lower beta and hence the lower risk discount rates
that we see here.
The rate we show here for Asia is a blend of 12 different countries, but really reflects the
largest ones – Taiwan, Singapore, Hong Kong, and Malaysia. As we’ve put through a
significant increase in the amount of capital against the Asian business, the risk discount
rates would be expected to come down quite a bit compared to achieved profits, and that is
what has happened. The difference between the in force and new business risk discount
rates is driven by a number of factors. New business has moved towards less risky bond-
backed unit linked, non-par and A&H business, which in many cases have a lower risk
discount rate. Offsetting this there is a greater contribution to new business from territories
traditionally associated with higher risk discount rates, such as Vietnam and Indonesia.
Finally, the Group’s weighted risk discount rate is about 7.2% for new business and 7.3% for
in-force business which, as you can see, is less than the achieved profits weighted rate of
7.8%.
This analysis does highlight the fact that is important not to look at risk discount rates in
isolation. Instead all 3 of the components of the risk framework - capital, options and
guarantees, and risk discount rates – should be considered together to gain an overall
understanding of the risk allowance. As Philip will now show you, the combined impact on the
EV of the 3 risk items we have discussed is broadly neutral.
[Hand over to Philip]
Slide 16: Reconciliation of Shareholder Funds
Turning now from principles to results, this slide shows you the main components of the
movement in embedded value from an achieved profits basis to an EEV basis. Overall the
Group’s total shareholders’ funds are little changed at £8.5bn.
Taking each item in turn.
We have taken the opportunity of the transition to EEV to revise our economic basis so that in
the UK, for example, we have increased the equity risk premium from 2.5% to 3%. However,
the aggregate impact of these changes is quite minor at £32m.

To re-iterate Andy’s final point, you will see that the combined impact of the three risk items –
capital, options and guarantees, and risk discount rates - is broadly neutral.
The economic capital item represents the increased cost of capital within Asia, following the
move to an economic capital basis. The cost of options and guarantees is about 3% of the
overall shareholder funds. This reflects the strength of our With-Profits funds and our ability to
manage bonuses and asset allocations to ensure their continuing solvency.
We have included value of fund management profits in the results, as required under EEV.
The value of £200m represents the present value of future profits arising from the asset
management of our insurance funds. The treatment of profits from third party funds
management still comes through on a cash basis as before.
The impact of service companies is minor at negative £7m.
We have also marked to market the Group’s core debt (both senior and subordinated) to
reflect any leverage that this generates in shareholder cashflows. This reduces value by
£193m.
The other item of negative £122m primarily represents some modelling changes necessary
for modelling in a stochastic world.
Slide 17: New Business Results
As for new business, you can see that the Group’s EEV new business profit for 2004 is higher
than the achieved profits result by £53m with both the UK and Asia showing an increase in
new business profits whilst JNL shows a decrease. Looking now at the new business margin
on an APE basis, this increases by 3 percentage points to 40% On the new PV of premiums
basis the EEV margin is 5.0%. The reasons underlying these changes are shown in the next
slide.
Incidentally, we will continue to report margin on an APE basis as we believe that is a useful
metric. Alongside that we will, of course, provide the EEV margin.
Slide 18: Reconciliation of NB Profits
This analyses the movement in new business value in the same way that was done for the
embedded value.
As you will see there are a number of factors contributing to the movement in new business
profits.

Once more, the changed economic assumptions have very little impact.
Secondly, the change in risk discount rate impact is greater than the time value of options and
guarantees as is to be expected given the mix of new business that we currently have which
has relatively little in the way of options and guarantees. And unlike for the embedded value,
there is no impact from the use of economic capital. The reason for this is that, for our current
mix of new business, the statutory requirements used in the achieved profits calculation are
sufficient to meet our current assessment of economic capital requirements in each business
unit including Asia where we now write predominantly linked, non-par and A&H business.
In the middle of the chart on the right hand side there is an item that relates specifically to JNL
– an uplift from variable annuity fees and benefits of £24m. Previously, under achieved profits
reporting the fees relating to guaranteed benefits on VA products were not recognised on the
assumption that they were broadly similar to the expected value of claims (which are options
and don’t come through explicitly in achieved profits) and thus had limited net impact.
However, under EEV, now that the cost of options and guarantees is valued separately these
fees can also be valued explicitly, so this is what we have done. Currently the value of fees is
greater than the value of the guarantees, so there is a net uplift in value.
The inclusion of the fund management business adds £17m to the new business result.
Finally, and also related to JNL, we have taken the opportunity of the transition to EEV to
simplify the basis on which we gross up JNL’s result for tax which results in a reduction of
£28m. The new method simply grosses up the net numbers at the expected tax rate but there
is no economic impact from this presentational change. In particular, there is no impact on the
Group’s shareholder funds since this is already on an after-tax basis.
As with the shareholder funds we do have some modelling changes and these reduce new
business profits by £18m.
You can now see how our overall approach allows us a better insight into the risks of
individual products and territories, and also how it keeps up with the changing risk profile of
the company. From changes to capital levels to changes in risk discount rates we are able to
better analyse the drivers of value for our businesses. For example, if we sell low-risk
business, it may have lower expected profits but we would also discount at a low rate. If we
move into higher risk business in search of higher returns, they will attract a higher risk
discount rate as well
You will find greater detail for each business unit in the appendix to these slides so I will not
go into this.
Slide 19: Long-term business result
Here we can see the full comparison of our Long Term Operating Profit under EEV against
the same on an Achieved Profits basis. The top half shows that the long-term result increases
by 8% to £1,238m. We have already looked at new business so let us focus on the in-force
result.
Most of the increase in operating profit is due to higher expected investment income on the
economic capital. Though we don’t physically allocate any extra capital to Asia, to be
consistent with the economic capital approach we need to attribute the investment income on
this capital to Asia. The reverse of this is that shareholder income on central Group funds is
correspondingly reduced.
Other drivers include changed unwind amounts stemming from the new risk discount rates,
and the contribution from fund management profits.
Slide 20: Long-term business result after IFRS
Finally we bring through the adjustments resulting from the move to IFRS and other
discretionary changes. As David took you through earlier, the main adjustment is due to the
removal of the 5-year smoothing of bond returns in JNL. This increases the long-term
business operating profit by £101m in total.
Slide 21: Summary
So, in summary ladies and gentlemen, the adoption of EEV for Prudential results in limited
aggregate changes, although the approach in respect of the three key areas – capital, options
and guarantees, and risk discount rates – is more sophisticated than the traditional achieved
profits approach.
We welcome the introduction of the EEV framework across Europe and we hope that it
enable better comparison of companies’ performance and approach to capital management.
As we have demonstrated today it confirms the significant value of Prudential’s businesses.
With that ladies and gentlemen I conclude the presentation. Andy and I would be happy to
take any questions that you may have.

Conclusion
In drawing things to a close I would like to make a few comments about where we see things
headed over the next few years. The model on this slide shows one possible framework.
I hope that we have given you some insight today into our views of the group's capital position
and the work we have done behind the scenes to develop our approach to economic capital.
We believe that this approach will deliver real benefits to the group over time in terms of
capital efficiency.
Over the next few years we will see an increasing linkage between our internal management
techniques and the external reporting we provide to regulators and investors as there is
increasing convergence around economic capital models.
But for the moment we have to consider separately regulatory, economic and ratings capital --
striking a balance between them.
Internally capital allocation and risk management will also increasingly be based on economic
capital models. I also expect economic capital to form part of our financial reporting -- at least
in the OFR -- in addition to the measures on which we currently report.
It's been a long morning: for those who have stayed the course we have a small, and fitting,
memento of the occasion. Before we hand them out Andy and I will be happy to take your
questions on EEV or any of the other topics from the course of the morning. Thank you.